Cities with the Largest Sierra Leonean Community in the United States
RELATED REPORTS & OPTIONS
Sierra Leonean
United States
Compare Cities
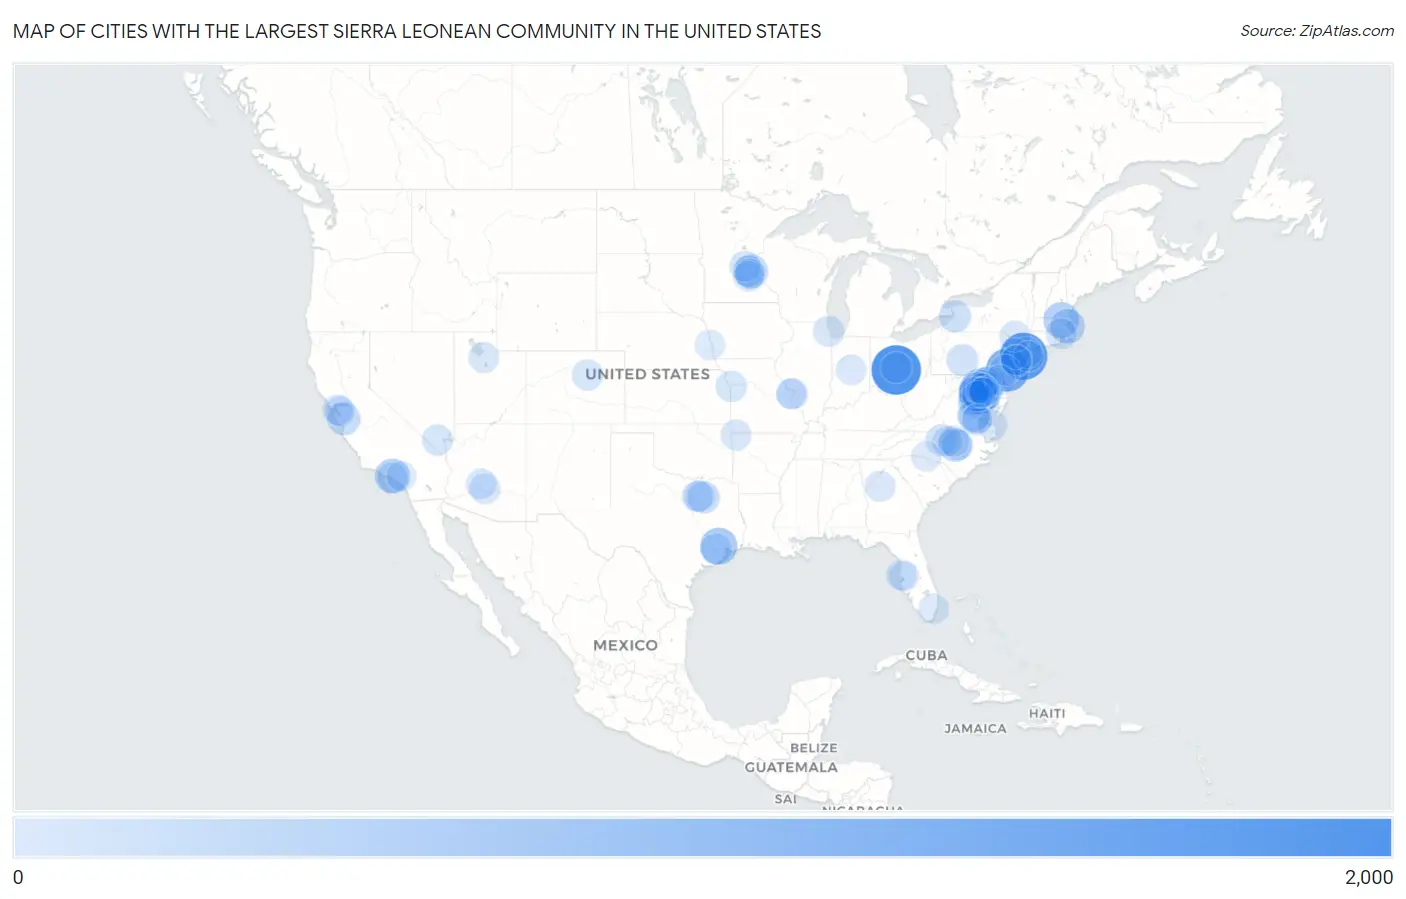
Map of Cities with the Largest Sierra Leonean Community in the United States
0
2,000
Cities with the Largest Sierra Leonean Community in the United States
| City | Sierra Leonean | vs State | vs National | |
| 1. | Columbus | 1,538 | 2,040(75.39%)#1 | 34,407(4.47%)#1 |
| 2. | New York | 1,355 | 2,187(61.96%)#1 | 34,407(3.94%)#2 |
| 3. | Philadelphia | 1,039 | 2,805(37.04%)#1 | 34,407(3.02%)#3 |
| 4. | Hybla Valley | 1,003 | 5,894(17.02%)#1 | 34,407(2.92%)#4 |
| 5. | Alexandria | 892 | 5,894(15.13%)#2 | 34,407(2.59%)#5 |
| 6. | Houston | 580 | 2,392(24.25%)#1 | 34,407(1.69%)#6 |
| 7. | Lowell | 476 | 1,230(38.70%)#1 | 34,407(1.38%)#7 |
| 8. | Bowie | 467 | 6,354(7.35%)#1 | 34,407(1.36%)#8 |
| 9. | Los Angeles | 438 | 1,786(24.52%)#1 | 34,407(1.27%)#9 |
| 10. | Lake Arbor | 430 | 6,354(6.77%)#2 | 34,407(1.25%)#10 |
| 11. | Columbia | 403 | 6,354(6.34%)#3 | 34,407(1.17%)#11 |
| 12. | Boston | 398 | 1,230(32.36%)#2 | 34,407(1.16%)#12 |
| 13. | Seabrook | 390 | 6,354(6.14%)#4 | 34,407(1.13%)#13 |
| 14. | New Brighton | 333 | 894(37.25%)#1 | 34,407(0.97%)#14 |
| 15. | Dale City | 329 | 5,894(5.58%)#3 | 34,407(0.96%)#15 |
| 16. | Morrisville | 312 | 1,058(29.49%)#1 | 34,407(0.91%)#16 |
| 17. | San Jose | 289 | 1,786(16.18%)#2 | 34,407(0.84%)#17 |
| 18. | Sharon Hill Borough | 278 | 2,805(9.91%)#2 | 34,407(0.81%)#18 |
| 19. | Washington | 277 | 277(100.00%)#1 | 34,407(0.81%)#19 |
| 20. | Waldorf | 270 | 6,354(4.25%)#5 | 34,407(0.78%)#20 |
| 21. | Reston | 264 | 5,894(4.48%)#4 | 34,407(0.77%)#21 |
| 22. | Glenn Dale | 252 | 6,354(3.97%)#6 | 34,407(0.73%)#22 |
| 23. | Essex | 248 | 6,354(3.90%)#7 | 34,407(0.72%)#23 |
| 24. | Fairland | 242 | 6,354(3.81%)#8 | 34,407(0.70%)#24 |
| 25. | Woodbridge | 241 | 5,894(4.09%)#5 | 34,407(0.70%)#25 |
| 26. | Richmond | 226 | 5,894(3.83%)#6 | 34,407(0.66%)#26 |
| 27. | Travis Ranch | 226 | 2,392(9.45%)#2 | 34,407(0.66%)#27 |
| 28. | Lackawanna | 220 | 2,187(10.06%)#2 | 34,407(0.64%)#28 |
| 29. | Lorton | 202 | 5,894(3.43%)#7 | 34,407(0.59%)#29 |
| 30. | Greenwood | 191 | 2,805(6.81%)#3 | 34,407(0.56%)#30 |
| 31. | Stafford Courthouse | 186 | 5,894(3.16%)#8 | 34,407(0.54%)#31 |
| 32. | Fredericksburg | 180 | 5,894(3.05%)#9 | 34,407(0.52%)#32 |
| 33. | Maryland City | 176 | 6,354(2.77%)#9 | 34,407(0.51%)#33 |
| 34. | Meadowbrook | 174 | 5,894(2.95%)#10 | 34,407(0.51%)#34 |
| 35. | Germantown | 173 | 6,354(2.72%)#10 | 34,407(0.50%)#35 |
| 36. | Mount Vernon | 163 | 2,187(7.45%)#3 | 34,407(0.47%)#36 |
| 37. | Mission Bend | 162 | 2,392(6.77%)#3 | 34,407(0.47%)#37 |
| 38. | Greensboro | 154 | 1,058(14.56%)#2 | 34,407(0.45%)#38 |
| 39. | Aldan Borough | 154 | 2,805(5.49%)#4 | 34,407(0.45%)#39 |
| 40. | Dallas | 153 | 2,392(6.40%)#4 | 34,407(0.44%)#40 |
| 41. | Yeadon Borough | 153 | 2,805(5.45%)#5 | 34,407(0.44%)#41 |
| 42. | Brooklyn Park | 152 | 894(17.00%)#2 | 34,407(0.44%)#42 |
| 43. | Franklin Park | 152 | 2,158(7.04%)#1 | 34,407(0.44%)#43 |
| 44. | Largo | 151 | 6,354(2.38%)#11 | 34,407(0.44%)#44 |
| 45. | Spring Valley | 150 | 160(93.75%)#1 | 34,407(0.44%)#45 |
| 46. | Leesylvania | 150 | 5,894(2.54%)#11 | 34,407(0.44%)#46 |
| 47. | Travilah | 150 | 6,354(2.36%)#12 | 34,407(0.44%)#47 |
| 48. | Kansas City | 147 | 467(31.48%)#1 | 34,407(0.43%)#48 |
| 49. | Aurora | 145 | 199(72.86%)#1 | 34,407(0.42%)#49 |
| 50. | Westerville | 145 | 2,040(7.11%)#2 | 34,407(0.42%)#50 |
| 51. | North Laurel | 142 | 6,354(2.23%)#13 | 34,407(0.41%)#51 |
| 52. | Succasunna | 140 | 2,158(6.49%)#2 | 34,407(0.41%)#52 |
| 53. | Evanston | 139 | 227(61.23%)#1 | 34,407(0.40%)#53 |
| 54. | Drexel Hill | 138 | 2,805(4.92%)#6 | 34,407(0.40%)#54 |
| 55. | Pawtucket | 135 | 154(87.66%)#1 | 34,407(0.39%)#55 |
| 56. | Woodlawn Cdp Prince George S County | 133 | 6,354(2.09%)#14 | 34,407(0.39%)#56 |
| 57. | Irving | 131 | 2,392(5.48%)#5 | 34,407(0.38%)#57 |
| 58. | Elk River | 131 | 894(14.65%)#3 | 34,407(0.38%)#58 |
| 59. | Calverton | 131 | 6,354(2.06%)#15 | 34,407(0.38%)#59 |
| 60. | Bentonville | 130 | 139(93.53%)#1 | 34,407(0.38%)#60 |
| 61. | Raleigh | 126 | 1,058(11.91%)#3 | 34,407(0.37%)#61 |
| 62. | Chandler | 123 | 247(49.80%)#1 | 34,407(0.36%)#62 |
| 63. | Loch Sheldrake | 122 | 2,187(5.58%)#4 | 34,407(0.35%)#63 |
| 64. | St Louis | 119 | 467(25.48%)#2 | 34,407(0.35%)#64 |
| 65. | Durham | 119 | 1,058(11.25%)#4 | 34,407(0.35%)#65 |
| 66. | West Valley City | 118 | 150(78.67%)#1 | 34,407(0.34%)#66 |
| 67. | Hawthorne | 118 | 1,786(6.61%)#3 | 34,407(0.34%)#67 |
| 68. | Mcdonough | 118 | 979(12.05%)#1 | 34,407(0.34%)#68 |
| 69. | Newington Forest | 117 | 5,894(1.99%)#12 | 34,407(0.34%)#69 |
| 70. | Centreville | 115 | 5,894(1.95%)#13 | 34,407(0.33%)#70 |
| 71. | Chillum | 115 | 6,354(1.81%)#16 | 34,407(0.33%)#71 |
| 72. | Baltimore | 113 | 6,354(1.78%)#17 | 34,407(0.33%)#72 |
| 73. | Bloomington | 112 | 894(12.53%)#4 | 34,407(0.33%)#73 |
| 74. | Fort Lee | 110 | 5,894(1.87%)#14 | 34,407(0.32%)#74 |
| 75. | Potomac | 106 | 6,354(1.67%)#18 | 34,407(0.31%)#75 |
| 76. | Landover | 105 | 6,354(1.65%)#19 | 34,407(0.31%)#76 |
| 77. | Manassas | 104 | 5,894(1.76%)#15 | 34,407(0.30%)#77 |
| 78. | Middletown | 103 | 251(41.04%)#1 | 34,407(0.30%)#78 |
| 79. | Hempstead | 102 | 2,187(4.66%)#5 | 34,407(0.30%)#79 |
| 80. | Phoenix | 101 | 247(40.89%)#2 | 34,407(0.29%)#80 |
| 81. | Oakland | 100 | 1,786(5.60%)#4 | 34,407(0.29%)#81 |
| 82. | University City | 99 | 467(21.20%)#3 | 34,407(0.29%)#82 |
| 83. | Norfolk | 98 | 5,894(1.66%)#16 | 34,407(0.28%)#83 |
| 84. | Castro Valley | 96 | 1,786(5.38%)#5 | 34,407(0.28%)#84 |
| 85. | Graham | 95 | 1,058(8.98%)#5 | 34,407(0.28%)#85 |
| 86. | Carmel | 92 | 261(35.25%)#1 | 34,407(0.27%)#86 |
| 87. | Marlboro Village | 91 | 6,354(1.43%)#20 | 34,407(0.26%)#87 |
| 88. | Miramar | 90 | 610(14.75%)#1 | 34,407(0.26%)#88 |
| 89. | Somerset | 90 | 2,158(4.17%)#3 | 34,407(0.26%)#89 |
| 90. | Minneapolis | 89 | 894(9.96%)#5 | 34,407(0.26%)#90 |
| 91. | Westchase | 89 | 610(14.59%)#2 | 34,407(0.26%)#91 |
| 92. | Hopewell | 89 | 5,894(1.51%)#17 | 34,407(0.26%)#92 |
| 93. | Cherry Hill | 88 | 5,894(1.49%)#18 | 34,407(0.26%)#93 |
| 94. | Fort Washington | 86 | 6,354(1.35%)#21 | 34,407(0.25%)#94 |
| 95. | Rosaryville | 86 | 6,354(1.35%)#22 | 34,407(0.25%)#95 |
| 96. | Collingdale Borough | 85 | 2,805(3.03%)#7 | 34,407(0.25%)#96 |
| 97. | Charlotte | 83 | 1,058(7.84%)#6 | 34,407(0.24%)#97 |
| 98. | Diamond Bar | 82 | 1,786(4.59%)#6 | 34,407(0.24%)#98 |
| 99. | Tampa | 80 | 610(13.11%)#3 | 34,407(0.23%)#99 |
| 100. | Omaha | 79 | 79(100.00%)#1 | 34,407(0.23%)#100 |
Common Questions
What are the Top 10 Cities with the Largest Sierra Leonean Community in the United States?
Top 10 Cities with the Largest Sierra Leonean Community in the United States are:
#1
1,538
#2
1,355
#3
1,039
#4
1,003
#5
892
#6
580
#7
476
#8
467
#9
438
#10
430
What city has the Largest Sierra Leonean Community in the United States?
Columbus has the Largest Sierra Leonean Community in the United States with 1,538.
What is the Total Sierra Leonean Population in the United States?
Total Sierra Leonean Population in the United States is 34,407.