Napili Honokowai, HI Map & Demographics
Napili Honokowai Map
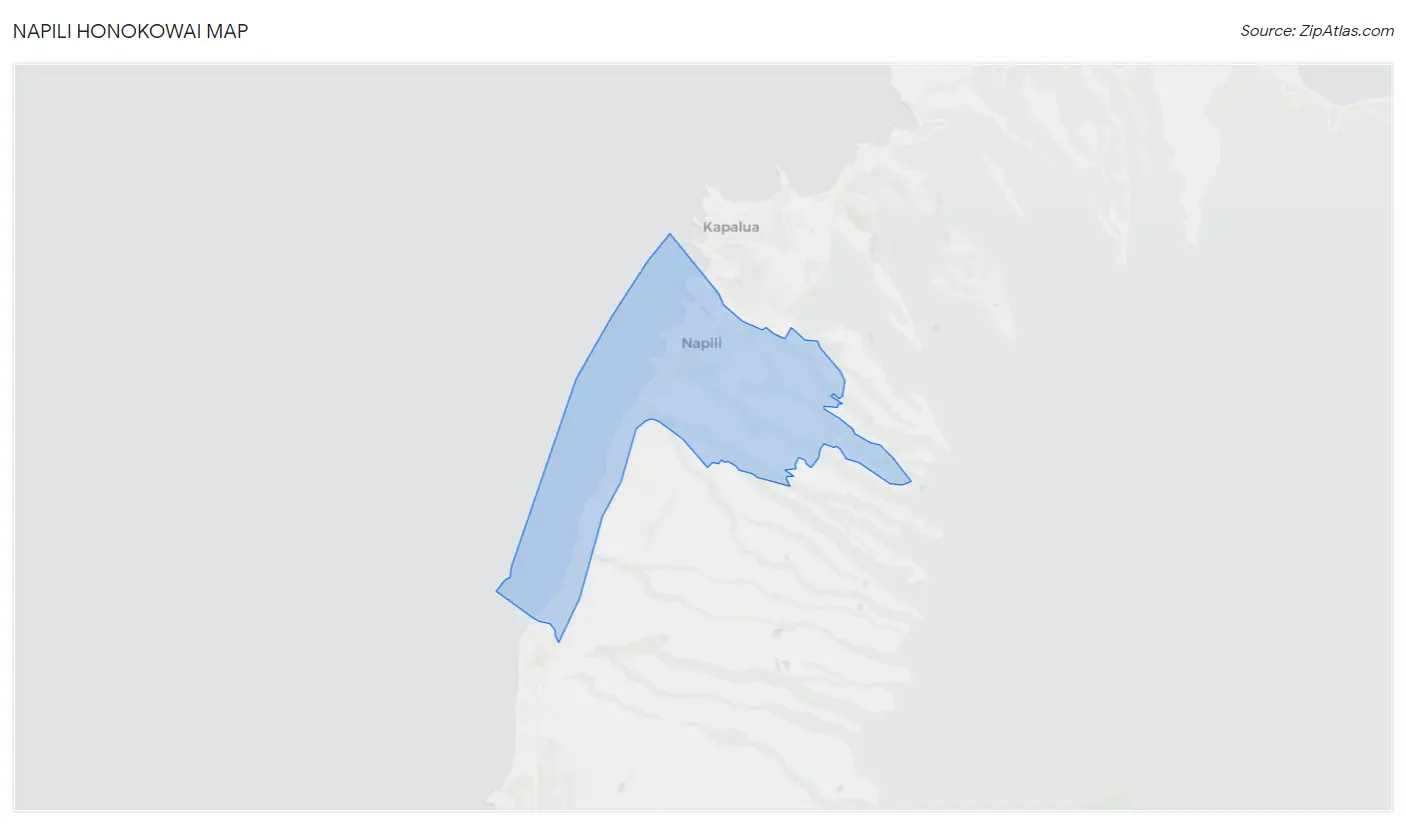
Napili Honokowai Overview
$60,258
PER CAPITA INCOME
$114,438
AVG FAMILY INCOME
$101,939
AVG HOUSEHOLD INCOME
10.8%
WAGE / INCOME GAP [ % ]
89.2¢/ $1
WAGE / INCOME GAP [ $ ]
$5,071
FAMILY INCOME DEFICIT
0.55
INEQUALITY / GINI INDEX
6,779
TOTAL POPULATION
3,312
MALE POPULATION
3,467
FEMALE POPULATION
95.53
MALES / 100 FEMALES
104.68
FEMALES / 100 MALES
39.5
MEDIAN AGE
3.4
AVG FAMILY SIZE
2.9
AVG HOUSEHOLD SIZE
4,310
LABOR FORCE [ PEOPLE ]
77.9%
PERCENT IN LABOR FORCE
7.1%
UNEMPLOYMENT RATE
Income in Napili Honokowai
Income Overview in Napili Honokowai
Per Capita Income in Napili Honokowai is $60,258, while median incomes of families and households are $114,438 and $101,939 respectively.
| Characteristic | Number | Measure |
| Per Capita Income | 6,779 | $60,258 |
| Median Family Income | 1,607 | $114,438 |
| Mean Family Income | 1,607 | $197,427 |
| Median Household Income | 2,352 | $101,939 |
| Mean Household Income | 2,352 | $164,363 |
| Income Deficit | 1,607 | $5,071 |
| Wage / Income Gap (%) | 6,779 | 10.84% |
| Wage / Income Gap ($) | 6,779 | 89.16¢ per $1 |
| Gini / Inequality Index | 6,779 | 0.55 |
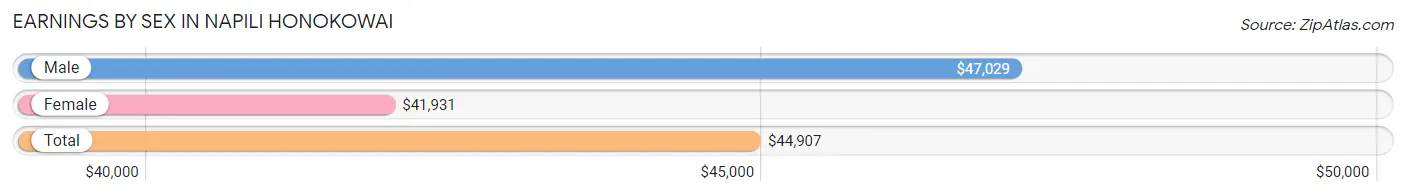
Earnings by Sex in Napili Honokowai
Average Earnings in Napili Honokowai are $44,907, $47,029 for men and $41,931 for women, a difference of 10.8%.
| Sex | Number | Average Earnings |
| Male | 2,199 (49.7%) | $47,029 |
| Female | 2,229 (50.3%) | $41,931 |
| Total | 4,428 (100.0%) | $44,907 |
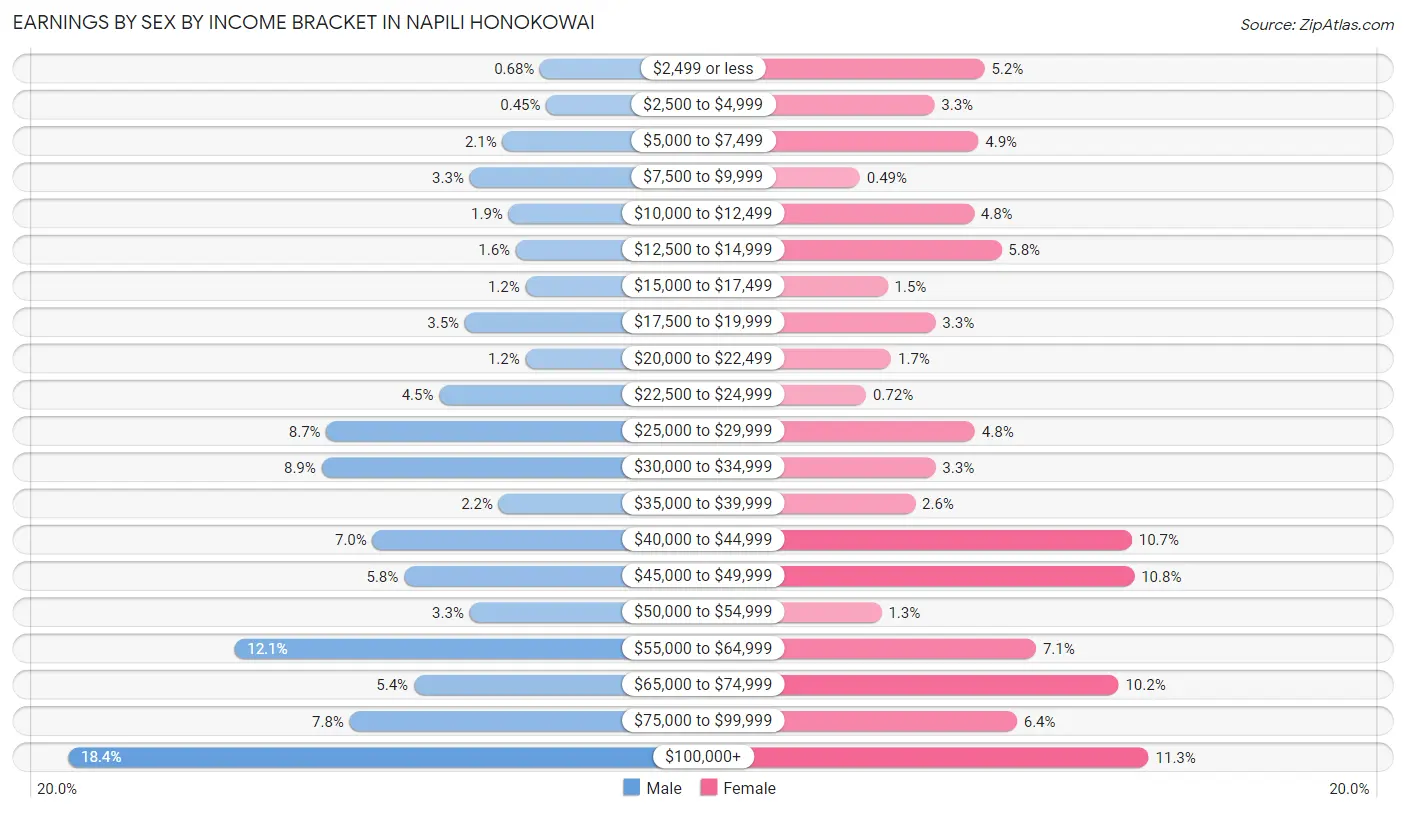
Earnings by Sex by Income Bracket in Napili Honokowai
The most common earnings brackets in Napili Honokowai are $100,000+ for men (404 | 18.4%) and $100,000+ for women (252 | 11.3%).
| Income | Male | Female |
| $2,499 or less | 15 (0.7%) | 115 (5.2%) |
| $2,500 to $4,999 | 10 (0.4%) | 73 (3.3%) |
| $5,000 to $7,499 | 46 (2.1%) | 110 (4.9%) |
| $7,500 to $9,999 | 73 (3.3%) | 11 (0.5%) |
| $10,000 to $12,499 | 41 (1.9%) | 106 (4.8%) |
| $12,500 to $14,999 | 35 (1.6%) | 129 (5.8%) |
| $15,000 to $17,499 | 27 (1.2%) | 34 (1.5%) |
| $17,500 to $19,999 | 77 (3.5%) | 74 (3.3%) |
| $20,000 to $22,499 | 27 (1.2%) | 37 (1.7%) |
| $22,500 to $24,999 | 98 (4.5%) | 16 (0.7%) |
| $25,000 to $29,999 | 191 (8.7%) | 107 (4.8%) |
| $30,000 to $34,999 | 195 (8.9%) | 74 (3.3%) |
| $35,000 to $39,999 | 49 (2.2%) | 57 (2.6%) |
| $40,000 to $44,999 | 153 (7.0%) | 238 (10.7%) |
| $45,000 to $49,999 | 127 (5.8%) | 240 (10.8%) |
| $50,000 to $54,999 | 73 (3.3%) | 29 (1.3%) |
| $55,000 to $64,999 | 267 (12.1%) | 158 (7.1%) |
| $65,000 to $74,999 | 119 (5.4%) | 227 (10.2%) |
| $75,000 to $99,999 | 172 (7.8%) | 142 (6.4%) |
| $100,000+ | 404 (18.4%) | 252 (11.3%) |
| Total | 2,199 (100.0%) | 2,229 (100.0%) |
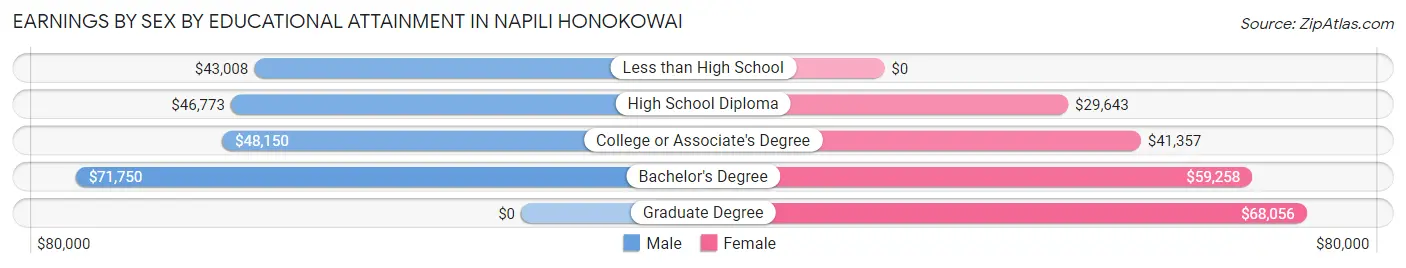
Earnings by Sex by Educational Attainment in Napili Honokowai
Average earnings in Napili Honokowai are $50,125 for men and $45,203 for women, a difference of 9.8%. Men with an educational attainment of bachelor's degree enjoy the highest average annual earnings of $71,750, while those with less than high school education earn the least with $43,008. Women with an educational attainment of graduate degree earn the most with the average annual earnings of $68,056, while those with high school diploma education have the smallest earnings of $29,643.
| Educational Attainment | Male Income | Female Income |
| Less than High School | $43,008 | $0 |
| High School Diploma | $46,773 | $29,643 |
| College or Associate's Degree | $48,150 | $41,357 |
| Bachelor's Degree | $71,750 | $59,258 |
| Graduate Degree | - | - |
| Total | $50,125 | $45,203 |
Family Income in Napili Honokowai
Family Income Brackets in Napili Honokowai
According to the Napili Honokowai family income data, there are 391 families falling into the $100,000 to $149,999 income range, which is the most common income bracket and makes up 24.3% of all families. Conversely, the $10,000 to $14,999 income bracket is the least frequent group with only 14 families (0.9%) belonging to this category.
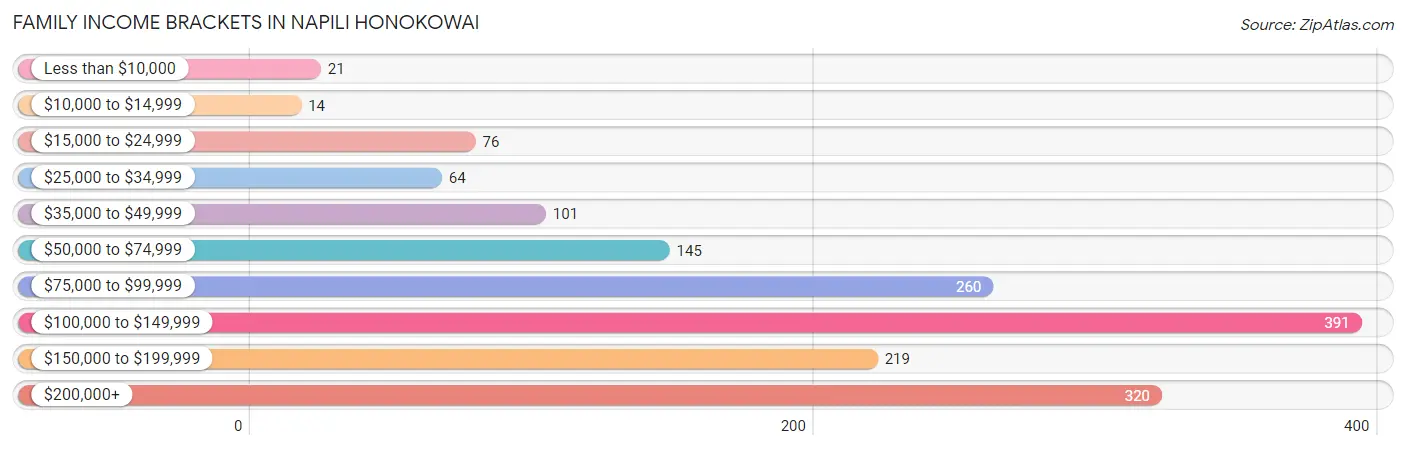
| Income Bracket | # Families | % Families |
| Less than $10,000 | 21 | 1.3% |
| $10,000 to $14,999 | 14 | 0.9% |
| $15,000 to $24,999 | 76 | 4.7% |
| $25,000 to $34,999 | 64 | 4.0% |
| $35,000 to $49,999 | 101 | 6.3% |
| $50,000 to $74,999 | 145 | 9.0% |
| $75,000 to $99,999 | 260 | 16.2% |
| $100,000 to $149,999 | 391 | 24.3% |
| $150,000 to $199,999 | 219 | 13.6% |
| $200,000+ | 320 | 19.9% |
Family Income by Famaliy Size in Napili Honokowai
4-person families (180 | 11.2%) account for the highest median family income in Napili Honokowai with $186,042 per family, while 2-person families (773 | 48.1%) have the highest median income of $50,360 per family member.
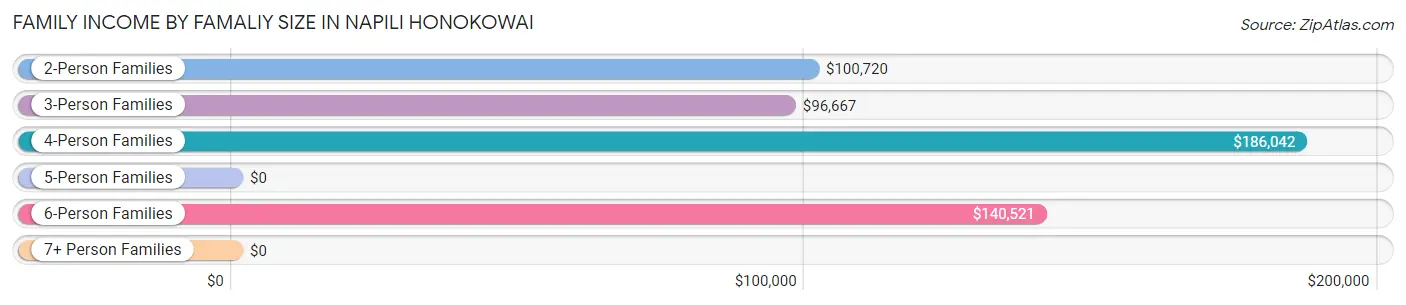
| Income Bracket | # Families | Median Income |
| 2-Person Families | 773 (48.1%) | $100,720 |
| 3-Person Families | 412 (25.6%) | $96,667 |
| 4-Person Families | 180 (11.2%) | $186,042 |
| 5-Person Families | 113 (7.0%) | $0 |
| 6-Person Families | 51 (3.2%) | $140,521 |
| 7+ Person Families | 78 (4.9%) | $0 |
| Total | 1,607 (100.0%) | $114,438 |
Family Income by Number of Earners in Napili Honokowai
The median family income in Napili Honokowai is $114,438, with families comprising 3+ earners (260) having the highest median family income of $178,971, while families with no earners (51) have the lowest median family income of $32,250, accounting for 16.2% and 3.2% of families, respectively.
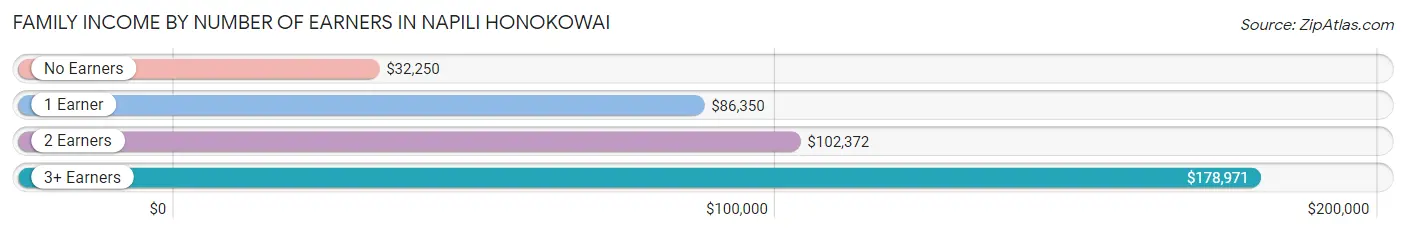
| Number of Earners | # Families | Median Income |
| No Earners | 51 (3.2%) | $32,250 |
| 1 Earner | 473 (29.4%) | $86,350 |
| 2 Earners | 823 (51.2%) | $102,372 |
| 3+ Earners | 260 (16.2%) | $178,971 |
| Total | 1,607 (100.0%) | $114,438 |
Household Income in Napili Honokowai
Household Income Brackets in Napili Honokowai
With 522 households falling in the category, the $100,000 to $149,999 income range is the most frequent in Napili Honokowai, accounting for 22.2% of all households. In contrast, only 64 households (2.7%) fall into the less than $10,000 income bracket, making it the least populous group.
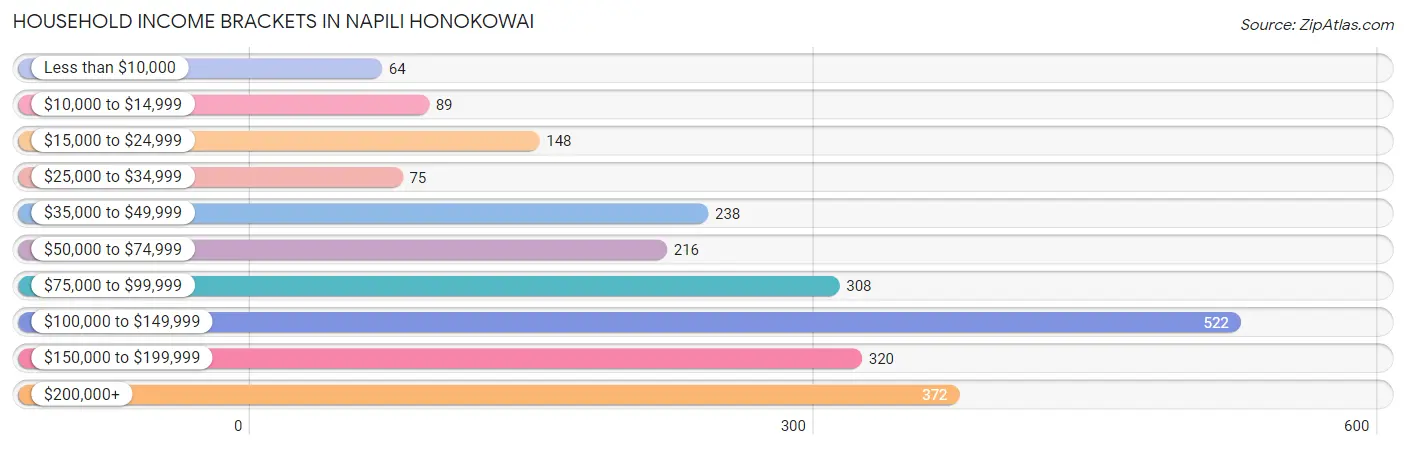
| Income Bracket | # Households | % Households |
| Less than $10,000 | 64 | 2.7% |
| $10,000 to $14,999 | 89 | 3.8% |
| $15,000 to $24,999 | 148 | 6.3% |
| $25,000 to $34,999 | 75 | 3.2% |
| $35,000 to $49,999 | 238 | 10.1% |
| $50,000 to $74,999 | 216 | 9.2% |
| $75,000 to $99,999 | 308 | 13.1% |
| $100,000 to $149,999 | 522 | 22.2% |
| $150,000 to $199,999 | 320 | 13.6% |
| $200,000+ | 372 | 15.8% |
Household Income by Householder Age in Napili Honokowai
The median household income in Napili Honokowai is $101,939, with the highest median household income of $124,511 found in the 25 to 44 years age bracket for the primary householder. A total of 785 households (33.4%) fall into this category. Meanwhile, the 15 to 24 years age bracket for the primary householder has the lowest median household income of $0, with 18 households (0.8%) in this group.
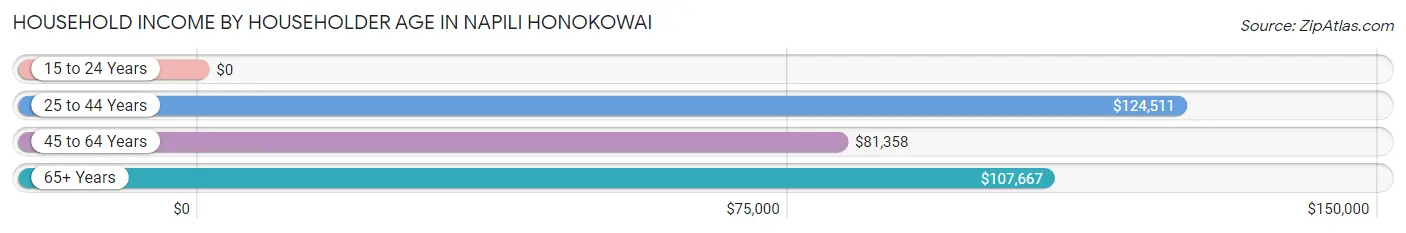
| Income Bracket | # Households | Median Income |
| 15 to 24 Years | 18 (0.8%) | $0 |
| 25 to 44 Years | 785 (33.4%) | $124,511 |
| 45 to 64 Years | 909 (38.7%) | $81,358 |
| 65+ Years | 640 (27.2%) | $107,667 |
| Total | 2,352 (100.0%) | $101,939 |
Poverty in Napili Honokowai
Income Below Poverty by Sex and Age in Napili Honokowai
With 5.3% poverty level for males and 9.8% for females among the residents of Napili Honokowai, 45 to 54 year old males and 18 to 24 year old females are the most vulnerable to poverty, with 101 males (22.6%) and 45 females (24.1%) in their respective age groups living below the poverty level.
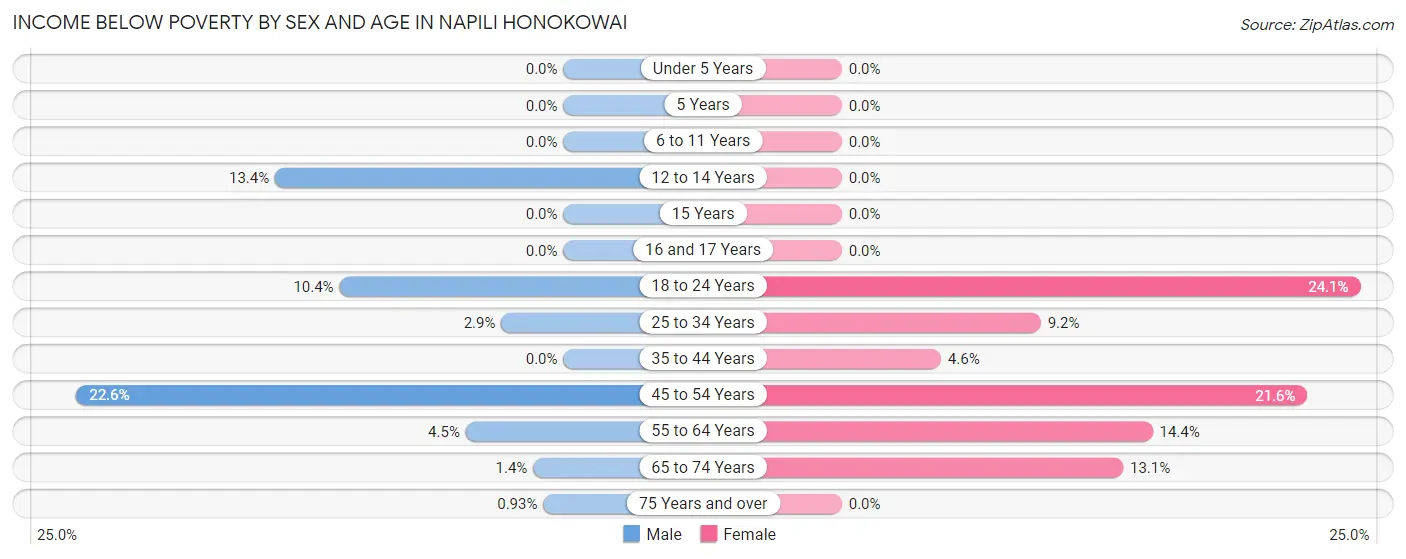
| Age Bracket | Male | Female |
| Under 5 Years | 0 (0.0%) | 0 (0.0%) |
| 5 Years | 0 (0.0%) | 0 (0.0%) |
| 6 to 11 Years | 0 (0.0%) | 0 (0.0%) |
| 12 to 14 Years | 19 (13.4%) | 0 (0.0%) |
| 15 Years | 0 (0.0%) | 0 (0.0%) |
| 16 and 17 Years | 0 (0.0%) | 0 (0.0%) |
| 18 to 24 Years | 16 (10.4%) | 45 (24.1%) |
| 25 to 34 Years | 15 (2.9%) | 53 (9.2%) |
| 35 to 44 Years | 0 (0.0%) | 27 (4.6%) |
| 45 to 54 Years | 101 (22.6%) | 92 (21.6%) |
| 55 to 64 Years | 19 (4.5%) | 60 (14.4%) |
| 65 to 74 Years | 5 (1.4%) | 62 (13.1%) |
| 75 Years and over | 1 (0.9%) | 0 (0.0%) |
| Total | 176 (5.3%) | 339 (9.8%) |
Income Above Poverty by Sex and Age in Napili Honokowai
According to the poverty statistics in Napili Honokowai, males aged under 5 years and females aged under 5 years are the age groups that are most secure financially, with 100.0% of males and 100.0% of females in these age groups living above the poverty line.
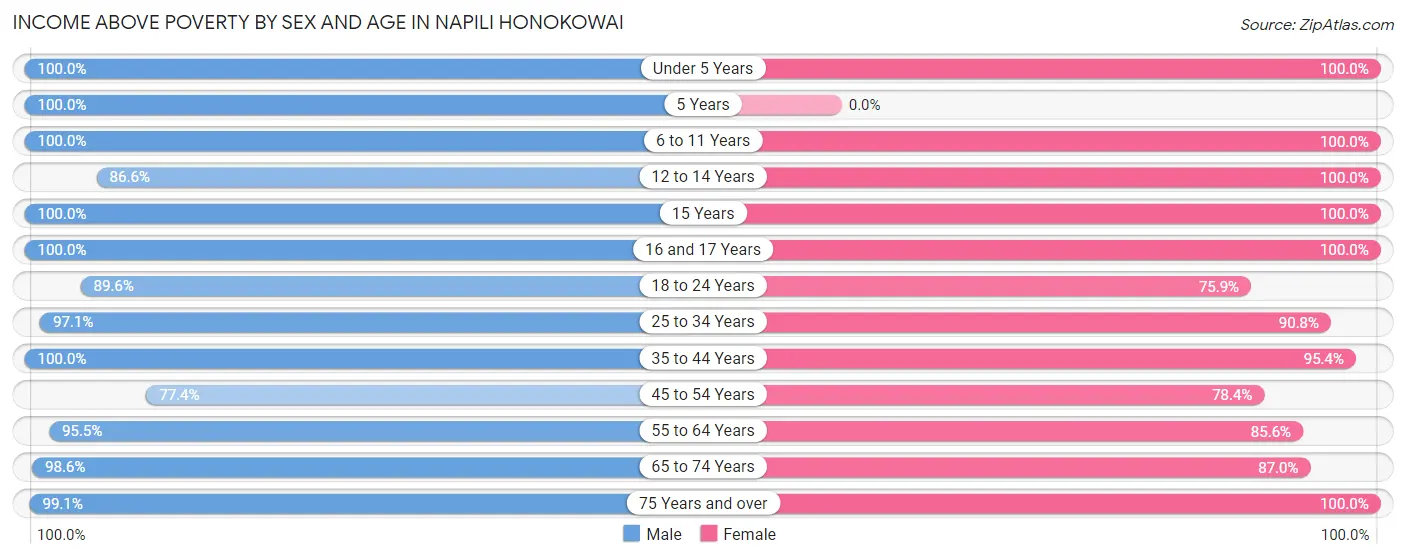
| Age Bracket | Male | Female |
| Under 5 Years | 205 (100.0%) | 216 (100.0%) |
| 5 Years | 88 (100.0%) | 0 (0.0%) |
| 6 to 11 Years | 170 (100.0%) | 264 (100.0%) |
| 12 to 14 Years | 123 (86.6%) | 85 (100.0%) |
| 15 Years | 50 (100.0%) | 26 (100.0%) |
| 16 and 17 Years | 93 (100.0%) | 84 (100.0%) |
| 18 to 24 Years | 138 (89.6%) | 142 (75.9%) |
| 25 to 34 Years | 506 (97.1%) | 521 (90.8%) |
| 35 to 44 Years | 557 (100.0%) | 560 (95.4%) |
| 45 to 54 Years | 346 (77.4%) | 334 (78.4%) |
| 55 to 64 Years | 400 (95.5%) | 356 (85.6%) |
| 65 to 74 Years | 353 (98.6%) | 413 (87.0%) |
| 75 Years and over | 107 (99.1%) | 127 (100.0%) |
| Total | 3,136 (94.7%) | 3,128 (90.2%) |
Income Below Poverty Among Married-Couple Families in Napili Honokowai
The poverty statistics for married-couple families in Napili Honokowai show that 5.9% or 59 of the total 1,006 families live below the poverty line. Families with no children have the highest poverty rate of 7.9%, comprising of 59 families. On the other hand, families with 1 or 2 children have the lowest poverty rate of 0.0%, which includes 0 families.
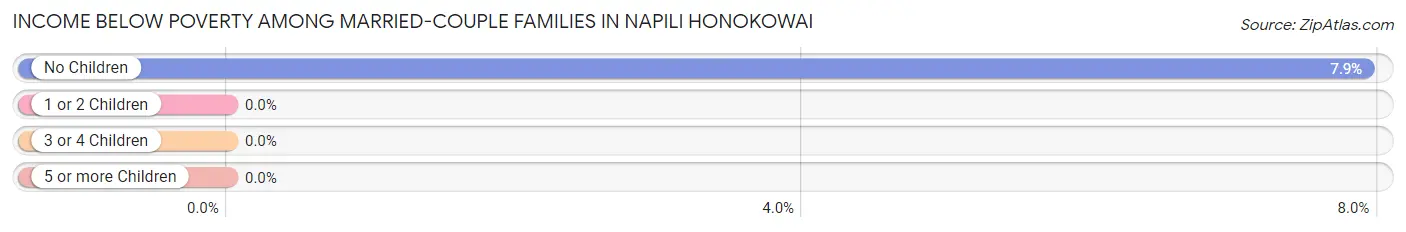
| Children | Above Poverty | Below Poverty |
| No Children | 687 (92.1%) | 59 (7.9%) |
| 1 or 2 Children | 174 (100.0%) | 0 (0.0%) |
| 3 or 4 Children | 33 (100.0%) | 0 (0.0%) |
| 5 or more Children | 53 (100.0%) | 0 (0.0%) |
| Total | 947 (94.1%) | 59 (5.9%) |
Income Below Poverty Among Single-Parent Households in Napili Honokowai
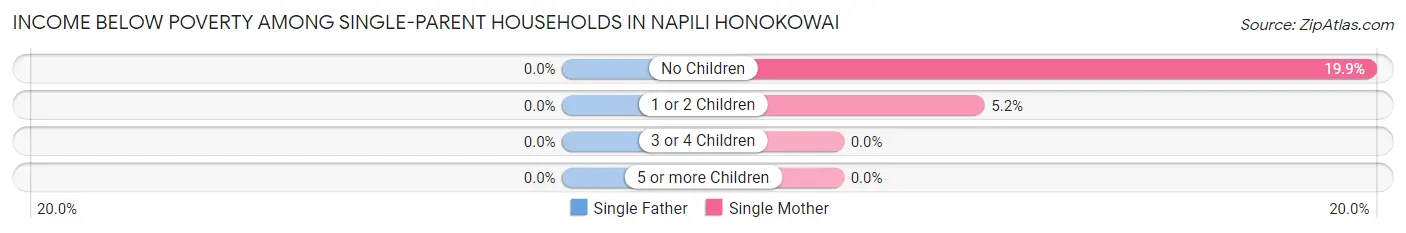
| Children | Single Father | Single Mother |
| No Children | 0 (0.0%) | 27 (19.9%) |
| 1 or 2 Children | 0 (0.0%) | 14 (5.2%) |
| 3 or 4 Children | 0 (0.0%) | 0 (0.0%) |
| 5 or more Children | 0 (0.0%) | 0 (0.0%) |
| Total | 0 (0.0%) | 41 (9.3%) |
Income Below Poverty Among Married-Couple vs Single-Parent Households in Napili Honokowai
The poverty data for Napili Honokowai shows that 59 of the married-couple family households (5.9%) and 41 of the single-parent households (6.8%) are living below the poverty level. Within the married-couple family households, those with no children have the highest poverty rate, with 59 households (7.9%) falling below the poverty line. Among the single-parent households, those with no children have the highest poverty rate, with 27 household (13.2%) living below poverty.
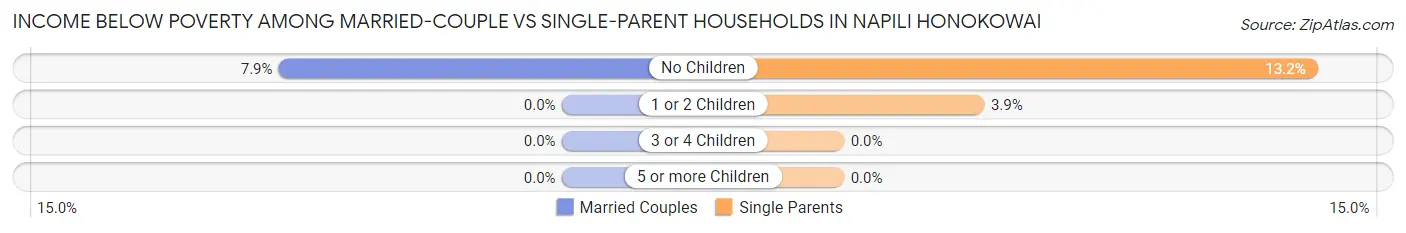
| Children | Married-Couple Families | Single-Parent Households |
| No Children | 59 (7.9%) | 27 (13.2%) |
| 1 or 2 Children | 0 (0.0%) | 14 (3.9%) |
| 3 or 4 Children | 0 (0.0%) | 0 (0.0%) |
| 5 or more Children | 0 (0.0%) | 0 (0.0%) |
| Total | 59 (5.9%) | 41 (6.8%) |
Race in Napili Honokowai
The most populous races in Napili Honokowai are White / Caucasian (2,812 | 41.5%), Two or more Races (2,002 | 29.5%), and Hispanic or Latino (1,681 | 24.8%).
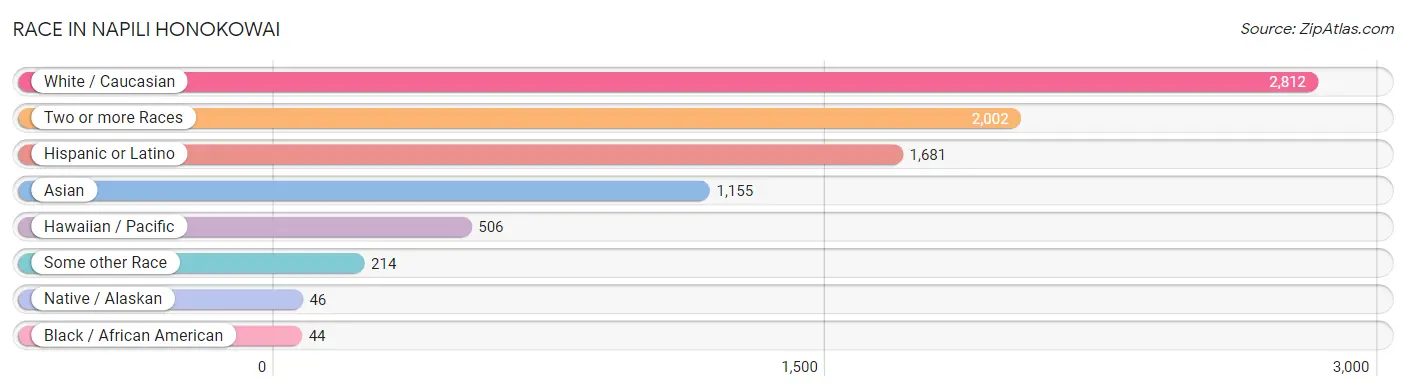
| Race | # Population | % Population |
| Asian | 1,155 | 17.0% |
| Black / African American | 44 | 0.6% |
| Hawaiian / Pacific | 506 | 7.5% |
| Hispanic or Latino | 1,681 | 24.8% |
| Native / Alaskan | 46 | 0.7% |
| White / Caucasian | 2,812 | 41.5% |
| Two or more Races | 2,002 | 29.5% |
| Some other Race | 214 | 3.2% |
| Total | 6,779 | 100.0% |
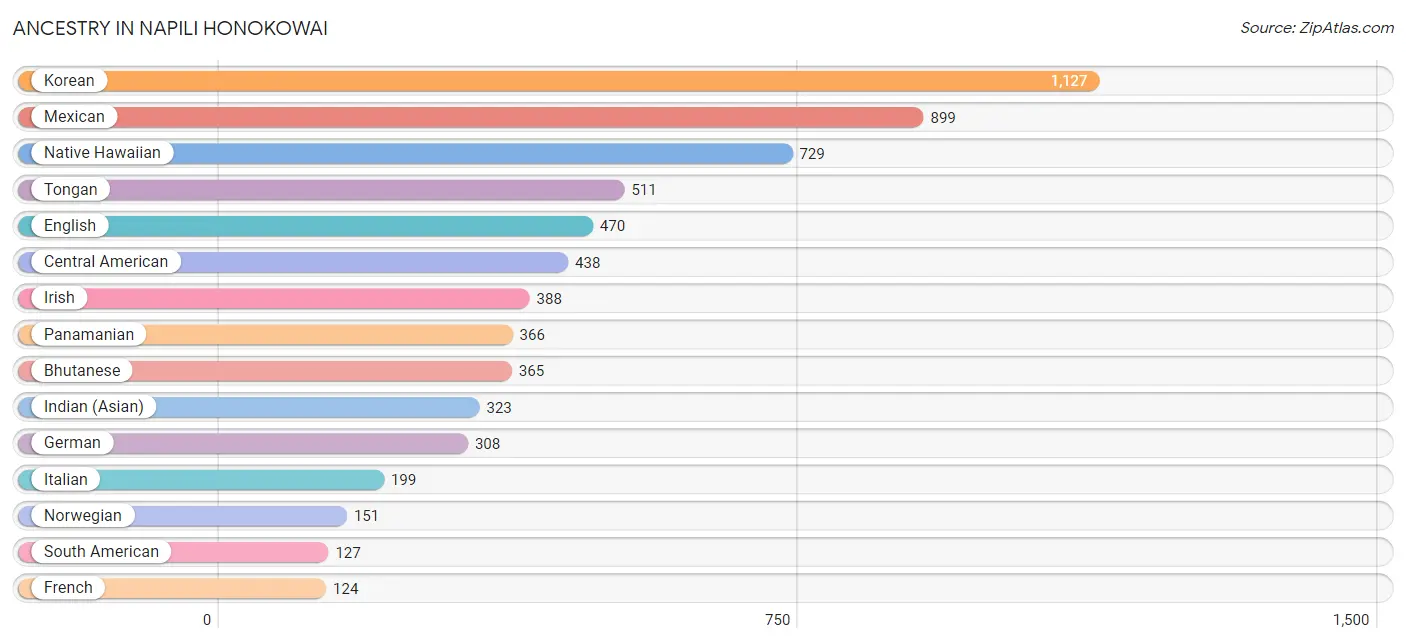
Ancestry in Napili Honokowai
The most populous ancestries reported in Napili Honokowai are Korean (1,127 | 16.6%), Mexican (899 | 13.3%), Native Hawaiian (729 | 10.7%), Tongan (511 | 7.5%), and English (470 | 6.9%), together accounting for 55.1% of all Napili Honokowai residents.
| Ancestry | # Population | % Population |
| African | 9 | 0.1% |
| American | 109 | 1.6% |
| Apache | 50 | 0.7% |
| Argentinean | 48 | 0.7% |
| Armenian | 16 | 0.2% |
| Austrian | 18 | 0.3% |
| Belgian | 9 | 0.1% |
| Bhutanese | 365 | 5.4% |
| Brazilian | 15 | 0.2% |
| British | 80 | 1.2% |
| Burmese | 33 | 0.5% |
| Canadian | 27 | 0.4% |
| Celtic | 15 | 0.2% |
| Central American | 438 | 6.5% |
| Cherokee | 35 | 0.5% |
| Cheyenne | 61 | 0.9% |
| Chickasaw | 19 | 0.3% |
| Chinese | 17 | 0.3% |
| Choctaw | 19 | 0.3% |
| Cuban | 46 | 0.7% |
| Czech | 11 | 0.2% |
| Dominican | 6 | 0.1% |
| Dutch | 117 | 1.7% |
| Eastern European | 9 | 0.1% |
| English | 470 | 6.9% |
| Estonian | 12 | 0.2% |
| European | 13 | 0.2% |
| Fijian | 4 | 0.1% |
| Filipino | 11 | 0.2% |
| Finnish | 23 | 0.3% |
| French | 124 | 1.8% |
| French Canadian | 44 | 0.6% |
| German | 308 | 4.5% |
| Greek | 11 | 0.2% |
| Guamanian / Chamorro | 8 | 0.1% |
| Guatemalan | 72 | 1.1% |
| Hungarian | 71 | 1.1% |
| Indian (Asian) | 323 | 4.8% |
| Inupiat | 2 | 0.0% |
| Irish | 388 | 5.7% |
| Iroquois | 4 | 0.1% |
| Italian | 199 | 2.9% |
| Korean | 1,127 | 16.6% |
| Lithuanian | 4 | 0.1% |
| Mexican | 899 | 13.3% |
| Native Hawaiian | 729 | 10.7% |
| Navajo | 9 | 0.1% |
| Northern European | 8 | 0.1% |
| Norwegian | 151 | 2.2% |
| Pakistani | 2 | 0.0% |
| Panamanian | 366 | 5.4% |
| Peruvian | 19 | 0.3% |
| Polish | 56 | 0.8% |
| Portuguese | 63 | 0.9% |
| Puerto Rican | 109 | 1.6% |
| Romanian | 91 | 1.3% |
| Russian | 66 | 1.0% |
| Samoan | 90 | 1.3% |
| Scandinavian | 17 | 0.3% |
| Scottish | 91 | 1.3% |
| Slavic | 20 | 0.3% |
| Slovak | 7 | 0.1% |
| South American | 127 | 1.9% |
| South American Indian | 6 | 0.1% |
| Spaniard | 47 | 0.7% |
| Sri Lankan | 36 | 0.5% |
| Subsaharan African | 9 | 0.1% |
| Swedish | 92 | 1.4% |
| Swiss | 85 | 1.3% |
| Thai | 49 | 0.7% |
| Tongan | 511 | 7.5% |
| Ukrainian | 37 | 0.5% |
| Venezuelan | 60 | 0.9% |
| Welsh | 43 | 0.6% |
| Yaqui | 4 | 0.1% | View All 75 Rows |
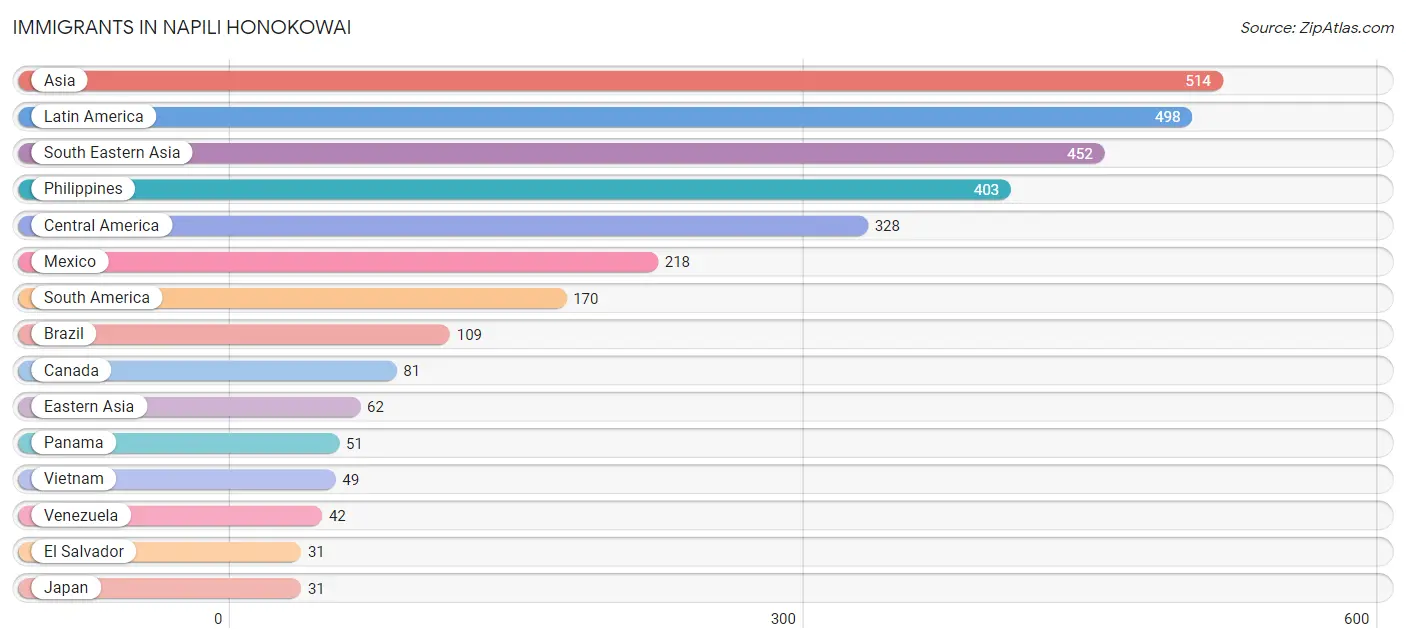
Immigrants in Napili Honokowai
The most numerous immigrant groups reported in Napili Honokowai came from Asia (514 | 7.6%), Latin America (498 | 7.3%), South Eastern Asia (452 | 6.7%), Philippines (403 | 5.9%), and Central America (328 | 4.8%), together accounting for 32.4% of all Napili Honokowai residents.
| Immigration Origin | # Population | % Population |
| Africa | 9 | 0.1% |
| Asia | 514 | 7.6% |
| Brazil | 109 | 1.6% |
| Canada | 81 | 1.2% |
| Central America | 328 | 4.8% |
| China | 18 | 0.3% |
| Eastern Asia | 62 | 0.9% |
| El Salvador | 31 | 0.5% |
| Europe | 18 | 0.3% |
| France | 6 | 0.1% |
| Guatemala | 28 | 0.4% |
| Hong Kong | 6 | 0.1% |
| Japan | 31 | 0.5% |
| Korea | 13 | 0.2% |
| Latin America | 498 | 7.3% |
| Mexico | 218 | 3.2% |
| Northern Europe | 8 | 0.1% |
| Oceania | 25 | 0.4% |
| Panama | 51 | 0.7% |
| Peru | 19 | 0.3% |
| Philippines | 403 | 5.9% |
| South America | 170 | 2.5% |
| South Eastern Asia | 452 | 6.7% |
| Switzerland | 4 | 0.1% |
| Venezuela | 42 | 0.6% |
| Vietnam | 49 | 0.7% |
| Western Africa | 9 | 0.1% |
| Western Europe | 10 | 0.2% | View All 28 Rows |
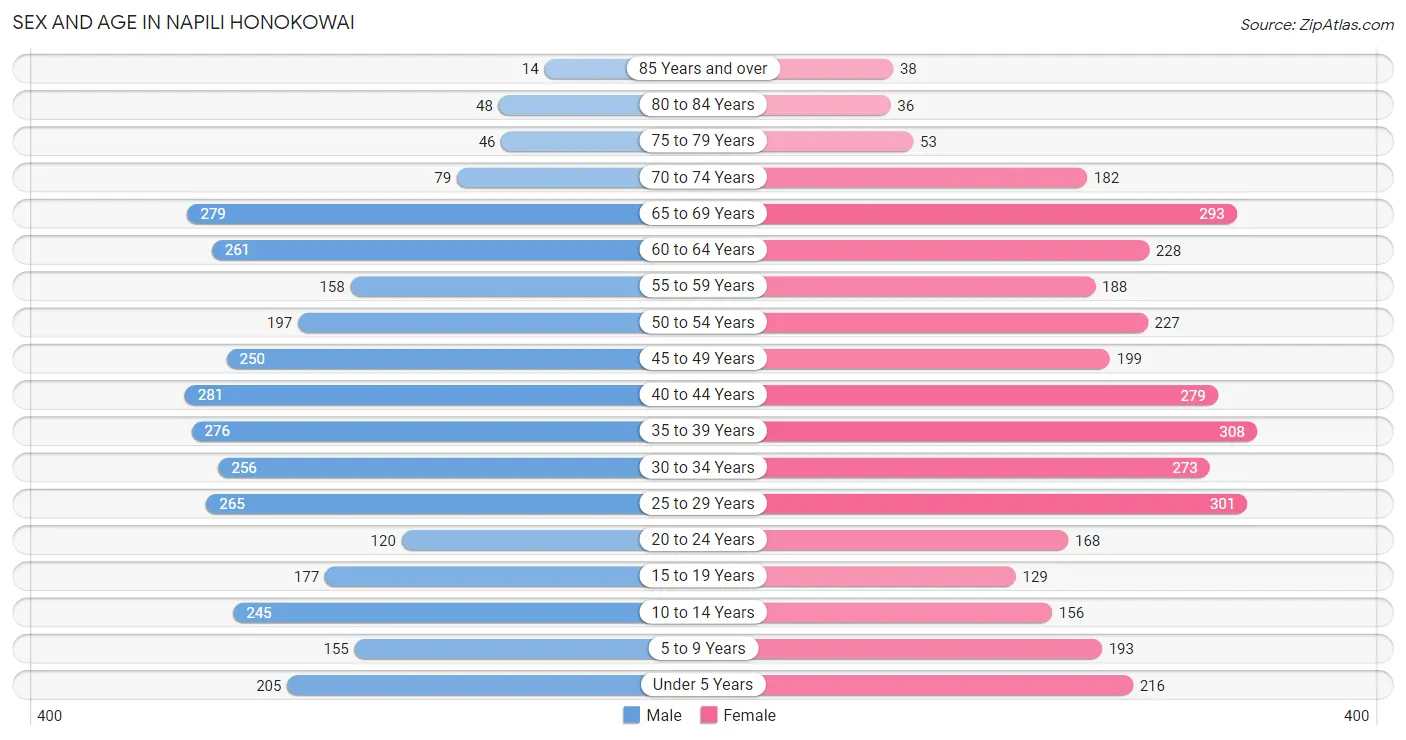
Sex and Age in Napili Honokowai
Sex and Age in Napili Honokowai
The most populous age groups in Napili Honokowai are 40 to 44 Years (281 | 8.5%) for men and 35 to 39 Years (308 | 8.9%) for women.
| Age Bracket | Male | Female |
| Under 5 Years | 205 (6.2%) | 216 (6.2%) |
| 5 to 9 Years | 155 (4.7%) | 193 (5.6%) |
| 10 to 14 Years | 245 (7.4%) | 156 (4.5%) |
| 15 to 19 Years | 177 (5.3%) | 129 (3.7%) |
| 20 to 24 Years | 120 (3.6%) | 168 (4.9%) |
| 25 to 29 Years | 265 (8.0%) | 301 (8.7%) |
| 30 to 34 Years | 256 (7.7%) | 273 (7.9%) |
| 35 to 39 Years | 276 (8.3%) | 308 (8.9%) |
| 40 to 44 Years | 281 (8.5%) | 279 (8.1%) |
| 45 to 49 Years | 250 (7.5%) | 199 (5.7%) |
| 50 to 54 Years | 197 (5.9%) | 227 (6.6%) |
| 55 to 59 Years | 158 (4.8%) | 188 (5.4%) |
| 60 to 64 Years | 261 (7.9%) | 228 (6.6%) |
| 65 to 69 Years | 279 (8.4%) | 293 (8.5%) |
| 70 to 74 Years | 79 (2.4%) | 182 (5.2%) |
| 75 to 79 Years | 46 (1.4%) | 53 (1.5%) |
| 80 to 84 Years | 48 (1.5%) | 36 (1.0%) |
| 85 Years and over | 14 (0.4%) | 38 (1.1%) |
| Total | 3,312 (100.0%) | 3,467 (100.0%) |
Families and Households in Napili Honokowai
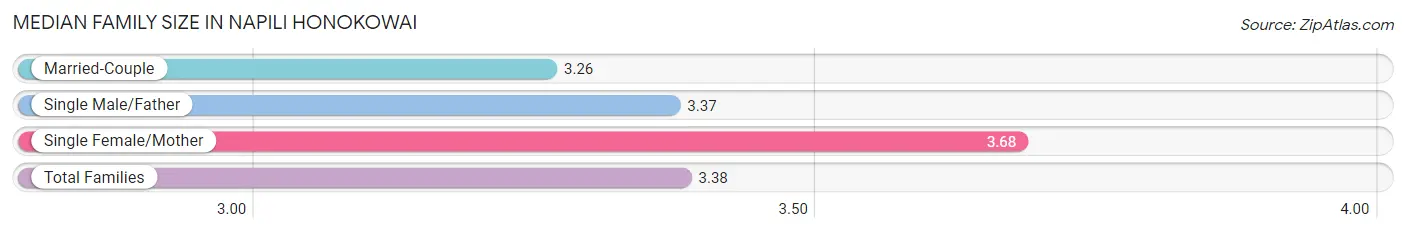
Median Family Size in Napili Honokowai
The median family size in Napili Honokowai is 3.38 persons per family, with single female/mother families (443 | 27.6%) accounting for the largest median family size of 3.68 persons per family. On the other hand, married-couple families (1,006 | 62.6%) represent the smallest median family size with 3.26 persons per family.
| Family Type | # Families | Family Size |
| Married-Couple | 1,006 (62.6%) | 3.26 |
| Single Male/Father | 158 (9.8%) | 3.37 |
| Single Female/Mother | 443 (27.6%) | 3.68 |
| Total Families | 1,607 (100.0%) | 3.38 |
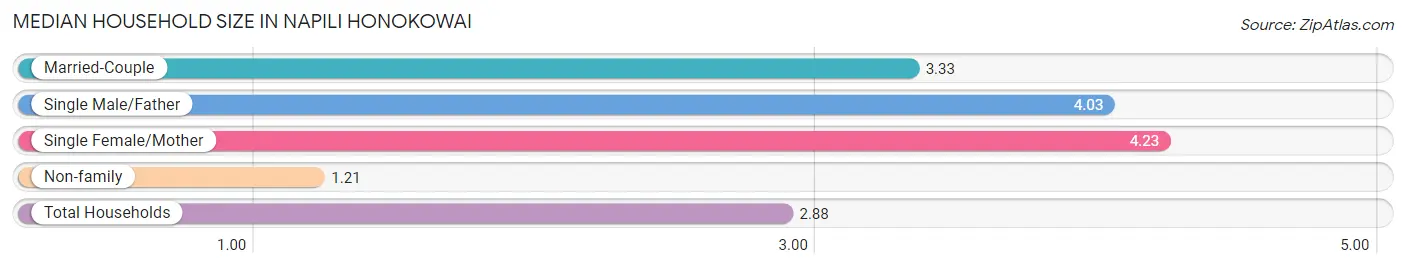
Median Household Size in Napili Honokowai
The median household size in Napili Honokowai is 2.88 persons per household, with single female/mother households (443 | 18.8%) accounting for the largest median household size of 4.23 persons per household. non-family households (745 | 31.7%) represent the smallest median household size with 1.21 persons per household.
| Household Type | # Households | Household Size |
| Married-Couple | 1,006 (42.8%) | 3.33 |
| Single Male/Father | 158 (6.7%) | 4.03 |
| Single Female/Mother | 443 (18.8%) | 4.23 |
| Non-family | 745 (31.7%) | 1.21 |
| Total Households | 2,352 (100.0%) | 2.88 |
Household Size by Marriage Status in Napili Honokowai
Out of a total of 2,352 households in Napili Honokowai, 1,607 (68.3%) are family households, while 745 (31.7%) are nonfamily households. The most numerous type of family households are 2-person households, comprising 634, and the most common type of nonfamily households are 1-person households, comprising 608.
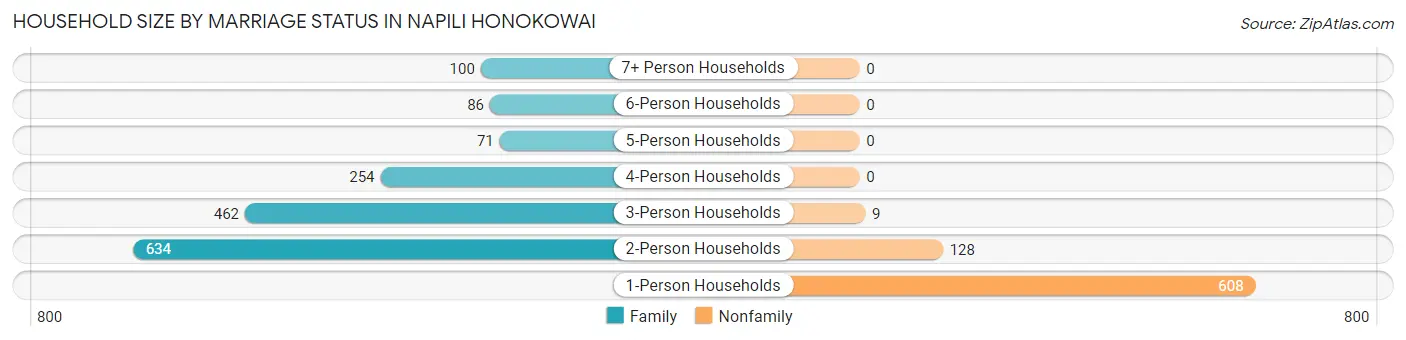
| Household Size | Family Households | Nonfamily Households |
| 1-Person Households | - | 608 (25.9%) |
| 2-Person Households | 634 (27.0%) | 128 (5.4%) |
| 3-Person Households | 462 (19.6%) | 9 (0.4%) |
| 4-Person Households | 254 (10.8%) | 0 (0.0%) |
| 5-Person Households | 71 (3.0%) | 0 (0.0%) |
| 6-Person Households | 86 (3.7%) | 0 (0.0%) |
| 7+ Person Households | 100 (4.3%) | 0 (0.0%) |
| Total | 1,607 (68.3%) | 745 (31.7%) |
Female Fertility in Napili Honokowai
Fertility by Age in Napili Honokowai
Average fertility rate in Napili Honokowai is 40.0 births per 1,000 women. Women in the age bracket of 20 to 34 years have the highest fertility rate with 89.0 births per 1,000 women. Women in the age bracket of 20 to 34 years acount for 100.0% of all women with births.
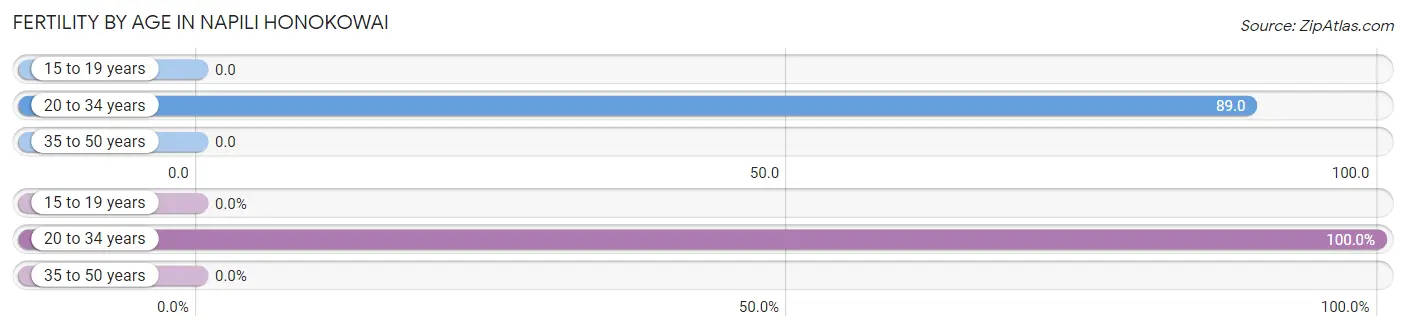
| Age Bracket | Women with Births | Births / 1,000 Women |
| 15 to 19 years | 0 (0.0%) | 0.0 |
| 20 to 34 years | 66 (100.0%) | 89.0 |
| 35 to 50 years | 0 (0.0%) | 0.0 |
| Total | 66 (100.0%) | 40.0 |
Fertility by Age by Marriage Status in Napili Honokowai
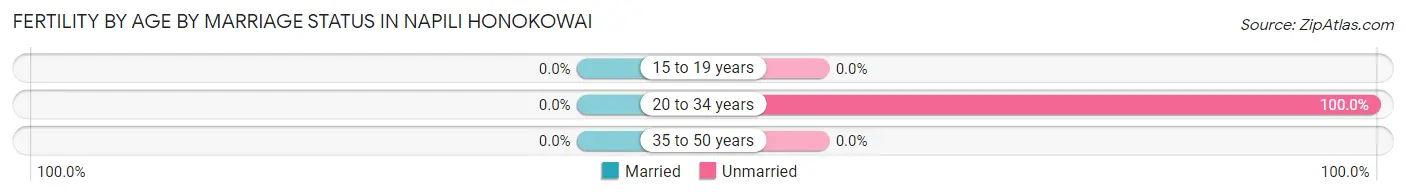
| Age Bracket | Married | Unmarried |
| 15 to 19 years | 0 (0.0%) | 0 (0.0%) |
| 20 to 34 years | 0 (0.0%) | 66 (100.0%) |
| 35 to 50 years | 0 (0.0%) | 0 (0.0%) |
| Total | 0 (0.0%) | 66 (100.0%) |
Fertility by Education in Napili Honokowai
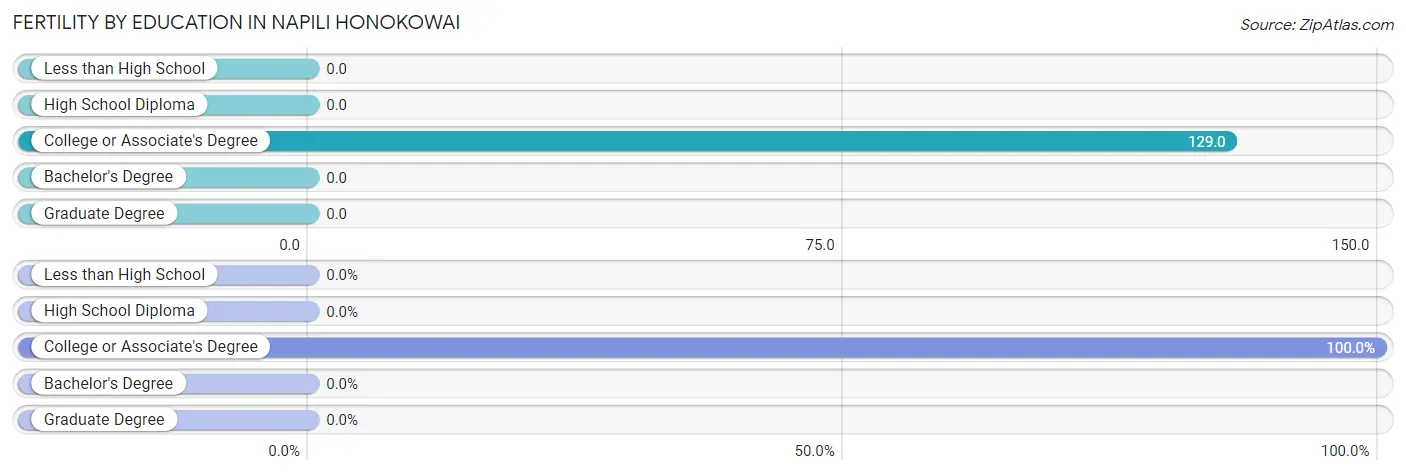
| Educational Attainment | Women with Births | Births / 1,000 Women |
| Less than High School | 0 (0.0%) | 0.0 |
| High School Diploma | 0 (0.0%) | 0.0 |
| College or Associate's Degree | 66 (100.0%) | 129.0 |
| Bachelor's Degree | 0 (0.0%) | 0.0 |
| Graduate Degree | 0 (0.0%) | 0.0 |
| Total | 66 (100.0%) | 40.0 |
Fertility by Education by Marriage Status in Napili Honokowai
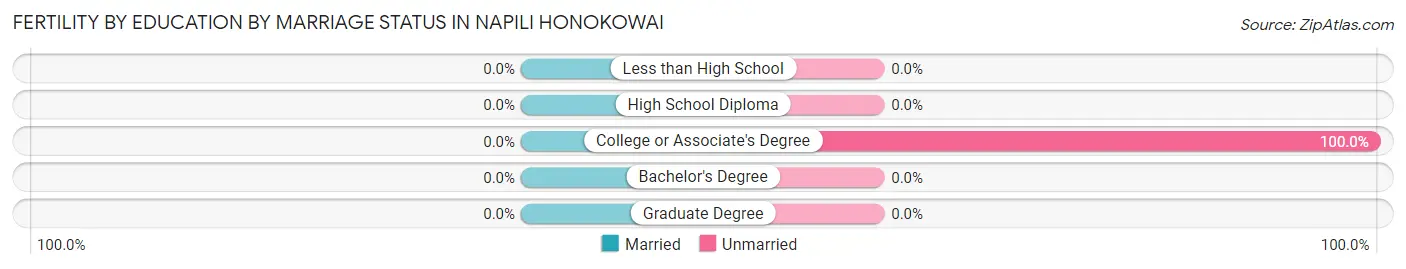
| Educational Attainment | Married | Unmarried |
| Less than High School | 0 (0.0%) | 0 (0.0%) |
| High School Diploma | 0 (0.0%) | 0 (0.0%) |
| College or Associate's Degree | 0 (0.0%) | 66 (100.0%) |
| Bachelor's Degree | 0 (0.0%) | 0 (0.0%) |
| Graduate Degree | 0 (0.0%) | 0 (0.0%) |
| Total | 0 (0.0%) | 66 (100.0%) |
Employment Characteristics in Napili Honokowai
Employment by Class of Employer in Napili Honokowai
Among the 3,976 employed individuals in Napili Honokowai, private company employees (2,614 | 65.7%), self-employed (not incorporated) (556 | 14.0%), and not-for-profit organizations (380 | 9.6%) make up the most common classes of employment.
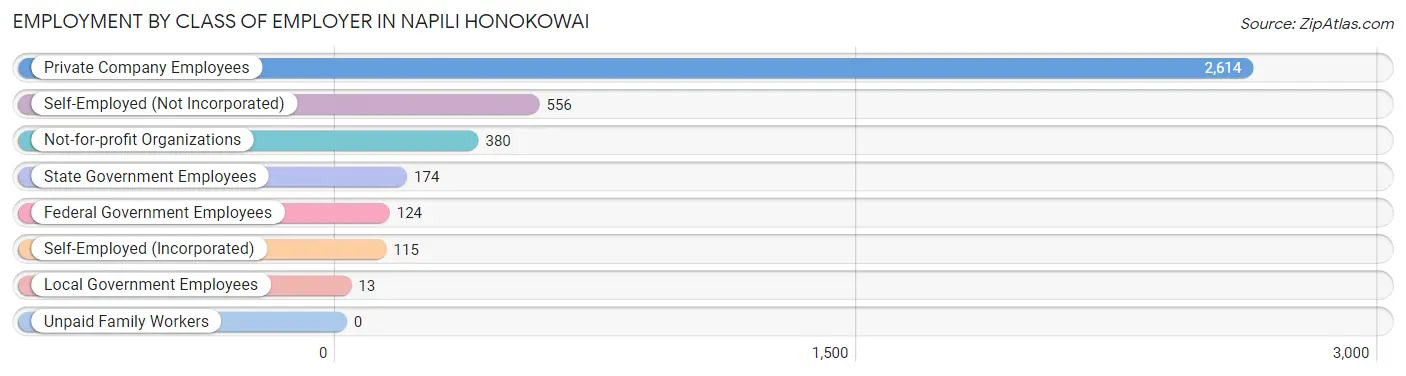
| Employer Class | # Employees | % Employees |
| Private Company Employees | 2,614 | 65.7% |
| Self-Employed (Incorporated) | 115 | 2.9% |
| Self-Employed (Not Incorporated) | 556 | 14.0% |
| Not-for-profit Organizations | 380 | 9.6% |
| Local Government Employees | 13 | 0.3% |
| State Government Employees | 174 | 4.4% |
| Federal Government Employees | 124 | 3.1% |
| Unpaid Family Workers | 0 | 0.0% |
| Total | 3,976 | 100.0% |
Employment Status by Age in Napili Honokowai
According to the labor force statistics for Napili Honokowai, out of the total population over 16 years of age (5,533), 77.9% or 4,310 individuals are in the labor force, with 7.1% or 306 of them unemployed. The age group with the highest labor force participation rate is 35 to 44 years, with 94.6% or 1,082 individuals in the labor force. Within the labor force, the 20 to 24 years age range has the highest percentage of unemployed individuals, with 24.6% or 65 of them being unemployed.
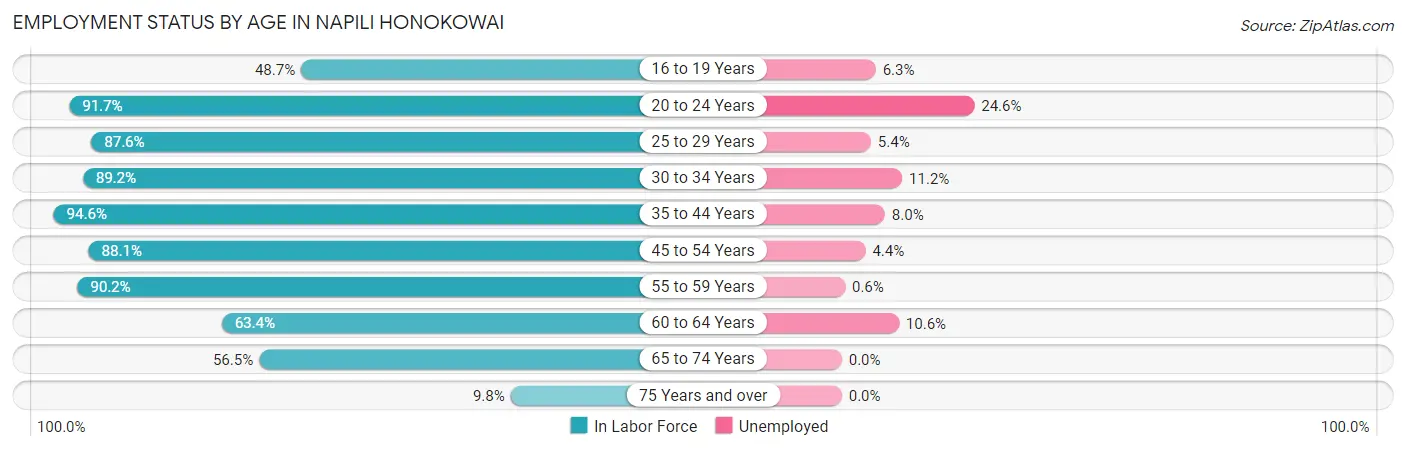
| Age Bracket | In Labor Force | Unemployed |
| 16 to 19 Years | 112 (48.7%) | 7 (6.3%) |
| 20 to 24 Years | 264 (91.7%) | 65 (24.6%) |
| 25 to 29 Years | 496 (87.6%) | 27 (5.4%) |
| 30 to 34 Years | 472 (89.2%) | 53 (11.2%) |
| 35 to 44 Years | 1,082 (94.6%) | 87 (8.0%) |
| 45 to 54 Years | 769 (88.1%) | 34 (4.4%) |
| 55 to 59 Years | 312 (90.2%) | 2 (0.6%) |
| 60 to 64 Years | 310 (63.4%) | 33 (10.6%) |
| 65 to 74 Years | 471 (56.5%) | 0 (0.0%) |
| 75 Years and over | 23 (9.8%) | 0 (0.0%) |
| Total | 4,310 (77.9%) | 306 (7.1%) |
Employment Status by Educational Attainment in Napili Honokowai
According to labor force statistics for Napili Honokowai, 87.2% of individuals (3,442) out of the total population between 25 and 64 years of age (3,947) are in the labor force, with 6.8% or 234 of them being unemployed. The group with the highest labor force participation rate are those with the educational attainment of bachelor's degree or higher, with 91.8% or 925 individuals in the labor force. Within the labor force, individuals with high school diploma education have the highest percentage of unemployment, with 10.6% or 124 of them being unemployed.
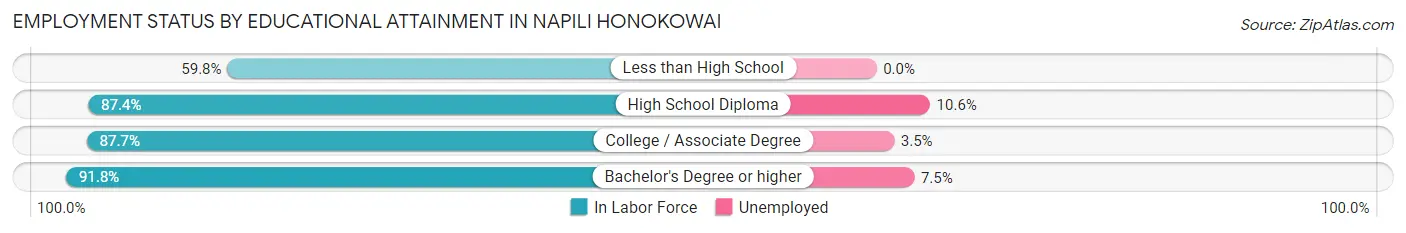
| Educational Attainment | In Labor Force | Unemployed |
| Less than High School | 122 (59.8%) | 0 (0.0%) |
| High School Diploma | 1,172 (87.4%) | 142 (10.6%) |
| College / Associate Degree | 1,223 (87.7%) | 49 (3.5%) |
| Bachelor's Degree or higher | 925 (91.8%) | 76 (7.5%) |
| Total | 3,442 (87.2%) | 268 (6.8%) |
Employment Occupations by Sex in Napili Honokowai
Management, Business, Science and Arts Occupations
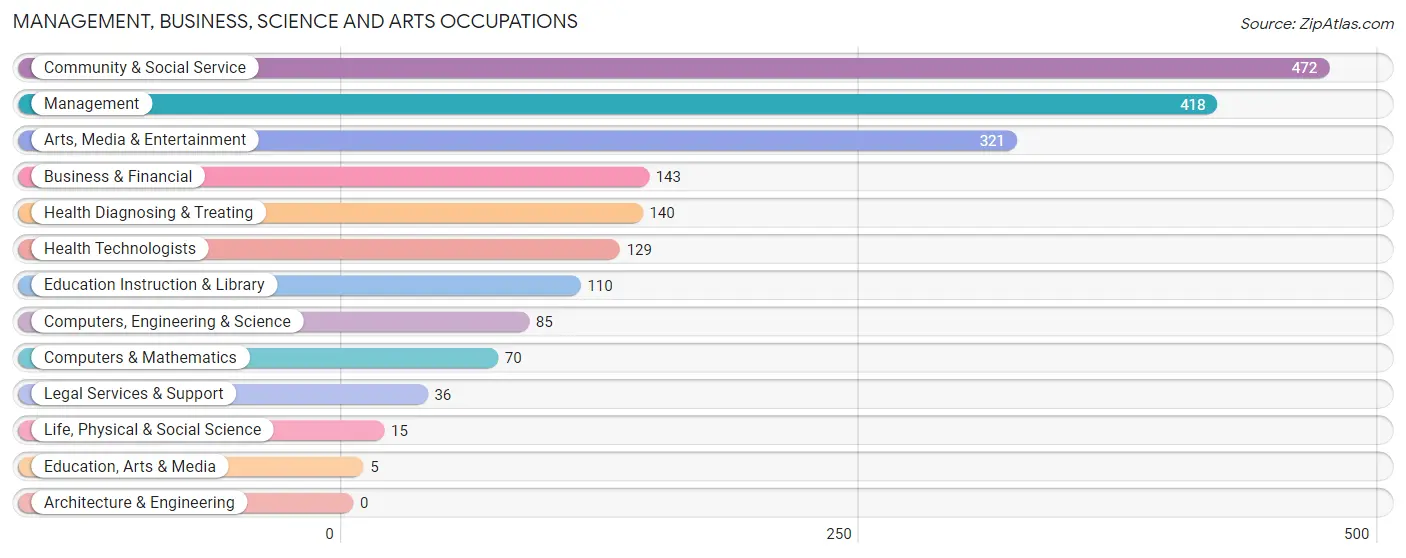
The most common Management, Business, Science and Arts occupations in Napili Honokowai are Community & Social Service (472 | 11.8%), Management (418 | 10.5%), Arts, Media & Entertainment (321 | 8.1%), Business & Financial (143 | 3.6%), and Health Diagnosing & Treating (140 | 3.5%).
Management, Business, Science and Arts Occupations by Sex
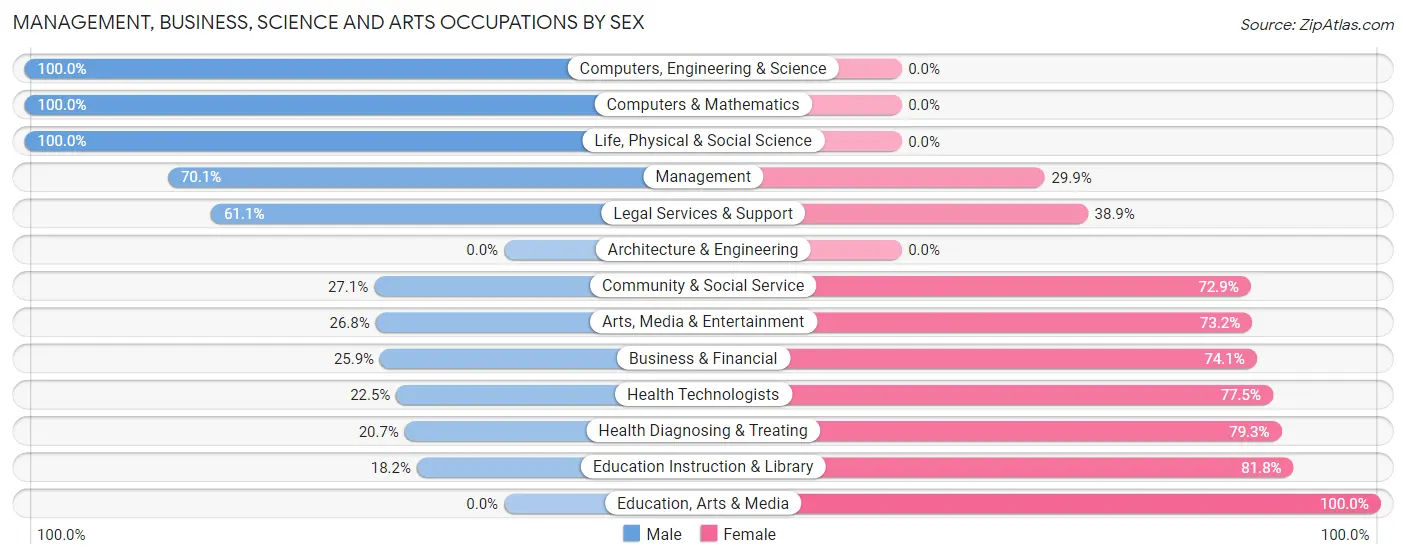
Within the Management, Business, Science and Arts occupations in Napili Honokowai, the most male-oriented occupations are Computers, Engineering & Science (100.0%), Computers & Mathematics (100.0%), and Life, Physical & Social Science (100.0%), while the most female-oriented occupations are Education, Arts & Media (100.0%), Education Instruction & Library (81.8%), and Health Diagnosing & Treating (79.3%).
| Occupation | Male | Female |
| Management | 293 (70.1%) | 125 (29.9%) |
| Business & Financial | 37 (25.9%) | 106 (74.1%) |
| Computers, Engineering & Science | 85 (100.0%) | 0 (0.0%) |
| Computers & Mathematics | 70 (100.0%) | 0 (0.0%) |
| Architecture & Engineering | 0 (0.0%) | 0 (0.0%) |
| Life, Physical & Social Science | 15 (100.0%) | 0 (0.0%) |
| Community & Social Service | 128 (27.1%) | 344 (72.9%) |
| Education, Arts & Media | 0 (0.0%) | 5 (100.0%) |
| Legal Services & Support | 22 (61.1%) | 14 (38.9%) |
| Education Instruction & Library | 20 (18.2%) | 90 (81.8%) |
| Arts, Media & Entertainment | 86 (26.8%) | 235 (73.2%) |
| Health Diagnosing & Treating | 29 (20.7%) | 111 (79.3%) |
| Health Technologists | 29 (22.5%) | 100 (77.5%) |
| Total (Category) | 572 (45.5%) | 686 (54.5%) |
| Total (Overall) | 2,053 (51.5%) | 1,936 (48.5%) |
Services Occupations
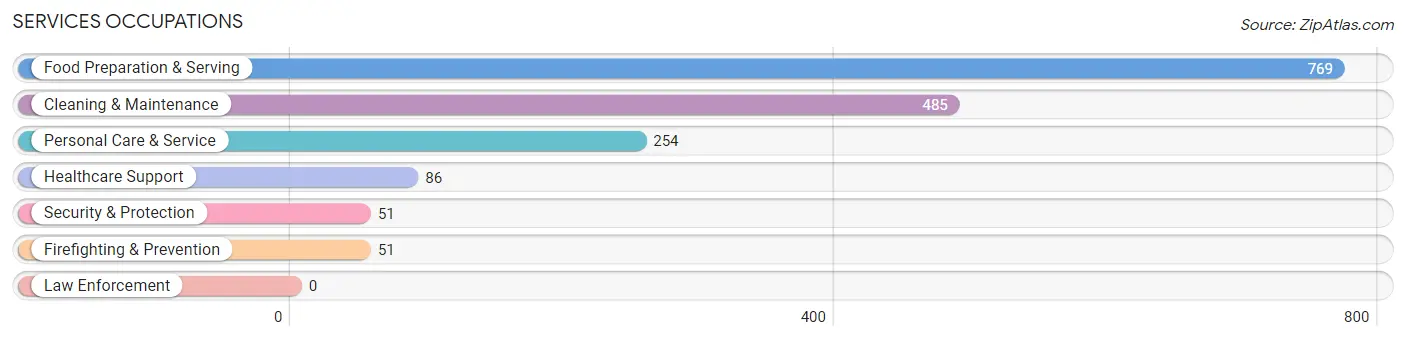
The most common Services occupations in Napili Honokowai are Food Preparation & Serving (769 | 19.3%), Cleaning & Maintenance (485 | 12.2%), Personal Care & Service (254 | 6.4%), Healthcare Support (86 | 2.2%), and Security & Protection (51 | 1.3%).
Services Occupations by Sex
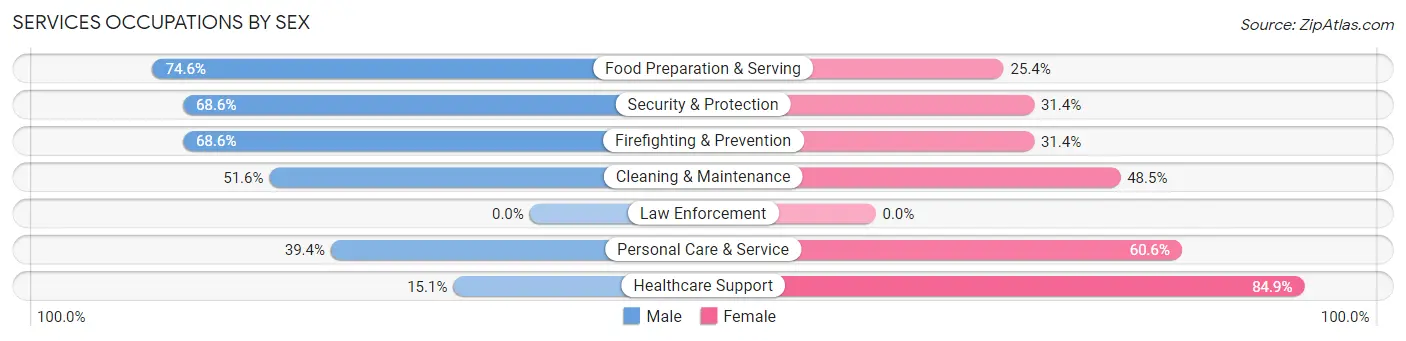
Within the Services occupations in Napili Honokowai, the most male-oriented occupations are Food Preparation & Serving (74.6%), Security & Protection (68.6%), and Firefighting & Prevention (68.6%), while the most female-oriented occupations are Healthcare Support (84.9%), Personal Care & Service (60.6%), and Cleaning & Maintenance (48.4%).
| Occupation | Male | Female |
| Healthcare Support | 13 (15.1%) | 73 (84.9%) |
| Security & Protection | 35 (68.6%) | 16 (31.4%) |
| Firefighting & Prevention | 35 (68.6%) | 16 (31.4%) |
| Law Enforcement | 0 (0.0%) | 0 (0.0%) |
| Food Preparation & Serving | 574 (74.6%) | 195 (25.4%) |
| Cleaning & Maintenance | 250 (51.5%) | 235 (48.4%) |
| Personal Care & Service | 100 (39.4%) | 154 (60.6%) |
| Total (Category) | 972 (59.1%) | 673 (40.9%) |
| Total (Overall) | 2,053 (51.5%) | 1,936 (48.5%) |
Sales and Office Occupations
The most common Sales and Office occupations in Napili Honokowai are Office & Administration (419 | 10.5%), and Sales & Related (279 | 7.0%).
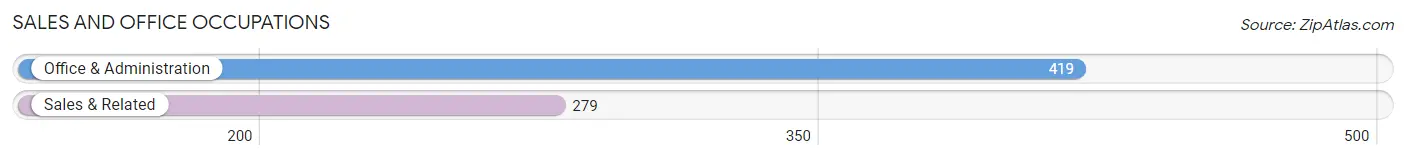
Sales and Office Occupations by Sex
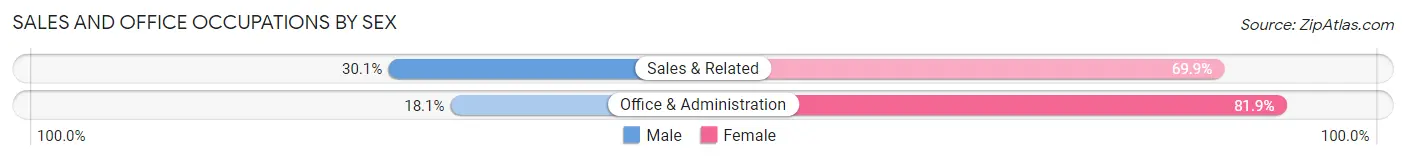
| Occupation | Male | Female |
| Sales & Related | 84 (30.1%) | 195 (69.9%) |
| Office & Administration | 76 (18.1%) | 343 (81.9%) |
| Total (Category) | 160 (22.9%) | 538 (77.1%) |
| Total (Overall) | 2,053 (51.5%) | 1,936 (48.5%) |
Natural Resources, Construction and Maintenance Occupations
The most common Natural Resources, Construction and Maintenance occupations in Napili Honokowai are Construction & Extraction (134 | 3.4%), Installation, Maintenance & Repair (72 | 1.8%), and Farming, Fishing & Forestry (31 | 0.8%).
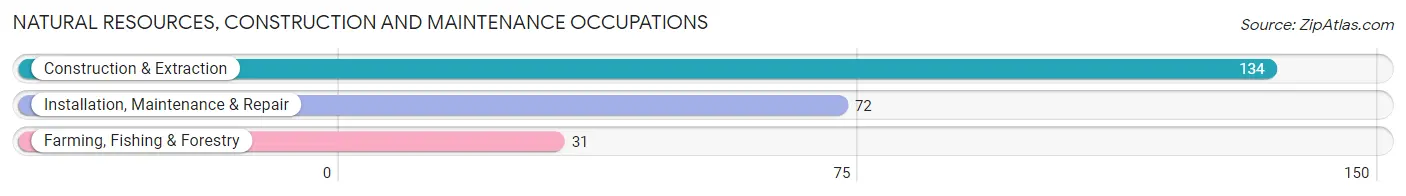
Natural Resources, Construction and Maintenance Occupations by Sex
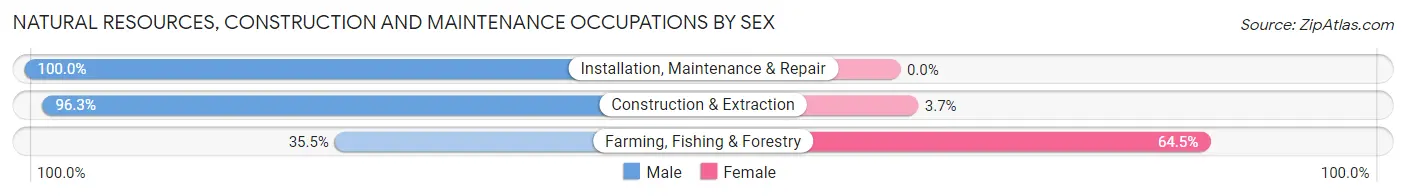
| Occupation | Male | Female |
| Farming, Fishing & Forestry | 11 (35.5%) | 20 (64.5%) |
| Construction & Extraction | 129 (96.3%) | 5 (3.7%) |
| Installation, Maintenance & Repair | 72 (100.0%) | 0 (0.0%) |
| Total (Category) | 212 (89.4%) | 25 (10.5%) |
| Total (Overall) | 2,053 (51.5%) | 1,936 (48.5%) |
Production, Transportation and Moving Occupations
The most common Production, Transportation and Moving occupations in Napili Honokowai are Transportation (68 | 1.7%), Production (63 | 1.6%), and Material Moving (20 | 0.5%).
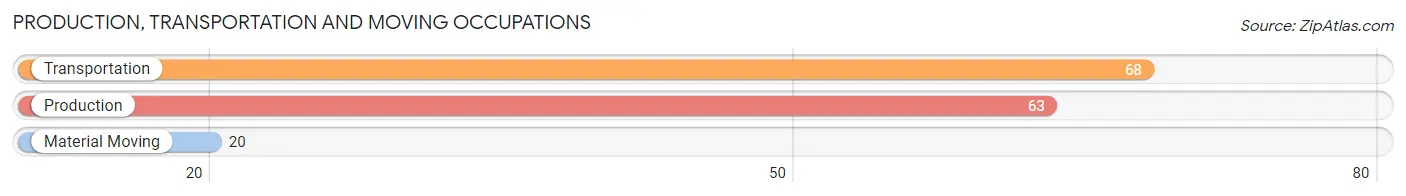
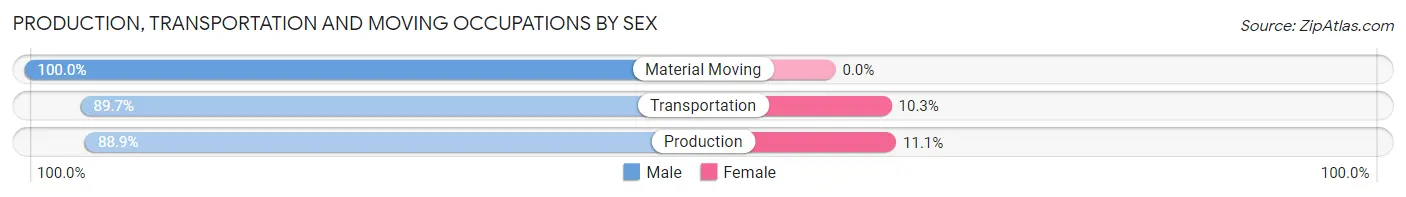
Production, Transportation and Moving Occupations by Sex
| Occupation | Male | Female |
| Production | 56 (88.9%) | 7 (11.1%) |
| Transportation | 61 (89.7%) | 7 (10.3%) |
| Material Moving | 20 (100.0%) | 0 (0.0%) |
| Total (Category) | 137 (90.7%) | 14 (9.3%) |
| Total (Overall) | 2,053 (51.5%) | 1,936 (48.5%) |
Employment Industries by Sex in Napili Honokowai
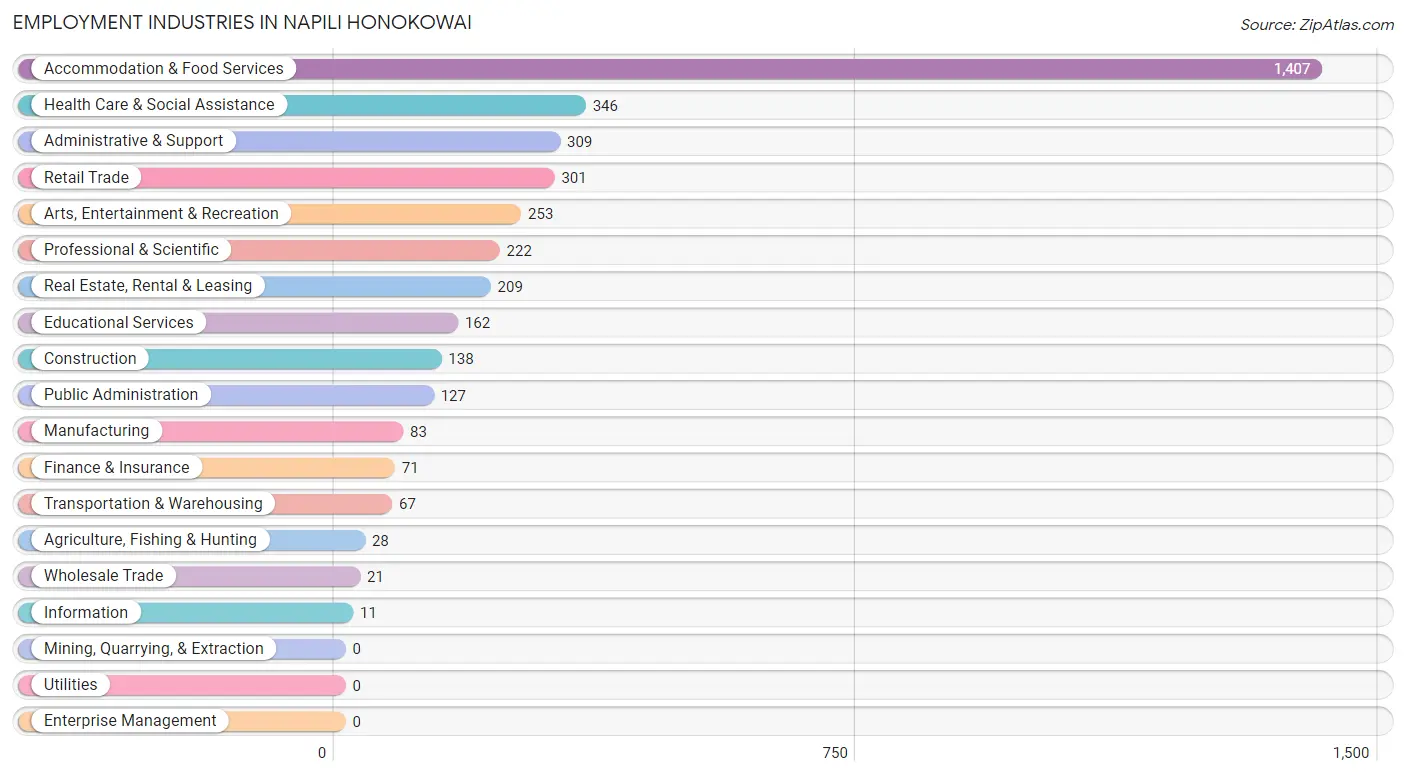
Employment Industries in Napili Honokowai
The major employment industries in Napili Honokowai include Accommodation & Food Services (1,407 | 35.3%), Health Care & Social Assistance (346 | 8.7%), Administrative & Support (309 | 7.7%), Retail Trade (301 | 7.5%), and Arts, Entertainment & Recreation (253 | 6.3%).
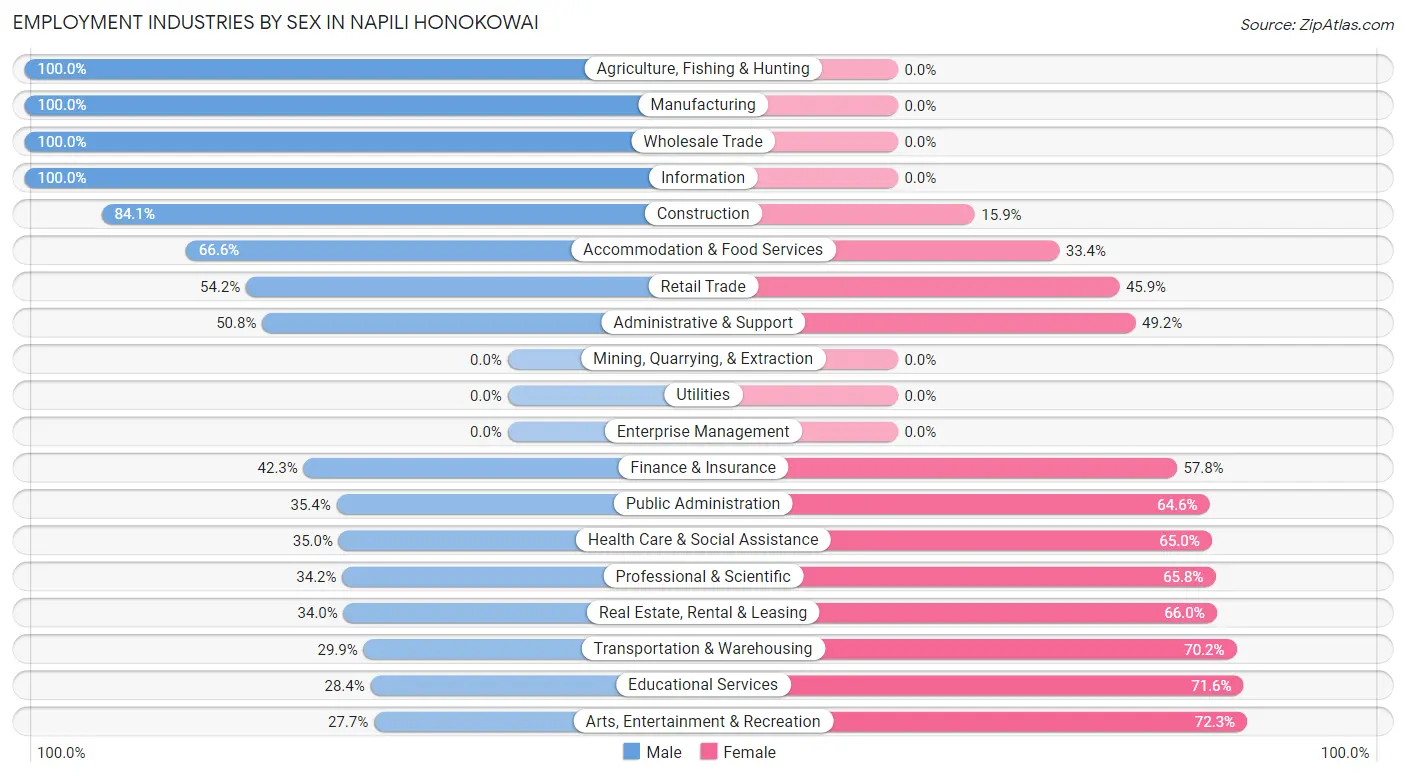
Employment Industries by Sex in Napili Honokowai
The Napili Honokowai industries that see more men than women are Agriculture, Fishing & Hunting (100.0%), Manufacturing (100.0%), and Wholesale Trade (100.0%), whereas the industries that tend to have a higher number of women are Arts, Entertainment & Recreation (72.3%), Educational Services (71.6%), and Transportation & Warehousing (70.2%).
| Industry | Male | Female |
| Agriculture, Fishing & Hunting | 28 (100.0%) | 0 (0.0%) |
| Mining, Quarrying, & Extraction | 0 (0.0%) | 0 (0.0%) |
| Construction | 116 (84.1%) | 22 (15.9%) |
| Manufacturing | 83 (100.0%) | 0 (0.0%) |
| Wholesale Trade | 21 (100.0%) | 0 (0.0%) |
| Retail Trade | 163 (54.1%) | 138 (45.9%) |
| Transportation & Warehousing | 20 (29.8%) | 47 (70.2%) |
| Utilities | 0 (0.0%) | 0 (0.0%) |
| Information | 11 (100.0%) | 0 (0.0%) |
| Finance & Insurance | 30 (42.2%) | 41 (57.8%) |
| Real Estate, Rental & Leasing | 71 (34.0%) | 138 (66.0%) |
| Professional & Scientific | 76 (34.2%) | 146 (65.8%) |
| Enterprise Management | 0 (0.0%) | 0 (0.0%) |
| Administrative & Support | 157 (50.8%) | 152 (49.2%) |
| Educational Services | 46 (28.4%) | 116 (71.6%) |
| Health Care & Social Assistance | 121 (35.0%) | 225 (65.0%) |
| Arts, Entertainment & Recreation | 70 (27.7%) | 183 (72.3%) |
| Accommodation & Food Services | 937 (66.6%) | 470 (33.4%) |
| Public Administration | 45 (35.4%) | 82 (64.6%) |
| Total | 2,053 (51.5%) | 1,936 (48.5%) |
Education in Napili Honokowai
School Enrollment in Napili Honokowai
The most common levels of schooling among the 1,120 students in Napili Honokowai are middle school (343 | 30.6%), high school (270 | 24.1%), and elementary school (255 | 22.8%).
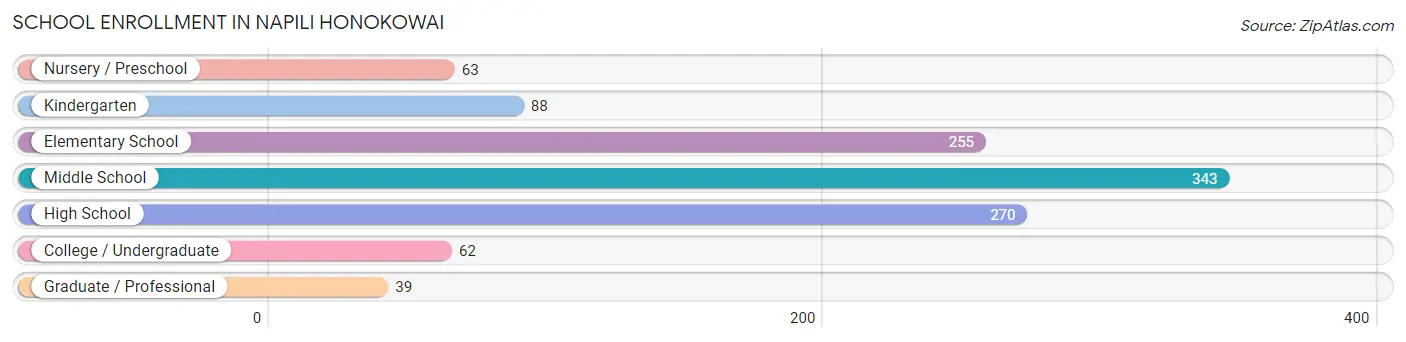
| School Level | # Students | % Students |
| Nursery / Preschool | 63 | 5.6% |
| Kindergarten | 88 | 7.9% |
| Elementary School | 255 | 22.8% |
| Middle School | 343 | 30.6% |
| High School | 270 | 24.1% |
| College / Undergraduate | 62 | 5.5% |
| Graduate / Professional | 39 | 3.5% |
| Total | 1,120 | 100.0% |
School Enrollment by Age by Funding Source in Napili Honokowai
Out of a total of 1,120 students who are enrolled in schools in Napili Honokowai, 206 (18.4%) attend a private institution, while the remaining 914 (81.6%) are enrolled in public schools. The age group of 3 to 4 year olds has the highest likelihood of being enrolled in private schools, with 40 (63.5% in the age bracket) enrolled. Conversely, the age group of 18 to 19 year olds has the lowest likelihood of being enrolled in a private school, with 25 (100.0% in the age bracket) attending a public institution.
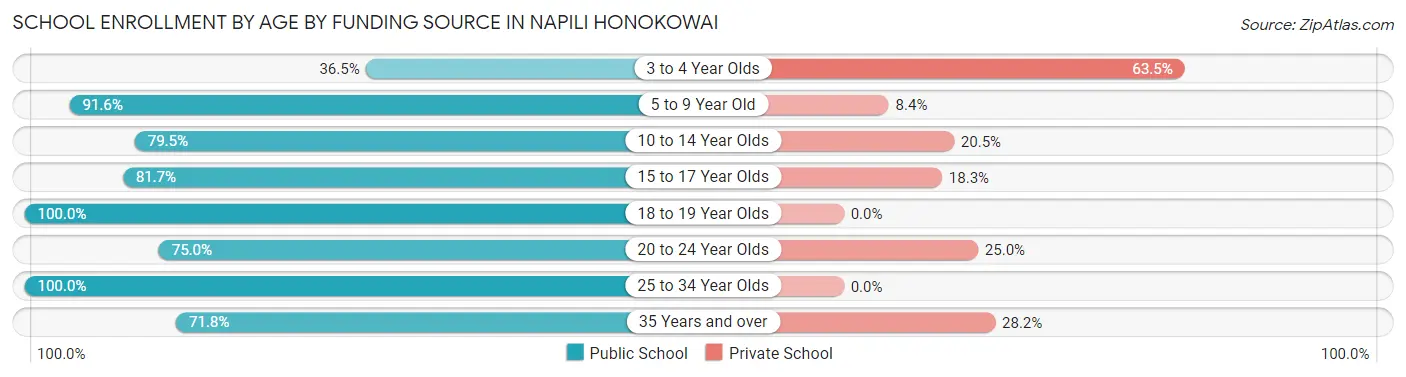
| Age Bracket | Public School | Private School |
| 3 to 4 Year Olds | 23 (36.5%) | 40 (63.5%) |
| 5 to 9 Year Old | 306 (91.6%) | 28 (8.4%) |
| 10 to 14 Year Olds | 298 (79.5%) | 77 (20.5%) |
| 15 to 17 Year Olds | 192 (81.7%) | 43 (18.3%) |
| 18 to 19 Year Olds | 25 (100.0%) | 0 (0.0%) |
| 20 to 24 Year Olds | 21 (75.0%) | 7 (25.0%) |
| 25 to 34 Year Olds | 21 (100.0%) | 0 (0.0%) |
| 35 Years and over | 28 (71.8%) | 11 (28.2%) |
| Total | 914 (81.6%) | 206 (18.4%) |
Educational Attainment by Field of Study in Napili Honokowai
Business (345 | 26.0%), liberal arts & history (149 | 11.2%), visual & performing arts (120 | 9.0%), psychology (111 | 8.4%), and science & technology (100 | 7.5%) are the most common fields of study among 1,327 individuals in Napili Honokowai who have obtained a bachelor's degree or higher.
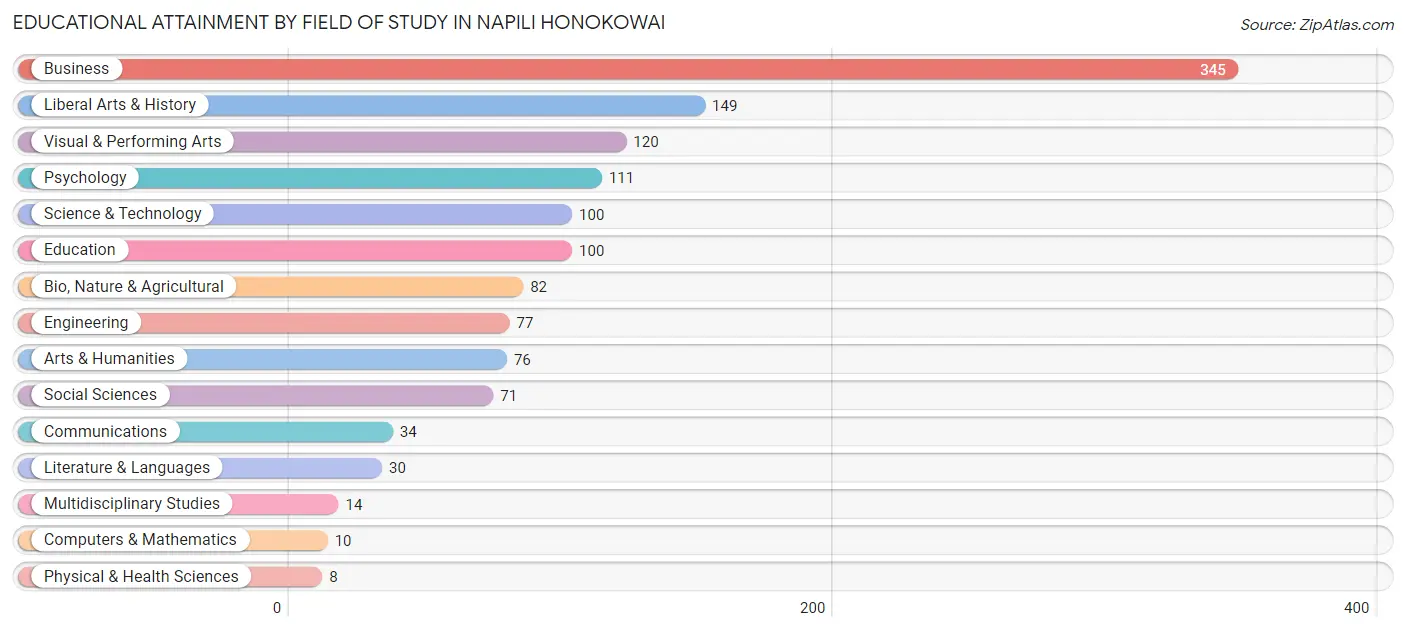
| Field of Study | # Graduates | % Graduates |
| Computers & Mathematics | 10 | 0.7% |
| Bio, Nature & Agricultural | 82 | 6.2% |
| Physical & Health Sciences | 8 | 0.6% |
| Psychology | 111 | 8.4% |
| Social Sciences | 71 | 5.3% |
| Engineering | 77 | 5.8% |
| Multidisciplinary Studies | 14 | 1.1% |
| Science & Technology | 100 | 7.5% |
| Business | 345 | 26.0% |
| Education | 100 | 7.5% |
| Literature & Languages | 30 | 2.3% |
| Liberal Arts & History | 149 | 11.2% |
| Visual & Performing Arts | 120 | 9.0% |
| Communications | 34 | 2.6% |
| Arts & Humanities | 76 | 5.7% |
| Total | 1,327 | 100.0% |
Transportation & Commute in Napili Honokowai
Vehicle Availability by Sex in Napili Honokowai
The most prevalent vehicle ownership categories in Napili Honokowai are males with 2 vehicles (723, accounting for 35.3%) and females with 2 vehicles (792, making up 37.4%).
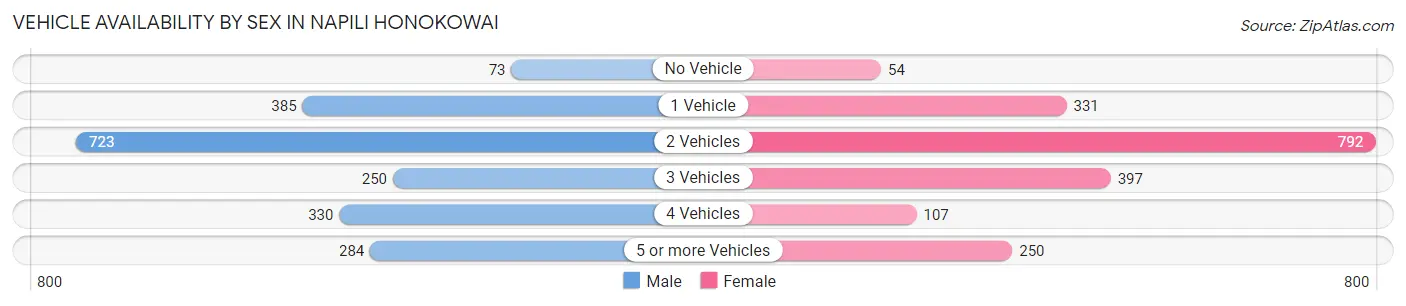
| Vehicles Available | Male | Female |
| No Vehicle | 73 (3.6%) | 54 (2.8%) |
| 1 Vehicle | 385 (18.8%) | 331 (17.1%) |
| 2 Vehicles | 723 (35.3%) | 792 (41.0%) |
| 3 Vehicles | 250 (12.2%) | 397 (20.6%) |
| 4 Vehicles | 330 (16.1%) | 107 (5.5%) |
| 5 or more Vehicles | 284 (13.9%) | 250 (13.0%) |
| Total | 2,045 (100.0%) | 1,931 (100.0%) |
Commute Time in Napili Honokowai
The most frequently occuring commute durations in Napili Honokowai are 10 to 14 minutes (1,052 commuters, 28.8%), 15 to 19 minutes (804 commuters, 22.0%), and 5 to 9 minutes (575 commuters, 15.7%).
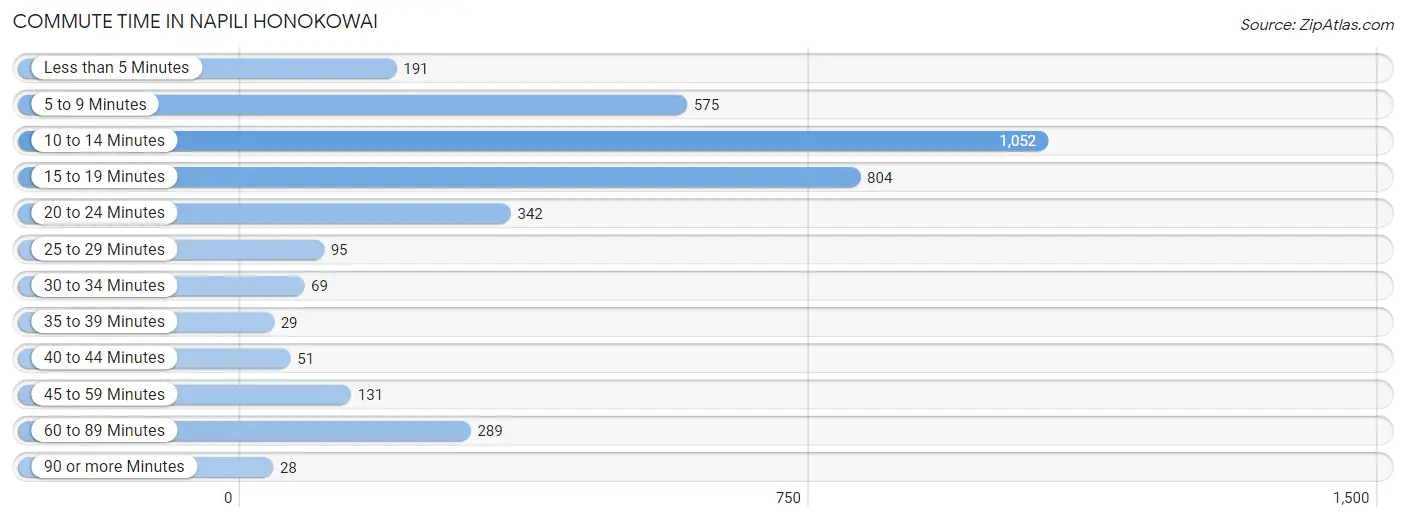
| Commute Time | # Commuters | % Commuters |
| Less than 5 Minutes | 191 | 5.2% |
| 5 to 9 Minutes | 575 | 15.7% |
| 10 to 14 Minutes | 1,052 | 28.8% |
| 15 to 19 Minutes | 804 | 22.0% |
| 20 to 24 Minutes | 342 | 9.3% |
| 25 to 29 Minutes | 95 | 2.6% |
| 30 to 34 Minutes | 69 | 1.9% |
| 35 to 39 Minutes | 29 | 0.8% |
| 40 to 44 Minutes | 51 | 1.4% |
| 45 to 59 Minutes | 131 | 3.6% |
| 60 to 89 Minutes | 289 | 7.9% |
| 90 or more Minutes | 28 | 0.8% |
Commute Time by Sex in Napili Honokowai
The most common commute times in Napili Honokowai are 10 to 14 minutes (619 commuters, 31.9%) for males and 10 to 14 minutes (433 commuters, 25.3%) for females.
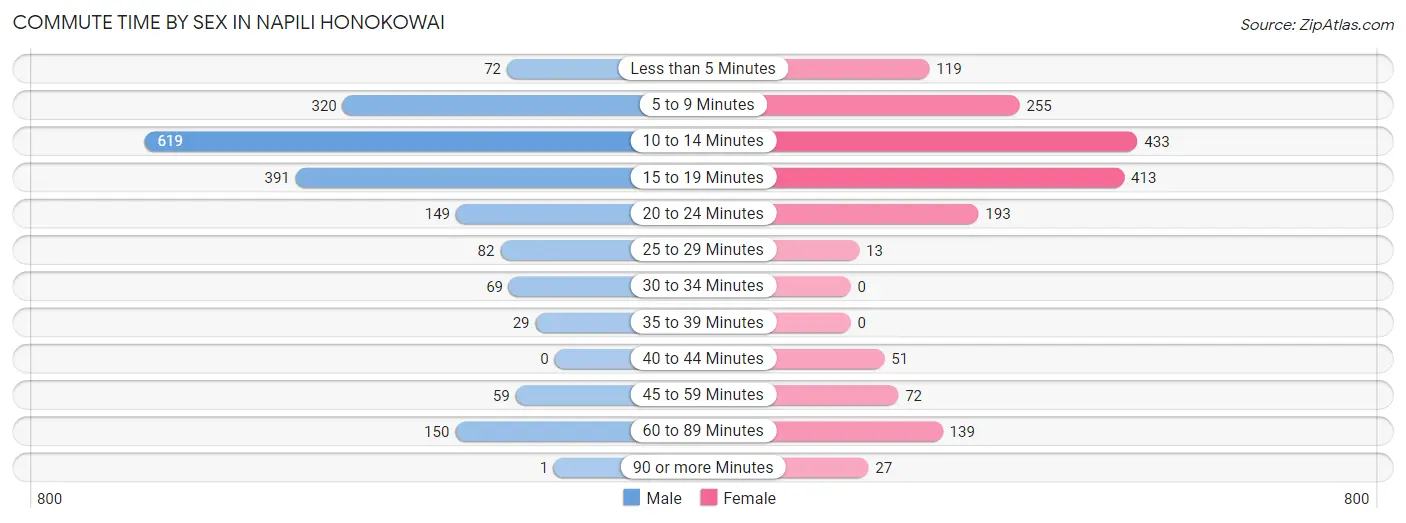
| Commute Time | Male | Female |
| Less than 5 Minutes | 72 (3.7%) | 119 (6.9%) |
| 5 to 9 Minutes | 320 (16.5%) | 255 (14.9%) |
| 10 to 14 Minutes | 619 (31.9%) | 433 (25.3%) |
| 15 to 19 Minutes | 391 (20.1%) | 413 (24.1%) |
| 20 to 24 Minutes | 149 (7.7%) | 193 (11.3%) |
| 25 to 29 Minutes | 82 (4.2%) | 13 (0.8%) |
| 30 to 34 Minutes | 69 (3.5%) | 0 (0.0%) |
| 35 to 39 Minutes | 29 (1.5%) | 0 (0.0%) |
| 40 to 44 Minutes | 0 (0.0%) | 51 (3.0%) |
| 45 to 59 Minutes | 59 (3.0%) | 72 (4.2%) |
| 60 to 89 Minutes | 150 (7.7%) | 139 (8.1%) |
| 90 or more Minutes | 1 (0.1%) | 27 (1.6%) |
Time of Departure to Work by Sex in Napili Honokowai
The most frequent times of departure to work in Napili Honokowai are 12:00 PM to 3:59 PM (467, 24.1%) for males and 9:00 AM to 9:59 AM (257, 15.0%) for females.
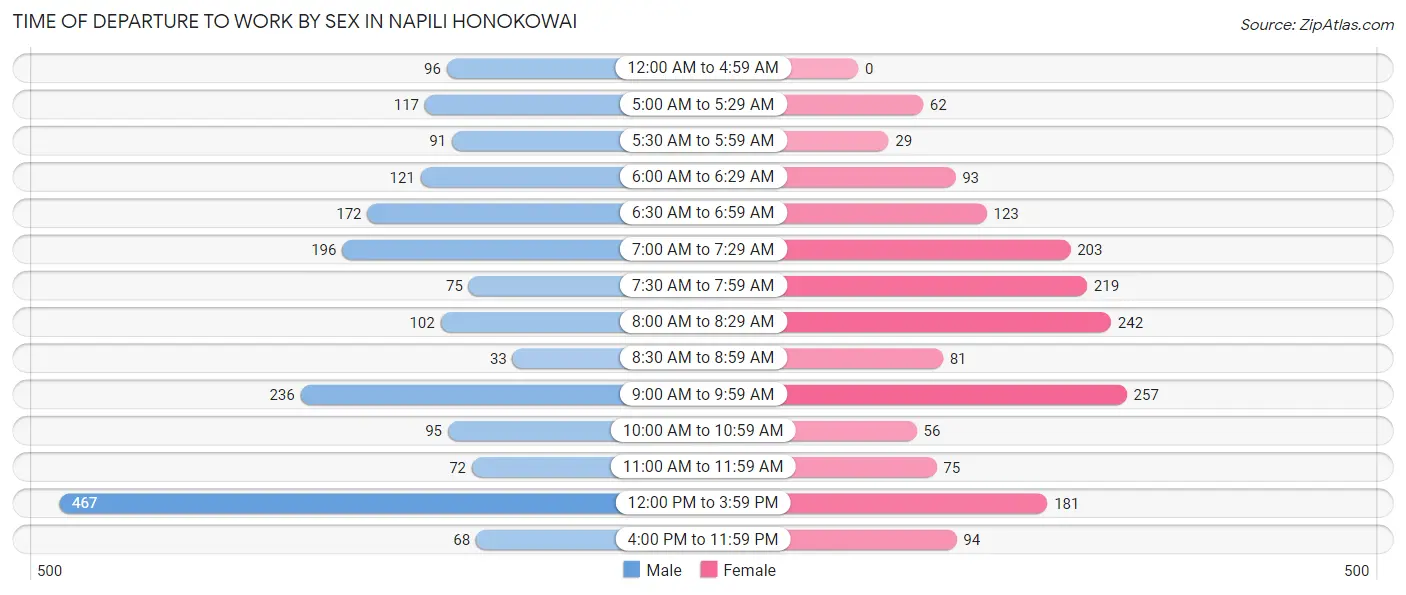
| Time of Departure | Male | Female |
| 12:00 AM to 4:59 AM | 96 (5.0%) | 0 (0.0%) |
| 5:00 AM to 5:29 AM | 117 (6.0%) | 62 (3.6%) |
| 5:30 AM to 5:59 AM | 91 (4.7%) | 29 (1.7%) |
| 6:00 AM to 6:29 AM | 121 (6.2%) | 93 (5.4%) |
| 6:30 AM to 6:59 AM | 172 (8.9%) | 123 (7.2%) |
| 7:00 AM to 7:29 AM | 196 (10.1%) | 203 (11.8%) |
| 7:30 AM to 7:59 AM | 75 (3.9%) | 219 (12.8%) |
| 8:00 AM to 8:29 AM | 102 (5.3%) | 242 (14.1%) |
| 8:30 AM to 8:59 AM | 33 (1.7%) | 81 (4.7%) |
| 9:00 AM to 9:59 AM | 236 (12.2%) | 257 (15.0%) |
| 10:00 AM to 10:59 AM | 95 (4.9%) | 56 (3.3%) |
| 11:00 AM to 11:59 AM | 72 (3.7%) | 75 (4.4%) |
| 12:00 PM to 3:59 PM | 467 (24.1%) | 181 (10.5%) |
| 4:00 PM to 11:59 PM | 68 (3.5%) | 94 (5.5%) |
| Total | 1,941 (100.0%) | 1,715 (100.0%) |
Housing Occupancy in Napili Honokowai
Occupancy by Ownership in Napili Honokowai
Of the total 2,352 dwellings in Napili Honokowai, owner-occupied units account for 1,186 (50.4%), while renter-occupied units make up 1,166 (49.6%).
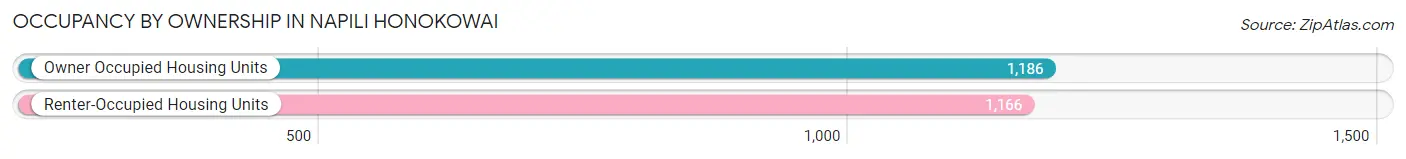
| Occupancy | # Housing Units | % Housing Units |
| Owner Occupied Housing Units | 1,186 | 50.4% |
| Renter-Occupied Housing Units | 1,166 | 49.6% |
| Total Occupied Housing Units | 2,352 | 100.0% |
Occupancy by Household Size in Napili Honokowai
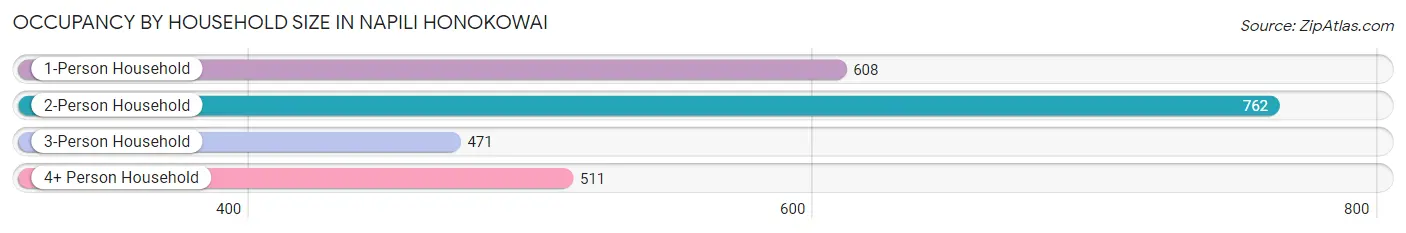
| Household Size | # Housing Units | % Housing Units |
| 1-Person Household | 608 | 25.9% |
| 2-Person Household | 762 | 32.4% |
| 3-Person Household | 471 | 20.0% |
| 4+ Person Household | 511 | 21.7% |
| Total Housing Units | 2,352 | 100.0% |
Occupancy by Ownership by Household Size in Napili Honokowai
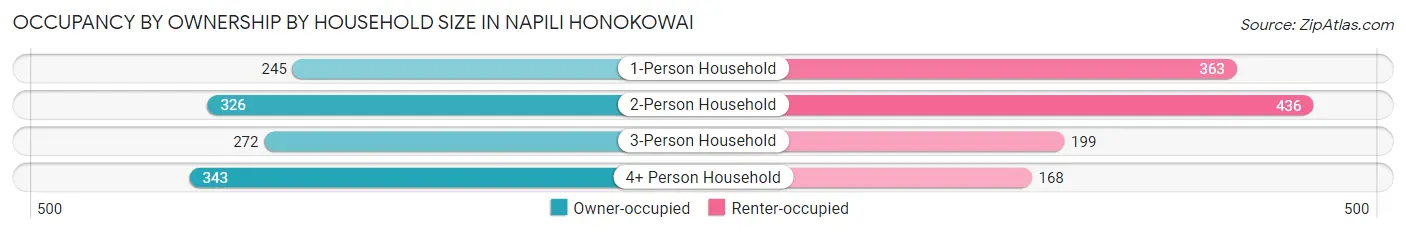
| Household Size | Owner-occupied | Renter-occupied |
| 1-Person Household | 245 (40.3%) | 363 (59.7%) |
| 2-Person Household | 326 (42.8%) | 436 (57.2%) |
| 3-Person Household | 272 (57.8%) | 199 (42.2%) |
| 4+ Person Household | 343 (67.1%) | 168 (32.9%) |
| Total Housing Units | 1,186 (50.4%) | 1,166 (49.6%) |
Occupancy by Educational Attainment in Napili Honokowai
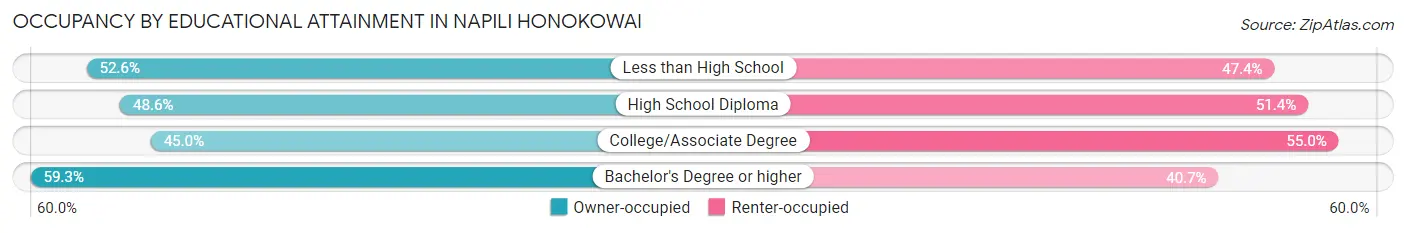
| Household Size | Owner-occupied | Renter-occupied |
| Less than High School | 40 (52.6%) | 36 (47.4%) |
| High School Diploma | 283 (48.6%) | 299 (51.4%) |
| College/Associate Degree | 445 (45.0%) | 544 (55.0%) |
| Bachelor's Degree or higher | 418 (59.3%) | 287 (40.7%) |
Occupancy by Age of Householder in Napili Honokowai
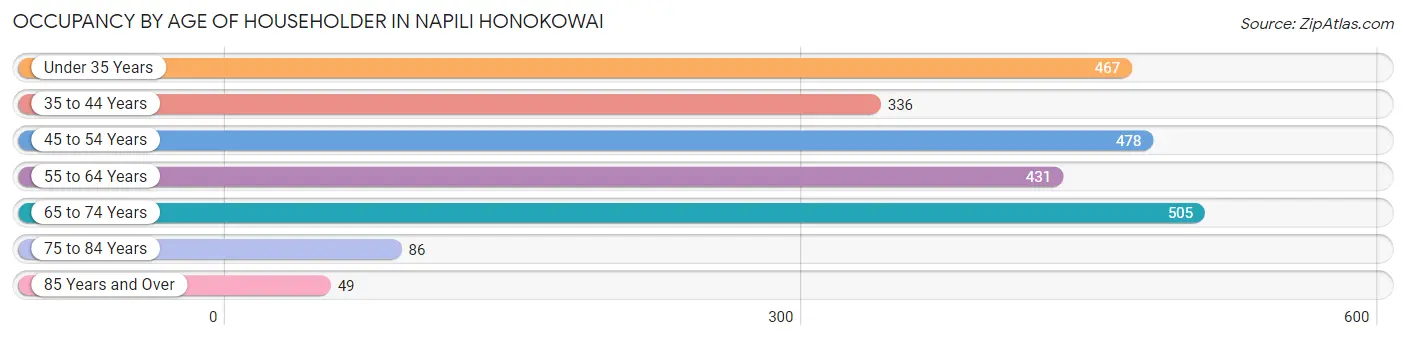
| Age Bracket | # Households | % Households |
| Under 35 Years | 467 | 19.9% |
| 35 to 44 Years | 336 | 14.3% |
| 45 to 54 Years | 478 | 20.3% |
| 55 to 64 Years | 431 | 18.3% |
| 65 to 74 Years | 505 | 21.5% |
| 75 to 84 Years | 86 | 3.7% |
| 85 Years and Over | 49 | 2.1% |
| Total | 2,352 | 100.0% |
Housing Finances in Napili Honokowai
Median Income by Occupancy in Napili Honokowai
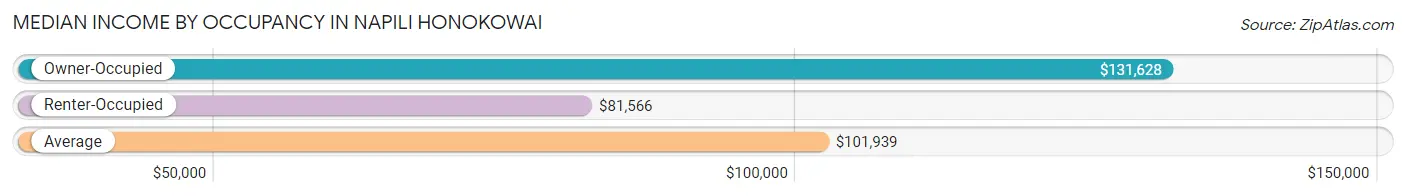
| Occupancy Type | # Households | Median Income |
| Owner-Occupied | 1,186 (50.4%) | $131,628 |
| Renter-Occupied | 1,166 (49.6%) | $81,566 |
| Average | 2,352 (100.0%) | $101,939 |
Occupancy by Householder Income Bracket in Napili Honokowai
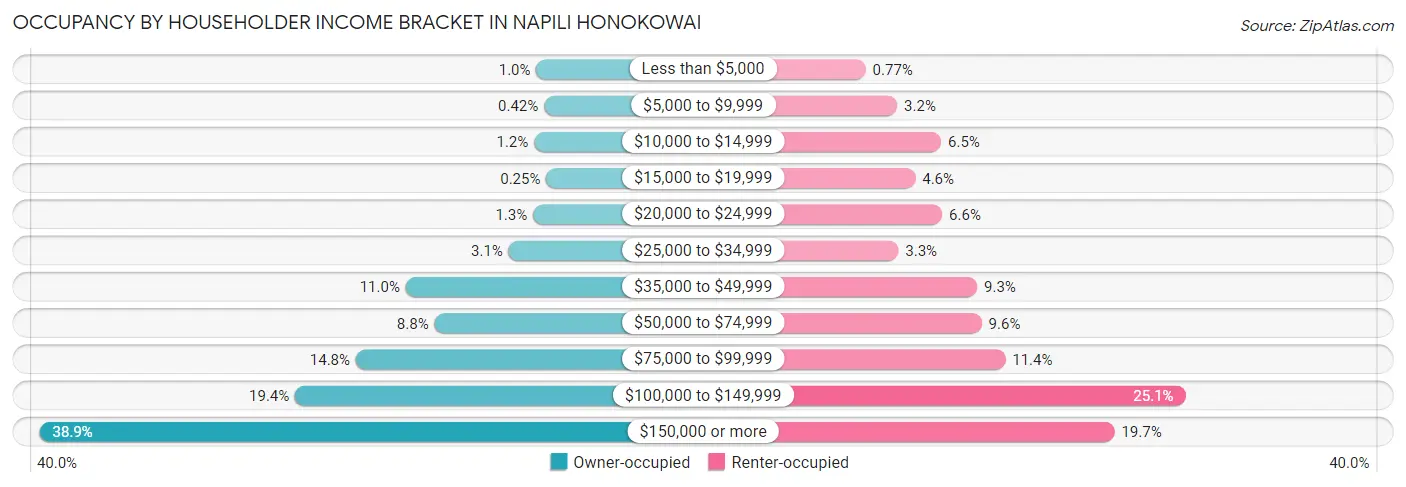
| Income Bracket | Owner-occupied | Renter-occupied |
| Less than $5,000 | 12 (1.0%) | 9 (0.8%) |
| $5,000 to $9,999 | 5 (0.4%) | 37 (3.2%) |
| $10,000 to $14,999 | 14 (1.2%) | 76 (6.5%) |
| $15,000 to $19,999 | 3 (0.3%) | 53 (4.5%) |
| $20,000 to $24,999 | 15 (1.3%) | 77 (6.6%) |
| $25,000 to $34,999 | 37 (3.1%) | 38 (3.3%) |
| $35,000 to $49,999 | 130 (11.0%) | 108 (9.3%) |
| $50,000 to $74,999 | 104 (8.8%) | 112 (9.6%) |
| $75,000 to $99,999 | 175 (14.8%) | 133 (11.4%) |
| $100,000 to $149,999 | 230 (19.4%) | 293 (25.1%) |
| $150,000 or more | 461 (38.9%) | 230 (19.7%) |
| Total | 1,186 (100.0%) | 1,166 (100.0%) |
Monthly Housing Cost Tiers in Napili Honokowai
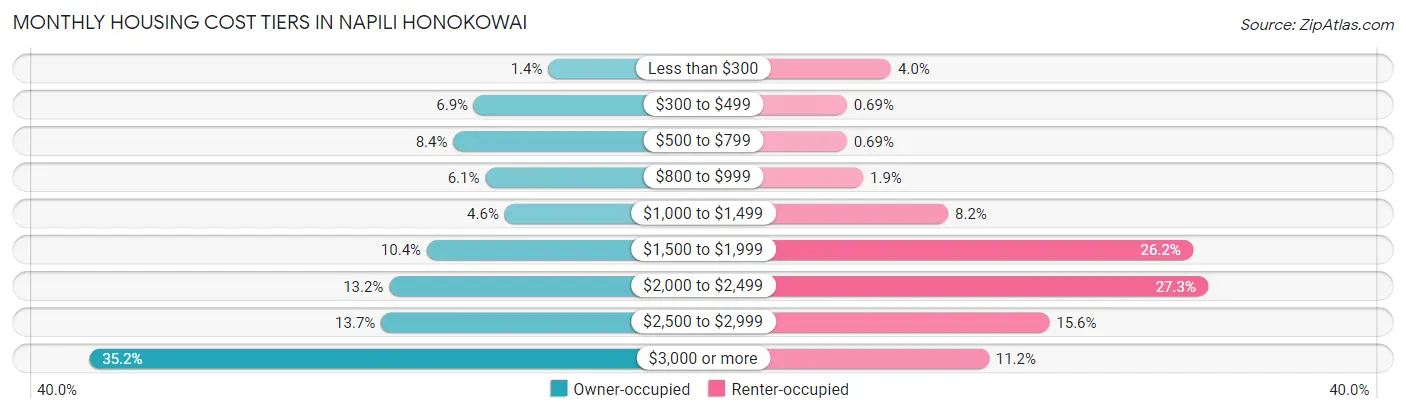
| Monthly Cost | Owner-occupied | Renter-occupied |
| Less than $300 | 17 (1.4%) | 46 (4.0%) |
| $300 to $499 | 82 (6.9%) | 8 (0.7%) |
| $500 to $799 | 100 (8.4%) | 8 (0.7%) |
| $800 to $999 | 72 (6.1%) | 22 (1.9%) |
| $1,000 to $1,499 | 55 (4.6%) | 95 (8.2%) |
| $1,500 to $1,999 | 123 (10.4%) | 305 (26.2%) |
| $2,000 to $2,499 | 156 (13.2%) | 318 (27.3%) |
| $2,500 to $2,999 | 163 (13.7%) | 182 (15.6%) |
| $3,000 or more | 418 (35.2%) | 130 (11.2%) |
| Total | 1,186 (100.0%) | 1,166 (100.0%) |
Physical Housing Characteristics in Napili Honokowai
Housing Structures in Napili Honokowai
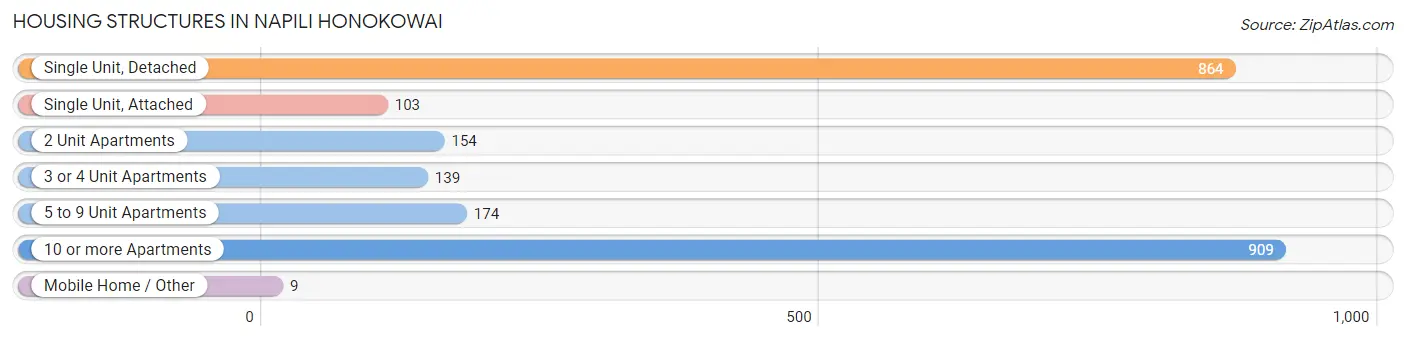
| Structure Type | # Housing Units | % Housing Units |
| Single Unit, Detached | 864 | 36.7% |
| Single Unit, Attached | 103 | 4.4% |
| 2 Unit Apartments | 154 | 6.6% |
| 3 or 4 Unit Apartments | 139 | 5.9% |
| 5 to 9 Unit Apartments | 174 | 7.4% |
| 10 or more Apartments | 909 | 38.7% |
| Mobile Home / Other | 9 | 0.4% |
| Total | 2,352 | 100.0% |
Housing Structures by Occupancy in Napili Honokowai
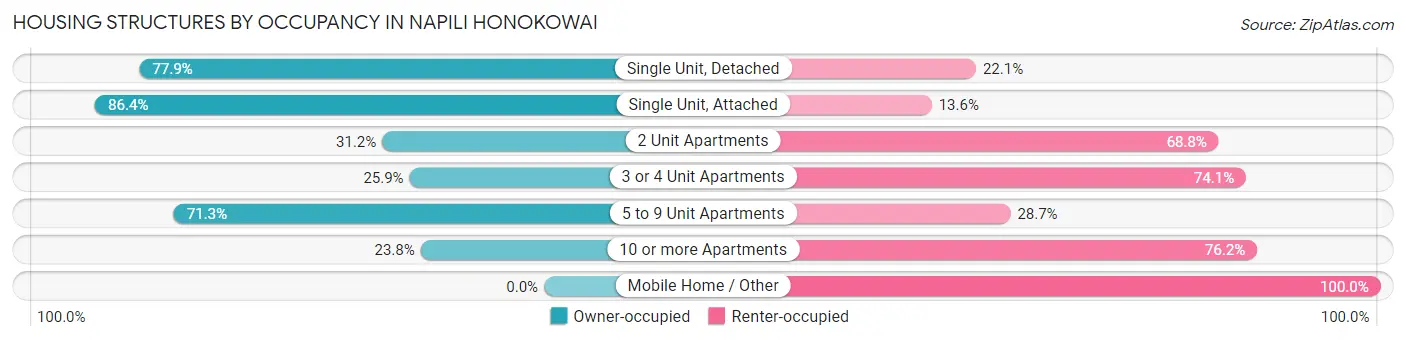
| Structure Type | Owner-occupied | Renter-occupied |
| Single Unit, Detached | 673 (77.9%) | 191 (22.1%) |
| Single Unit, Attached | 89 (86.4%) | 14 (13.6%) |
| 2 Unit Apartments | 48 (31.2%) | 106 (68.8%) |
| 3 or 4 Unit Apartments | 36 (25.9%) | 103 (74.1%) |
| 5 to 9 Unit Apartments | 124 (71.3%) | 50 (28.7%) |
| 10 or more Apartments | 216 (23.8%) | 693 (76.2%) |
| Mobile Home / Other | 0 (0.0%) | 9 (100.0%) |
| Total | 1,186 (50.4%) | 1,166 (49.6%) |
Housing Structures by Number of Rooms in Napili Honokowai
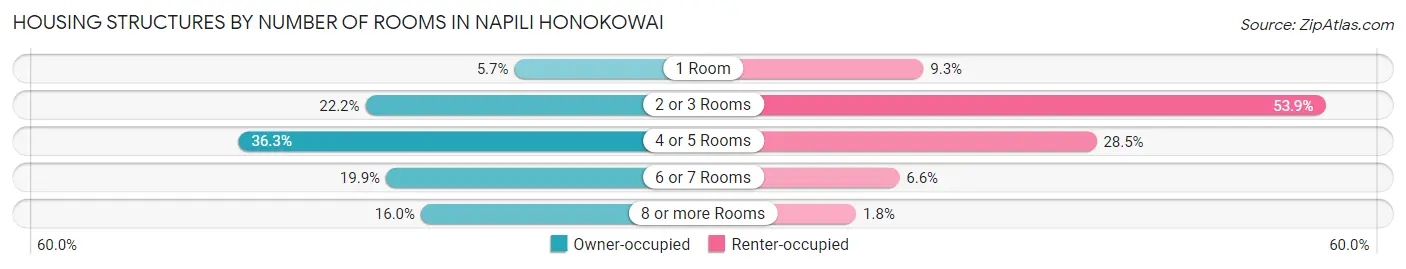
| Number of Rooms | Owner-occupied | Renter-occupied |
| 1 Room | 67 (5.7%) | 108 (9.3%) |
| 2 or 3 Rooms | 263 (22.2%) | 628 (53.9%) |
| 4 or 5 Rooms | 430 (36.3%) | 332 (28.5%) |
| 6 or 7 Rooms | 236 (19.9%) | 77 (6.6%) |
| 8 or more Rooms | 190 (16.0%) | 21 (1.8%) |
| Total | 1,186 (100.0%) | 1,166 (100.0%) |
Housing Structure by Heating Type in Napili Honokowai
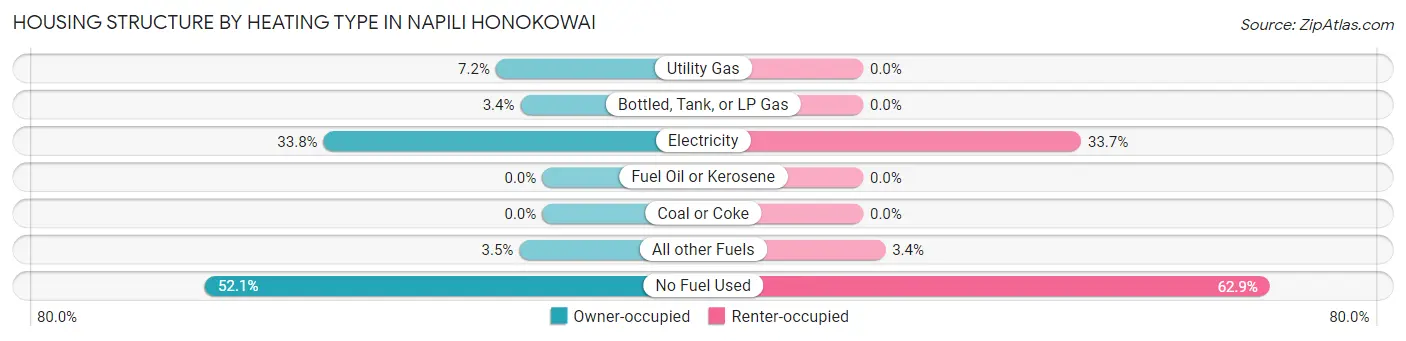
| Heating Type | Owner-occupied | Renter-occupied |
| Utility Gas | 85 (7.2%) | 0 (0.0%) |
| Bottled, Tank, or LP Gas | 40 (3.4%) | 0 (0.0%) |
| Electricity | 401 (33.8%) | 393 (33.7%) |
| Fuel Oil or Kerosene | 0 (0.0%) | 0 (0.0%) |
| Coal or Coke | 0 (0.0%) | 0 (0.0%) |
| All other Fuels | 42 (3.5%) | 40 (3.4%) |
| No Fuel Used | 618 (52.1%) | 733 (62.9%) |
| Total | 1,186 (100.0%) | 1,166 (100.0%) |
Household Vehicle Usage in Napili Honokowai
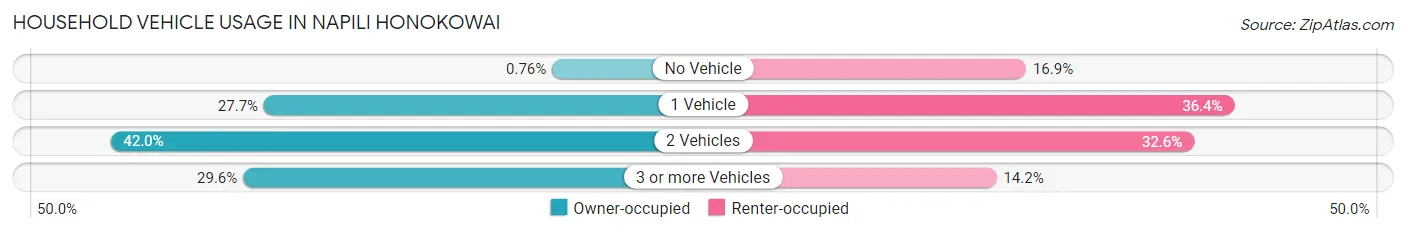
| Vehicles per Household | Owner-occupied | Renter-occupied |
| No Vehicle | 9 (0.8%) | 197 (16.9%) |
| 1 Vehicle | 328 (27.7%) | 424 (36.4%) |
| 2 Vehicles | 498 (42.0%) | 380 (32.6%) |
| 3 or more Vehicles | 351 (29.6%) | 165 (14.1%) |
| Total | 1,186 (100.0%) | 1,166 (100.0%) |
Real Estate & Mortgages in Napili Honokowai
Real Estate and Mortgage Overview in Napili Honokowai
| Characteristic | Without Mortgage | With Mortgage |
| Housing Units | 329 | 857 |
| Median Property Value | $599,500 | $796,600 |
| Median Household Income | $95,528 | $398 |
| Monthly Housing Costs | $699 | $407 |
| Real Estate Taxes | $1,435 | $32 |
Property Value by Mortgage Status in Napili Honokowai
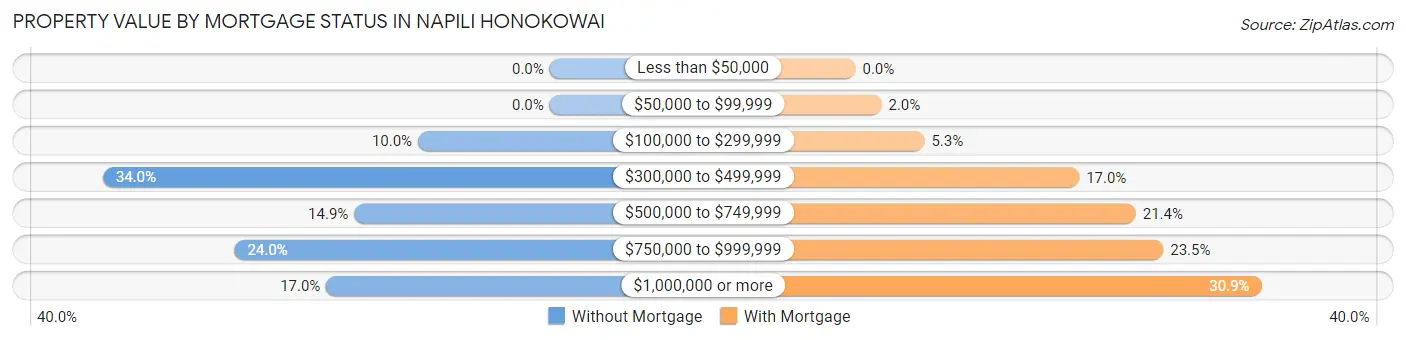
| Property Value | Without Mortgage | With Mortgage |
| Less than $50,000 | 0 (0.0%) | 0 (0.0%) |
| $50,000 to $99,999 | 0 (0.0%) | 17 (2.0%) |
| $100,000 to $299,999 | 33 (10.0%) | 45 (5.2%) |
| $300,000 to $499,999 | 112 (34.0%) | 146 (17.0%) |
| $500,000 to $749,999 | 49 (14.9%) | 183 (21.3%) |
| $750,000 to $999,999 | 79 (24.0%) | 201 (23.4%) |
| $1,000,000 or more | 56 (17.0%) | 265 (30.9%) |
| Total | 329 (100.0%) | 857 (100.0%) |
Household Income by Mortgage Status in Napili Honokowai
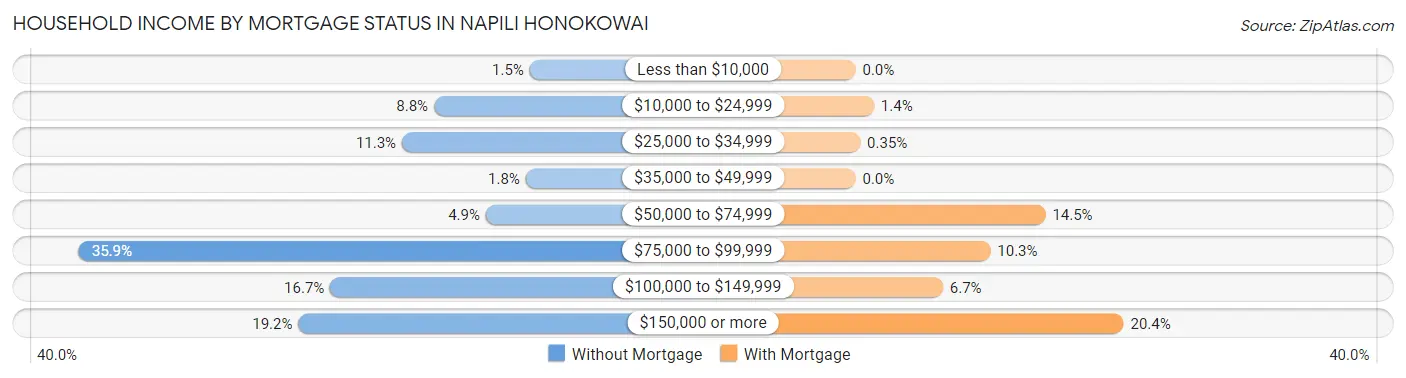
| Household Income | Without Mortgage | With Mortgage |
| Less than $10,000 | 5 (1.5%) | 0 (0.0%) |
| $10,000 to $24,999 | 29 (8.8%) | 12 (1.4%) |
| $25,000 to $34,999 | 37 (11.3%) | 3 (0.4%) |
| $35,000 to $49,999 | 6 (1.8%) | 0 (0.0%) |
| $50,000 to $74,999 | 16 (4.9%) | 124 (14.5%) |
| $75,000 to $99,999 | 118 (35.9%) | 88 (10.3%) |
| $100,000 to $149,999 | 55 (16.7%) | 57 (6.7%) |
| $150,000 or more | 63 (19.2%) | 175 (20.4%) |
| Total | 329 (100.0%) | 857 (100.0%) |
Property Value to Household Income Ratio in Napili Honokowai
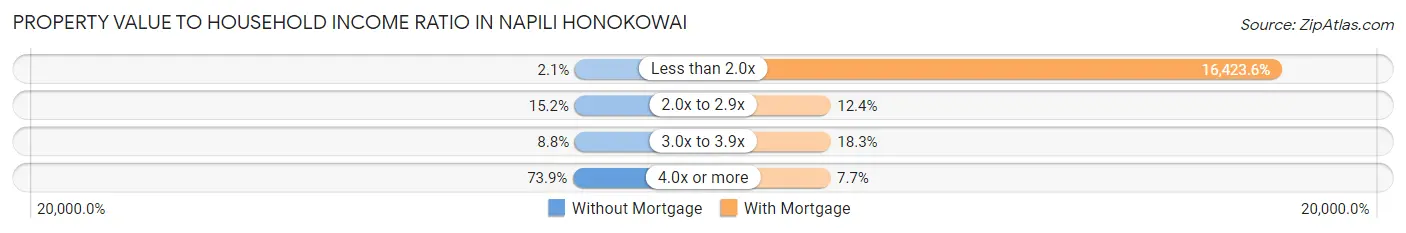
| Value-to-Income Ratio | Without Mortgage | With Mortgage |
| Less than 2.0x | 7 (2.1%) | 140,750 (16,423.6%) |
| 2.0x to 2.9x | 50 (15.2%) | 106 (12.4%) |
| 3.0x to 3.9x | 29 (8.8%) | 157 (18.3%) |
| 4.0x or more | 243 (73.9%) | 66 (7.7%) |
| Total | 329 (100.0%) | 857 (100.0%) |
Real Estate Taxes by Mortgage Status in Napili Honokowai
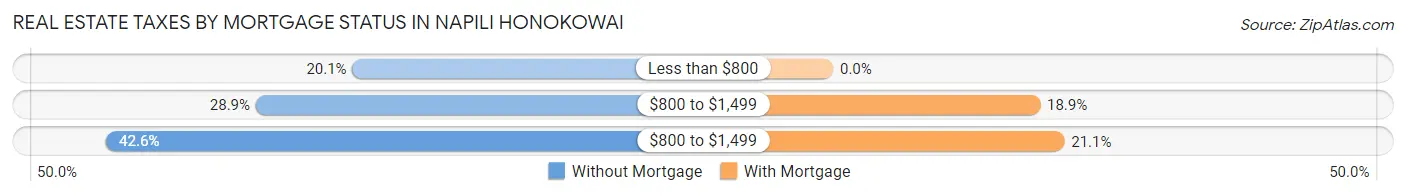
| Property Taxes | Without Mortgage | With Mortgage |
| Less than $800 | 66 (20.1%) | 0 (0.0%) |
| $800 to $1,499 | 95 (28.9%) | 162 (18.9%) |
| $800 to $1,499 | 140 (42.5%) | 181 (21.1%) |
| Total | 329 (100.0%) | 857 (100.0%) |
Health & Disability in Napili Honokowai
Health Insurance Coverage by Age in Napili Honokowai
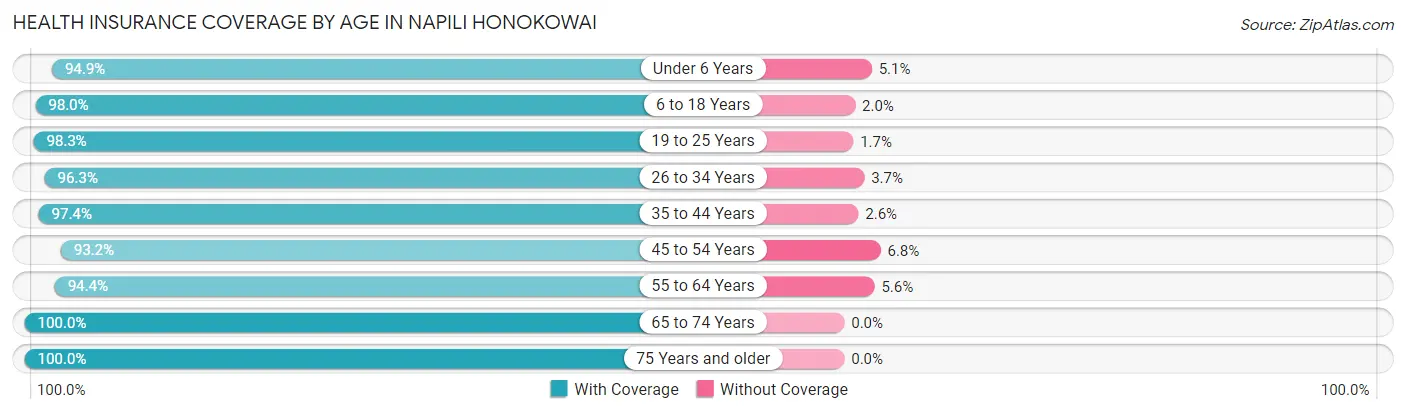
| Age Bracket | With Coverage | Without Coverage |
| Under 6 Years | 483 (94.9%) | 26 (5.1%) |
| 6 to 18 Years | 925 (98.0%) | 19 (2.0%) |
| 19 to 25 Years | 414 (98.3%) | 7 (1.7%) |
| 26 to 34 Years | 933 (96.3%) | 36 (3.7%) |
| 35 to 44 Years | 1,114 (97.4%) | 30 (2.6%) |
| 45 to 54 Years | 814 (93.2%) | 59 (6.8%) |
| 55 to 64 Years | 788 (94.4%) | 47 (5.6%) |
| 65 to 74 Years | 833 (100.0%) | 0 (0.0%) |
| 75 Years and older | 235 (100.0%) | 0 (0.0%) |
| Total | 6,539 (96.7%) | 224 (3.3%) |
Health Insurance Coverage by Citizenship Status in Napili Honokowai
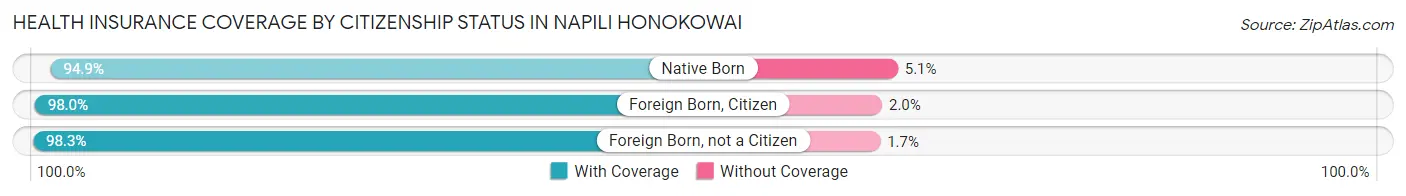
| Citizenship Status | With Coverage | Without Coverage |
| Native Born | 483 (94.9%) | 26 (5.1%) |
| Foreign Born, Citizen | 925 (98.0%) | 19 (2.0%) |
| Foreign Born, not a Citizen | 414 (98.3%) | 7 (1.7%) |
Health Insurance Coverage by Household Income in Napili Honokowai
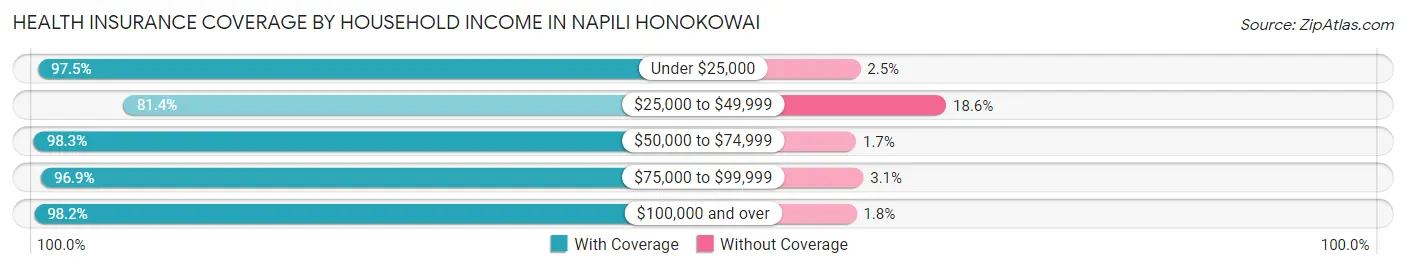
| Household Income | With Coverage | Without Coverage |
| Under $25,000 | 460 (97.5%) | 12 (2.5%) |
| $25,000 to $49,999 | 433 (81.4%) | 99 (18.6%) |
| $50,000 to $74,999 | 455 (98.3%) | 8 (1.7%) |
| $75,000 to $99,999 | 721 (96.9%) | 23 (3.1%) |
| $100,000 and over | 4,459 (98.2%) | 82 (1.8%) |
Public vs Private Health Insurance Coverage by Age in Napili Honokowai
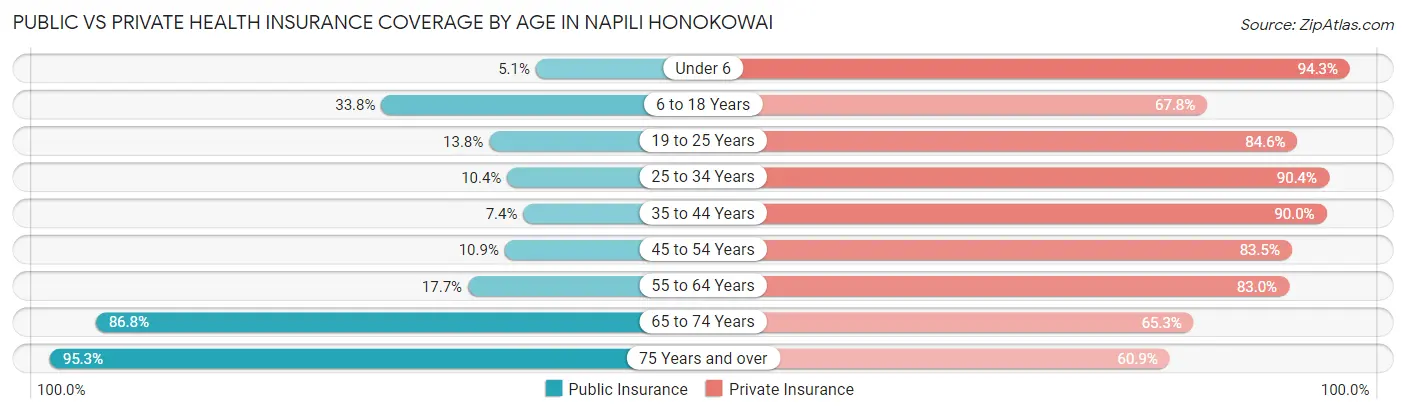
| Age Bracket | Public Insurance | Private Insurance |
| Under 6 | 26 (5.1%) | 480 (94.3%) |
| 6 to 18 Years | 319 (33.8%) | 640 (67.8%) |
| 19 to 25 Years | 58 (13.8%) | 356 (84.6%) |
| 25 to 34 Years | 101 (10.4%) | 876 (90.4%) |
| 35 to 44 Years | 85 (7.4%) | 1,029 (89.9%) |
| 45 to 54 Years | 95 (10.9%) | 729 (83.5%) |
| 55 to 64 Years | 148 (17.7%) | 693 (83.0%) |
| 65 to 74 Years | 723 (86.8%) | 544 (65.3%) |
| 75 Years and over | 224 (95.3%) | 143 (60.9%) |
| Total | 1,779 (26.3%) | 5,490 (81.2%) |
Disability Status by Sex by Age in Napili Honokowai
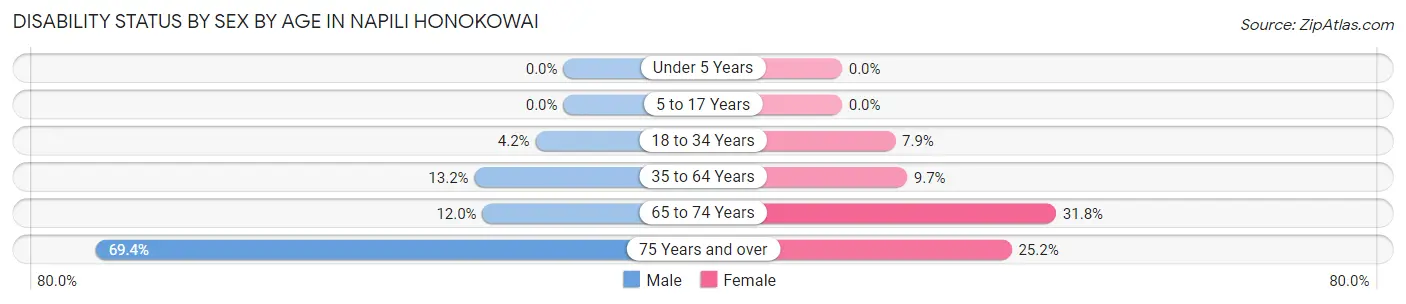
| Age Bracket | Male | Female |
| Under 5 Years | 0 (0.0%) | 0 (0.0%) |
| 5 to 17 Years | 0 (0.0%) | 0 (0.0%) |
| 18 to 34 Years | 28 (4.2%) | 59 (7.9%) |
| 35 to 64 Years | 188 (13.2%) | 138 (9.7%) |
| 65 to 74 Years | 43 (12.0%) | 151 (31.8%) |
| 75 Years and over | 75 (69.4%) | 32 (25.2%) |
Disability Class by Sex by Age in Napili Honokowai
Disability Class: Hearing Difficulty
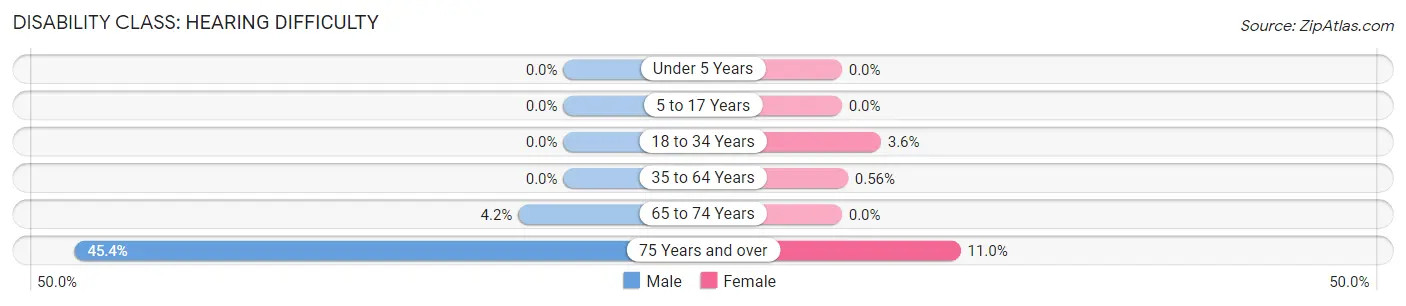
| Age Bracket | Male | Female |
| Under 5 Years | 0 (0.0%) | 0 (0.0%) |
| 5 to 17 Years | 0 (0.0%) | 0 (0.0%) |
| 18 to 34 Years | 0 (0.0%) | 27 (3.6%) |
| 35 to 64 Years | 0 (0.0%) | 8 (0.6%) |
| 65 to 74 Years | 15 (4.2%) | 0 (0.0%) |
| 75 Years and over | 49 (45.4%) | 14 (11.0%) |
Disability Class: Vision Difficulty
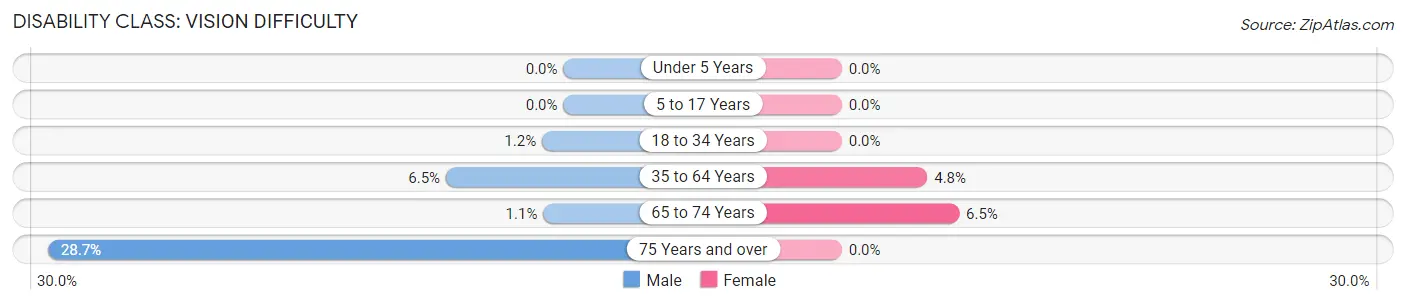
| Age Bracket | Male | Female |
| Under 5 Years | 0 (0.0%) | 0 (0.0%) |
| 5 to 17 Years | 0 (0.0%) | 0 (0.0%) |
| 18 to 34 Years | 8 (1.2%) | 0 (0.0%) |
| 35 to 64 Years | 93 (6.5%) | 68 (4.8%) |
| 65 to 74 Years | 4 (1.1%) | 31 (6.5%) |
| 75 Years and over | 31 (28.7%) | 0 (0.0%) |
Disability Class: Cognitive Difficulty
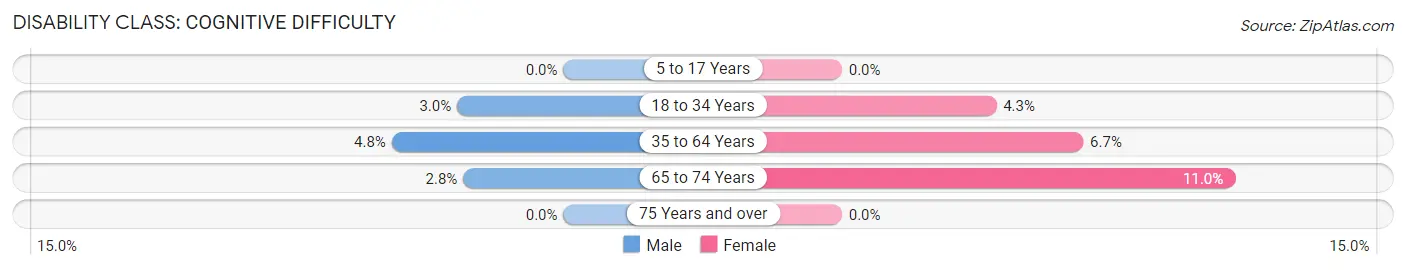
| Age Bracket | Male | Female |
| 5 to 17 Years | 0 (0.0%) | 0 (0.0%) |
| 18 to 34 Years | 20 (3.0%) | 32 (4.3%) |
| 35 to 64 Years | 68 (4.8%) | 96 (6.7%) |
| 65 to 74 Years | 10 (2.8%) | 52 (11.0%) |
| 75 Years and over | 0 (0.0%) | 0 (0.0%) |
Disability Class: Ambulatory Difficulty
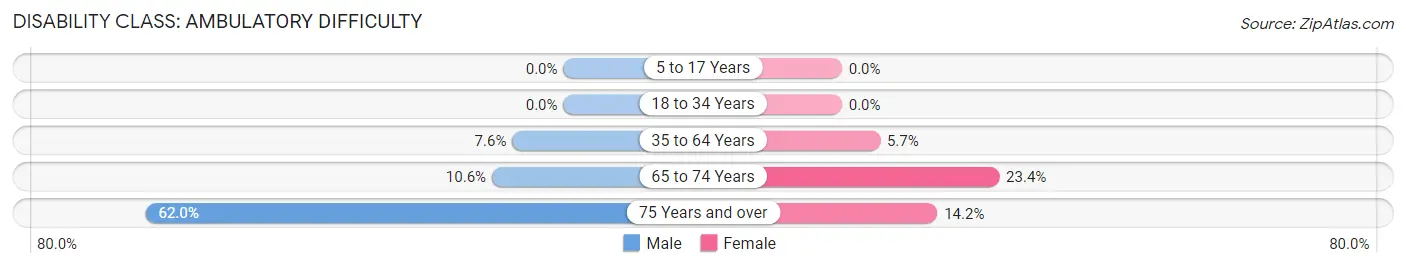
| Age Bracket | Male | Female |
| 5 to 17 Years | 0 (0.0%) | 0 (0.0%) |
| 18 to 34 Years | 0 (0.0%) | 0 (0.0%) |
| 35 to 64 Years | 108 (7.6%) | 81 (5.7%) |
| 65 to 74 Years | 38 (10.6%) | 111 (23.4%) |
| 75 Years and over | 67 (62.0%) | 18 (14.2%) |
Disability Class: Self-Care Difficulty
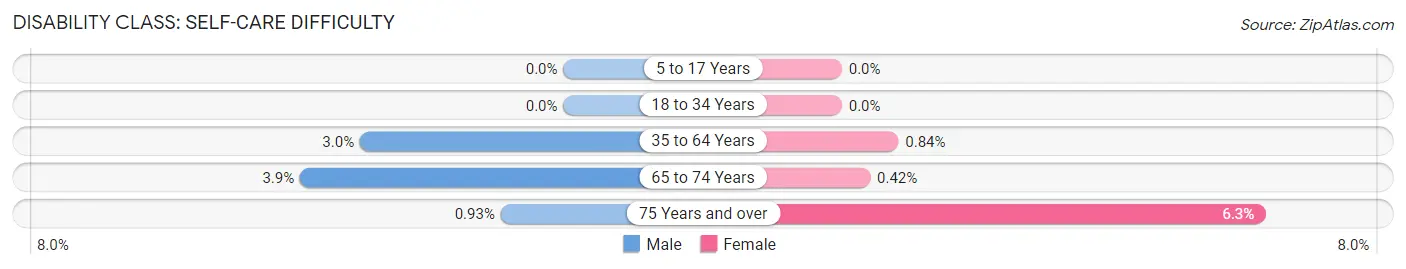
| Age Bracket | Male | Female |
| 5 to 17 Years | 0 (0.0%) | 0 (0.0%) |
| 18 to 34 Years | 0 (0.0%) | 0 (0.0%) |
| 35 to 64 Years | 43 (3.0%) | 12 (0.8%) |
| 65 to 74 Years | 14 (3.9%) | 2 (0.4%) |
| 75 Years and over | 1 (0.9%) | 8 (6.3%) |
Technology Access in Napili Honokowai
Computing Device Access in Napili Honokowai
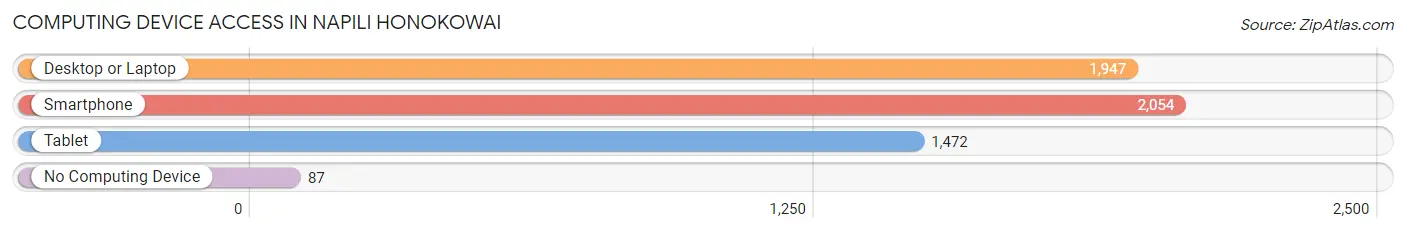
| Device Type | # Households | % Households |
| Desktop or Laptop | 1,947 | 82.8% |
| Smartphone | 2,054 | 87.3% |
| Tablet | 1,472 | 62.6% |
| No Computing Device | 87 | 3.7% |
| Total | 2,352 | 100.0% |
Internet Access in Napili Honokowai
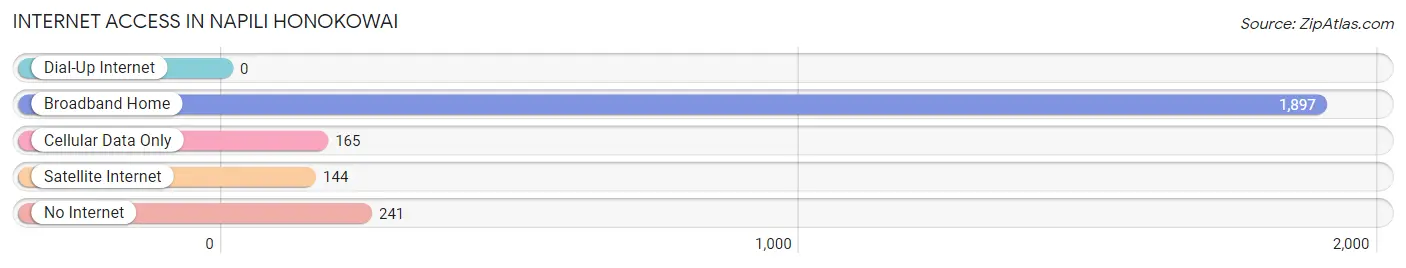
| Internet Type | # Households | % Households |
| Dial-Up Internet | 0 | 0.0% |
| Broadband Home | 1,897 | 80.6% |
| Cellular Data Only | 165 | 7.0% |
| Satellite Internet | 144 | 6.1% |
| No Internet | 241 | 10.2% |
| Total | 2,352 | 100.0% |
Napili Honokowai Summary
History
Napili Honokowai is a census-designated place (CDP) located in Maui County, Hawaii, United States. It is situated on the western side of the island of Maui, between the towns of Lahaina and Kapalua. The area is known for its beautiful beaches, lush tropical vegetation, and laid-back atmosphere.
The area was first settled by Polynesian voyagers in the late 1700s. The first Europeans to arrive in the area were whalers, who established a whaling station in the area in the early 1800s. The whalers were followed by missionaries, who established a mission in the area in 1823.
In the late 1800s, the area was developed as a sugar plantation. The plantation was owned by the Honokowai Sugar Company, which was founded in 1891. The plantation was eventually sold to the Maui Land and Pineapple Company in the early 1900s.
The area was developed as a tourist destination in the 1950s. The Honokowai Beach Resort was built in the area in 1954, and the area has since become a popular destination for tourists.
Geography
Napili Honokowai is located on the western side of the island of Maui, between the towns of Lahaina and Kapalua. The area is bordered by the Pacific Ocean to the west, and the Honokowai Stream to the east. The area is known for its beautiful beaches, lush tropical vegetation, and laid-back atmosphere.
The area has a tropical climate, with warm temperatures year-round. The average temperature in the area is around 75°F (24°C). The area receives an average of around 20 inches (51 cm) of rain per year.
Economy
The economy of Napili Honokowai is largely based on tourism. The area is home to several resorts, including the Honokowai Beach Resort, which was built in 1954. The area is also home to several restaurants, shops, and other businesses catering to tourists.
The area is also home to several agricultural operations, including pineapple and sugarcane plantations. The area is also home to several fishing operations, which provide fresh seafood to local restaurants and markets.
Demographics
As of the 2010 census, the population of Napili Honokowai was 2,845. The population is largely made up of Native Hawaiians and other Pacific Islanders, with a small percentage of other ethnicities. The median age in the area is 44.
The median household income in the area is $60,000, and the median home value is $521,000. The area has a high rate of homeownership, with around 75% of households owning their own homes.
Conclusion
Napili Honokowai is a beautiful and laid-back area located on the western side of the island of Maui. The area has a rich history, with the first settlers arriving in the late 1700s. The area is known for its beautiful beaches, lush tropical vegetation, and laid-back atmosphere. The economy of the area is largely based on tourism, with several resorts, restaurants, and other businesses catering to tourists. The population of the area is largely made up of Native Hawaiians and other Pacific Islanders, with a small percentage of other ethnicities. The median household income in the area is $60,000, and the median home value is $521,000.
Common Questions
What is Per Capita Income in Napili Honokowai?
Per Capita income in Napili Honokowai is $60,258.
What is the Median Family Income in Napili Honokowai?
Median Family Income in Napili Honokowai is $114,438.
What is the Median Household income in Napili Honokowai?
Median Household Income in Napili Honokowai is $101,939.
What is Income or Wage Gap in Napili Honokowai?
Income or Wage Gap in Napili Honokowai is 10.8%.
Women in Napili Honokowai earn 89.2 cents for every dollar earned by a man.
What is Family Income Deficit in Napili Honokowai?
Family Income Deficit in Napili Honokowai is $5,071.
Families that are below poverty line in Napili Honokowai earn $5,071 less on average than the poverty threshold level.
What is Inequality or Gini Index in Napili Honokowai?
Inequality or Gini Index in Napili Honokowai is 0.55.
What is the Total Population of Napili Honokowai?
Total Population of Napili Honokowai is 6,779.
What is the Total Male Population of Napili Honokowai?
Total Male Population of Napili Honokowai is 3,312.
What is the Total Female Population of Napili Honokowai?
Total Female Population of Napili Honokowai is 3,467.
What is the Ratio of Males per 100 Females in Napili Honokowai?
There are 95.53 Males per 100 Females in Napili Honokowai.
What is the Ratio of Females per 100 Males in Napili Honokowai?
There are 104.68 Females per 100 Males in Napili Honokowai.
What is the Median Population Age in Napili Honokowai?
Median Population Age in Napili Honokowai is 39.5 Years.
What is the Average Family Size in Napili Honokowai
Average Family Size in Napili Honokowai is 3.4 People.
What is the Average Household Size in Napili Honokowai
Average Household Size in Napili Honokowai is 2.9 People.
How Large is the Labor Force in Napili Honokowai?
There are 4,310 People in the Labor Forcein in Napili Honokowai.
What is the Percentage of People in the Labor Force in Napili Honokowai?
77.9% of People are in the Labor Force in Napili Honokowai.
What is the Unemployment Rate in Napili Honokowai?
Unemployment Rate in Napili Honokowai is 7.1%.