Cities with the Largest Taiwanese Community in the United States
RELATED REPORTS & OPTIONS
Taiwanese
United States
Compare Cities
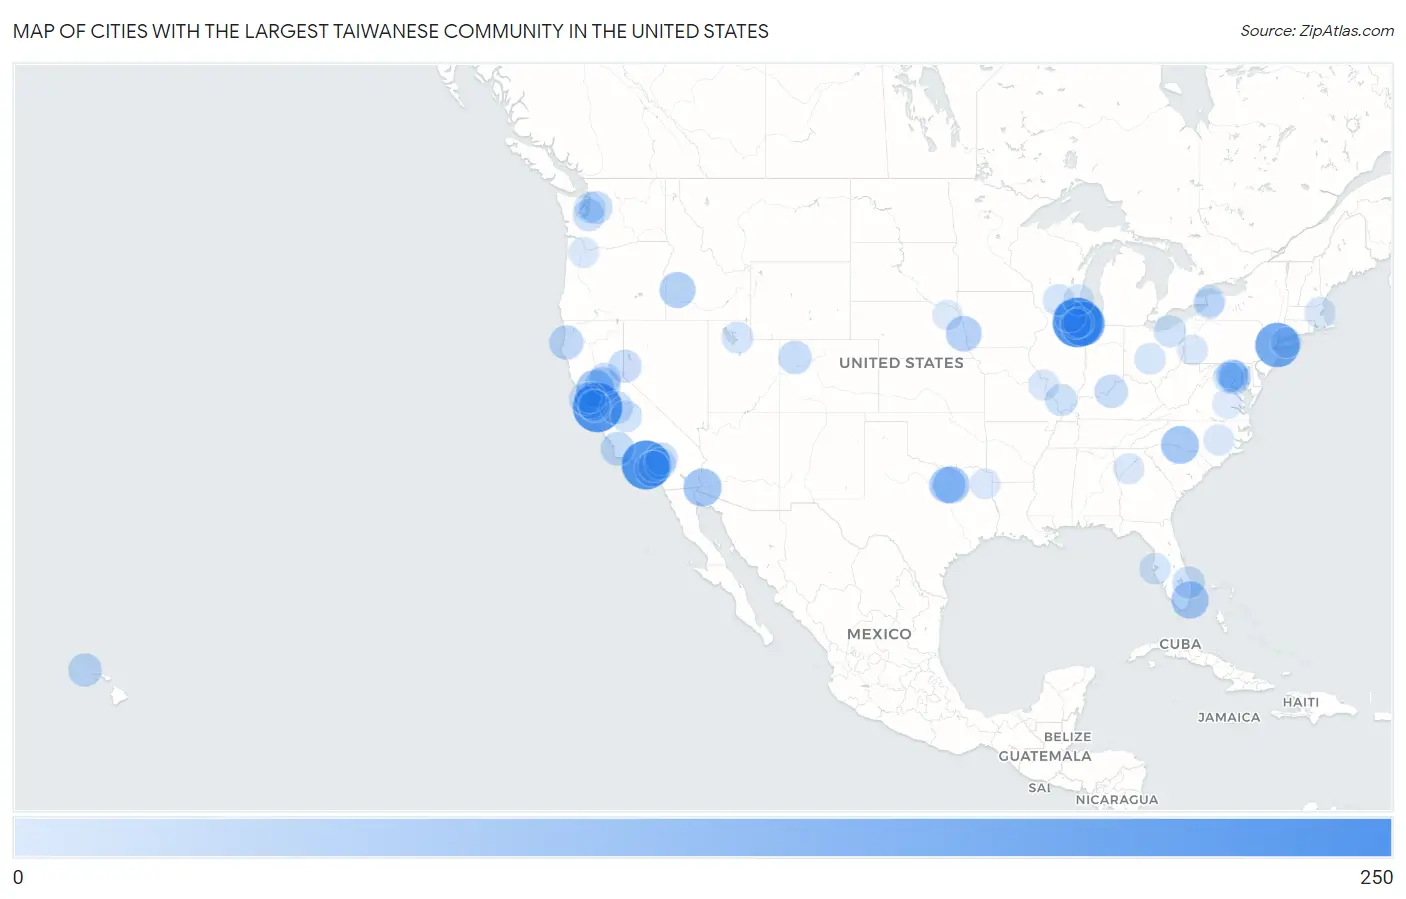
Map of Cities with the Largest Taiwanese Community in the United States
0
250
Cities with the Largest Taiwanese Community in the United States
| City | Taiwanese | vs State | vs National | |
| 1. | Glendale Heights | 248 | 482(51.45%)#1 | 3,248(7.64%)#1 |
| 2. | San Jose | 245 | 1,045(23.44%)#1 | 3,248(7.54%)#2 |
| 3. | Los Angeles | 241 | 1,045(23.06%)#2 | 3,248(7.42%)#3 |
| 4. | New York | 182 | 222(81.98%)#1 | 3,248(5.60%)#4 |
| 5. | Chicago | 182 | 482(37.76%)#2 | 3,248(5.60%)#5 |
| 6. | Fortuna Foothills | 98 | 98(100.00%)#1 | 3,248(3.02%)#6 |
| 7. | Charlotte | 95 | 103(92.23%)#1 | 3,248(2.92%)#7 |
| 8. | Vacaville | 92 | 1,045(8.80%)#3 | 3,248(2.83%)#8 |
| 9. | Miami Beach | 89 | 131(67.94%)#1 | 3,248(2.74%)#9 |
| 10. | Irving | 81 | 178(45.51%)#1 | 3,248(2.49%)#10 |
| 11. | North Richland Hills | 77 | 178(43.26%)#2 | 3,248(2.37%)#11 |
| 12. | Boise City | 72 | 72(100.00%)#1 | 3,248(2.22%)#12 |
| 13. | Sacramento | 68 | 1,045(6.51%)#4 | 3,248(2.09%)#13 |
| 14. | Omaha | 68 | 70(97.14%)#1 | 3,248(2.09%)#14 |
| 15. | Garden Grove | 68 | 1,045(6.51%)#5 | 3,248(2.09%)#15 |
| 16. | Arcata | 51 | 1,045(4.88%)#6 | 3,248(1.57%)#16 |
| 17. | Santa Maria | 43 | 1,045(4.11%)#7 | 3,248(1.32%)#17 |
| 18. | Urban Honolulu | 42 | 42(100.00%)#1 | 3,248(1.29%)#18 |
| 19. | Meeker | 40 | 40(100.00%)#1 | 3,248(1.23%)#19 |
| 20. | Louisville | 38 | 38(100.00%)#1 | 3,248(1.17%)#20 |
| 21. | Reno | 35 | 35(100.00%)#1 | 3,248(1.08%)#21 |
| 22. | Merced | 35 | 1,045(3.35%)#8 | 3,248(1.08%)#22 |
| 23. | Burlingame | 30 | 1,045(2.87%)#9 | 3,248(0.92%)#23 |
| 24. | Carnation | 30 | 70(42.86%)#1 | 3,248(0.92%)#24 |
| 25. | Hesperia | 29 | 1,045(2.78%)#10 | 3,248(0.89%)#25 |
| 26. | Jupiter Farms | 27 | 131(20.61%)#2 | 3,248(0.83%)#26 |
| 27. | Tacoma | 26 | 70(37.14%)#2 | 3,248(0.80%)#27 |
| 28. | San Francisco | 25 | 1,045(2.39%)#11 | 3,248(0.77%)#28 |
| 29. | Potomac | 24 | 74(32.43%)#1 | 3,248(0.74%)#29 |
| 30. | Carbondale | 24 | 482(4.98%)#3 | 3,248(0.74%)#30 |
| 31. | Sunnyvale | 23 | 1,045(2.20%)#12 | 3,248(0.71%)#31 |
| 32. | Lincoln | 22 | 1,045(2.11%)#13 | 3,248(0.68%)#32 |
| 33. | Shaker Heights | 22 | 90(24.44%)#1 | 3,248(0.68%)#33 |
| 34. | Marengo | 22 | 482(4.56%)#4 | 3,248(0.68%)#34 |
| 35. | Rialto | 19 | 1,045(1.82%)#14 | 3,248(0.58%)#35 |
| 36. | Silver Spring | 19 | 74(25.68%)#2 | 3,248(0.58%)#36 |
| 37. | South Weber | 18 | 18(100.00%)#1 | 3,248(0.55%)#37 |
| 38. | Fresno | 16 | 1,045(1.53%)#15 | 3,248(0.49%)#38 |
| 39. | Madison | 16 | 32(50.00%)#1 | 3,248(0.49%)#39 |
| 40. | Washington | 15 | 15(100.00%)#1 | 3,248(0.46%)#40 |
| 41. | St Petersburg | 15 | 131(11.45%)#3 | 3,248(0.46%)#41 |
| 42. | Seattle | 14 | 70(20.00%)#3 | 3,248(0.43%)#42 |
| 43. | Columbus | 13 | 90(14.44%)#2 | 3,248(0.40%)#43 |
| 44. | Berkeley | 13 | 1,045(1.24%)#16 | 3,248(0.40%)#44 |
| 45. | Mountain View | 13 | 1,045(1.24%)#17 | 3,248(0.40%)#45 |
| 46. | Rockville | 13 | 74(17.57%)#3 | 3,248(0.40%)#46 |
| 47. | Herndon | 13 | 14(92.86%)#1 | 3,248(0.40%)#47 |
| 48. | Rowland Heights | 12 | 1,045(1.15%)#18 | 3,248(0.37%)#48 |
| 49. | Milwaukee | 11 | 32(34.38%)#2 | 3,248(0.34%)#49 |
| 50. | University At Buffalo | 11 | 222(4.95%)#2 | 3,248(0.34%)#50 |
| 51. | Malden | 10 | 19(52.63%)#1 | 3,248(0.31%)#51 |
| 52. | Greenlawn | 10 | 222(4.50%)#3 | 3,248(0.31%)#52 |
| 53. | Roslyn | 10 | 160(6.25%)#1 | 3,248(0.31%)#53 |
| 54. | Fenton | 10 | 20(50.00%)#1 | 3,248(0.31%)#54 |
| 55. | Atlanta | 9 | 9(100.00%)#1 | 3,248(0.28%)#55 |
| 56. | Princeton | 8 | 103(7.77%)#2 | 3,248(0.25%)#56 |
| 57. | Raleigh Hills | 7 | 7(100.00%)#1 | 3,248(0.22%)#57 |
| 58. | Jacksonville | 7 | 222(3.15%)#4 | 3,248(0.22%)#58 |
| 59. | Buffalo | 6 | 222(2.70%)#5 | 3,248(0.18%)#59 |
| 60. | Pittsburgh | 5 | 160(3.12%)#2 | 3,248(0.15%)#60 |
| 61. | Elmhurst | 4 | 482(0.83%)#5 | 3,248(0.12%)#61 |
| 62. | Avinger | 4 | 178(2.25%)#3 | 3,248(0.12%)#62 |
| 63. | Wheaton | 2 | 482(0.41%)#6 | 3,248(0.06%)#63 |
| 64. | Carroll | 2 | 70(2.86%)#2 | 3,248(0.06%)#64 |
| 65. | Richmond | 1 | 14(7.14%)#2 | 3,248(0.03%)#65 |
| 66. | Felton Borough | 1 | 160(0.62%)#3 | 3,248(0.03%)#66 |
Common Questions
What are the Top 10 Cities with the Largest Taiwanese Community in the United States?
Top 10 Cities with the Largest Taiwanese Community in the United States are:
#1
248
#2
245
#3
241
#4
182
#5
182
#6
98
#7
95
#8
92
#9
89
#10
81
What city has the Largest Taiwanese Community in the United States?
Glendale Heights has the Largest Taiwanese Community in the United States with 248.
What is the Total Taiwanese Population in the United States?
Total Taiwanese Population in the United States is 3,248.