Cities with the Largest Chinese Community in the United States
RELATED REPORTS & OPTIONS
Chinese
United States
Compare Cities
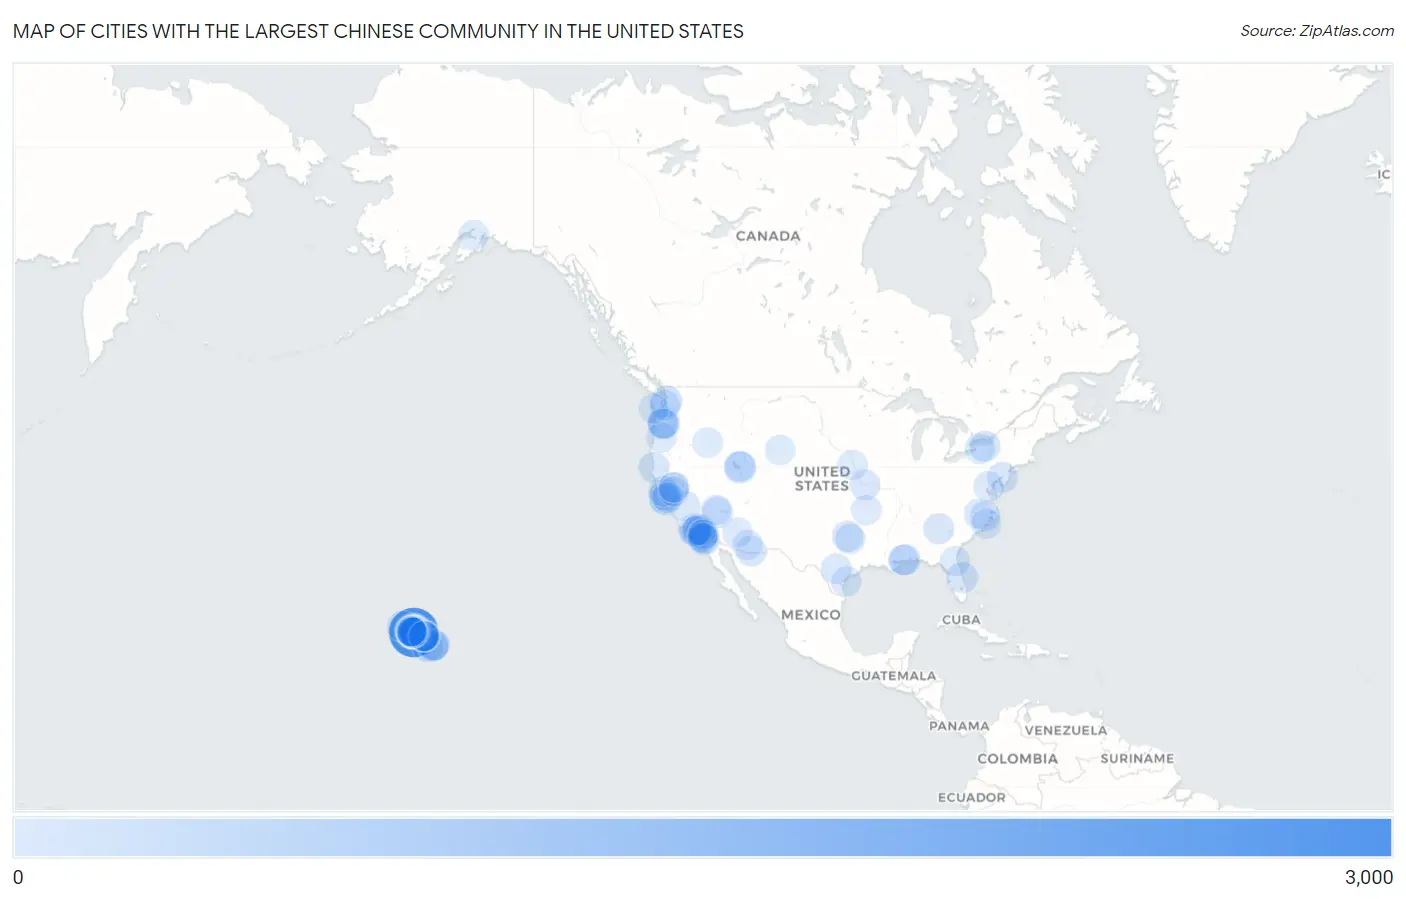
Map of Cities with the Largest Chinese Community in the United States
0
3,000
Cities with the Largest Chinese Community in the United States
| City | Chinese | vs State | vs National | |
| 1. | Urban Honolulu | 2,711 | 10,403(26.06%)#1 | 20,179(13.43%)#1 |
| 2. | Pearl City | 781 | 10,403(7.51%)#2 | 20,179(3.87%)#2 |
| 3. | Kaneohe | 630 | 10,403(6.06%)#3 | 20,179(3.12%)#3 |
| 4. | East Honolulu | 595 | 10,403(5.72%)#4 | 20,179(2.95%)#4 |
| 5. | Mililani Town | 430 | 10,403(4.13%)#5 | 20,179(2.13%)#5 |
| 6. | Aiea | 396 | 10,403(3.81%)#6 | 20,179(1.96%)#6 |
| 7. | Kailua Cdp Honolulu County | 395 | 10,403(3.80%)#7 | 20,179(1.96%)#7 |
| 8. | Kahaluu | 303 | 10,403(2.91%)#8 | 20,179(1.50%)#8 |
| 9. | Hilo | 269 | 10,403(2.59%)#9 | 20,179(1.33%)#9 |
| 10. | Portland | 258 | 670(38.51%)#1 | 20,179(1.28%)#10 |
| 11. | Kaysville | 255 | 320(79.69%)#1 | 20,179(1.26%)#11 |
| 12. | Mililani Mauka | 242 | 10,403(2.33%)#10 | 20,179(1.20%)#12 |
| 13. | Kapolei | 226 | 10,403(2.17%)#11 | 20,179(1.12%)#13 |
| 14. | Los Angeles | 219 | 2,568(8.53%)#1 | 20,179(1.09%)#14 |
| 15. | Wailuku | 203 | 10,403(1.95%)#12 | 20,179(1.01%)#15 |
| 16. | Seattle | 190 | 622(30.55%)#1 | 20,179(0.94%)#16 |
| 17. | Ewa Gentry | 168 | 10,403(1.61%)#13 | 20,179(0.83%)#17 |
| 18. | Captain Cook | 167 | 10,403(1.61%)#14 | 20,179(0.83%)#18 |
| 19. | Royal Kunia | 165 | 10,403(1.59%)#15 | 20,179(0.82%)#19 |
| 20. | Waikele | 162 | 10,403(1.56%)#16 | 20,179(0.80%)#20 |
| 21. | Halawa | 157 | 10,403(1.51%)#17 | 20,179(0.78%)#21 |
| 22. | Waipio | 153 | 10,403(1.47%)#18 | 20,179(0.76%)#22 |
| 23. | Wahiawa | 147 | 10,403(1.41%)#19 | 20,179(0.73%)#23 |
| 24. | Ocean Springs | 139 | 311(44.69%)#1 | 20,179(0.69%)#24 |
| 25. | Cocoa Beach | 138 | 662(20.85%)#1 | 20,179(0.68%)#25 |
| 26. | San Francisco | 132 | 2,568(5.14%)#2 | 20,179(0.65%)#26 |
| 27. | Waipahu | 126 | 10,403(1.21%)#20 | 20,179(0.62%)#27 |
| 28. | Kapaa | 126 | 10,403(1.21%)#21 | 20,179(0.62%)#28 |
| 29. | Heeia | 125 | 10,403(1.20%)#22 | 20,179(0.62%)#29 |
| 30. | Mountain View | 123 | 10,403(1.18%)#23 | 20,179(0.61%)#30 |
| 31. | San Diego | 117 | 2,568(4.56%)#3 | 20,179(0.58%)#31 |
| 32. | Waimalu | 114 | 10,403(1.10%)#24 | 20,179(0.56%)#32 |
| 33. | Irondequoit | 112 | 241(46.47%)#1 | 20,179(0.56%)#33 |
| 34. | Savannah | 109 | 672(16.22%)#1 | 20,179(0.54%)#34 |
| 35. | Sugar Hill | 108 | 282(38.30%)#1 | 20,179(0.54%)#35 |
| 36. | Mckinleyville | 106 | 2,568(4.13%)#4 | 20,179(0.53%)#36 |
| 37. | Half Moon Bay | 104 | 2,568(4.05%)#5 | 20,179(0.52%)#37 |
| 38. | Camden | 100 | 260(38.46%)#1 | 20,179(0.50%)#38 |
| 39. | Santa Venetia | 99 | 2,568(3.86%)#6 | 20,179(0.49%)#39 |
| 40. | Ewa Beach | 94 | 10,403(0.90%)#25 | 20,179(0.47%)#40 |
| 41. | Hawaiian Paradise Park | 94 | 10,403(0.90%)#26 | 20,179(0.47%)#41 |
| 42. | Oceanside | 91 | 2,568(3.54%)#7 | 20,179(0.45%)#42 |
| 43. | Enterprise | 88 | 159(55.35%)#1 | 20,179(0.44%)#43 |
| 44. | Independence | 88 | 184(47.83%)#1 | 20,179(0.44%)#44 |
| 45. | Santa Rosa | 86 | 2,568(3.35%)#8 | 20,179(0.43%)#45 |
| 46. | Glendora | 86 | 2,568(3.35%)#9 | 20,179(0.43%)#46 |
| 47. | Kahului | 85 | 10,403(0.82%)#27 | 20,179(0.42%)#47 |
| 48. | Sierra Vista | 84 | 285(29.47%)#1 | 20,179(0.42%)#48 |
| 49. | Beaverton | 83 | 670(12.39%)#2 | 20,179(0.41%)#49 |
| 50. | Biloxi | 82 | 311(26.37%)#2 | 20,179(0.41%)#50 |
| 51. | Fresno | 81 | 2,568(3.15%)#10 | 20,179(0.40%)#51 |
| 52. | San Antonio | 78 | 672(11.61%)#2 | 20,179(0.39%)#52 |
| 53. | Ahuimanu | 75 | 10,403(0.72%)#28 | 20,179(0.37%)#53 |
| 54. | Ocean Pointe | 72 | 10,403(0.69%)#29 | 20,179(0.36%)#54 |
| 55. | Ewa Villages | 68 | 10,403(0.65%)#30 | 20,179(0.34%)#55 |
| 56. | Waimanalo | 67 | 10,403(0.64%)#31 | 20,179(0.33%)#56 |
| 57. | Rocklin | 66 | 2,568(2.57%)#11 | 20,179(0.33%)#57 |
| 58. | Tacoma | 65 | 622(10.45%)#2 | 20,179(0.32%)#58 |
| 59. | Makawao | 65 | 10,403(0.62%)#32 | 20,179(0.32%)#59 |
| 60. | Lake Forest | 64 | 2,568(2.49%)#12 | 20,179(0.32%)#60 |
| 61. | Kihei | 64 | 10,403(0.62%)#33 | 20,179(0.32%)#61 |
| 62. | Farmville | 64 | 338(18.93%)#1 | 20,179(0.32%)#62 |
| 63. | Oakland | 63 | 2,568(2.45%)#13 | 20,179(0.31%)#63 |
| 64. | West Carson | 62 | 2,568(2.41%)#14 | 20,179(0.31%)#64 |
| 65. | Poway | 61 | 2,568(2.38%)#15 | 20,179(0.30%)#65 |
| 66. | Eugene | 60 | 670(8.96%)#3 | 20,179(0.30%)#66 |
| 67. | Makakilo | 59 | 10,403(0.57%)#34 | 20,179(0.29%)#67 |
| 68. | Riverside | 57 | 2,568(2.22%)#16 | 20,179(0.28%)#68 |
| 69. | Waiahole-Waikane | 57 | 10,403(0.55%)#35 | 20,179(0.28%)#69 |
| 70. | Nampa | 55 | 104(52.88%)#1 | 20,179(0.27%)#70 |
| 71. | Cerritos | 55 | 2,568(2.14%)#17 | 20,179(0.27%)#71 |
| 72. | Milwaukie | 55 | 670(8.21%)#4 | 20,179(0.27%)#72 |
| 73. | East Kapolei | 54 | 10,403(0.52%)#36 | 20,179(0.27%)#73 |
| 74. | Keokea | 54 | 10,403(0.52%)#37 | 20,179(0.27%)#74 |
| 75. | Roseville | 50 | 2,568(1.95%)#18 | 20,179(0.25%)#75 |
| 76. | Catalina Foothills | 50 | 285(17.54%)#2 | 20,179(0.25%)#76 |
| 77. | Lowell | 50 | 78(64.10%)#1 | 20,179(0.25%)#77 |
| 78. | Las Vegas | 49 | 159(30.82%)#2 | 20,179(0.24%)#78 |
| 79. | Whittier | 49 | 2,568(1.91%)#19 | 20,179(0.24%)#79 |
| 80. | Washington | 48 | 48(100.00%)#1 | 20,179(0.24%)#80 |
| 81. | French Valley | 48 | 2,568(1.87%)#20 | 20,179(0.24%)#81 |
| 82. | Batavia | 48 | 241(19.92%)#2 | 20,179(0.24%)#82 |
| 83. | Waianae | 48 | 10,403(0.46%)#38 | 20,179(0.24%)#83 |
| 84. | Makaha | 48 | 10,403(0.46%)#39 | 20,179(0.24%)#84 |
| 85. | Fallbrook | 47 | 2,568(1.83%)#21 | 20,179(0.23%)#85 |
| 86. | Omaha | 46 | 76(60.53%)#1 | 20,179(0.23%)#86 |
| 87. | Anchorage | 45 | 56(80.36%)#1 | 20,179(0.22%)#87 |
| 88. | Layton | 45 | 320(14.06%)#2 | 20,179(0.22%)#88 |
| 89. | Jacksonville | 44 | 662(6.65%)#2 | 20,179(0.22%)#89 |
| 90. | Vineyard | 43 | 2,568(1.67%)#22 | 20,179(0.21%)#90 |
| 91. | Nanakuli | 43 | 10,403(0.41%)#40 | 20,179(0.21%)#91 |
| 92. | Ocean Shores | 43 | 622(6.91%)#3 | 20,179(0.21%)#92 |
| 93. | West Loch Estate | 41 | 10,403(0.39%)#41 | 20,179(0.20%)#93 |
| 94. | Sachse | 40 | 672(5.95%)#3 | 20,179(0.20%)#94 |
| 95. | San Marcos | 39 | 2,568(1.52%)#23 | 20,179(0.19%)#95 |
| 96. | Rolesville | 39 | 338(11.54%)#2 | 20,179(0.19%)#96 |
| 97. | Peoria | 38 | 285(13.33%)#3 | 20,179(0.19%)#97 |
| 98. | Casper | 38 | 55(69.09%)#1 | 20,179(0.19%)#98 |
| 99. | Piney Green | 38 | 338(11.24%)#3 | 20,179(0.19%)#99 |
| 100. | Aransas Pass | 38 | 672(5.65%)#4 | 20,179(0.19%)#100 |
Common Questions
What are the Top 10 Cities with the Largest Chinese Community in the United States?
Top 10 Cities with the Largest Chinese Community in the United States are:
#1
2,711
#2
781
#3
630
#4
595
#5
430
#6
396
#7
303
#8
269
#9
258
#10
255
What city has the Largest Chinese Community in the United States?
Urban Honolulu has the Largest Chinese Community in the United States with 2,711.
What is the Total Chinese Population in the United States?
Total Chinese Population in the United States is 20,179.