Cities with the Highest Percentage of Kenyan Population in the United States
RELATED REPORTS & OPTIONS
Kenyan
United States
Compare Cities
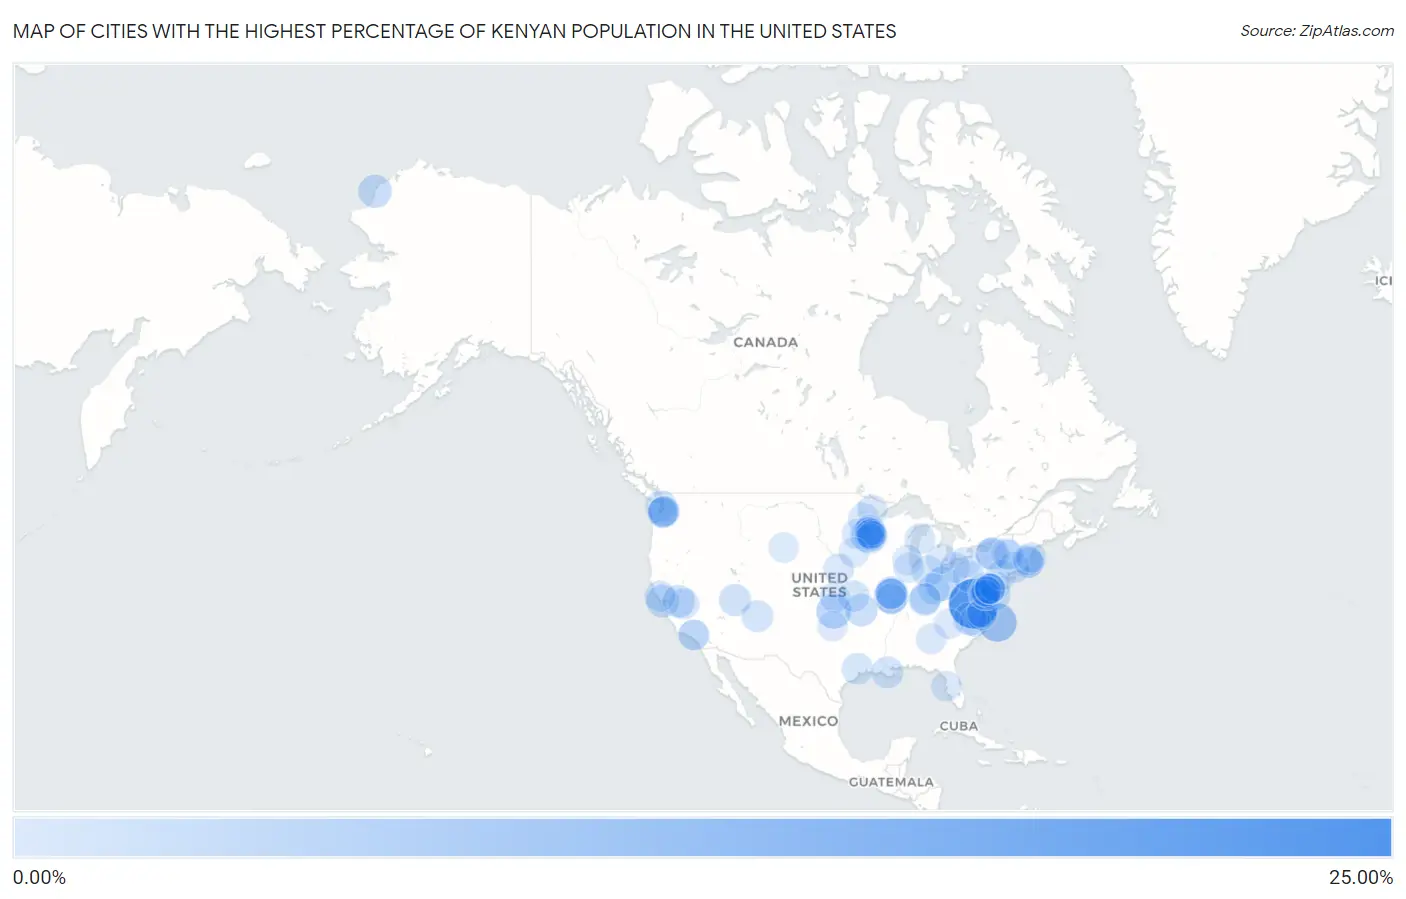
Map of Cities with the Highest Percentage of Kenyan Population in the United States
0.00%
25.00%
Cities with the Highest Percentage of Kenyan Population in the United States
| City | Kenyan | vs State | vs National | |
| 1. | Niles | 24.74% | 0.088%(+24.7)#1 | 0.031%(+24.7)#1 |
| 2. | Shipman | 24.37% | 0.038%(+24.3)#1 | 0.031%(+24.3)#2 |
| 3. | Rodanthe | 10.33% | 0.031%(+10.3)#1 | 0.031%(+10.3)#3 |
| 4. | Burlington | 6.01% | 0.022%(+5.99)#1 | 0.031%(+5.98)#4 |
| 5. | Rock Hill | 5.71% | 0.051%(+5.66)#1 | 0.031%(+5.68)#5 |
| 6. | Urbancrest | 5.19% | 0.020%(+5.17)#1 | 0.031%(+5.15)#6 |
| 7. | Spring Park | 5.11% | 0.14%(+4.97)#1 | 0.031%(+5.08)#7 |
| 8. | St Anthony City Hennepin And Ramsey Counties | 4.77% | 0.14%(+4.63)#2 | 0.031%(+4.74)#8 |
| 9. | Swepsonville | 4.10% | 0.031%(+4.07)#2 | 0.031%(+4.07)#9 |
| 10. | Point Lay | 4.07% | 0.0071%(+4.06)#1 | 0.031%(+4.04)#10 |
| 11. | Lyncourt | 4.03% | 0.016%(+4.02)#1 | 0.031%(+4.00)#11 |
| 12. | Santa Venetia | 3.59% | 0.021%(+3.57)#1 | 0.031%(+3.56)#12 |
| 13. | Galena | 3.40% | 0.088%(+3.31)#2 | 0.031%(+3.37)#13 |
| 14. | Queensland | 3.29% | 0.096%(+3.20)#1 | 0.031%(+3.26)#14 |
| 15. | Elsah | 3.02% | 0.012%(+3.01)#1 | 0.031%(+2.99)#15 |
| 16. | Tuolumne City | 3.01% | 0.021%(+2.99)#2 | 0.031%(+2.98)#16 |
| 17. | Circleville | 2.78% | 0.023%(+2.76)#1 | 0.031%(+2.75)#17 |
| 18. | Dover Borough | 2.78% | 0.023%(+2.75)#1 | 0.031%(+2.74)#18 |
| 19. | Landing | 2.73% | 0.046%(+2.68)#1 | 0.031%(+2.70)#19 |
| 20. | Tsaile | 2.43% | 0.022%(+2.41)#1 | 0.031%(+2.40)#20 |
| 21. | Watterson Park | 2.35% | 0.010%(+2.34)#1 | 0.031%(+2.32)#21 |
| 22. | Bangor Base | 2.35% | 0.11%(+2.24)#1 | 0.031%(+2.32)#22 |
| 23. | Sharon | 2.32% | 0.10%(+2.22)#1 | 0.031%(+2.29)#23 |
| 24. | Monrovia | 2.32% | 0.096%(+2.22)#2 | 0.031%(+2.28)#24 |
| 25. | Huntertown | 2.30% | 0.036%(+2.26)#1 | 0.031%(+2.27)#25 |
| 26. | Hayti | 2.27% | 0.023%(+2.25)#2 | 0.031%(+2.24)#26 |
| 27. | Lenape Heights | 2.27% | 0.023%(+2.25)#3 | 0.031%(+2.24)#27 |
| 28. | Wetherington | 2.26% | 0.020%(+2.24)#2 | 0.031%(+2.23)#28 |
| 29. | Schriever | 2.23% | 0.013%(+2.22)#1 | 0.031%(+2.20)#29 |
| 30. | Hazelwood | 2.18% | 0.051%(+2.13)#2 | 0.031%(+2.15)#30 |
| 31. | Lochearn | 2.13% | 0.096%(+2.03)#3 | 0.031%(+2.10)#31 |
| 32. | Roman Forest | 2.12% | 0.049%(+2.07)#1 | 0.031%(+2.09)#32 |
| 33. | Thomaston | 2.11% | 0.012%(+2.10)#1 | 0.031%(+2.08)#33 |
| 34. | Crafton Borough | 2.07% | 0.023%(+2.05)#4 | 0.031%(+2.04)#34 |
| 35. | Federalsburg | 1.95% | 0.096%(+1.86)#4 | 0.031%(+1.92)#35 |
| 36. | Melvern | 1.86% | 0.088%(+1.78)#3 | 0.031%(+1.83)#36 |
| 37. | Broeck Pointe | 1.85% | 0.010%(+1.83)#2 | 0.031%(+1.81)#37 |
| 38. | Liverpool | 1.76% | 0.016%(+1.74)#2 | 0.031%(+1.73)#38 |
| 39. | Nisswa | 1.73% | 0.14%(+1.59)#3 | 0.031%(+1.70)#39 |
| 40. | Yosemite Valley | 1.73% | 0.021%(+1.71)#3 | 0.031%(+1.70)#40 |
| 41. | Forestville | 1.71% | 0.021%(+1.69)#4 | 0.031%(+1.68)#41 |
| 42. | Parkland | 1.71% | 0.11%(+1.60)#2 | 0.031%(+1.67)#42 |
| 43. | Federal Way | 1.57% | 0.11%(+1.47)#3 | 0.031%(+1.54)#43 |
| 44. | Abingdon | 1.55% | 0.096%(+1.45)#5 | 0.031%(+1.51)#44 |
| 45. | Knightdale | 1.51% | 0.031%(+1.48)#3 | 0.031%(+1.48)#45 |
| 46. | Greenbriar | 1.50% | 0.038%(+1.46)#2 | 0.031%(+1.47)#46 |
| 47. | Otsego | 1.48% | 0.14%(+1.34)#4 | 0.031%(+1.45)#47 |
| 48. | Greenfield | 1.38% | 0.14%(+1.24)#5 | 0.031%(+1.34)#48 |
| 49. | Rossville | 1.37% | 0.096%(+1.28)#6 | 0.031%(+1.34)#49 |
| 50. | Festus | 1.36% | 0.051%(+1.31)#3 | 0.031%(+1.33)#50 |
| 51. | Bowmanstown Borough | 1.32% | 0.023%(+1.29)#5 | 0.031%(+1.28)#51 |
| 52. | Roanoke Rapids | 1.30% | 0.031%(+1.27)#4 | 0.031%(+1.27)#52 |
| 53. | Landover Hills | 1.27% | 0.096%(+1.18)#7 | 0.031%(+1.24)#53 |
| 54. | Redland | 1.25% | 0.096%(+1.16)#8 | 0.031%(+1.22)#54 |
| 55. | Champlin | 1.25% | 0.14%(+1.11)#6 | 0.031%(+1.22)#55 |
| 56. | Chase | 1.23% | 0.088%(+1.14)#4 | 0.031%(+1.20)#56 |
| 57. | Penn State Erie Behrend | 1.23% | 0.023%(+1.21)#6 | 0.031%(+1.20)#57 |
| 58. | Woodlawn Cdp Fairfax County | 1.23% | 0.038%(+1.19)#3 | 0.031%(+1.20)#58 |
| 59. | New Brighton | 1.22% | 0.14%(+1.08)#7 | 0.031%(+1.19)#59 |
| 60. | Broadalbin | 1.21% | 0.016%(+1.20)#3 | 0.031%(+1.18)#60 |
| 61. | Genoa | 1.18% | 0.024%(+1.16)#1 | 0.031%(+1.15)#61 |
| 62. | Sienna | 1.18% | 0.049%(+1.13)#2 | 0.031%(+1.15)#62 |
| 63. | Willmar | 1.18% | 0.14%(+1.04)#8 | 0.031%(+1.14)#63 |
| 64. | Hibbing | 1.14% | 0.14%(+1.01)#9 | 0.031%(+1.11)#64 |
| 65. | Westwood Borough | 1.14% | 0.046%(+1.09)#2 | 0.031%(+1.11)#65 |
| 66. | Dayton | 1.11% | 0.14%(+0.972)#10 | 0.031%(+1.08)#66 |
| 67. | Frankfort | 1.09% | 0.013%(+1.07)#1 | 0.031%(+1.06)#67 |
| 68. | Lakeland North | 1.08% | 0.11%(+0.975)#4 | 0.031%(+1.05)#68 |
| 69. | Bethel | 1.06% | 0.14%(+0.926)#11 | 0.031%(+1.03)#69 |
| 70. | Emporia | 1.06% | 0.038%(+1.02)#4 | 0.031%(+1.02)#70 |
| 71. | Douglasville | 1.06% | 0.034%(+1.02)#1 | 0.031%(+1.02)#71 |
| 72. | Westchase | 1.04% | 0.011%(+1.03)#1 | 0.031%(+1.01)#72 |
| 73. | Rosedale | 1.04% | 0.096%(+0.946)#9 | 0.031%(+1.01)#73 |
| 74. | San Pasqual | 1.03% | 0.021%(+1.01)#5 | 0.031%(+1.00)#74 |
| 75. | Steilacoom | 1.02% | 0.11%(+0.910)#5 | 0.031%(+0.987)#75 |
| 76. | Glasgow | 0.98% | 0.10%(+0.880)#1 | 0.031%(+0.949)#76 |
| 77. | Elko New Market | 0.95% | 0.14%(+0.810)#12 | 0.031%(+0.917)#77 |
| 78. | Willoughby Hills | 0.93% | 0.020%(+0.913)#3 | 0.031%(+0.901)#78 |
| 79. | Beattystown | 0.91% | 0.046%(+0.867)#3 | 0.031%(+0.881)#79 |
| 80. | Newington | 0.91% | 0.038%(+0.869)#5 | 0.031%(+0.876)#80 |
| 81. | Old Jamestown | 0.90% | 0.051%(+0.852)#4 | 0.031%(+0.871)#81 |
| 82. | Watertown Town | 0.90% | 0.10%(+0.800)#2 | 0.031%(+0.870)#82 |
| 83. | Jenkintown Borough | 0.89% | 0.023%(+0.870)#7 | 0.031%(+0.862)#83 |
| 84. | Hopkins | 0.87% | 0.14%(+0.737)#13 | 0.031%(+0.843)#84 |
| 85. | Altadena | 0.87% | 0.021%(+0.848)#6 | 0.031%(+0.837)#85 |
| 86. | Wright | 0.86% | 0.026%(+0.836)#1 | 0.031%(+0.830)#86 |
| 87. | Round Lake | 0.85% | 0.016%(+0.836)#4 | 0.031%(+0.820)#87 |
| 88. | Mounds View | 0.85% | 0.14%(+0.709)#14 | 0.031%(+0.816)#88 |
| 89. | Sanborn | 0.85% | 0.023%(+0.823)#1 | 0.031%(+0.815)#89 |
| 90. | Weymouth Town | 0.84% | 0.10%(+0.744)#3 | 0.031%(+0.813)#90 |
| 91. | Essex | 0.84% | 0.096%(+0.741)#10 | 0.031%(+0.806)#91 |
| 92. | Lake Villa | 0.83% | 0.012%(+0.816)#2 | 0.031%(+0.796)#92 |
| 93. | Carnegie | 0.82% | 0.022%(+0.798)#2 | 0.031%(+0.789)#93 |
| 94. | Bowleys Quarters | 0.82% | 0.096%(+0.719)#11 | 0.031%(+0.784)#94 |
| 95. | Edneyville | 0.81% | 0.031%(+0.782)#5 | 0.031%(+0.782)#95 |
| 96. | Orland Hills | 0.80% | 0.012%(+0.792)#3 | 0.031%(+0.773)#96 |
| 97. | Olney | 0.80% | 0.096%(+0.706)#12 | 0.031%(+0.771)#97 |
| 98. | Keego Harbor | 0.79% | 0.013%(+0.781)#2 | 0.031%(+0.763)#98 |
| 99. | Newport | 0.79% | 0.14%(+0.655)#15 | 0.031%(+0.761)#99 |
| 100. | Gloucester | 0.78% | 0.10%(+0.680)#4 | 0.031%(+0.750)#100 |
Common Questions
What are the Top 10 Cities with the Highest Percentage of Kenyan Population in the United States?
Top 10 Cities with the Highest Percentage of Kenyan Population in the United States are:
#1
24.37%
#2
10.33%
#3
6.01%
#4
5.71%
#5
5.19%
#6
5.11%
#7
4.10%
#8
4.07%
#9
4.03%
#10
3.59%
What city has the Highest Percentage of Kenyan Population in the United States?
Shipman has the Highest Percentage of Kenyan Population in the United States with 24.37%.
What is the Percentage of Kenyan Population in the United States?
Percentage of Kenyan Population in the United States is 0.031%.