Cities with the Largest Northern European Community in the United States
RELATED REPORTS & OPTIONS
Northern European
United States
Compare Cities
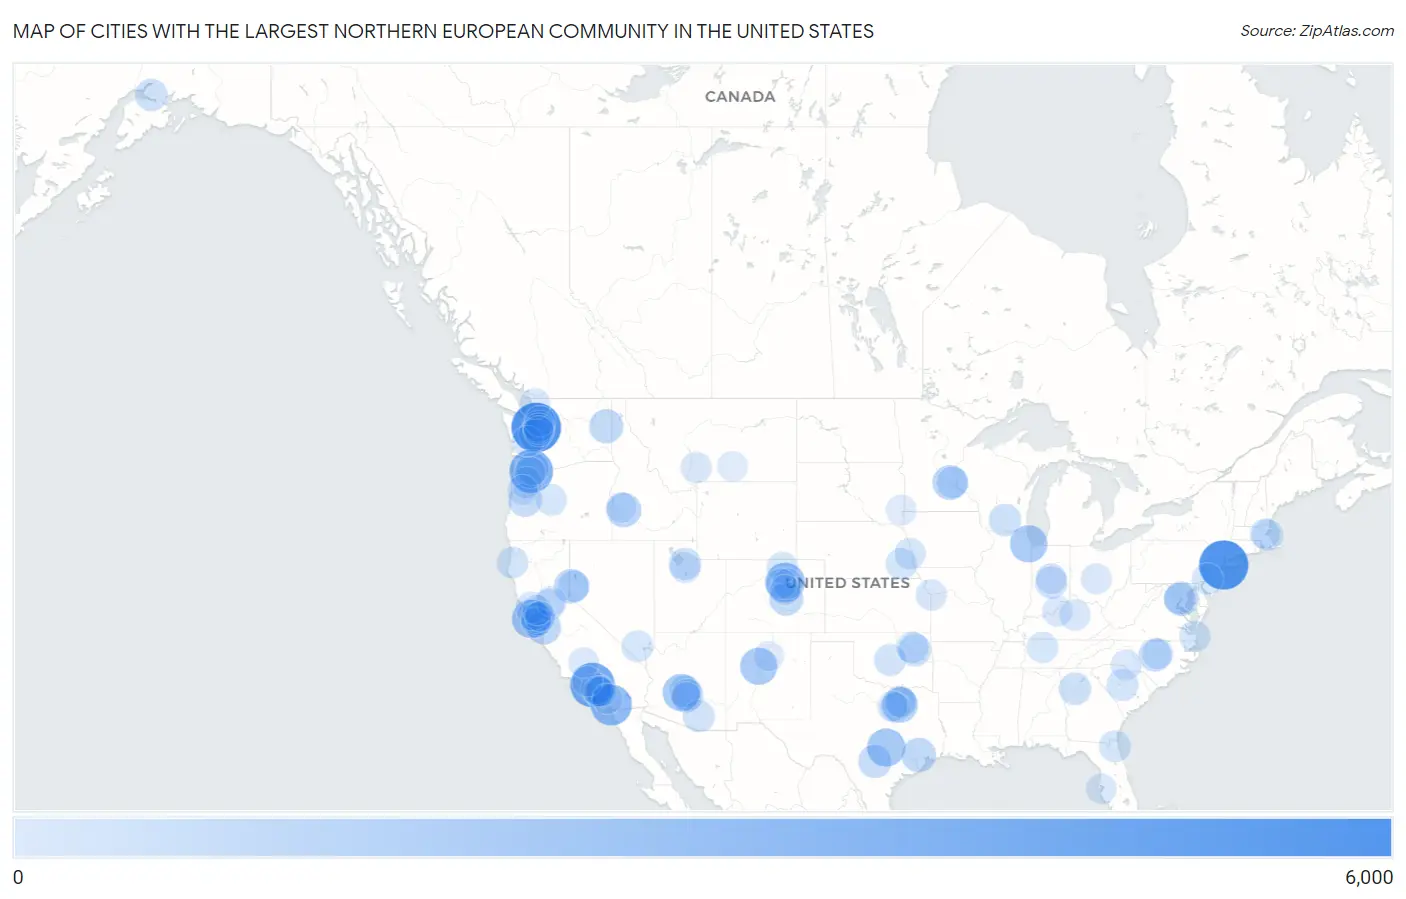
Map of Cities with the Largest Northern European Community in the United States
0
6,000
Cities with the Largest Northern European Community in the United States
| City | Northern European | vs State | vs National | |
| 1. | Seattle | 5,590 | 36,418(15.35%)#1 | 487,800(1.15%)#1 |
| 2. | New York | 5,495 | 18,361(29.93%)#1 | 487,800(1.13%)#2 |
| 3. | Los Angeles | 4,240 | 75,659(5.60%)#1 | 487,800(0.87%)#3 |
| 4. | Portland | 3,901 | 20,321(19.20%)#1 | 487,800(0.80%)#4 |
| 5. | San Diego | 3,292 | 75,659(4.35%)#2 | 487,800(0.67%)#5 |
| 6. | Denver | 2,861 | 17,140(16.69%)#1 | 487,800(0.59%)#6 |
| 7. | San Francisco | 2,646 | 75,659(3.50%)#3 | 487,800(0.54%)#7 |
| 8. | Austin | 2,462 | 29,137(8.45%)#1 | 487,800(0.50%)#8 |
| 9. | Chicago | 2,280 | 14,172(16.09%)#1 | 487,800(0.47%)#9 |
| 10. | Albuquerque | 2,224 | 5,066(43.90%)#1 | 487,800(0.46%)#10 |
| 11. | Phoenix | 2,220 | 12,865(17.26%)#1 | 487,800(0.46%)#11 |
| 12. | Dallas | 1,850 | 29,137(6.35%)#2 | 487,800(0.38%)#12 |
| 13. | Minneapolis | 1,606 | 14,579(11.02%)#1 | 487,800(0.33%)#13 |
| 14. | Boise City | 1,546 | 6,350(24.35%)#1 | 487,800(0.32%)#14 |
| 15. | Houston | 1,510 | 29,137(5.18%)#3 | 487,800(0.31%)#15 |
| 16. | Washington | 1,508 | 1,508(100.00%)#1 | 487,800(0.31%)#16 |
| 17. | Reno | 1,502 | 5,680(26.44%)#1 | 487,800(0.31%)#17 |
| 18. | San Jose | 1,481 | 75,659(1.96%)#4 | 487,800(0.30%)#18 |
| 19. | Spokane | 1,420 | 36,418(3.90%)#2 | 487,800(0.29%)#19 |
| 20. | Colorado Springs | 1,328 | 17,140(7.75%)#2 | 487,800(0.27%)#20 |
| 21. | Eugene | 1,266 | 20,321(6.23%)#2 | 487,800(0.26%)#21 |
| 22. | San Antonio | 1,238 | 29,137(4.25%)#4 | 487,800(0.25%)#22 |
| 23. | Oakland | 1,204 | 75,659(1.59%)#5 | 487,800(0.25%)#23 |
| 24. | Cary | 1,141 | 11,197(10.19%)#1 | 487,800(0.23%)#24 |
| 25. | Vancouver | 1,052 | 36,418(2.89%)#3 | 487,800(0.22%)#25 |
| 26. | Broken Arrow | 1,014 | 5,943(17.06%)#1 | 487,800(0.21%)#26 |
| 27. | Madison | 986 | 9,686(10.18%)#1 | 487,800(0.20%)#27 |
| 28. | Anchorage | 978 | 2,887(33.88%)#1 | 487,800(0.20%)#28 |
| 29. | Atlanta | 969 | 11,069(8.75%)#1 | 487,800(0.20%)#29 |
| 30. | Indianapolis | 954 | 7,858(12.14%)#1 | 487,800(0.20%)#30 |
| 31. | Tacoma | 937 | 36,418(2.57%)#4 | 487,800(0.19%)#31 |
| 32. | Scottsdale | 924 | 12,865(7.18%)#2 | 487,800(0.19%)#32 |
| 33. | Oklahoma City | 878 | 5,943(14.77%)#2 | 487,800(0.18%)#33 |
| 34. | Mesa | 875 | 12,865(6.80%)#3 | 487,800(0.18%)#34 |
| 35. | Salt Lake City | 869 | 10,349(8.40%)#1 | 487,800(0.18%)#35 |
| 36. | Tucson | 865 | 12,865(6.72%)#4 | 487,800(0.18%)#36 |
| 37. | Sacramento | 865 | 75,659(1.14%)#6 | 487,800(0.18%)#37 |
| 38. | St Paul | 842 | 14,579(5.78%)#2 | 487,800(0.17%)#38 |
| 39. | Seven Oaks | 838 | 6,992(11.99%)#1 | 487,800(0.17%)#39 |
| 40. | Jacksonville | 808 | 19,723(4.10%)#1 | 487,800(0.17%)#40 |
| 41. | Tulsa | 808 | 5,943(13.60%)#3 | 487,800(0.17%)#41 |
| 42. | Arcata | 782 | 75,659(1.03%)#7 | 487,800(0.16%)#42 |
| 43. | Arlington | 764 | 13,637(5.60%)#1 | 487,800(0.16%)#43 |
| 44. | Santa Rosa | 758 | 75,659(1.00%)#8 | 487,800(0.16%)#44 |
| 45. | Sparks | 753 | 5,680(13.26%)#2 | 487,800(0.15%)#45 |
| 46. | Las Vegas | 750 | 5,680(13.20%)#3 | 487,800(0.15%)#46 |
| 47. | Lincoln | 742 | 2,863(25.92%)#1 | 487,800(0.15%)#47 |
| 48. | Bend | 740 | 20,321(3.64%)#3 | 487,800(0.15%)#48 |
| 49. | Salem | 739 | 20,321(3.64%)#4 | 487,800(0.15%)#49 |
| 50. | Omaha | 732 | 2,863(25.57%)#2 | 487,800(0.15%)#50 |
| 51. | Virginia Beach | 726 | 13,637(5.32%)#2 | 487,800(0.15%)#51 |
| 52. | Boston | 720 | 9,975(7.22%)#1 | 487,800(0.15%)#52 |
| 53. | Fort Collins | 711 | 17,140(4.15%)#3 | 487,800(0.15%)#53 |
| 54. | Nashville | 704 | 7,519(9.36%)#1 | 487,800(0.14%)#54 |
| 55. | Philadelphia | 691 | 10,645(6.49%)#1 | 487,800(0.14%)#55 |
| 56. | Kirkland | 676 | 36,418(1.86%)#5 | 487,800(0.14%)#56 |
| 57. | Bozeman | 673 | 5,677(11.85%)#1 | 487,800(0.14%)#57 |
| 58. | Beaverton | 660 | 20,321(3.25%)#5 | 487,800(0.14%)#58 |
| 59. | Sandy | 657 | 10,349(6.35%)#2 | 487,800(0.13%)#59 |
| 60. | Kansas City | 642 | 8,158(7.87%)#1 | 487,800(0.13%)#60 |
| 61. | Raleigh | 642 | 11,197(5.73%)#2 | 487,800(0.13%)#61 |
| 62. | Newport Beach | 637 | 75,659(0.84%)#9 | 487,800(0.13%)#62 |
| 63. | Long Beach | 625 | 75,659(0.83%)#10 | 487,800(0.13%)#63 |
| 64. | Plano | 622 | 29,137(2.13%)#5 | 487,800(0.13%)#64 |
| 65. | Tumwater | 614 | 36,418(1.69%)#6 | 487,800(0.13%)#65 |
| 66. | Lexington | 608 | 4,193(14.50%)#1 | 487,800(0.12%)#66 |
| 67. | Richardson | 593 | 29,137(2.04%)#6 | 487,800(0.12%)#67 |
| 68. | Columbus | 590 | 11,354(5.20%)#1 | 487,800(0.12%)#68 |
| 69. | Aurora | 557 | 17,140(3.25%)#4 | 487,800(0.11%)#69 |
| 70. | Berkeley | 557 | 75,659(0.74%)#11 | 487,800(0.11%)#70 |
| 71. | Bellingham | 550 | 36,418(1.51%)#7 | 487,800(0.11%)#71 |
| 72. | Bakersfield | 547 | 75,659(0.72%)#12 | 487,800(0.11%)#72 |
| 73. | Gilbert | 547 | 12,865(4.25%)#5 | 487,800(0.11%)#73 |
| 74. | Irvine | 546 | 75,659(0.72%)#13 | 487,800(0.11%)#74 |
| 75. | Charlotte | 544 | 11,197(4.86%)#3 | 487,800(0.11%)#75 |
| 76. | Louisville | 541 | 4,193(12.90%)#2 | 487,800(0.11%)#76 |
| 77. | San Anselmo | 540 | 75,659(0.71%)#14 | 487,800(0.11%)#77 |
| 78. | Lakewood | 539 | 17,140(3.14%)#5 | 487,800(0.11%)#78 |
| 79. | Everett | 511 | 36,418(1.40%)#8 | 487,800(0.10%)#79 |
| 80. | St Petersburg | 508 | 19,723(2.58%)#2 | 487,800(0.10%)#80 |
| 81. | Bellevue | 508 | 36,418(1.39%)#9 | 487,800(0.10%)#81 |
| 82. | Carmel | 508 | 7,858(6.46%)#2 | 487,800(0.10%)#82 |
| 83. | Sioux Falls | 504 | 1,510(33.38%)#1 | 487,800(0.10%)#83 |
| 84. | San Mateo | 496 | 75,659(0.66%)#15 | 487,800(0.10%)#84 |
| 85. | Corvallis | 492 | 20,321(2.42%)#6 | 487,800(0.10%)#85 |
| 86. | Costa Mesa | 491 | 75,659(0.65%)#16 | 487,800(0.10%)#86 |
| 87. | Eagle | 489 | 6,350(7.70%)#2 | 487,800(0.10%)#87 |
| 88. | Arlington | 484 | 29,137(1.66%)#7 | 487,800(0.10%)#88 |
| 89. | Roseville | 471 | 75,659(0.62%)#17 | 487,800(0.10%)#89 |
| 90. | Simi Valley | 471 | 75,659(0.62%)#18 | 487,800(0.10%)#90 |
| 91. | Renton | 471 | 36,418(1.29%)#10 | 487,800(0.10%)#91 |
| 92. | Napa | 471 | 75,659(0.62%)#19 | 487,800(0.10%)#92 |
| 93. | Walnut Creek | 471 | 75,659(0.62%)#20 | 487,800(0.10%)#93 |
| 94. | Cambridge | 469 | 9,975(4.70%)#2 | 487,800(0.10%)#94 |
| 95. | Fort Worth | 468 | 29,137(1.61%)#8 | 487,800(0.10%)#95 |
| 96. | Oceanside | 467 | 75,659(0.62%)#21 | 487,800(0.10%)#96 |
| 97. | Billings | 464 | 5,677(8.17%)#2 | 487,800(0.10%)#97 |
| 98. | Juneau City And Borough | 464 | 2,887(16.07%)#2 | 487,800(0.10%)#98 |
| 99. | Santa Fe | 463 | 5,066(9.14%)#2 | 487,800(0.09%)#99 |
| 100. | Castle Rock | 463 | 17,140(2.70%)#6 | 487,800(0.09%)#100 |
Common Questions
What are the Top 10 Cities with the Largest Northern European Community in the United States?
Top 10 Cities with the Largest Northern European Community in the United States are:
What city has the Largest Northern European Community in the United States?
Seattle has the Largest Northern European Community in the United States with 5,590.
What is the Total Northern European Population in the United States?
Total Northern European Population in the United States is 487,800.