Cimarron Hills, CO Map & Demographics
Cimarron Hills Map
Cimarron Hills Overview
$34,425
PER CAPITA INCOME
$82,321
AVG FAMILY INCOME
$74,646
AVG HOUSEHOLD INCOME
41.9%
WAGE / INCOME GAP [ % ]
58.1¢/ $1
WAGE / INCOME GAP [ $ ]
0.39
INEQUALITY / GINI INDEX
19,039
TOTAL POPULATION
10,204
MALE POPULATION
8,835
FEMALE POPULATION
115.50
MALES / 100 FEMALES
86.58
FEMALES / 100 MALES
32.6
MEDIAN AGE
3.1
AVG FAMILY SIZE
2.7
AVG HOUSEHOLD SIZE
10,602
LABOR FORCE [ PEOPLE ]
71.4%
PERCENT IN LABOR FORCE
5.4%
UNEMPLOYMENT RATE
Income in Cimarron Hills
Income Overview in Cimarron Hills
Per Capita Income in Cimarron Hills is $34,425, while median incomes of families and households are $82,321 and $74,646 respectively.
| Characteristic | Number | Measure |
| Per Capita Income | 19,039 | $34,425 |
| Median Family Income | 5,092 | $82,321 |
| Mean Family Income | 5,092 | $97,658 |
| Median Household Income | 7,070 | $74,646 |
| Mean Household Income | 7,070 | $92,548 |
| Income Deficit | 5,092 | $0 |
| Wage / Income Gap (%) | 19,039 | 41.91% |
| Wage / Income Gap ($) | 19,039 | 58.09¢ per $1 |
| Gini / Inequality Index | 19,039 | 0.39 |
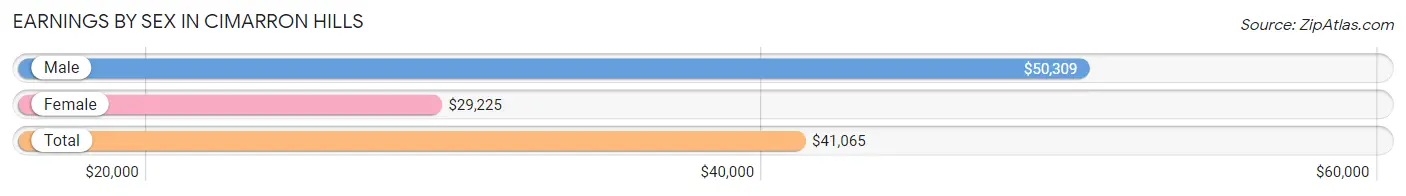
Earnings by Sex in Cimarron Hills
Average Earnings in Cimarron Hills are $41,065, $50,309 for men and $29,225 for women, a difference of 41.9%.
| Sex | Number | Average Earnings |
| Male | 6,119 (56.0%) | $50,309 |
| Female | 4,816 (44.0%) | $29,225 |
| Total | 10,935 (100.0%) | $41,065 |
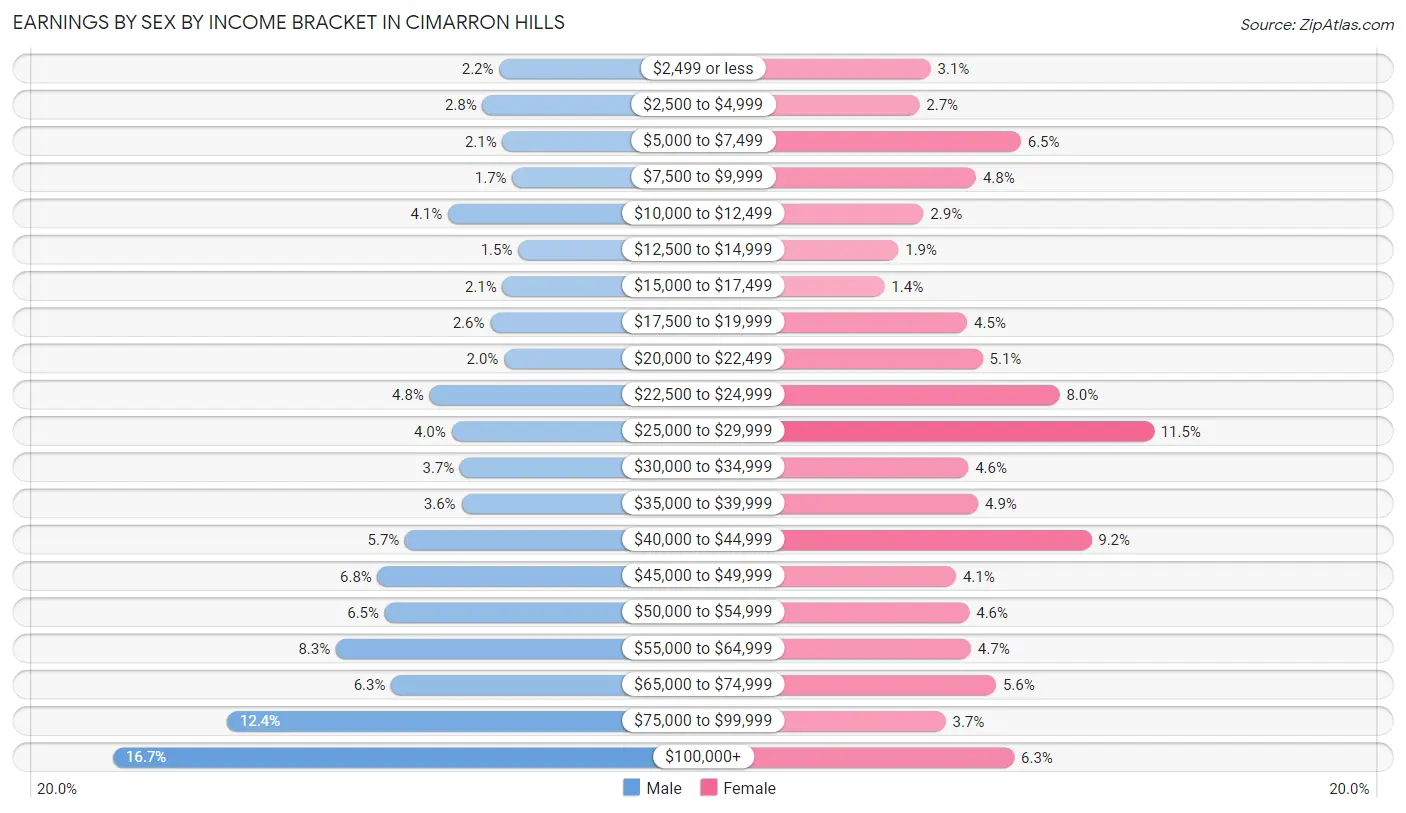
Earnings by Sex by Income Bracket in Cimarron Hills
The most common earnings brackets in Cimarron Hills are $100,000+ for men (1,021 | 16.7%) and $25,000 to $29,999 for women (554 | 11.5%).
| Income | Male | Female |
| $2,499 or less | 135 (2.2%) | 151 (3.1%) |
| $2,500 to $4,999 | 174 (2.8%) | 131 (2.7%) |
| $5,000 to $7,499 | 128 (2.1%) | 314 (6.5%) |
| $7,500 to $9,999 | 105 (1.7%) | 233 (4.8%) |
| $10,000 to $12,499 | 253 (4.1%) | 138 (2.9%) |
| $12,500 to $14,999 | 92 (1.5%) | 93 (1.9%) |
| $15,000 to $17,499 | 128 (2.1%) | 68 (1.4%) |
| $17,500 to $19,999 | 156 (2.5%) | 217 (4.5%) |
| $20,000 to $22,499 | 124 (2.0%) | 245 (5.1%) |
| $22,500 to $24,999 | 295 (4.8%) | 384 (8.0%) |
| $25,000 to $29,999 | 245 (4.0%) | 554 (11.5%) |
| $30,000 to $34,999 | 225 (3.7%) | 219 (4.5%) |
| $35,000 to $39,999 | 222 (3.6%) | 237 (4.9%) |
| $40,000 to $44,999 | 351 (5.7%) | 441 (9.2%) |
| $45,000 to $49,999 | 414 (6.8%) | 197 (4.1%) |
| $50,000 to $54,999 | 398 (6.5%) | 221 (4.6%) |
| $55,000 to $64,999 | 510 (8.3%) | 224 (4.6%) |
| $65,000 to $74,999 | 383 (6.3%) | 269 (5.6%) |
| $75,000 to $99,999 | 760 (12.4%) | 178 (3.7%) |
| $100,000+ | 1,021 (16.7%) | 302 (6.3%) |
| Total | 6,119 (100.0%) | 4,816 (100.0%) |
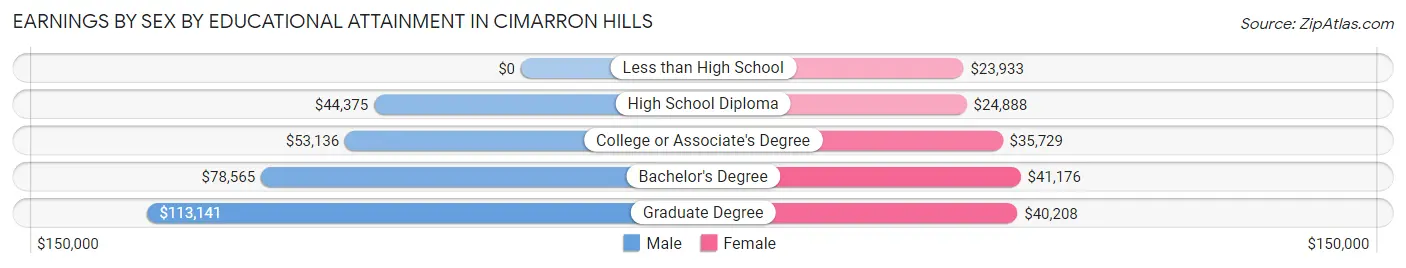
Earnings by Sex by Educational Attainment in Cimarron Hills
Average earnings in Cimarron Hills are $54,697 for men and $35,780 for women, a difference of 34.6%. Men with an educational attainment of graduate degree enjoy the highest average annual earnings of $113,141, while those with high school diploma education earn the least with $44,375. Women with an educational attainment of bachelor's degree earn the most with the average annual earnings of $41,176, while those with less than high school education have the smallest earnings of $23,933.
| Educational Attainment | Male Income | Female Income |
| Less than High School | - | - |
| High School Diploma | $44,375 | $24,888 |
| College or Associate's Degree | $53,136 | $35,729 |
| Bachelor's Degree | $78,565 | $41,176 |
| Graduate Degree | $113,141 | $40,208 |
| Total | $54,697 | $35,780 |
Family Income in Cimarron Hills
Family Income Brackets in Cimarron Hills
According to the Cimarron Hills family income data, there are 1,136 families falling into the $50,000 to $74,999 income range, which is the most common income bracket and makes up 22.3% of all families. Conversely, the $10,000 to $14,999 income bracket is the least frequent group with only 15 families (0.3%) belonging to this category.
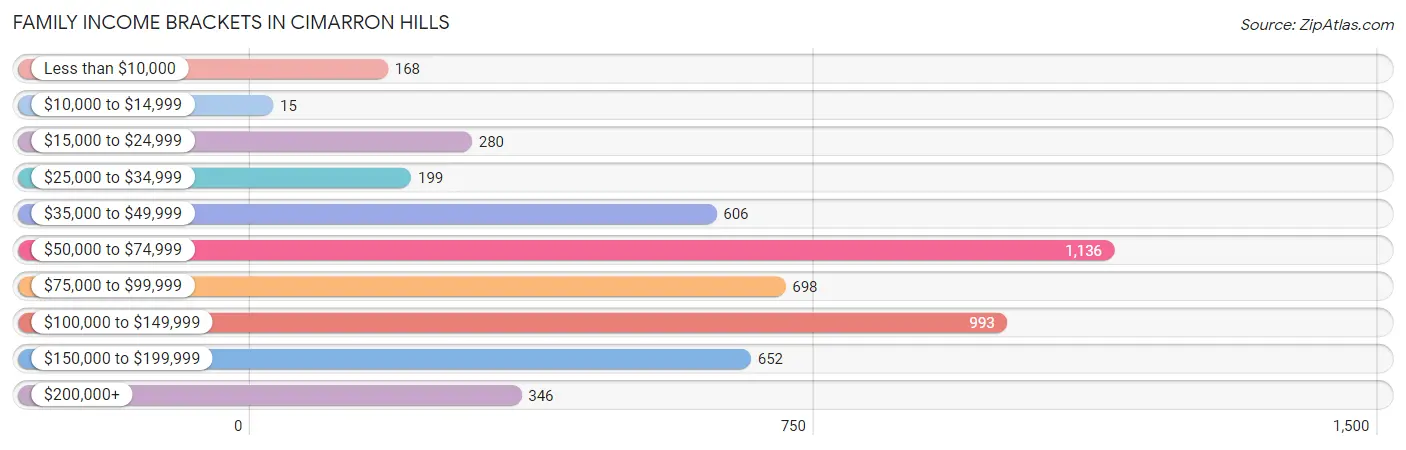
| Income Bracket | # Families | % Families |
| Less than $10,000 | 168 | 3.3% |
| $10,000 to $14,999 | 15 | 0.3% |
| $15,000 to $24,999 | 280 | 5.5% |
| $25,000 to $34,999 | 199 | 3.9% |
| $35,000 to $49,999 | 606 | 11.9% |
| $50,000 to $74,999 | 1,136 | 22.3% |
| $75,000 to $99,999 | 698 | 13.7% |
| $100,000 to $149,999 | 993 | 19.5% |
| $150,000 to $199,999 | 652 | 12.8% |
| $200,000+ | 346 | 6.8% |
Family Income by Famaliy Size in Cimarron Hills
6-person families (193 | 3.8%) account for the highest median family income in Cimarron Hills with $118,399 per family, while 2-person families (2,082 | 40.9%) have the highest median income of $33,008 per family member.
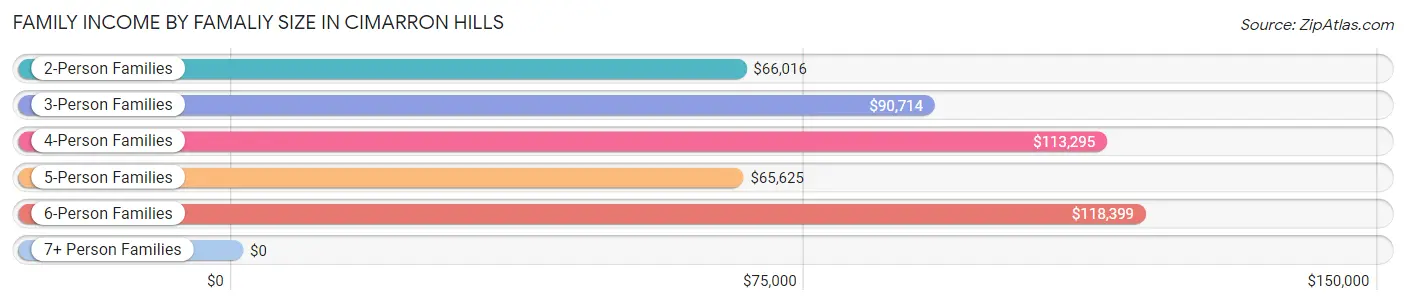
| Income Bracket | # Families | Median Income |
| 2-Person Families | 2,082 (40.9%) | $66,016 |
| 3-Person Families | 1,410 (27.7%) | $90,714 |
| 4-Person Families | 833 (16.4%) | $113,295 |
| 5-Person Families | 496 (9.7%) | $65,625 |
| 6-Person Families | 193 (3.8%) | $118,399 |
| 7+ Person Families | 78 (1.5%) | $0 |
| Total | 5,092 (100.0%) | $82,321 |
Family Income by Number of Earners in Cimarron Hills
The median family income in Cimarron Hills is $82,321, with families comprising 3+ earners (631) having the highest median family income of $153,453, while families with 1 earner (1,557) have the lowest median family income of $50,662, accounting for 12.4% and 30.6% of families, respectively.
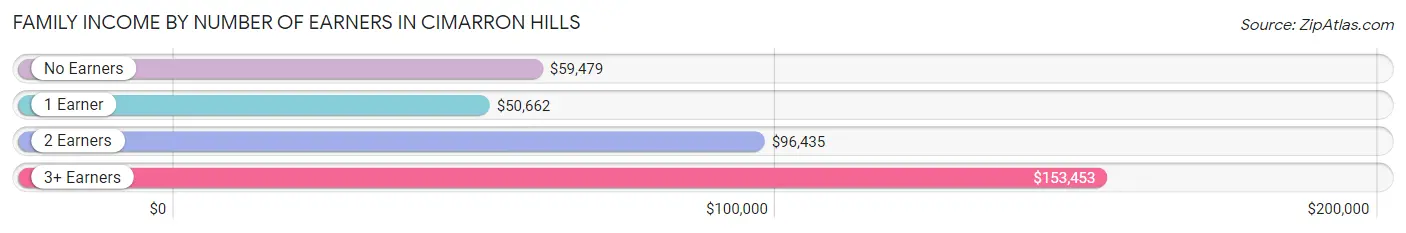
| Number of Earners | # Families | Median Income |
| No Earners | 421 (8.3%) | $59,479 |
| 1 Earner | 1,557 (30.6%) | $50,662 |
| 2 Earners | 2,483 (48.8%) | $96,435 |
| 3+ Earners | 631 (12.4%) | $153,453 |
| Total | 5,092 (100.0%) | $82,321 |
Household Income in Cimarron Hills
Household Income Brackets in Cimarron Hills
With 1,449 households falling in the category, the $50,000 to $74,999 income range is the most frequent in Cimarron Hills, accounting for 20.5% of all households. In contrast, only 184 households (2.6%) fall into the $10,000 to $14,999 income bracket, making it the least populous group.
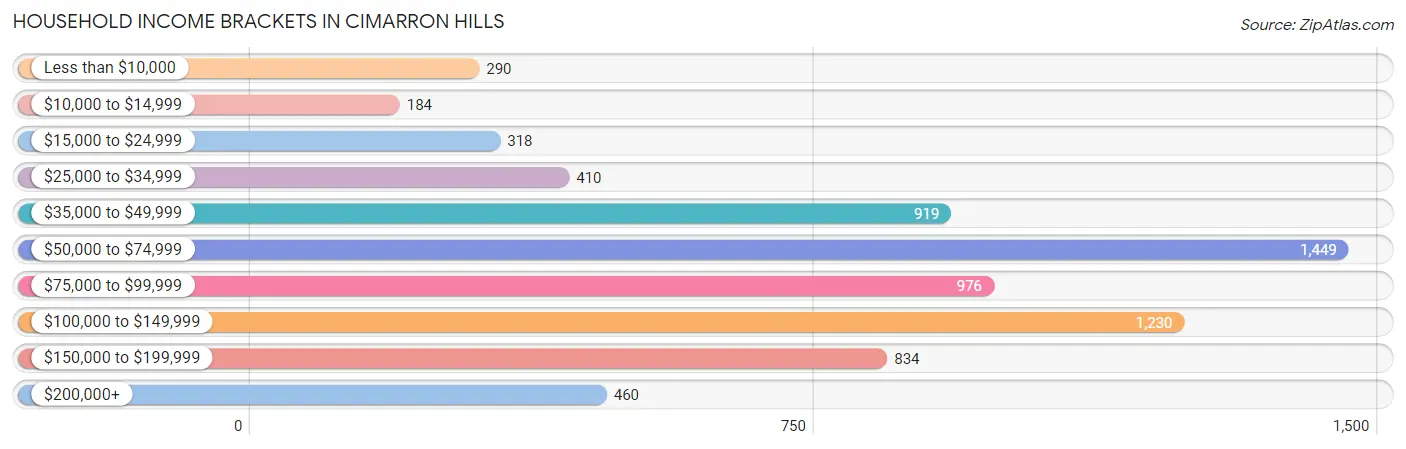
| Income Bracket | # Households | % Households |
| Less than $10,000 | 290 | 4.1% |
| $10,000 to $14,999 | 184 | 2.6% |
| $15,000 to $24,999 | 318 | 4.5% |
| $25,000 to $34,999 | 410 | 5.8% |
| $35,000 to $49,999 | 919 | 13.0% |
| $50,000 to $74,999 | 1,449 | 20.5% |
| $75,000 to $99,999 | 976 | 13.8% |
| $100,000 to $149,999 | 1,230 | 17.4% |
| $150,000 to $199,999 | 834 | 11.8% |
| $200,000+ | 460 | 6.5% |
Household Income by Householder Age in Cimarron Hills
The median household income in Cimarron Hills is $74,646, with the highest median household income of $88,271 found in the 45 to 64 years age bracket for the primary householder. A total of 2,334 households (33.0%) fall into this category. Meanwhile, the 15 to 24 years age bracket for the primary householder has the lowest median household income of $61,690, with 387 households (5.5%) in this group.
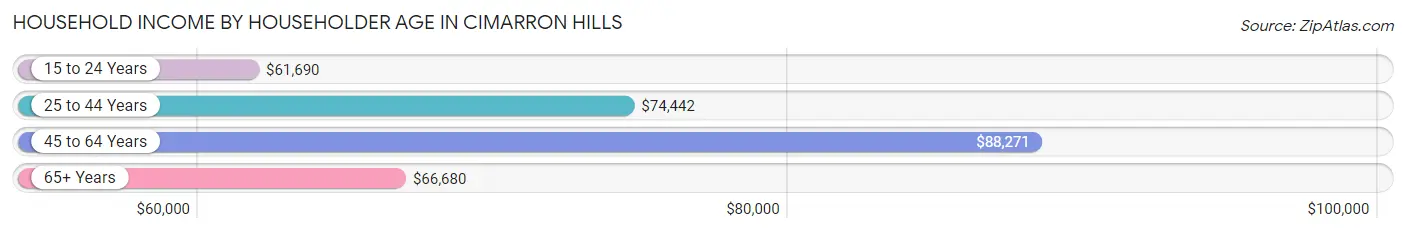
| Income Bracket | # Households | Median Income |
| 15 to 24 Years | 387 (5.5%) | $61,690 |
| 25 to 44 Years | 3,388 (47.9%) | $74,442 |
| 45 to 64 Years | 2,334 (33.0%) | $88,271 |
| 65+ Years | 961 (13.6%) | $66,680 |
| Total | 7,070 (100.0%) | $74,646 |
Poverty in Cimarron Hills
Income Below Poverty by Sex and Age in Cimarron Hills
With 8.0% poverty level for males and 9.5% for females among the residents of Cimarron Hills, 55 to 64 year old males and 6 to 11 year old females are the most vulnerable to poverty, with 198 males (18.2%) and 144 females (14.3%) in their respective age groups living below the poverty level.
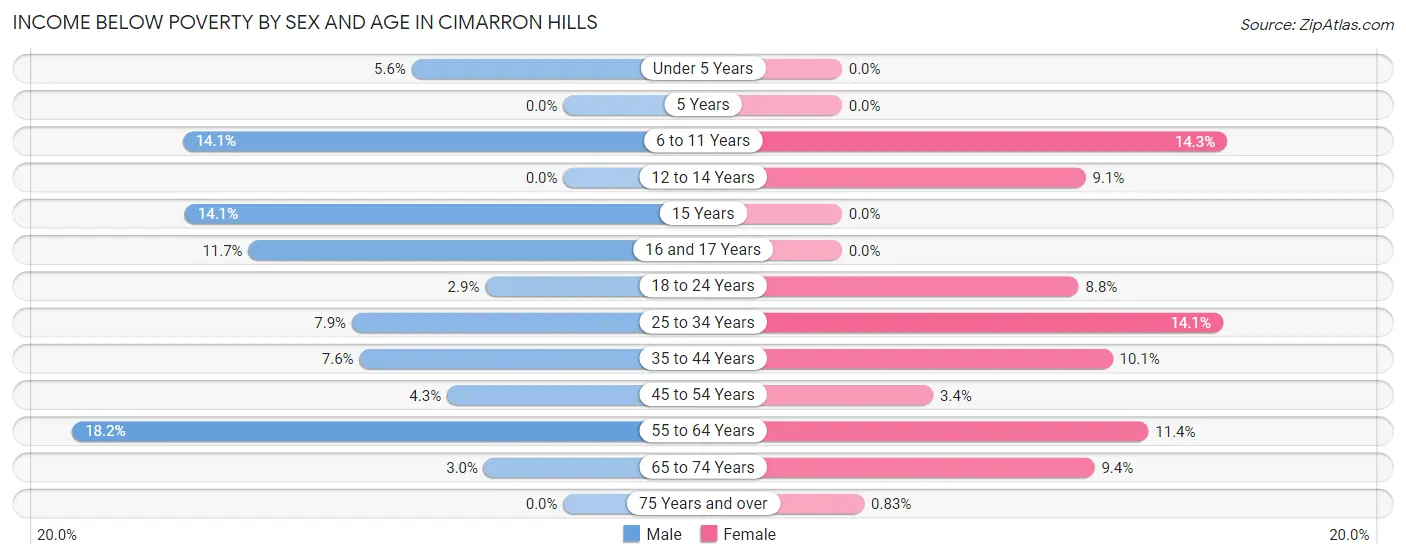
| Age Bracket | Male | Female |
| Under 5 Years | 39 (5.6%) | 0 (0.0%) |
| 5 Years | 0 (0.0%) | 0 (0.0%) |
| 6 to 11 Years | 142 (14.1%) | 144 (14.3%) |
| 12 to 14 Years | 0 (0.0%) | 18 (9.0%) |
| 15 Years | 26 (14.1%) | 0 (0.0%) |
| 16 and 17 Years | 38 (11.7%) | 0 (0.0%) |
| 18 to 24 Years | 30 (2.9%) | 89 (8.8%) |
| 25 to 34 Years | 150 (7.9%) | 240 (14.1%) |
| 35 to 44 Years | 132 (7.6%) | 133 (10.1%) |
| 45 to 54 Years | 41 (4.3%) | 28 (3.4%) |
| 55 to 64 Years | 198 (18.2%) | 136 (11.4%) |
| 65 to 74 Years | 16 (2.9%) | 47 (9.4%) |
| 75 Years and over | 0 (0.0%) | 2 (0.8%) |
| Total | 812 (8.0%) | 837 (9.5%) |
Income Above Poverty by Sex and Age in Cimarron Hills
According to the poverty statistics in Cimarron Hills, males aged 5 years and females aged under 5 years are the age groups that are most secure financially, with 100.0% of males and 100.0% of females in these age groups living above the poverty line.
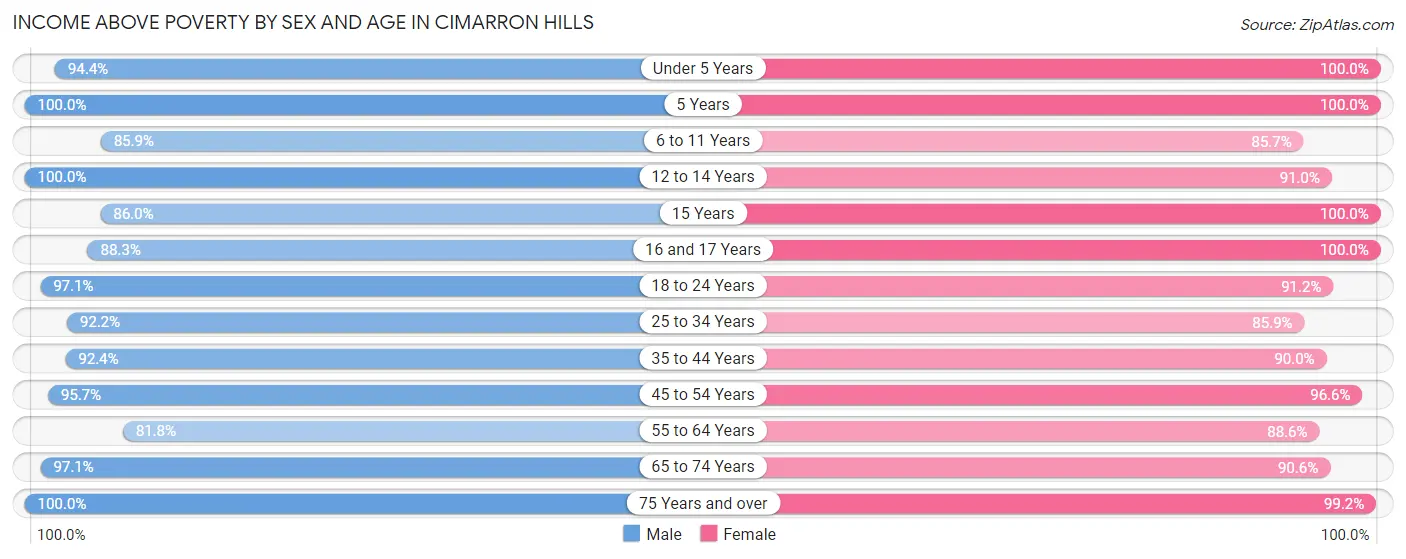
| Age Bracket | Male | Female |
| Under 5 Years | 654 (94.4%) | 296 (100.0%) |
| 5 Years | 147 (100.0%) | 77 (100.0%) |
| 6 to 11 Years | 863 (85.9%) | 863 (85.7%) |
| 12 to 14 Years | 363 (100.0%) | 181 (90.9%) |
| 15 Years | 159 (86.0%) | 145 (100.0%) |
| 16 and 17 Years | 287 (88.3%) | 279 (100.0%) |
| 18 to 24 Years | 1,004 (97.1%) | 924 (91.2%) |
| 25 to 34 Years | 1,761 (92.1%) | 1,457 (85.9%) |
| 35 to 44 Years | 1,612 (92.4%) | 1,190 (89.9%) |
| 45 to 54 Years | 909 (95.7%) | 799 (96.6%) |
| 55 to 64 Years | 888 (81.8%) | 1,059 (88.6%) |
| 65 to 74 Years | 526 (97.1%) | 454 (90.6%) |
| 75 Years and over | 182 (100.0%) | 238 (99.2%) |
| Total | 9,355 (92.0%) | 7,962 (90.5%) |
Income Below Poverty Among Married-Couple Families in Cimarron Hills
The poverty statistics for married-couple families in Cimarron Hills show that 3.7% or 137 of the total 3,730 families live below the poverty line. Families with no children have the highest poverty rate of 5.3%, comprising of 100 families. On the other hand, families with 1 or 2 children have the lowest poverty rate of 1.6%, which includes 23 families.
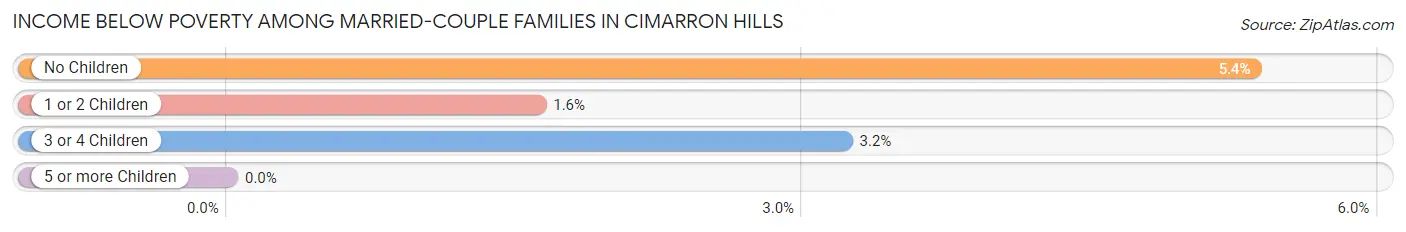
| Children | Above Poverty | Below Poverty |
| No Children | 1,769 (94.7%) | 100 (5.3%) |
| 1 or 2 Children | 1,402 (98.4%) | 23 (1.6%) |
| 3 or 4 Children | 422 (96.8%) | 14 (3.2%) |
| 5 or more Children | 0 (0.0%) | 0 (0.0%) |
| Total | 3,593 (96.3%) | 137 (3.7%) |
Income Below Poverty Among Single-Parent Households in Cimarron Hills
According to the poverty data in Cimarron Hills, 11.8% or 61 single-father households and 19.4% or 164 single-mother households are living below the poverty line. Among single-father households, those with 1 or 2 children have the highest poverty rate, with 47 households (19.9%) experiencing poverty. Likewise, among single-mother households, those with 1 or 2 children have the highest poverty rate, with 159 households (30.5%) falling below the poverty line.
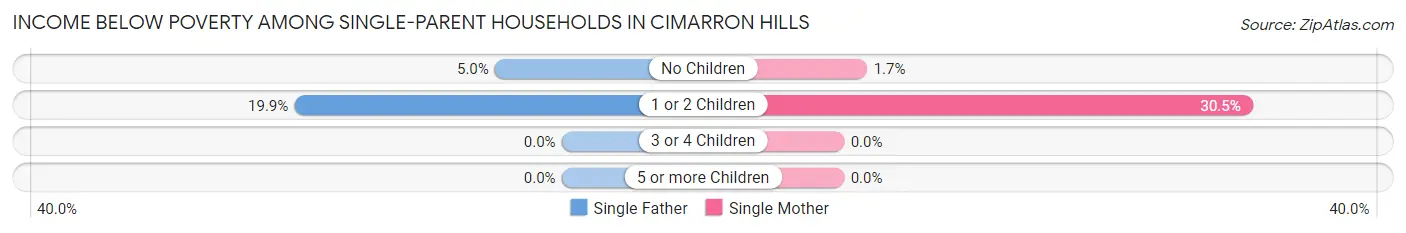
| Children | Single Father | Single Mother |
| No Children | 14 (5.0%) | 5 (1.7%) |
| 1 or 2 Children | 47 (19.9%) | 159 (30.5%) |
| 3 or 4 Children | 0 (0.0%) | 0 (0.0%) |
| 5 or more Children | 0 (0.0%) | 0 (0.0%) |
| Total | 61 (11.8%) | 164 (19.4%) |
Income Below Poverty Among Married-Couple vs Single-Parent Households in Cimarron Hills
The poverty data for Cimarron Hills shows that 137 of the married-couple family households (3.7%) and 225 of the single-parent households (16.5%) are living below the poverty level. Within the married-couple family households, those with no children have the highest poverty rate, with 100 households (5.3%) falling below the poverty line. Among the single-parent households, those with 1 or 2 children have the highest poverty rate, with 206 household (27.2%) living below poverty.
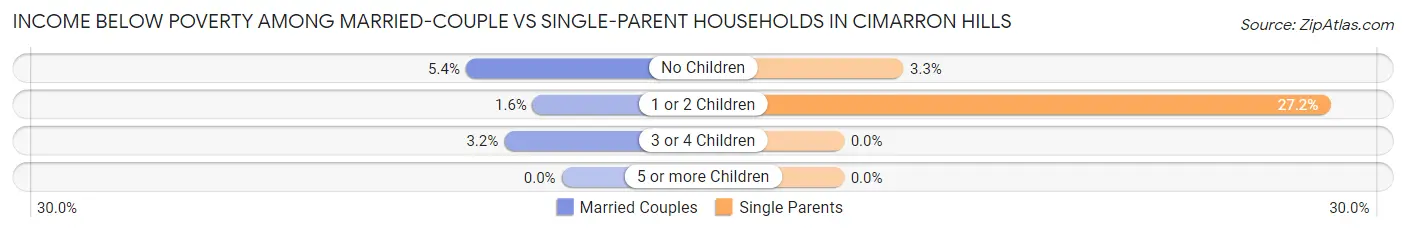
| Children | Married-Couple Families | Single-Parent Households |
| No Children | 100 (5.3%) | 19 (3.3%) |
| 1 or 2 Children | 23 (1.6%) | 206 (27.2%) |
| 3 or 4 Children | 14 (3.2%) | 0 (0.0%) |
| 5 or more Children | 0 (0.0%) | 0 (0.0%) |
| Total | 137 (3.7%) | 225 (16.5%) |
Race in Cimarron Hills
The most populous races in Cimarron Hills are White / Caucasian (13,347 | 70.1%), Hispanic or Latino (4,866 | 25.6%), and Two or more Races (3,159 | 16.6%).
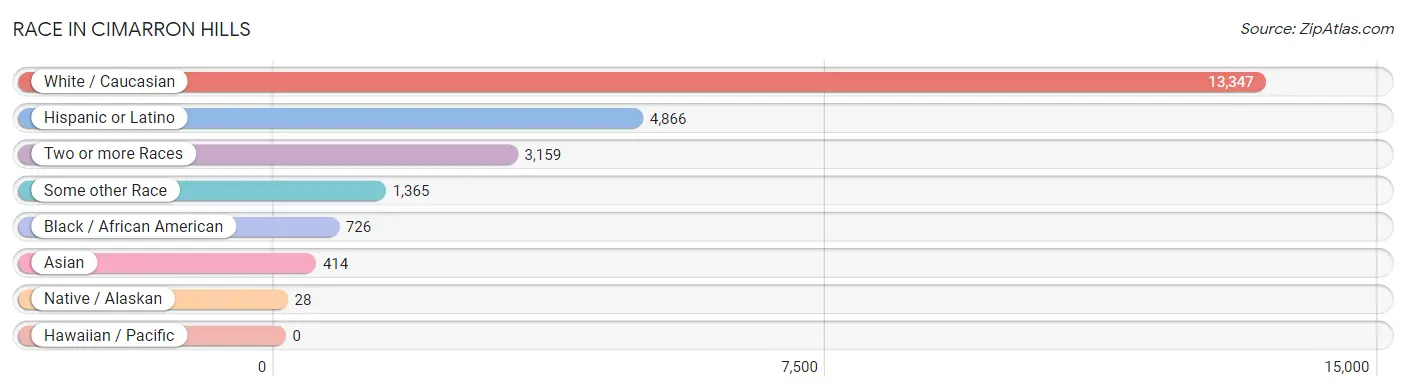
| Race | # Population | % Population |
| Asian | 414 | 2.2% |
| Black / African American | 726 | 3.8% |
| Hawaiian / Pacific | 0 | 0.0% |
| Hispanic or Latino | 4,866 | 25.6% |
| Native / Alaskan | 28 | 0.2% |
| White / Caucasian | 13,347 | 70.1% |
| Two or more Races | 3,159 | 16.6% |
| Some other Race | 1,365 | 7.2% |
| Total | 19,039 | 100.0% |
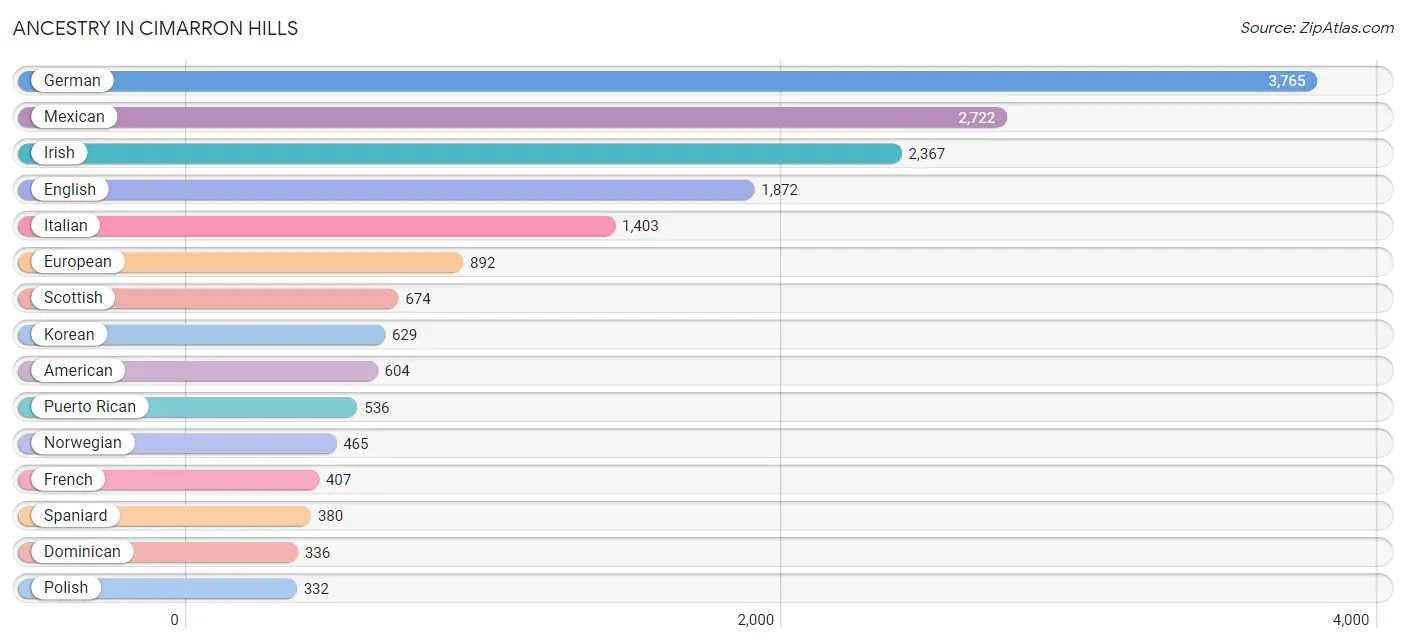
Ancestry in Cimarron Hills
The most populous ancestries reported in Cimarron Hills are German (3,765 | 19.8%), Mexican (2,722 | 14.3%), Irish (2,367 | 12.4%), English (1,872 | 9.8%), and Italian (1,403 | 7.4%), together accounting for 63.7% of all Cimarron Hills residents.
| Ancestry | # Population | % Population |
| Alaska Native | 4 | 0.0% |
| American | 604 | 3.2% |
| Arab | 10 | 0.1% |
| Argentinean | 216 | 1.1% |
| Austrian | 5 | 0.0% |
| Bhutanese | 232 | 1.2% |
| Brazilian | 51 | 0.3% |
| British | 154 | 0.8% |
| Burmese | 101 | 0.5% |
| Cajun | 9 | 0.1% |
| Canadian | 12 | 0.1% |
| Central American | 42 | 0.2% |
| Cherokee | 147 | 0.8% |
| Chippewa | 11 | 0.1% |
| Choctaw | 71 | 0.4% |
| Croatian | 17 | 0.1% |
| Cuban | 313 | 1.6% |
| Czech | 35 | 0.2% |
| Czechoslovakian | 82 | 0.4% |
| Delaware | 13 | 0.1% |
| Dominican | 336 | 1.8% |
| Dutch | 132 | 0.7% |
| Eastern European | 148 | 0.8% |
| English | 1,872 | 9.8% |
| European | 892 | 4.7% |
| Finnish | 21 | 0.1% |
| French | 407 | 2.1% |
| French Canadian | 51 | 0.3% |
| German | 3,765 | 19.8% |
| German Russian | 12 | 0.1% |
| Ghanaian | 41 | 0.2% |
| Greek | 9 | 0.1% |
| Hungarian | 37 | 0.2% |
| Indian (Asian) | 142 | 0.7% |
| Irish | 2,367 | 12.4% |
| Italian | 1,403 | 7.4% |
| Jamaican | 19 | 0.1% |
| Korean | 629 | 3.3% |
| Laotian | 37 | 0.2% |
| Latvian | 72 | 0.4% |
| Lithuanian | 15 | 0.1% |
| Mexican | 2,722 | 14.3% |
| Native Hawaiian | 278 | 1.5% |
| Norwegian | 465 | 2.4% |
| Pakistani | 14 | 0.1% |
| Panamanian | 35 | 0.2% |
| Peruvian | 11 | 0.1% |
| Polish | 332 | 1.7% |
| Portuguese | 194 | 1.0% |
| Puerto Rican | 536 | 2.8% |
| Romanian | 48 | 0.3% |
| Russian | 119 | 0.6% |
| Salvadoran | 7 | 0.0% |
| Scandinavian | 76 | 0.4% |
| Scotch-Irish | 174 | 0.9% |
| Scottish | 674 | 3.5% |
| Serbian | 28 | 0.2% |
| Sioux | 80 | 0.4% |
| Slovak | 32 | 0.2% |
| South American | 227 | 1.2% |
| Spaniard | 380 | 2.0% |
| Spanish | 152 | 0.8% |
| Spanish American | 97 | 0.5% |
| Sri Lankan | 33 | 0.2% |
| Subsaharan African | 94 | 0.5% |
| Swedish | 331 | 1.7% |
| Swiss | 39 | 0.2% |
| Syrian | 10 | 0.1% |
| Thai | 6 | 0.0% |
| Trinidadian and Tobagonian | 53 | 0.3% |
| Ukrainian | 57 | 0.3% |
| Ute | 71 | 0.4% |
| Welsh | 110 | 0.6% | View All 73 Rows |
Immigrants in Cimarron Hills
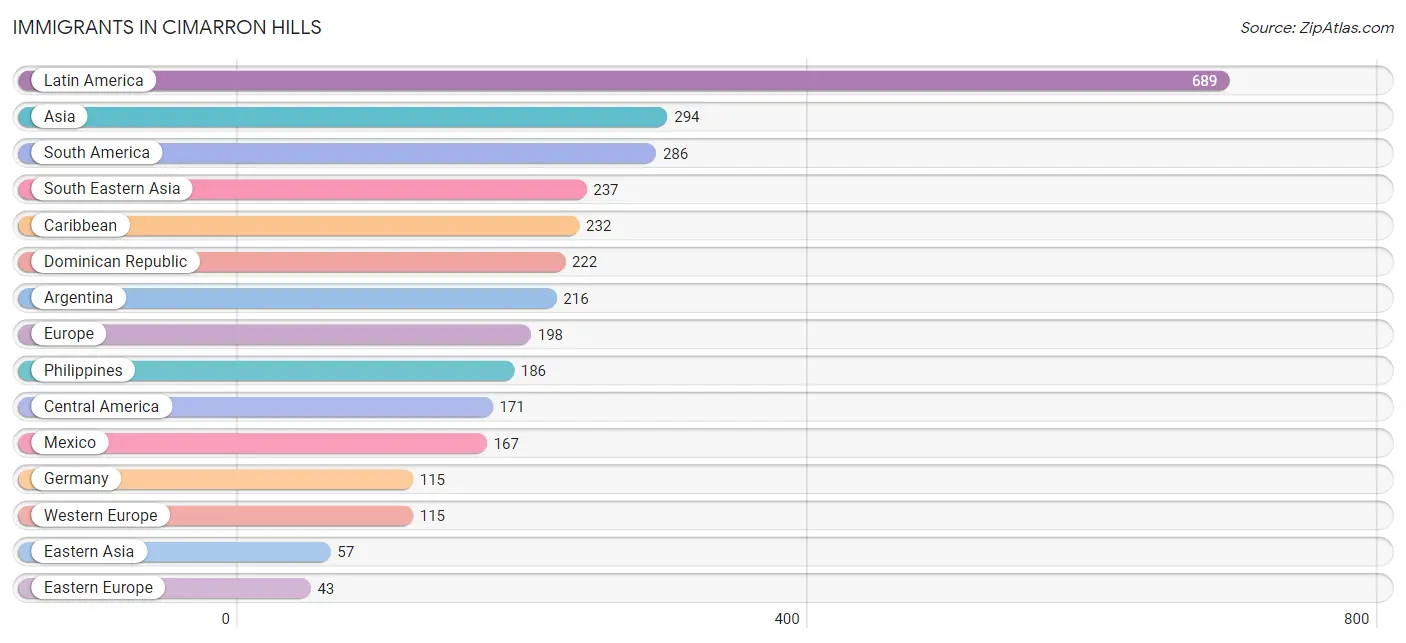
The most numerous immigrant groups reported in Cimarron Hills came from Latin America (689 | 3.6%), Asia (294 | 1.5%), South America (286 | 1.5%), South Eastern Asia (237 | 1.2%), and Caribbean (232 | 1.2%), together accounting for 9.1% of all Cimarron Hills residents.
| Immigration Origin | # Population | % Population |
| Africa | 24 | 0.1% |
| Argentina | 216 | 1.1% |
| Asia | 294 | 1.5% |
| Brazil | 37 | 0.2% |
| Canada | 7 | 0.0% |
| Caribbean | 232 | 1.2% |
| Central America | 171 | 0.9% |
| Chile | 18 | 0.1% |
| Dominican Republic | 222 | 1.2% |
| Eastern Asia | 57 | 0.3% |
| Eastern Europe | 43 | 0.2% |
| El Salvador | 4 | 0.0% |
| Europe | 198 | 1.0% |
| Germany | 115 | 0.6% |
| Ghana | 14 | 0.1% |
| Italy | 7 | 0.0% |
| Jamaica | 10 | 0.1% |
| Japan | 18 | 0.1% |
| Korea | 39 | 0.2% |
| Latin America | 689 | 3.6% |
| Latvia | 43 | 0.2% |
| Mexico | 167 | 0.9% |
| Northern Europe | 33 | 0.2% |
| Peru | 11 | 0.1% |
| Philippines | 186 | 1.0% |
| South America | 286 | 1.5% |
| South Eastern Asia | 237 | 1.2% |
| Southern Europe | 7 | 0.0% |
| Thailand | 18 | 0.1% |
| Venezuela | 4 | 0.0% |
| Vietnam | 33 | 0.2% |
| Western Africa | 14 | 0.1% |
| Western Europe | 115 | 0.6% | View All 33 Rows |
Sex and Age in Cimarron Hills
Sex and Age in Cimarron Hills
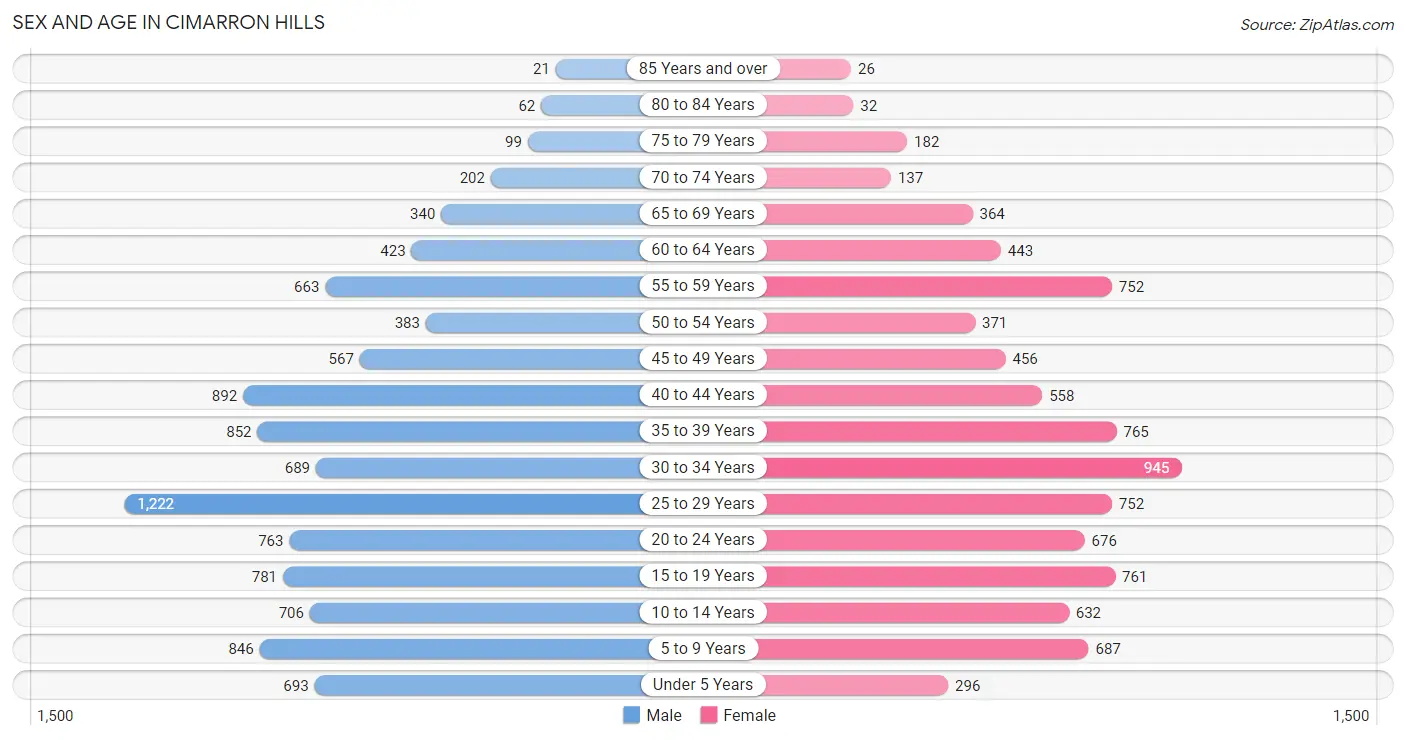
The most populous age groups in Cimarron Hills are 25 to 29 Years (1,222 | 12.0%) for men and 30 to 34 Years (945 | 10.7%) for women.
| Age Bracket | Male | Female |
| Under 5 Years | 693 (6.8%) | 296 (3.4%) |
| 5 to 9 Years | 846 (8.3%) | 687 (7.8%) |
| 10 to 14 Years | 706 (6.9%) | 632 (7.1%) |
| 15 to 19 Years | 781 (7.6%) | 761 (8.6%) |
| 20 to 24 Years | 763 (7.5%) | 676 (7.6%) |
| 25 to 29 Years | 1,222 (12.0%) | 752 (8.5%) |
| 30 to 34 Years | 689 (6.8%) | 945 (10.7%) |
| 35 to 39 Years | 852 (8.4%) | 765 (8.7%) |
| 40 to 44 Years | 892 (8.7%) | 558 (6.3%) |
| 45 to 49 Years | 567 (5.6%) | 456 (5.2%) |
| 50 to 54 Years | 383 (3.7%) | 371 (4.2%) |
| 55 to 59 Years | 663 (6.5%) | 752 (8.5%) |
| 60 to 64 Years | 423 (4.2%) | 443 (5.0%) |
| 65 to 69 Years | 340 (3.3%) | 364 (4.1%) |
| 70 to 74 Years | 202 (2.0%) | 137 (1.5%) |
| 75 to 79 Years | 99 (1.0%) | 182 (2.1%) |
| 80 to 84 Years | 62 (0.6%) | 32 (0.4%) |
| 85 Years and over | 21 (0.2%) | 26 (0.3%) |
| Total | 10,204 (100.0%) | 8,835 (100.0%) |
Families and Households in Cimarron Hills
Median Family Size in Cimarron Hills
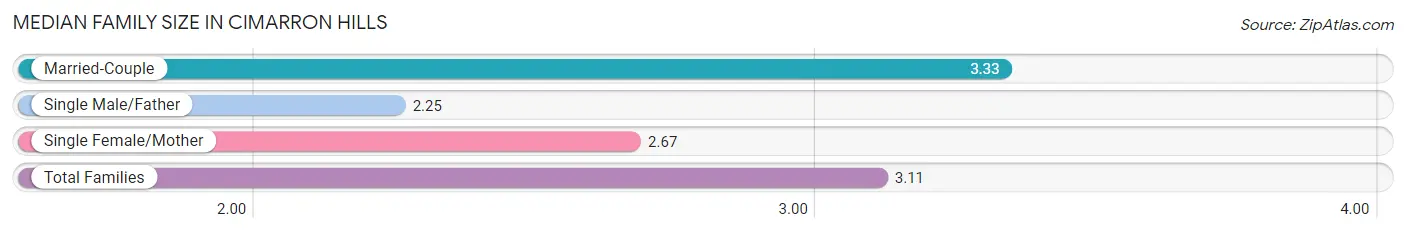
The median family size in Cimarron Hills is 3.11 persons per family, with married-couple families (3,730 | 73.3%) accounting for the largest median family size of 3.33 persons per family. On the other hand, single male/father families (517 | 10.2%) represent the smallest median family size with 2.25 persons per family.
| Family Type | # Families | Family Size |
| Married-Couple | 3,730 (73.3%) | 3.33 |
| Single Male/Father | 517 (10.2%) | 2.25 |
| Single Female/Mother | 845 (16.6%) | 2.67 |
| Total Families | 5,092 (100.0%) | 3.11 |
Median Household Size in Cimarron Hills
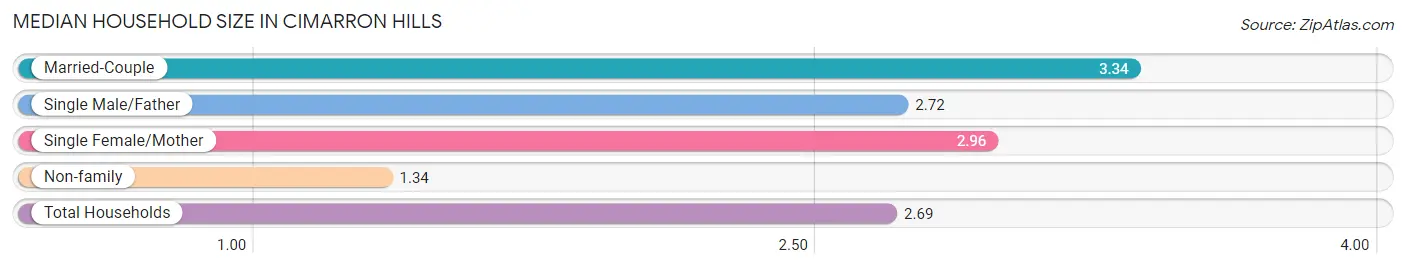
The median household size in Cimarron Hills is 2.69 persons per household, with married-couple households (3,730 | 52.8%) accounting for the largest median household size of 3.34 persons per household. non-family households (1,978 | 28.0%) represent the smallest median household size with 1.34 persons per household.
| Household Type | # Households | Household Size |
| Married-Couple | 3,730 (52.8%) | 3.34 |
| Single Male/Father | 517 (7.3%) | 2.72 |
| Single Female/Mother | 845 (11.9%) | 2.96 |
| Non-family | 1,978 (28.0%) | 1.34 |
| Total Households | 7,070 (100.0%) | 2.69 |
Household Size by Marriage Status in Cimarron Hills
Out of a total of 7,070 households in Cimarron Hills, 5,092 (72.0%) are family households, while 1,978 (28.0%) are nonfamily households. The most numerous type of family households are 2-person households, comprising 1,840, and the most common type of nonfamily households are 1-person households, comprising 1,499.
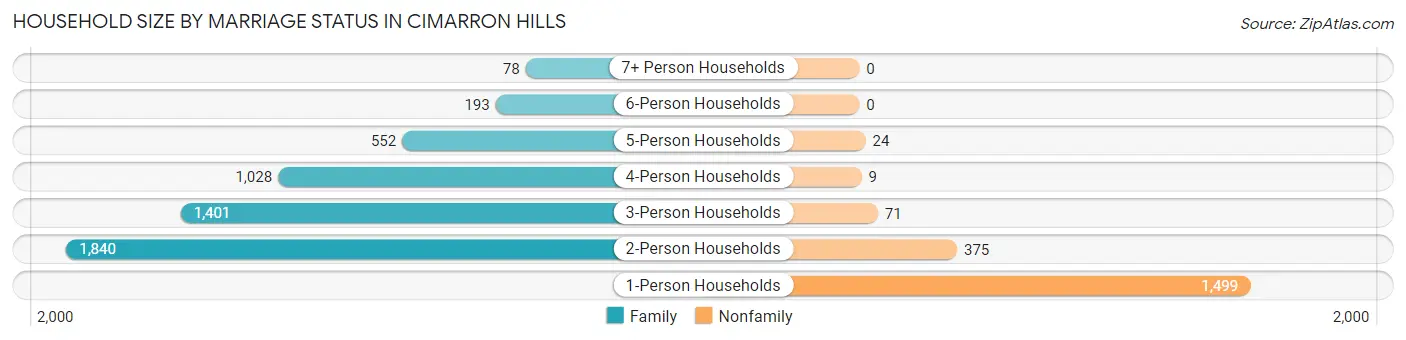
| Household Size | Family Households | Nonfamily Households |
| 1-Person Households | - | 1,499 (21.2%) |
| 2-Person Households | 1,840 (26.0%) | 375 (5.3%) |
| 3-Person Households | 1,401 (19.8%) | 71 (1.0%) |
| 4-Person Households | 1,028 (14.5%) | 9 (0.1%) |
| 5-Person Households | 552 (7.8%) | 24 (0.3%) |
| 6-Person Households | 193 (2.7%) | 0 (0.0%) |
| 7+ Person Households | 78 (1.1%) | 0 (0.0%) |
| Total | 5,092 (72.0%) | 1,978 (28.0%) |
Female Fertility in Cimarron Hills
Fertility by Age in Cimarron Hills
Average fertility rate in Cimarron Hills is 40.0 births per 1,000 women. Women in the age bracket of 20 to 34 years have the highest fertility rate with 65.0 births per 1,000 women. Women in the age bracket of 20 to 34 years acount for 77.8% of all women with births.
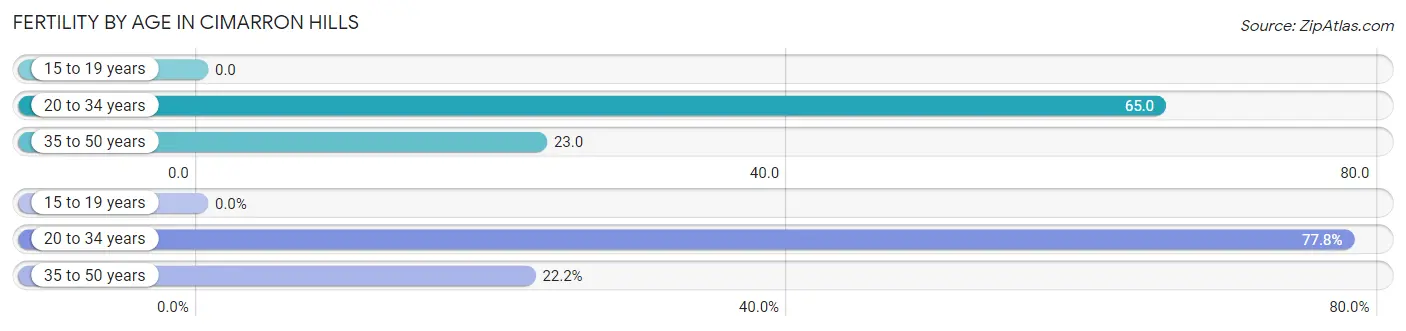
| Age Bracket | Women with Births | Births / 1,000 Women |
| 15 to 19 years | 0 (0.0%) | 0.0 |
| 20 to 34 years | 154 (77.8%) | 65.0 |
| 35 to 50 years | 44 (22.2%) | 23.0 |
| Total | 198 (100.0%) | 40.0 |
Fertility by Age by Marriage Status in Cimarron Hills
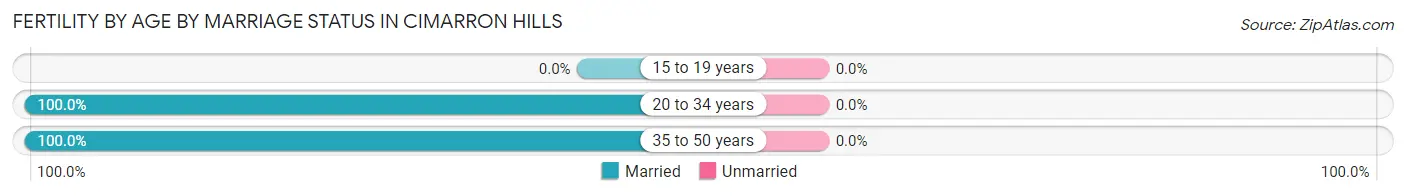
| Age Bracket | Married | Unmarried |
| 15 to 19 years | 0 (0.0%) | 0 (0.0%) |
| 20 to 34 years | 154 (100.0%) | 0 (0.0%) |
| 35 to 50 years | 44 (100.0%) | 0 (0.0%) |
| Total | 198 (100.0%) | 0 (0.0%) |
Fertility by Education in Cimarron Hills
Average fertility rate in Cimarron Hills is 40.0 births per 1,000 women. Women with the education attainment of bachelor's degree have the highest fertility rate of 79.0 births per 1,000 women, while women with the education attainment of high school diploma have the lowest fertility at 19.0 births per 1,000 women. Women with the education attainment of bachelor's degree represent 42.4% of all women with births.
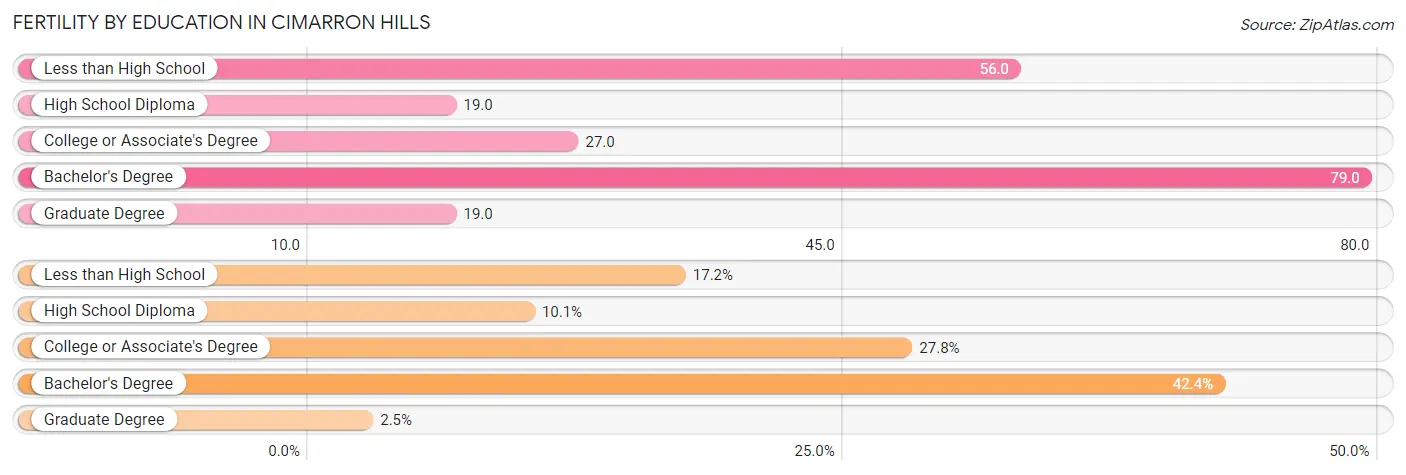
| Educational Attainment | Women with Births | Births / 1,000 Women |
| Less than High School | 34 (17.2%) | 56.0 |
| High School Diploma | 20 (10.1%) | 19.0 |
| College or Associate's Degree | 55 (27.8%) | 27.0 |
| Bachelor's Degree | 84 (42.4%) | 79.0 |
| Graduate Degree | 5 (2.5%) | 19.0 |
| Total | 198 (100.0%) | 40.0 |
Fertility by Education by Marriage Status in Cimarron Hills
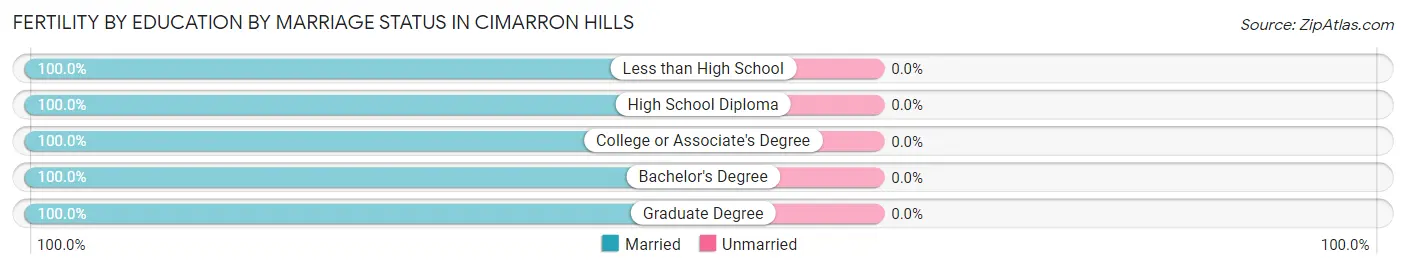
| Educational Attainment | Married | Unmarried |
| Less than High School | 34 (100.0%) | 0 (0.0%) |
| High School Diploma | 20 (100.0%) | 0 (0.0%) |
| College or Associate's Degree | 55 (100.0%) | 0 (0.0%) |
| Bachelor's Degree | 84 (100.0%) | 0 (0.0%) |
| Graduate Degree | 5 (100.0%) | 0 (0.0%) |
| Total | 198 (100.0%) | 0 (0.0%) |
Employment Characteristics in Cimarron Hills
Employment by Class of Employer in Cimarron Hills
Among the 9,909 employed individuals in Cimarron Hills, private company employees (6,482 | 65.4%), federal government employees (1,274 | 12.9%), and local government employees (831 | 8.4%) make up the most common classes of employment.
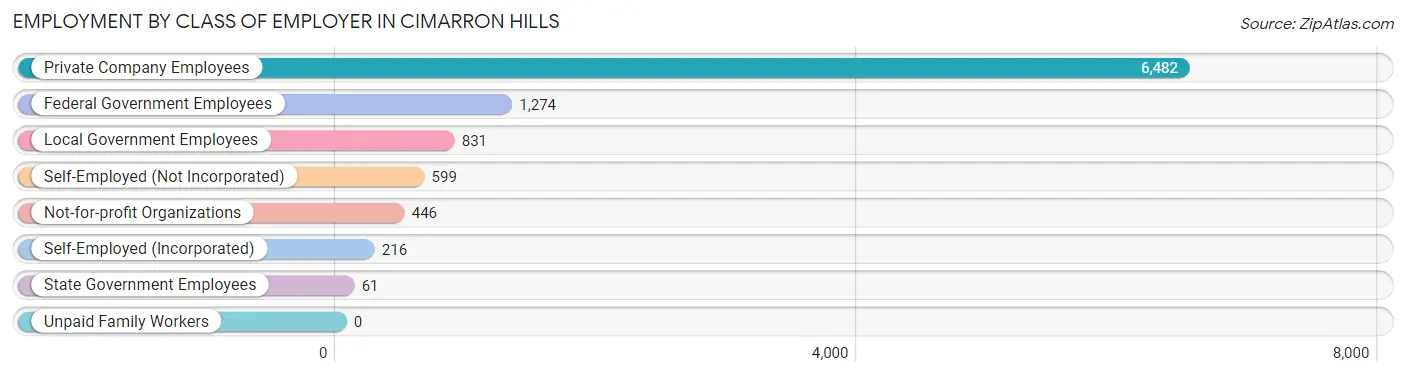
| Employer Class | # Employees | % Employees |
| Private Company Employees | 6,482 | 65.4% |
| Self-Employed (Incorporated) | 216 | 2.2% |
| Self-Employed (Not Incorporated) | 599 | 6.0% |
| Not-for-profit Organizations | 446 | 4.5% |
| Local Government Employees | 831 | 8.4% |
| State Government Employees | 61 | 0.6% |
| Federal Government Employees | 1,274 | 12.9% |
| Unpaid Family Workers | 0 | 0.0% |
| Total | 9,909 | 100.0% |
Employment Status by Age in Cimarron Hills
According to the labor force statistics for Cimarron Hills, out of the total population over 16 years of age (14,849), 71.4% or 10,602 individuals are in the labor force, with 5.4% or 573 of them unemployed. The age group with the highest labor force participation rate is 25 to 29 years, with 90.2% or 1,781 individuals in the labor force. Within the labor force, the 55 to 59 years age range has the highest percentage of unemployed individuals, with 13.0% or 120 of them being unemployed.
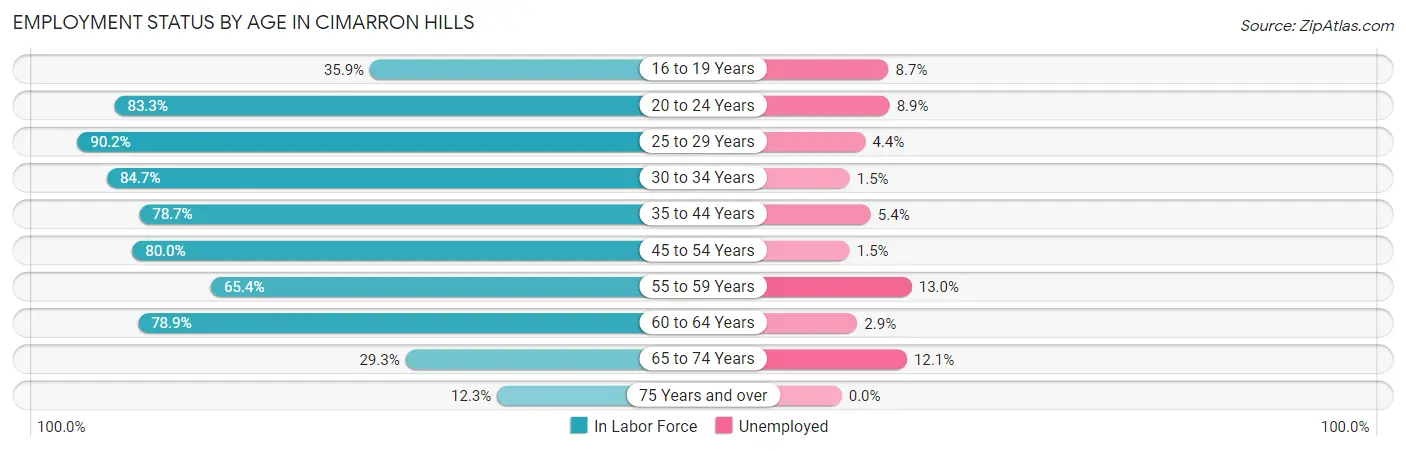
| Age Bracket | In Labor Force | Unemployed |
| 16 to 19 Years | 435 (35.9%) | 38 (8.7%) |
| 20 to 24 Years | 1,199 (83.3%) | 107 (8.9%) |
| 25 to 29 Years | 1,781 (90.2%) | 78 (4.4%) |
| 30 to 34 Years | 1,384 (84.7%) | 21 (1.5%) |
| 35 to 44 Years | 2,414 (78.7%) | 130 (5.4%) |
| 45 to 54 Years | 1,422 (80.0%) | 21 (1.5%) |
| 55 to 59 Years | 925 (65.4%) | 120 (13.0%) |
| 60 to 64 Years | 683 (78.9%) | 20 (2.9%) |
| 65 to 74 Years | 306 (29.3%) | 37 (12.1%) |
| 75 Years and over | 52 (12.3%) | 0 (0.0%) |
| Total | 10,602 (71.4%) | 573 (5.4%) |
Employment Status by Educational Attainment in Cimarron Hills
According to labor force statistics for Cimarron Hills, 80.2% of individuals (8,608) out of the total population between 25 and 64 years of age (10,733) are in the labor force, with 4.5% or 387 of them being unemployed. The group with the highest labor force participation rate are those with the educational attainment of bachelor's degree or higher, with 86.7% or 2,808 individuals in the labor force. Within the labor force, individuals with less than high school education have the highest percentage of unemployment, with 36.0% or 103 of them being unemployed.
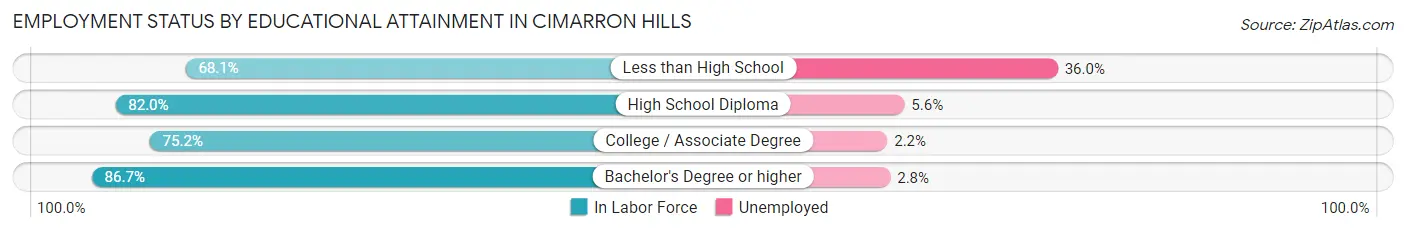
| Educational Attainment | In Labor Force | Unemployed |
| Less than High School | 286 (68.1%) | 151 (36.0%) |
| High School Diploma | 2,330 (82.0%) | 159 (5.6%) |
| College / Associate Degree | 3,183 (75.2%) | 93 (2.2%) |
| Bachelor's Degree or higher | 2,808 (86.7%) | 91 (2.8%) |
| Total | 8,608 (80.2%) | 483 (4.5%) |
Employment Occupations by Sex in Cimarron Hills
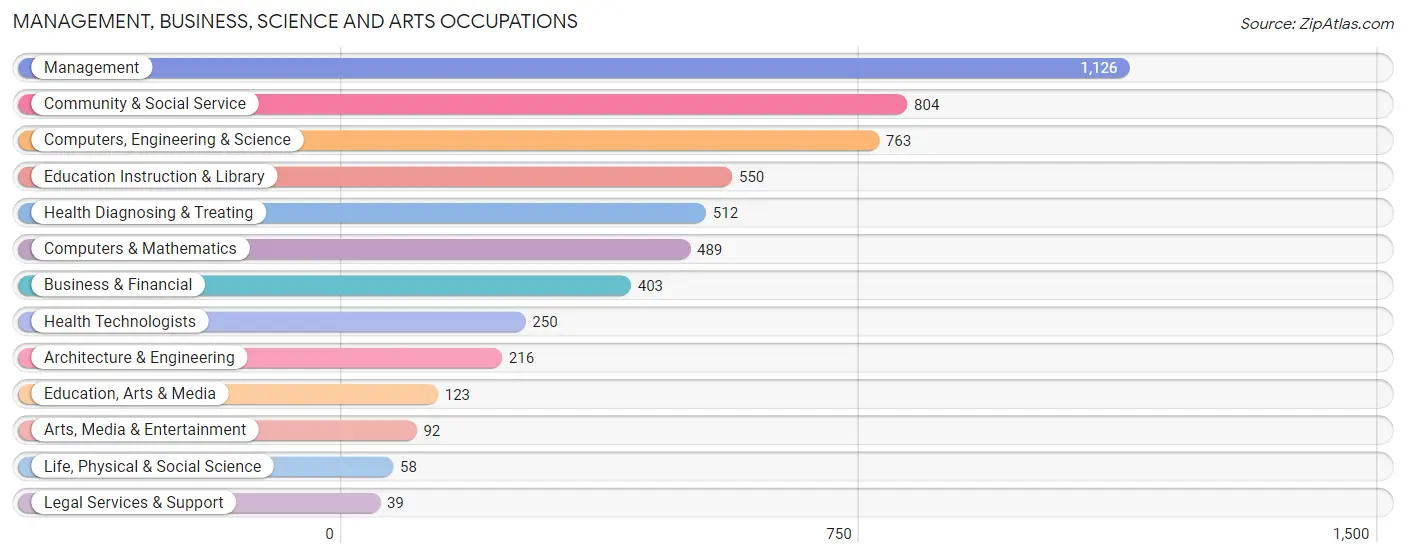
Management, Business, Science and Arts Occupations
The most common Management, Business, Science and Arts occupations in Cimarron Hills are Management (1,126 | 11.9%), Community & Social Service (804 | 8.5%), Computers, Engineering & Science (763 | 8.1%), Education Instruction & Library (550 | 5.8%), and Health Diagnosing & Treating (512 | 5.4%).
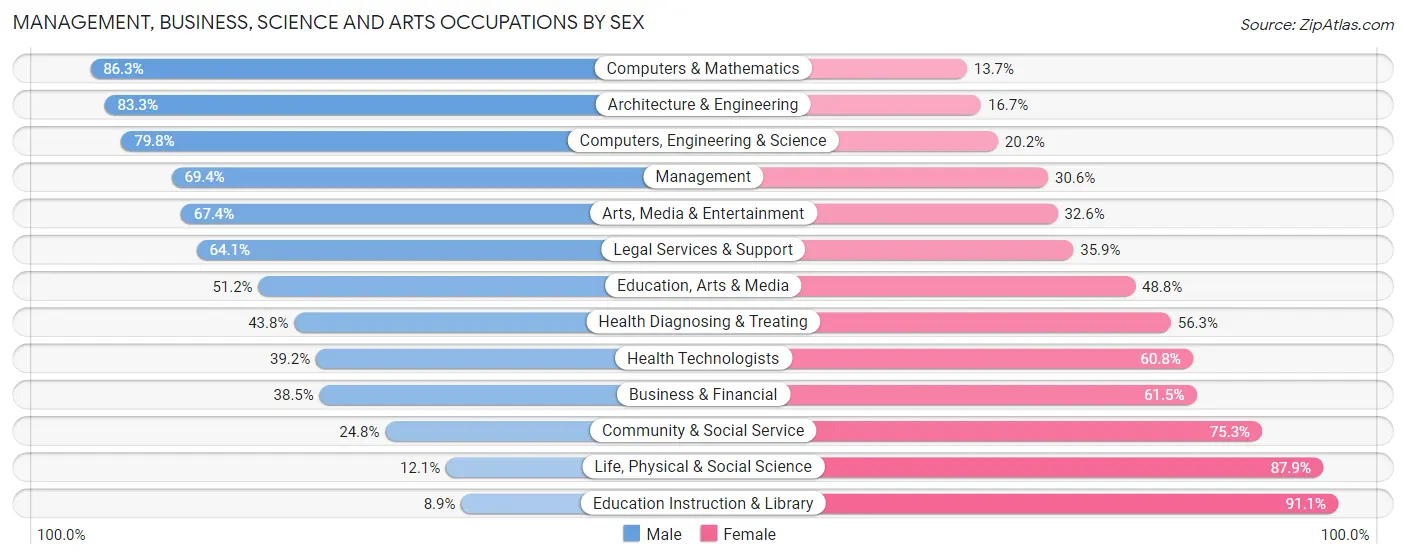
Management, Business, Science and Arts Occupations by Sex
Within the Management, Business, Science and Arts occupations in Cimarron Hills, the most male-oriented occupations are Computers & Mathematics (86.3%), Architecture & Engineering (83.3%), and Computers, Engineering & Science (79.8%), while the most female-oriented occupations are Education Instruction & Library (91.1%), Life, Physical & Social Science (87.9%), and Community & Social Service (75.2%).
| Occupation | Male | Female |
| Management | 781 (69.4%) | 345 (30.6%) |
| Business & Financial | 155 (38.5%) | 248 (61.5%) |
| Computers, Engineering & Science | 609 (79.8%) | 154 (20.2%) |
| Computers & Mathematics | 422 (86.3%) | 67 (13.7%) |
| Architecture & Engineering | 180 (83.3%) | 36 (16.7%) |
| Life, Physical & Social Science | 7 (12.1%) | 51 (87.9%) |
| Community & Social Service | 199 (24.7%) | 605 (75.2%) |
| Education, Arts & Media | 63 (51.2%) | 60 (48.8%) |
| Legal Services & Support | 25 (64.1%) | 14 (35.9%) |
| Education Instruction & Library | 49 (8.9%) | 501 (91.1%) |
| Arts, Media & Entertainment | 62 (67.4%) | 30 (32.6%) |
| Health Diagnosing & Treating | 224 (43.8%) | 288 (56.2%) |
| Health Technologists | 98 (39.2%) | 152 (60.8%) |
| Total (Category) | 1,968 (54.5%) | 1,640 (45.5%) |
| Total (Overall) | 5,092 (53.8%) | 4,366 (46.2%) |
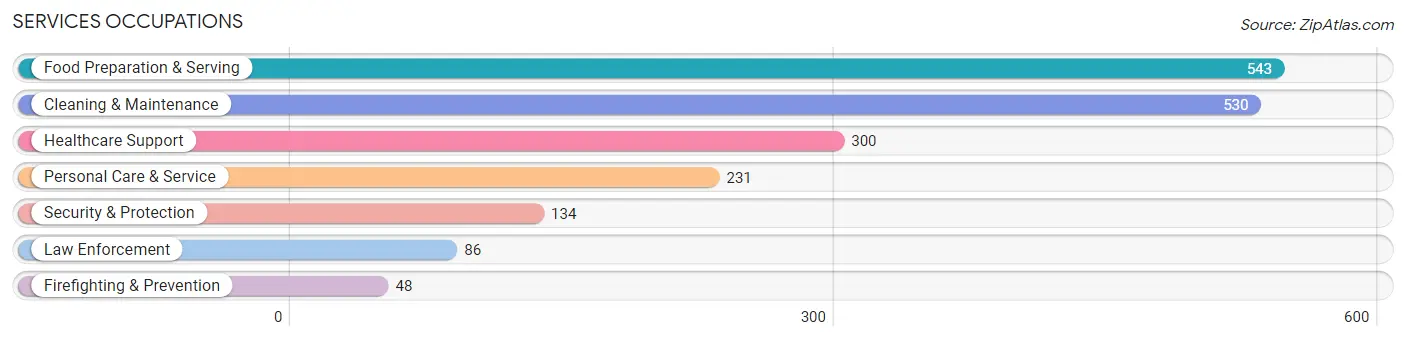
Services Occupations
The most common Services occupations in Cimarron Hills are Food Preparation & Serving (543 | 5.7%), Cleaning & Maintenance (530 | 5.6%), Healthcare Support (300 | 3.2%), Personal Care & Service (231 | 2.4%), and Security & Protection (134 | 1.4%).
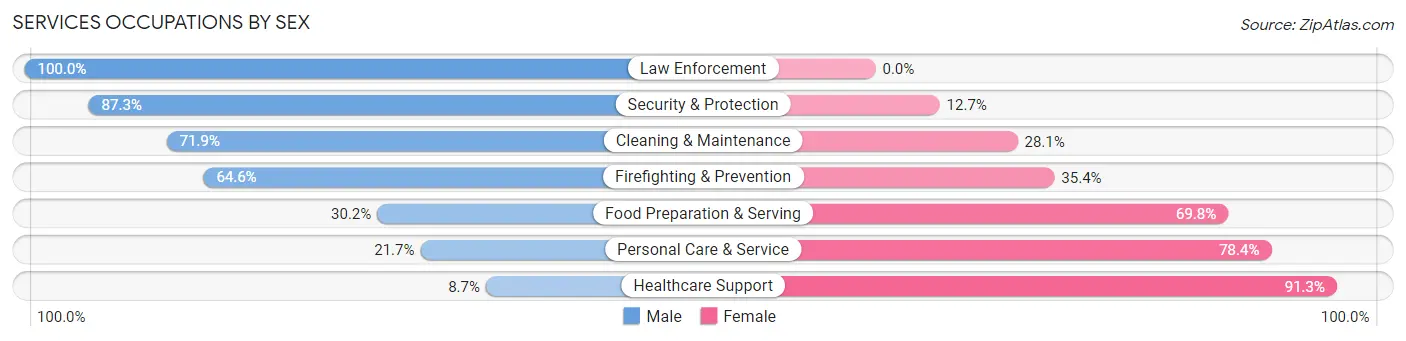
Services Occupations by Sex
Within the Services occupations in Cimarron Hills, the most male-oriented occupations are Law Enforcement (100.0%), Security & Protection (87.3%), and Cleaning & Maintenance (71.9%), while the most female-oriented occupations are Healthcare Support (91.3%), Personal Care & Service (78.3%), and Food Preparation & Serving (69.8%).
| Occupation | Male | Female |
| Healthcare Support | 26 (8.7%) | 274 (91.3%) |
| Security & Protection | 117 (87.3%) | 17 (12.7%) |
| Firefighting & Prevention | 31 (64.6%) | 17 (35.4%) |
| Law Enforcement | 86 (100.0%) | 0 (0.0%) |
| Food Preparation & Serving | 164 (30.2%) | 379 (69.8%) |
| Cleaning & Maintenance | 381 (71.9%) | 149 (28.1%) |
| Personal Care & Service | 50 (21.6%) | 181 (78.3%) |
| Total (Category) | 738 (42.5%) | 1,000 (57.5%) |
| Total (Overall) | 5,092 (53.8%) | 4,366 (46.2%) |
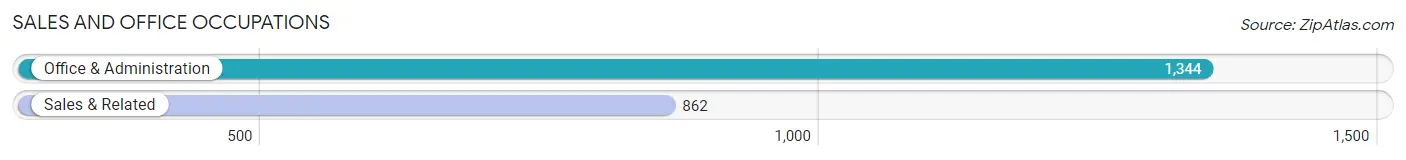
Sales and Office Occupations
The most common Sales and Office occupations in Cimarron Hills are Office & Administration (1,344 | 14.2%), and Sales & Related (862 | 9.1%).
Sales and Office Occupations by Sex
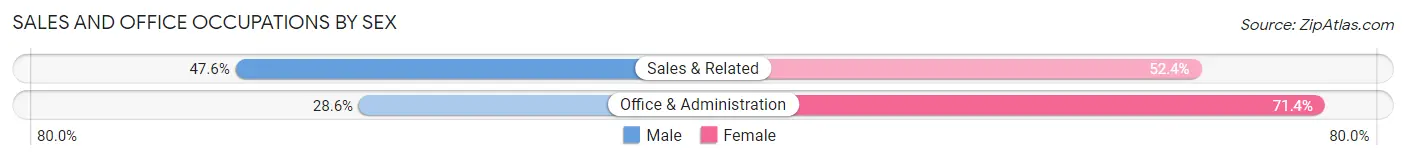
| Occupation | Male | Female |
| Sales & Related | 410 (47.6%) | 452 (52.4%) |
| Office & Administration | 384 (28.6%) | 960 (71.4%) |
| Total (Category) | 794 (36.0%) | 1,412 (64.0%) |
| Total (Overall) | 5,092 (53.8%) | 4,366 (46.2%) |
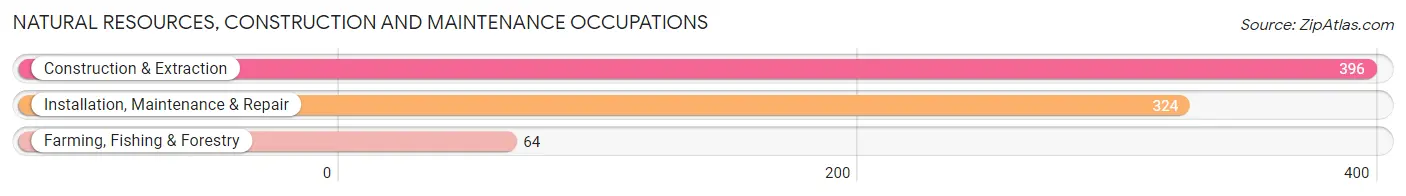
Natural Resources, Construction and Maintenance Occupations
The most common Natural Resources, Construction and Maintenance occupations in Cimarron Hills are Construction & Extraction (396 | 4.2%), Installation, Maintenance & Repair (324 | 3.4%), and Farming, Fishing & Forestry (64 | 0.7%).
Natural Resources, Construction and Maintenance Occupations by Sex
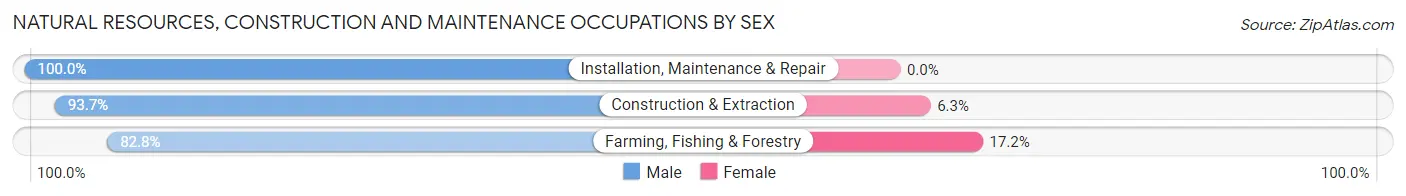
| Occupation | Male | Female |
| Farming, Fishing & Forestry | 53 (82.8%) | 11 (17.2%) |
| Construction & Extraction | 371 (93.7%) | 25 (6.3%) |
| Installation, Maintenance & Repair | 324 (100.0%) | 0 (0.0%) |
| Total (Category) | 748 (95.4%) | 36 (4.6%) |
| Total (Overall) | 5,092 (53.8%) | 4,366 (46.2%) |
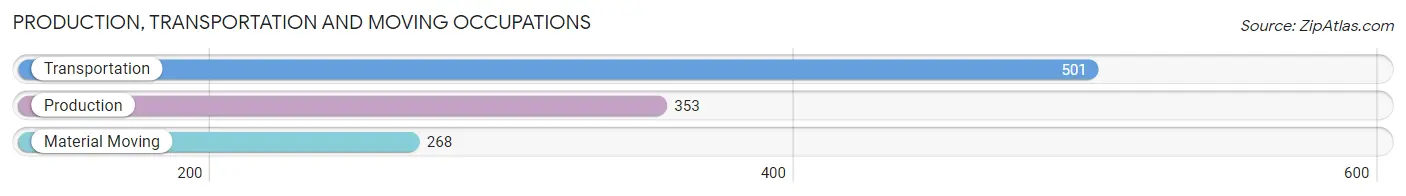
Production, Transportation and Moving Occupations
The most common Production, Transportation and Moving occupations in Cimarron Hills are Transportation (501 | 5.3%), Production (353 | 3.7%), and Material Moving (268 | 2.8%).
Production, Transportation and Moving Occupations by Sex
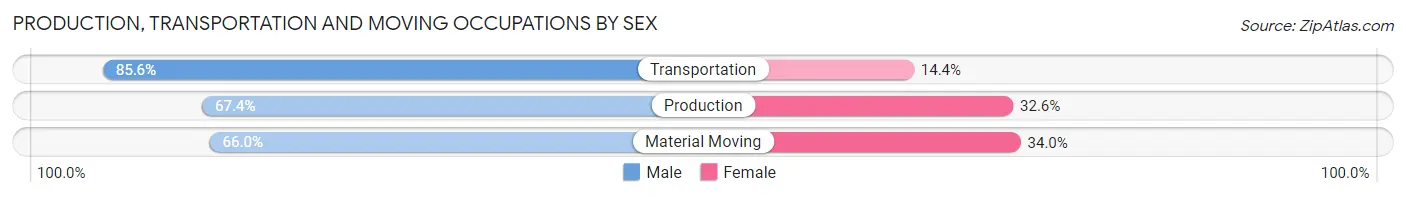
| Occupation | Male | Female |
| Production | 238 (67.4%) | 115 (32.6%) |
| Transportation | 429 (85.6%) | 72 (14.4%) |
| Material Moving | 177 (66.0%) | 91 (34.0%) |
| Total (Category) | 844 (75.2%) | 278 (24.8%) |
| Total (Overall) | 5,092 (53.8%) | 4,366 (46.2%) |
Employment Industries by Sex in Cimarron Hills
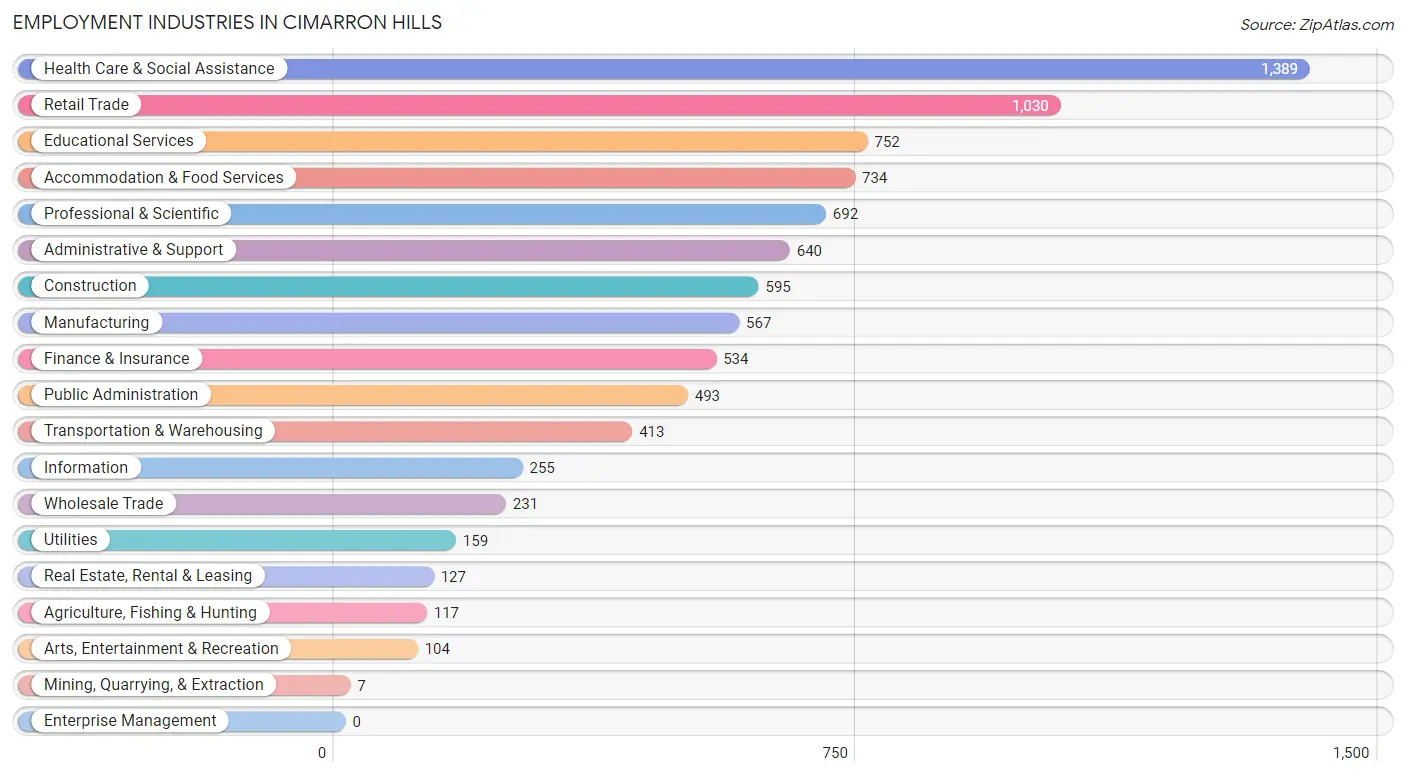
Employment Industries in Cimarron Hills
The major employment industries in Cimarron Hills include Health Care & Social Assistance (1,389 | 14.7%), Retail Trade (1,030 | 10.9%), Educational Services (752 | 8.0%), Accommodation & Food Services (734 | 7.8%), and Professional & Scientific (692 | 7.3%).
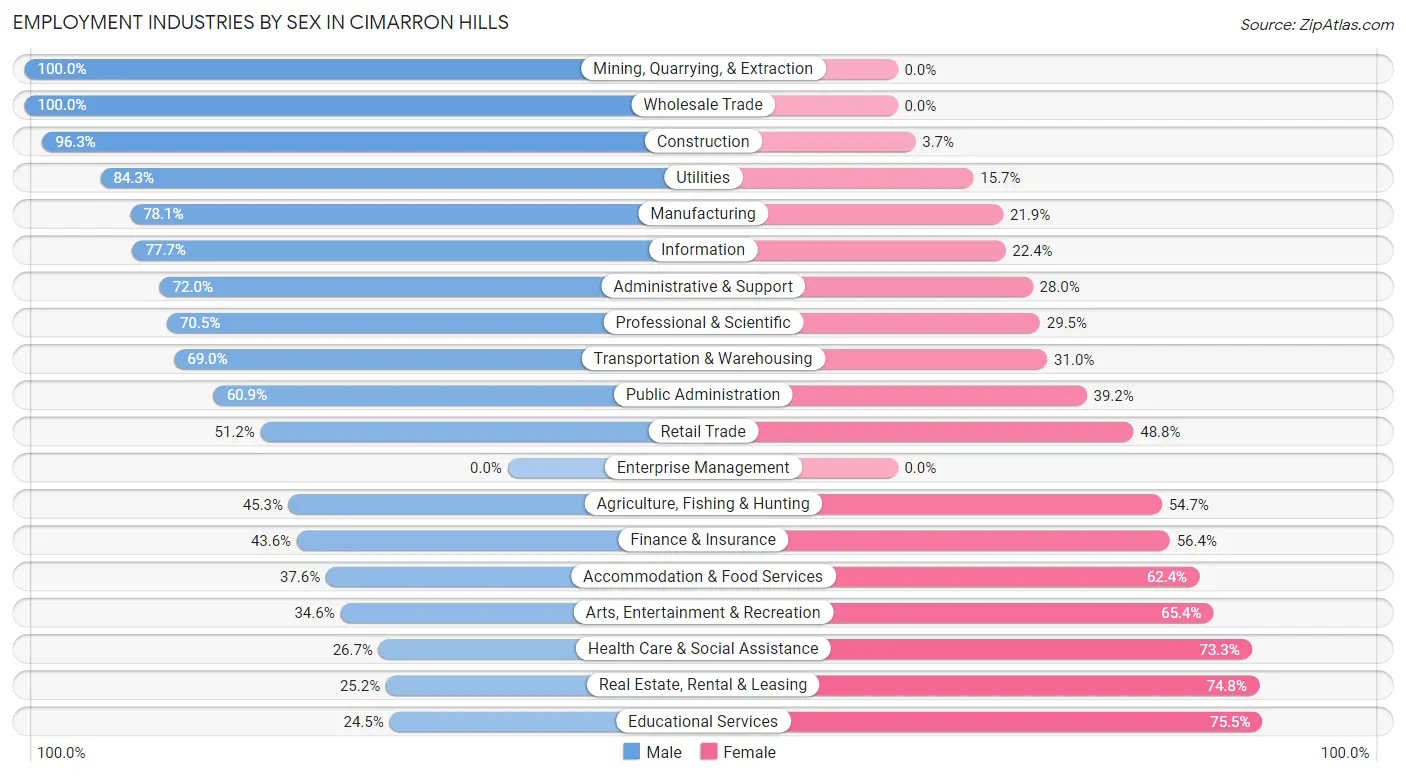
Employment Industries by Sex in Cimarron Hills
The Cimarron Hills industries that see more men than women are Mining, Quarrying, & Extraction (100.0%), Wholesale Trade (100.0%), and Construction (96.3%), whereas the industries that tend to have a higher number of women are Educational Services (75.5%), Real Estate, Rental & Leasing (74.8%), and Health Care & Social Assistance (73.3%).
| Industry | Male | Female |
| Agriculture, Fishing & Hunting | 53 (45.3%) | 64 (54.7%) |
| Mining, Quarrying, & Extraction | 7 (100.0%) | 0 (0.0%) |
| Construction | 573 (96.3%) | 22 (3.7%) |
| Manufacturing | 443 (78.1%) | 124 (21.9%) |
| Wholesale Trade | 231 (100.0%) | 0 (0.0%) |
| Retail Trade | 527 (51.2%) | 503 (48.8%) |
| Transportation & Warehousing | 285 (69.0%) | 128 (31.0%) |
| Utilities | 134 (84.3%) | 25 (15.7%) |
| Information | 198 (77.6%) | 57 (22.4%) |
| Finance & Insurance | 233 (43.6%) | 301 (56.4%) |
| Real Estate, Rental & Leasing | 32 (25.2%) | 95 (74.8%) |
| Professional & Scientific | 488 (70.5%) | 204 (29.5%) |
| Enterprise Management | 0 (0.0%) | 0 (0.0%) |
| Administrative & Support | 461 (72.0%) | 179 (28.0%) |
| Educational Services | 184 (24.5%) | 568 (75.5%) |
| Health Care & Social Assistance | 371 (26.7%) | 1,018 (73.3%) |
| Arts, Entertainment & Recreation | 36 (34.6%) | 68 (65.4%) |
| Accommodation & Food Services | 276 (37.6%) | 458 (62.4%) |
| Public Administration | 300 (60.9%) | 193 (39.2%) |
| Total | 5,092 (53.8%) | 4,366 (46.2%) |
Education in Cimarron Hills
School Enrollment in Cimarron Hills
The most common levels of schooling among the 5,373 students in Cimarron Hills are elementary school (1,288 | 24.0%), high school (1,177 | 21.9%), and college / undergraduate (1,120 | 20.8%).
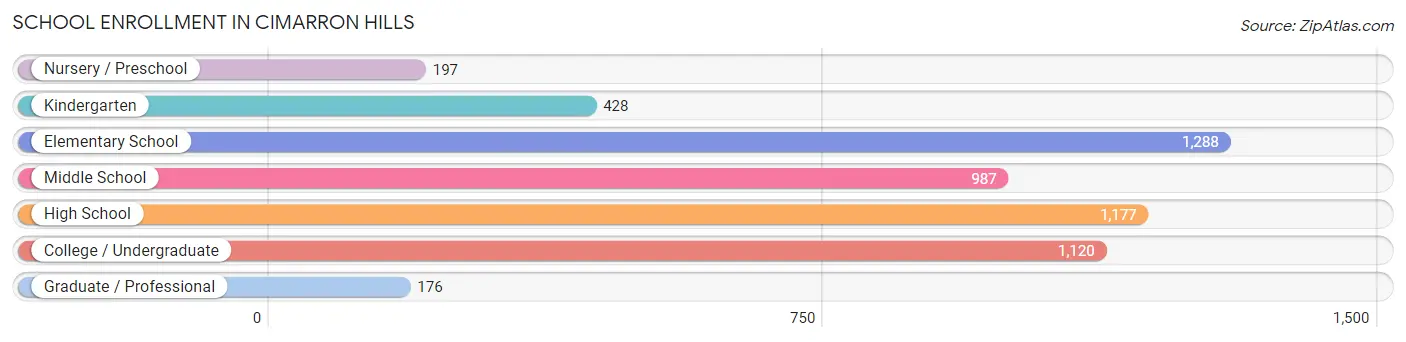
| School Level | # Students | % Students |
| Nursery / Preschool | 197 | 3.7% |
| Kindergarten | 428 | 8.0% |
| Elementary School | 1,288 | 24.0% |
| Middle School | 987 | 18.4% |
| High School | 1,177 | 21.9% |
| College / Undergraduate | 1,120 | 20.8% |
| Graduate / Professional | 176 | 3.3% |
| Total | 5,373 | 100.0% |
School Enrollment by Age by Funding Source in Cimarron Hills
Out of a total of 5,373 students who are enrolled in schools in Cimarron Hills, 741 (13.8%) attend a private institution, while the remaining 4,632 (86.2%) are enrolled in public schools. The age group of 18 to 19 year olds has the highest likelihood of being enrolled in private schools, with 83 (23.6% in the age bracket) enrolled. Conversely, the age group of 25 to 34 year olds has the lowest likelihood of being enrolled in a private school, with 516 (100.0% in the age bracket) attending a public institution.
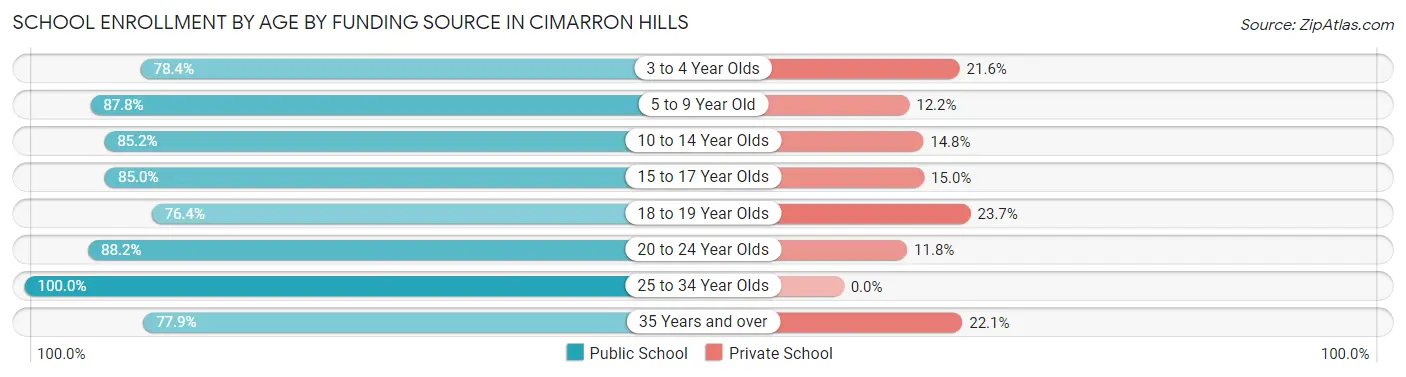
| Age Bracket | Public School | Private School |
| 3 to 4 Year Olds | 127 (78.4%) | 35 (21.6%) |
| 5 to 9 Year Old | 1,300 (87.8%) | 181 (12.2%) |
| 10 to 14 Year Olds | 1,097 (85.2%) | 191 (14.8%) |
| 15 to 17 Year Olds | 794 (85.0%) | 140 (15.0%) |
| 18 to 19 Year Olds | 268 (76.3%) | 83 (23.6%) |
| 20 to 24 Year Olds | 246 (88.2%) | 33 (11.8%) |
| 25 to 34 Year Olds | 516 (100.0%) | 0 (0.0%) |
| 35 Years and over | 282 (77.9%) | 80 (22.1%) |
| Total | 4,632 (86.2%) | 741 (13.8%) |
Educational Attainment by Field of Study in Cimarron Hills
Business (1,101 | 27.7%), science & technology (591 | 14.9%), education (323 | 8.1%), computers & mathematics (291 | 7.3%), and arts & humanities (231 | 5.8%) are the most common fields of study among 3,977 individuals in Cimarron Hills who have obtained a bachelor's degree or higher.
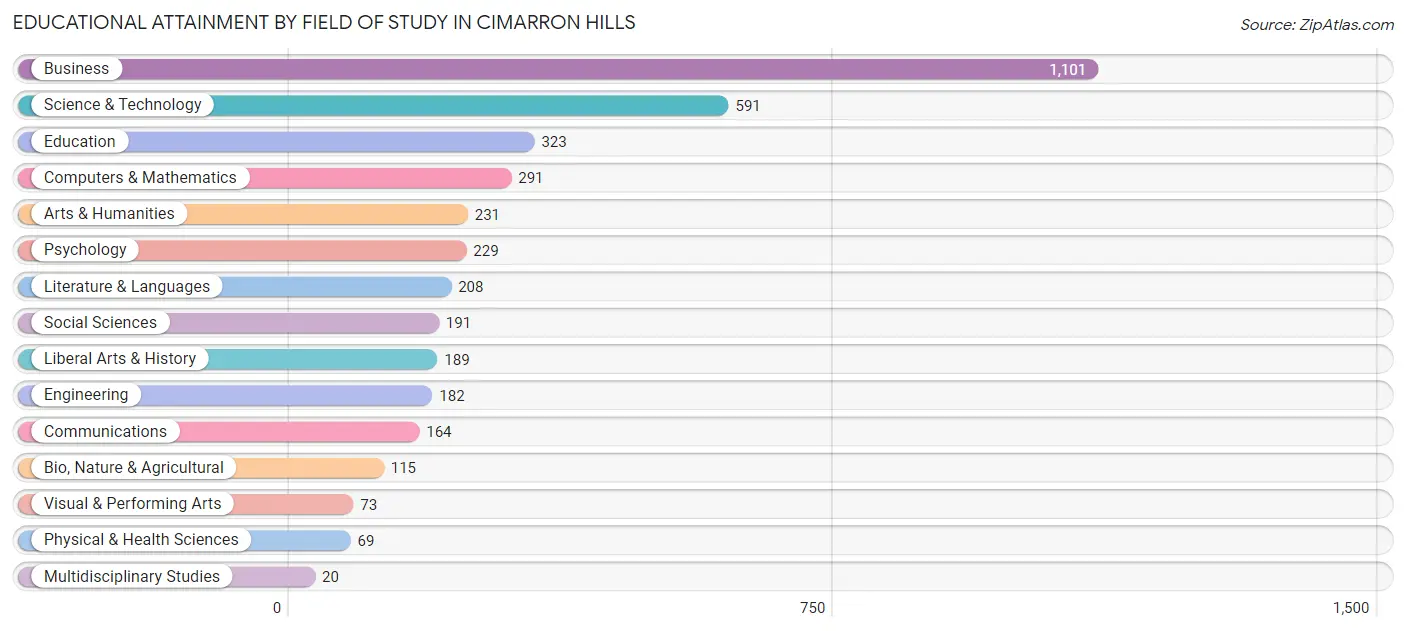
| Field of Study | # Graduates | % Graduates |
| Computers & Mathematics | 291 | 7.3% |
| Bio, Nature & Agricultural | 115 | 2.9% |
| Physical & Health Sciences | 69 | 1.7% |
| Psychology | 229 | 5.8% |
| Social Sciences | 191 | 4.8% |
| Engineering | 182 | 4.6% |
| Multidisciplinary Studies | 20 | 0.5% |
| Science & Technology | 591 | 14.9% |
| Business | 1,101 | 27.7% |
| Education | 323 | 8.1% |
| Literature & Languages | 208 | 5.2% |
| Liberal Arts & History | 189 | 4.8% |
| Visual & Performing Arts | 73 | 1.8% |
| Communications | 164 | 4.1% |
| Arts & Humanities | 231 | 5.8% |
| Total | 3,977 | 100.0% |
Transportation & Commute in Cimarron Hills
Vehicle Availability by Sex in Cimarron Hills
The most prevalent vehicle ownership categories in Cimarron Hills are males with 2 vehicles (1,837, accounting for 33.0%) and females with 2 vehicles (1,587, making up 42.3%).
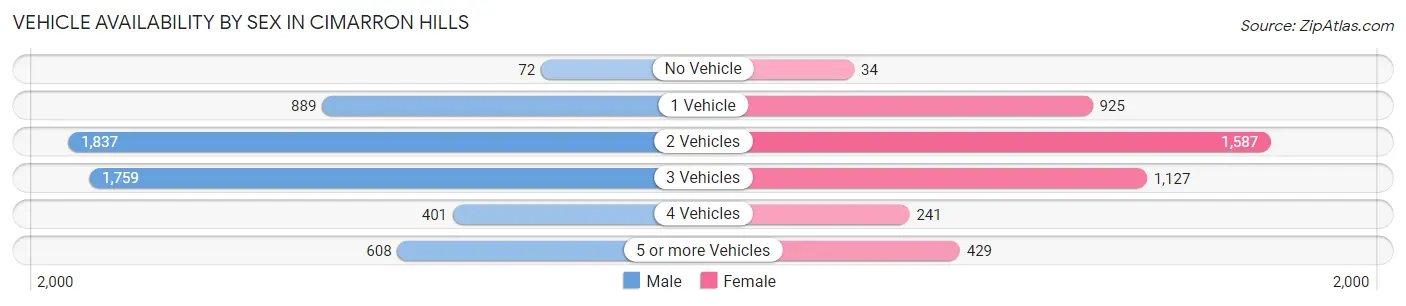
| Vehicles Available | Male | Female |
| No Vehicle | 72 (1.3%) | 34 (0.8%) |
| 1 Vehicle | 889 (16.0%) | 925 (21.3%) |
| 2 Vehicles | 1,837 (33.0%) | 1,587 (36.5%) |
| 3 Vehicles | 1,759 (31.6%) | 1,127 (26.0%) |
| 4 Vehicles | 401 (7.2%) | 241 (5.6%) |
| 5 or more Vehicles | 608 (10.9%) | 429 (9.9%) |
| Total | 5,566 (100.0%) | 4,343 (100.0%) |
Commute Time in Cimarron Hills
The most frequently occuring commute durations in Cimarron Hills are 20 to 24 minutes (1,880 commuters, 20.5%), 30 to 34 minutes (1,535 commuters, 16.8%), and 15 to 19 minutes (1,352 commuters, 14.8%).
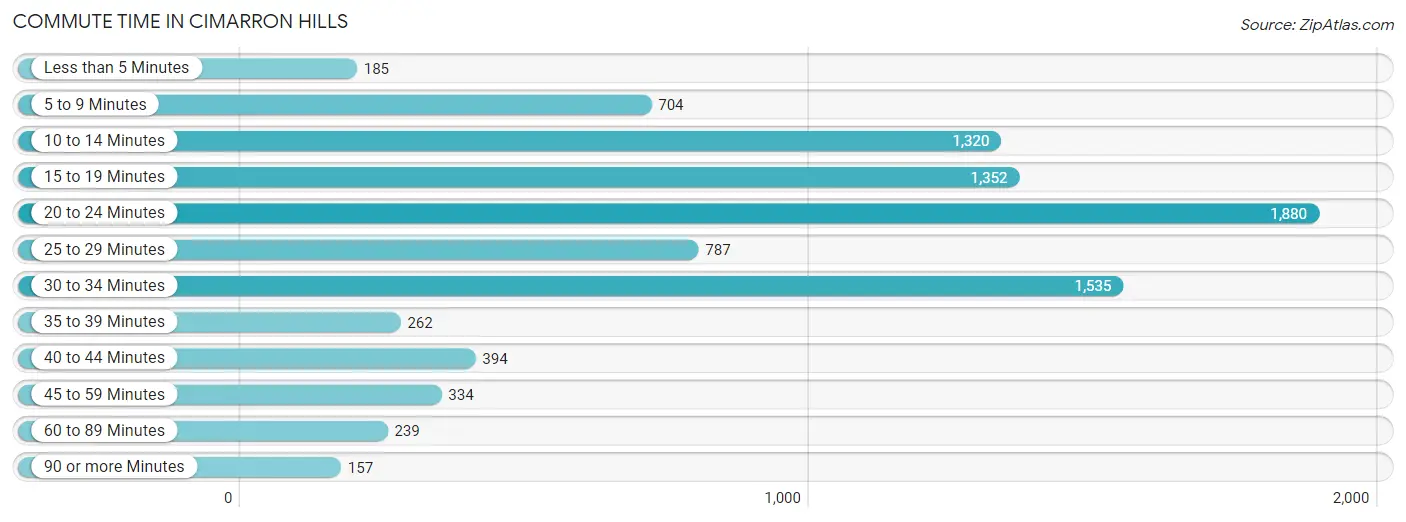
| Commute Time | # Commuters | % Commuters |
| Less than 5 Minutes | 185 | 2.0% |
| 5 to 9 Minutes | 704 | 7.7% |
| 10 to 14 Minutes | 1,320 | 14.4% |
| 15 to 19 Minutes | 1,352 | 14.8% |
| 20 to 24 Minutes | 1,880 | 20.5% |
| 25 to 29 Minutes | 787 | 8.6% |
| 30 to 34 Minutes | 1,535 | 16.8% |
| 35 to 39 Minutes | 262 | 2.9% |
| 40 to 44 Minutes | 394 | 4.3% |
| 45 to 59 Minutes | 334 | 3.6% |
| 60 to 89 Minutes | 239 | 2.6% |
| 90 or more Minutes | 157 | 1.7% |
Commute Time by Sex in Cimarron Hills
The most common commute times in Cimarron Hills are 20 to 24 minutes (998 commuters, 18.9%) for males and 20 to 24 minutes (882 commuters, 22.8%) for females.
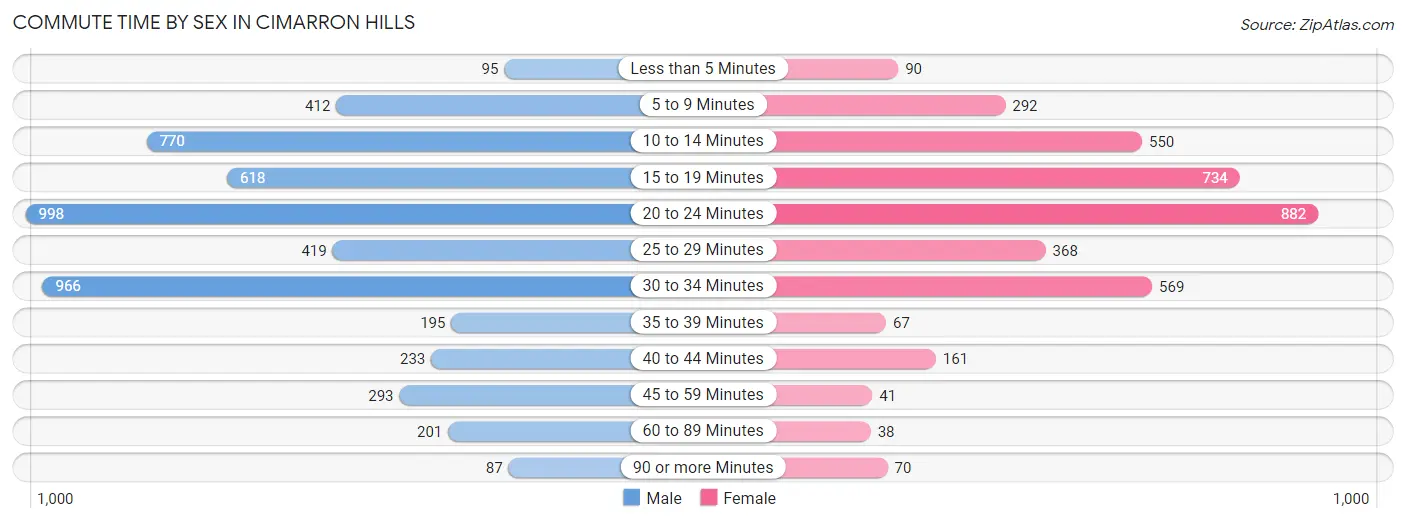
| Commute Time | Male | Female |
| Less than 5 Minutes | 95 (1.8%) | 90 (2.3%) |
| 5 to 9 Minutes | 412 (7.8%) | 292 (7.6%) |
| 10 to 14 Minutes | 770 (14.6%) | 550 (14.2%) |
| 15 to 19 Minutes | 618 (11.7%) | 734 (19.0%) |
| 20 to 24 Minutes | 998 (18.9%) | 882 (22.8%) |
| 25 to 29 Minutes | 419 (7.9%) | 368 (9.5%) |
| 30 to 34 Minutes | 966 (18.3%) | 569 (14.7%) |
| 35 to 39 Minutes | 195 (3.7%) | 67 (1.7%) |
| 40 to 44 Minutes | 233 (4.4%) | 161 (4.2%) |
| 45 to 59 Minutes | 293 (5.5%) | 41 (1.1%) |
| 60 to 89 Minutes | 201 (3.8%) | 38 (1.0%) |
| 90 or more Minutes | 87 (1.7%) | 70 (1.8%) |
Time of Departure to Work by Sex in Cimarron Hills
The most frequent times of departure to work in Cimarron Hills are 7:00 AM to 7:29 AM (791, 15.0%) for males and 7:00 AM to 7:29 AM (762, 19.7%) for females.
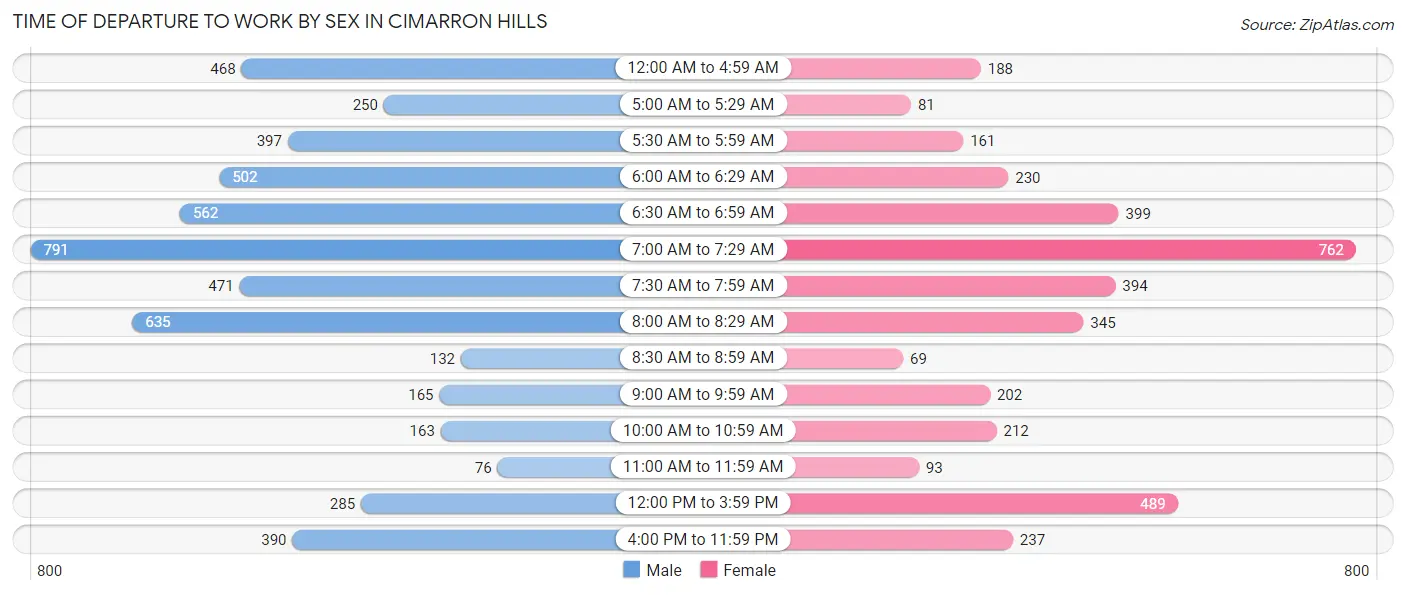
| Time of Departure | Male | Female |
| 12:00 AM to 4:59 AM | 468 (8.8%) | 188 (4.9%) |
| 5:00 AM to 5:29 AM | 250 (4.7%) | 81 (2.1%) |
| 5:30 AM to 5:59 AM | 397 (7.5%) | 161 (4.2%) |
| 6:00 AM to 6:29 AM | 502 (9.5%) | 230 (6.0%) |
| 6:30 AM to 6:59 AM | 562 (10.6%) | 399 (10.3%) |
| 7:00 AM to 7:29 AM | 791 (15.0%) | 762 (19.7%) |
| 7:30 AM to 7:59 AM | 471 (8.9%) | 394 (10.2%) |
| 8:00 AM to 8:29 AM | 635 (12.0%) | 345 (8.9%) |
| 8:30 AM to 8:59 AM | 132 (2.5%) | 69 (1.8%) |
| 9:00 AM to 9:59 AM | 165 (3.1%) | 202 (5.2%) |
| 10:00 AM to 10:59 AM | 163 (3.1%) | 212 (5.5%) |
| 11:00 AM to 11:59 AM | 76 (1.4%) | 93 (2.4%) |
| 12:00 PM to 3:59 PM | 285 (5.4%) | 489 (12.7%) |
| 4:00 PM to 11:59 PM | 390 (7.4%) | 237 (6.1%) |
| Total | 5,287 (100.0%) | 3,862 (100.0%) |
Housing Occupancy in Cimarron Hills
Occupancy by Ownership in Cimarron Hills
Of the total 7,070 dwellings in Cimarron Hills, owner-occupied units account for 5,460 (77.2%), while renter-occupied units make up 1,610 (22.8%).
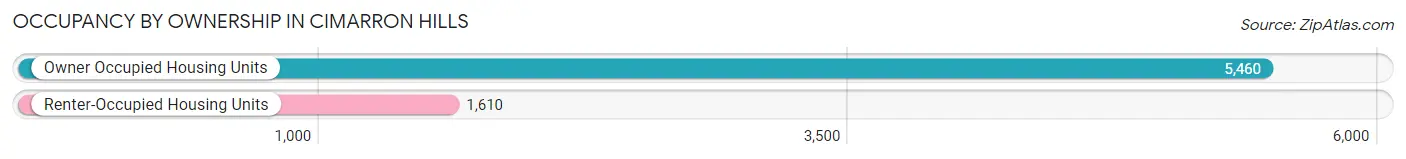
| Occupancy | # Housing Units | % Housing Units |
| Owner Occupied Housing Units | 5,460 | 77.2% |
| Renter-Occupied Housing Units | 1,610 | 22.8% |
| Total Occupied Housing Units | 7,070 | 100.0% |
Occupancy by Household Size in Cimarron Hills
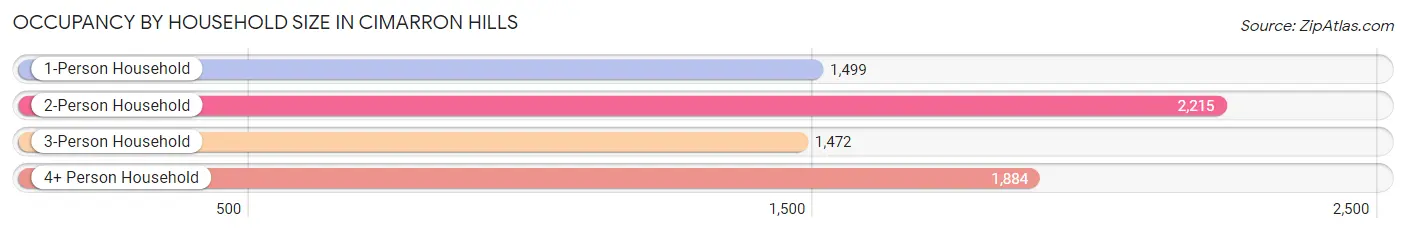
| Household Size | # Housing Units | % Housing Units |
| 1-Person Household | 1,499 | 21.2% |
| 2-Person Household | 2,215 | 31.3% |
| 3-Person Household | 1,472 | 20.8% |
| 4+ Person Household | 1,884 | 26.7% |
| Total Housing Units | 7,070 | 100.0% |
Occupancy by Ownership by Household Size in Cimarron Hills
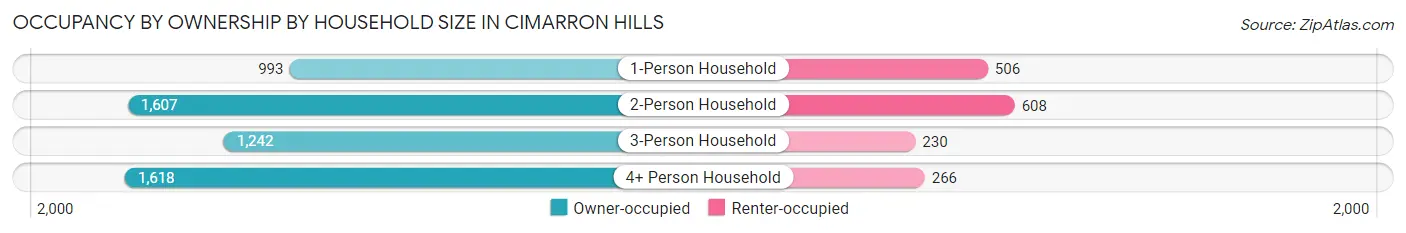
| Household Size | Owner-occupied | Renter-occupied |
| 1-Person Household | 993 (66.2%) | 506 (33.8%) |
| 2-Person Household | 1,607 (72.6%) | 608 (27.5%) |
| 3-Person Household | 1,242 (84.4%) | 230 (15.6%) |
| 4+ Person Household | 1,618 (85.9%) | 266 (14.1%) |
| Total Housing Units | 5,460 (77.2%) | 1,610 (22.8%) |
Occupancy by Educational Attainment in Cimarron Hills
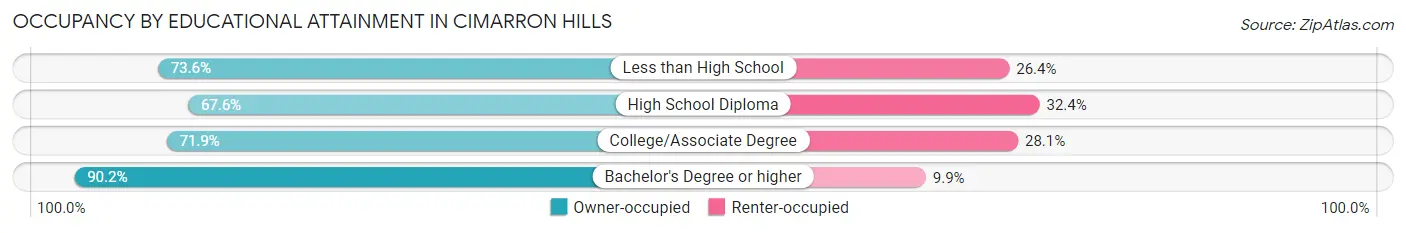
| Household Size | Owner-occupied | Renter-occupied |
| Less than High School | 92 (73.6%) | 33 (26.4%) |
| High School Diploma | 1,146 (67.6%) | 549 (32.4%) |
| College/Associate Degree | 2,008 (71.9%) | 786 (28.1%) |
| Bachelor's Degree or higher | 2,214 (90.1%) | 242 (9.9%) |
Occupancy by Age of Householder in Cimarron Hills
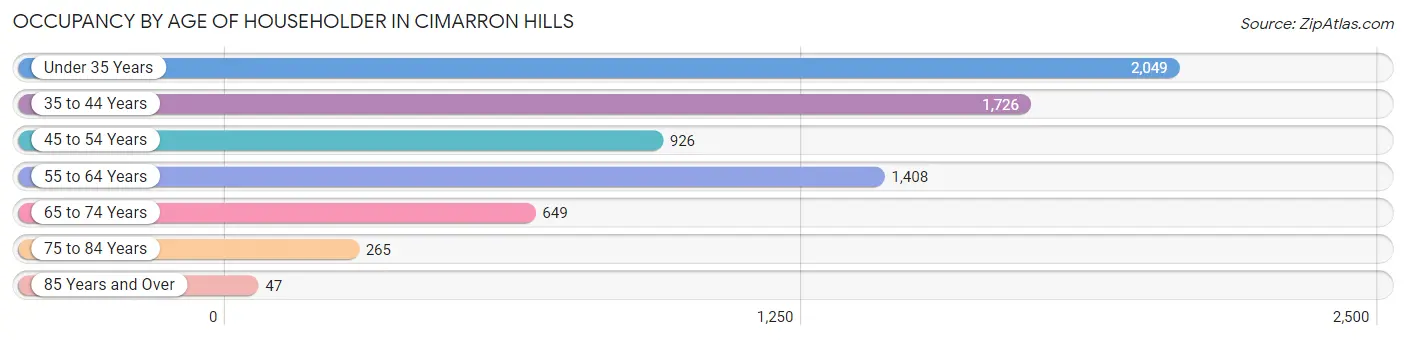
| Age Bracket | # Households | % Households |
| Under 35 Years | 2,049 | 29.0% |
| 35 to 44 Years | 1,726 | 24.4% |
| 45 to 54 Years | 926 | 13.1% |
| 55 to 64 Years | 1,408 | 19.9% |
| 65 to 74 Years | 649 | 9.2% |
| 75 to 84 Years | 265 | 3.7% |
| 85 Years and Over | 47 | 0.7% |
| Total | 7,070 | 100.0% |
Housing Finances in Cimarron Hills
Median Income by Occupancy in Cimarron Hills
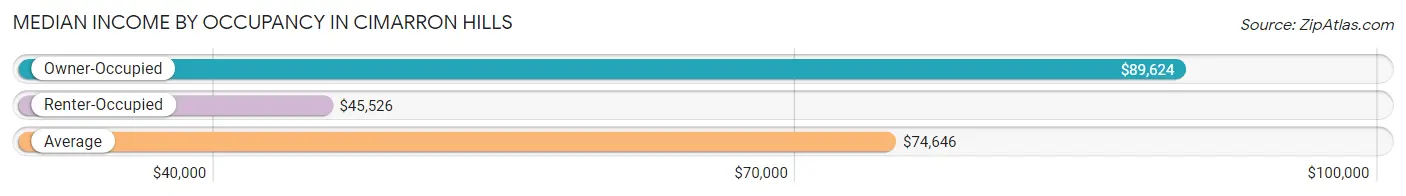
| Occupancy Type | # Households | Median Income |
| Owner-Occupied | 5,460 (77.2%) | $89,624 |
| Renter-Occupied | 1,610 (22.8%) | $45,526 |
| Average | 7,070 (100.0%) | $74,646 |
Occupancy by Householder Income Bracket in Cimarron Hills
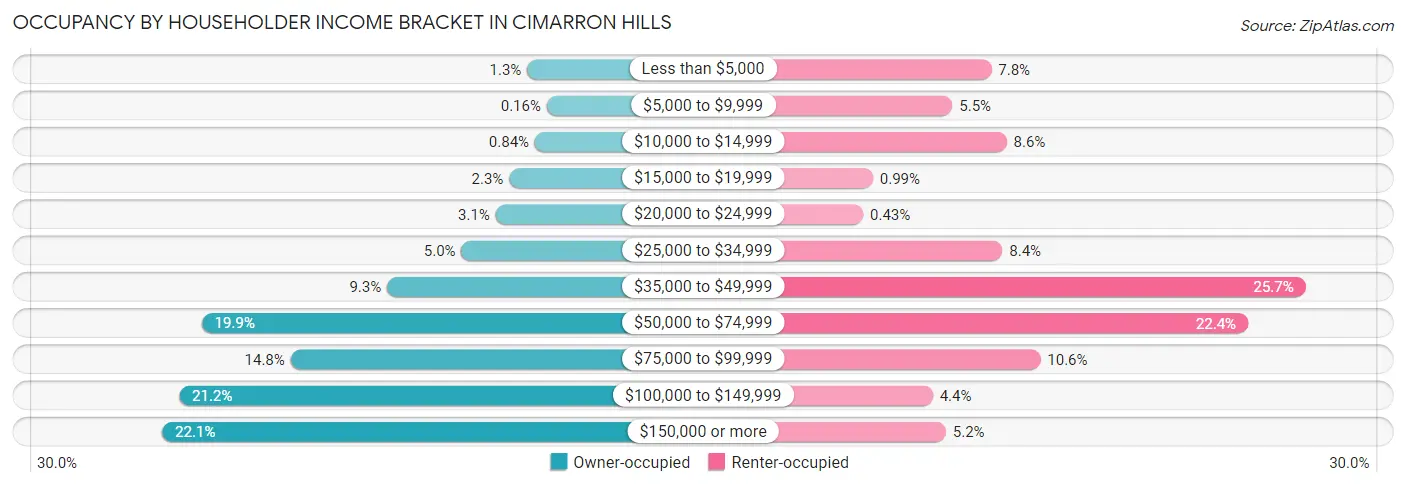
| Income Bracket | Owner-occupied | Renter-occupied |
| Less than $5,000 | 70 (1.3%) | 125 (7.8%) |
| $5,000 to $9,999 | 9 (0.2%) | 89 (5.5%) |
| $10,000 to $14,999 | 46 (0.8%) | 139 (8.6%) |
| $15,000 to $19,999 | 126 (2.3%) | 16 (1.0%) |
| $20,000 to $24,999 | 168 (3.1%) | 7 (0.4%) |
| $25,000 to $34,999 | 275 (5.0%) | 135 (8.4%) |
| $35,000 to $49,999 | 507 (9.3%) | 414 (25.7%) |
| $50,000 to $74,999 | 1,086 (19.9%) | 361 (22.4%) |
| $75,000 to $99,999 | 808 (14.8%) | 170 (10.6%) |
| $100,000 to $149,999 | 1,156 (21.2%) | 71 (4.4%) |
| $150,000 or more | 1,209 (22.1%) | 83 (5.2%) |
| Total | 5,460 (100.0%) | 1,610 (100.0%) |
Monthly Housing Cost Tiers in Cimarron Hills
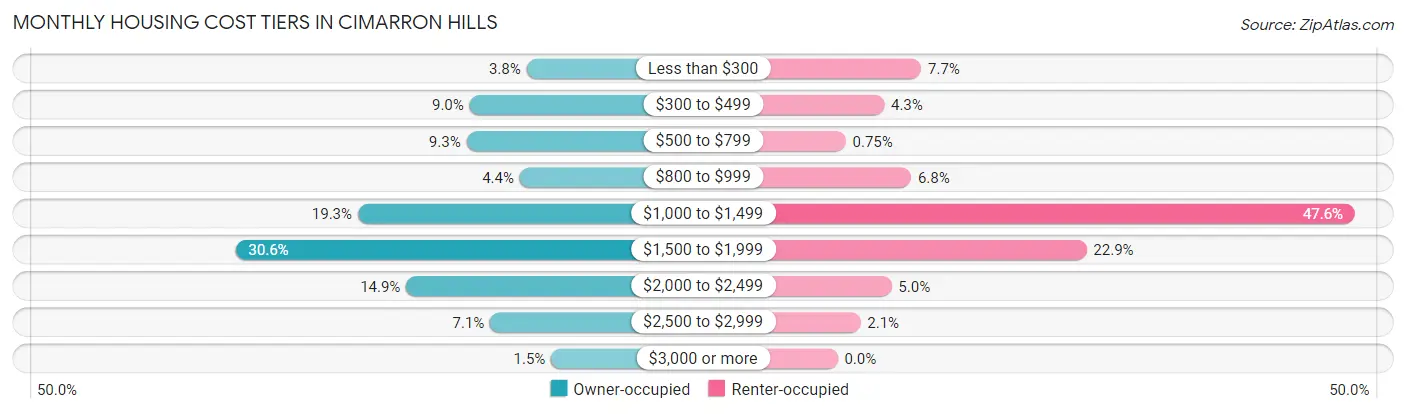
| Monthly Cost | Owner-occupied | Renter-occupied |
| Less than $300 | 207 (3.8%) | 124 (7.7%) |
| $300 to $499 | 493 (9.0%) | 69 (4.3%) |
| $500 to $799 | 509 (9.3%) | 12 (0.7%) |
| $800 to $999 | 241 (4.4%) | 109 (6.8%) |
| $1,000 to $1,499 | 1,055 (19.3%) | 767 (47.6%) |
| $1,500 to $1,999 | 1,670 (30.6%) | 369 (22.9%) |
| $2,000 to $2,499 | 812 (14.9%) | 80 (5.0%) |
| $2,500 to $2,999 | 390 (7.1%) | 34 (2.1%) |
| $3,000 or more | 83 (1.5%) | 0 (0.0%) |
| Total | 5,460 (100.0%) | 1,610 (100.0%) |
Physical Housing Characteristics in Cimarron Hills
Housing Structures in Cimarron Hills
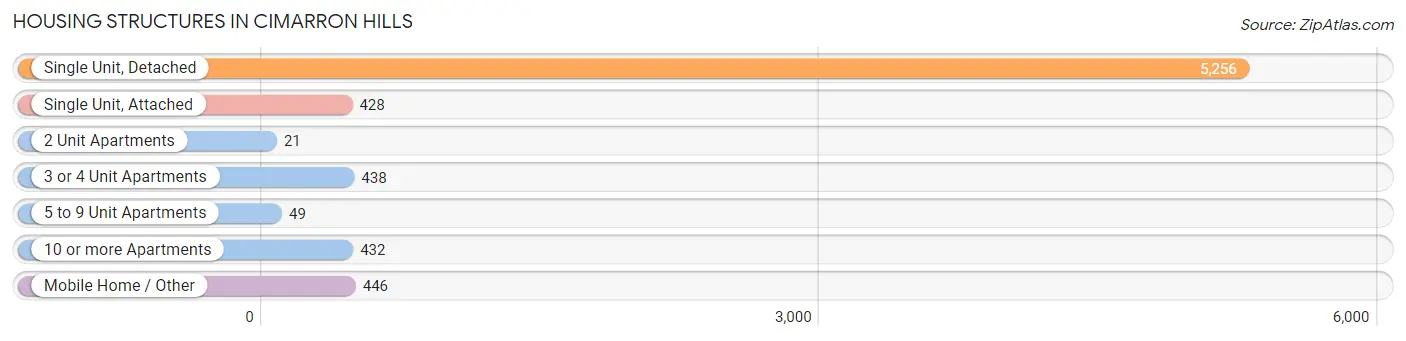
| Structure Type | # Housing Units | % Housing Units |
| Single Unit, Detached | 5,256 | 74.3% |
| Single Unit, Attached | 428 | 6.0% |
| 2 Unit Apartments | 21 | 0.3% |
| 3 or 4 Unit Apartments | 438 | 6.2% |
| 5 to 9 Unit Apartments | 49 | 0.7% |
| 10 or more Apartments | 432 | 6.1% |
| Mobile Home / Other | 446 | 6.3% |
| Total | 7,070 | 100.0% |
Housing Structures by Occupancy in Cimarron Hills
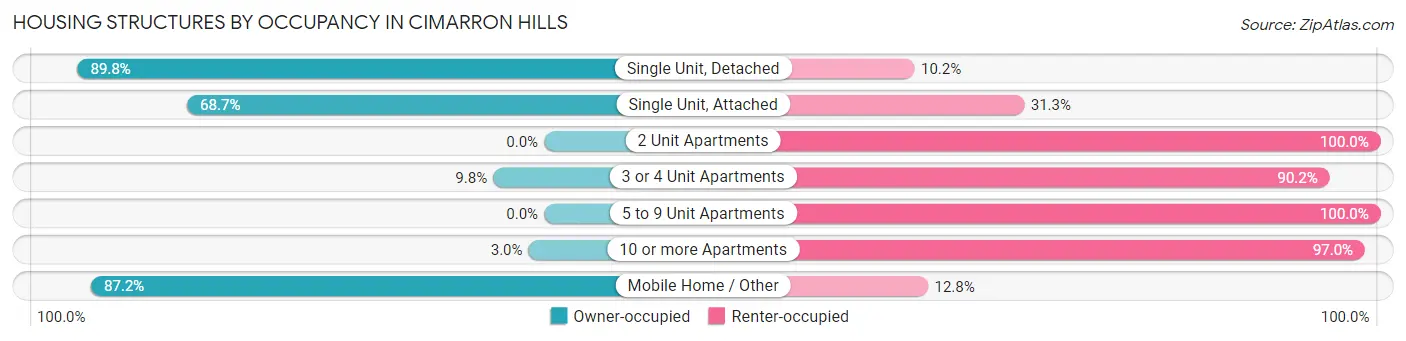
| Structure Type | Owner-occupied | Renter-occupied |
| Single Unit, Detached | 4,721 (89.8%) | 535 (10.2%) |
| Single Unit, Attached | 294 (68.7%) | 134 (31.3%) |
| 2 Unit Apartments | 0 (0.0%) | 21 (100.0%) |
| 3 or 4 Unit Apartments | 43 (9.8%) | 395 (90.2%) |
| 5 to 9 Unit Apartments | 0 (0.0%) | 49 (100.0%) |
| 10 or more Apartments | 13 (3.0%) | 419 (97.0%) |
| Mobile Home / Other | 389 (87.2%) | 57 (12.8%) |
| Total | 5,460 (77.2%) | 1,610 (22.8%) |
Housing Structures by Number of Rooms in Cimarron Hills
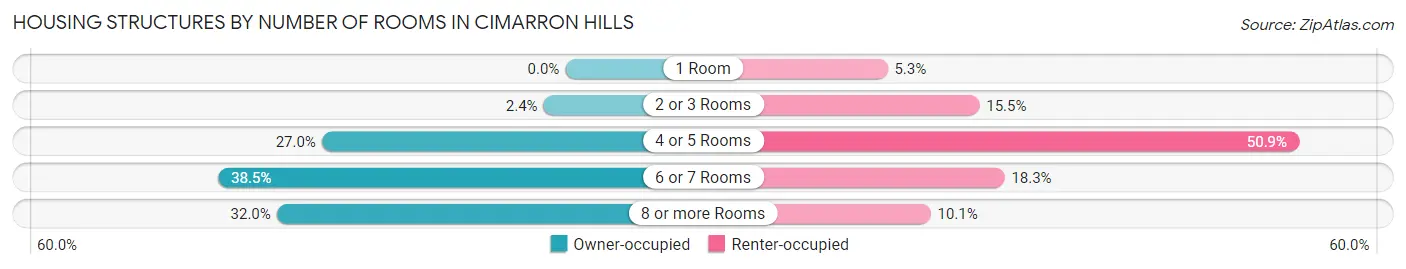
| Number of Rooms | Owner-occupied | Renter-occupied |
| 1 Room | 0 (0.0%) | 85 (5.3%) |
| 2 or 3 Rooms | 132 (2.4%) | 249 (15.5%) |
| 4 or 5 Rooms | 1,476 (27.0%) | 820 (50.9%) |
| 6 or 7 Rooms | 2,103 (38.5%) | 294 (18.3%) |
| 8 or more Rooms | 1,749 (32.0%) | 162 (10.1%) |
| Total | 5,460 (100.0%) | 1,610 (100.0%) |
Housing Structure by Heating Type in Cimarron Hills
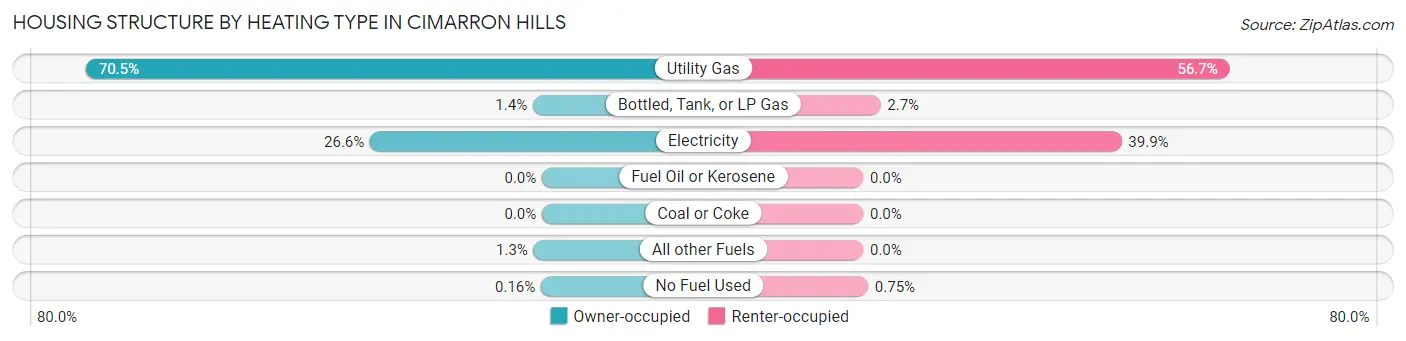
| Heating Type | Owner-occupied | Renter-occupied |
| Utility Gas | 3,851 (70.5%) | 912 (56.7%) |
| Bottled, Tank, or LP Gas | 77 (1.4%) | 43 (2.7%) |
| Electricity | 1,452 (26.6%) | 643 (39.9%) |
| Fuel Oil or Kerosene | 0 (0.0%) | 0 (0.0%) |
| Coal or Coke | 0 (0.0%) | 0 (0.0%) |
| All other Fuels | 71 (1.3%) | 0 (0.0%) |
| No Fuel Used | 9 (0.2%) | 12 (0.7%) |
| Total | 5,460 (100.0%) | 1,610 (100.0%) |
Household Vehicle Usage in Cimarron Hills
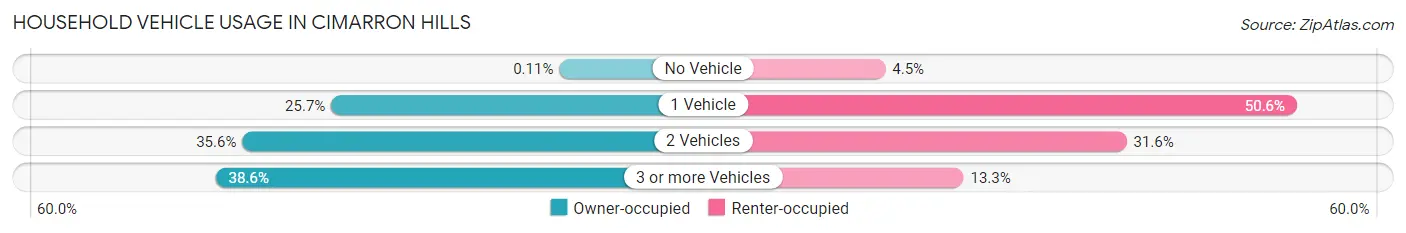
| Vehicles per Household | Owner-occupied | Renter-occupied |
| No Vehicle | 6 (0.1%) | 73 (4.5%) |
| 1 Vehicle | 1,401 (25.7%) | 815 (50.6%) |
| 2 Vehicles | 1,945 (35.6%) | 508 (31.6%) |
| 3 or more Vehicles | 2,108 (38.6%) | 214 (13.3%) |
| Total | 5,460 (100.0%) | 1,610 (100.0%) |
Real Estate & Mortgages in Cimarron Hills
Real Estate and Mortgage Overview in Cimarron Hills
| Characteristic | Without Mortgage | With Mortgage |
| Housing Units | 1,331 | 4,129 |
| Median Property Value | $256,500 | $329,700 |
| Median Household Income | $66,328 | $1,025 |
| Monthly Housing Costs | $499 | $83 |
| Real Estate Taxes | $1,029 | $142 |
Property Value by Mortgage Status in Cimarron Hills
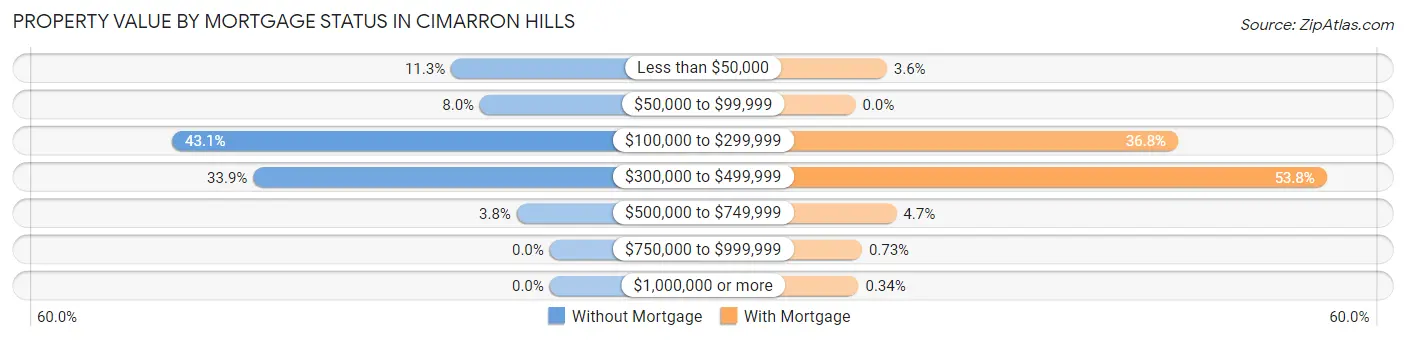
| Property Value | Without Mortgage | With Mortgage |
| Less than $50,000 | 150 (11.3%) | 148 (3.6%) |
| $50,000 to $99,999 | 106 (8.0%) | 0 (0.0%) |
| $100,000 to $299,999 | 574 (43.1%) | 1,521 (36.8%) |
| $300,000 to $499,999 | 451 (33.9%) | 2,223 (53.8%) |
| $500,000 to $749,999 | 50 (3.8%) | 193 (4.7%) |
| $750,000 to $999,999 | 0 (0.0%) | 30 (0.7%) |
| $1,000,000 or more | 0 (0.0%) | 14 (0.3%) |
| Total | 1,331 (100.0%) | 4,129 (100.0%) |
Household Income by Mortgage Status in Cimarron Hills
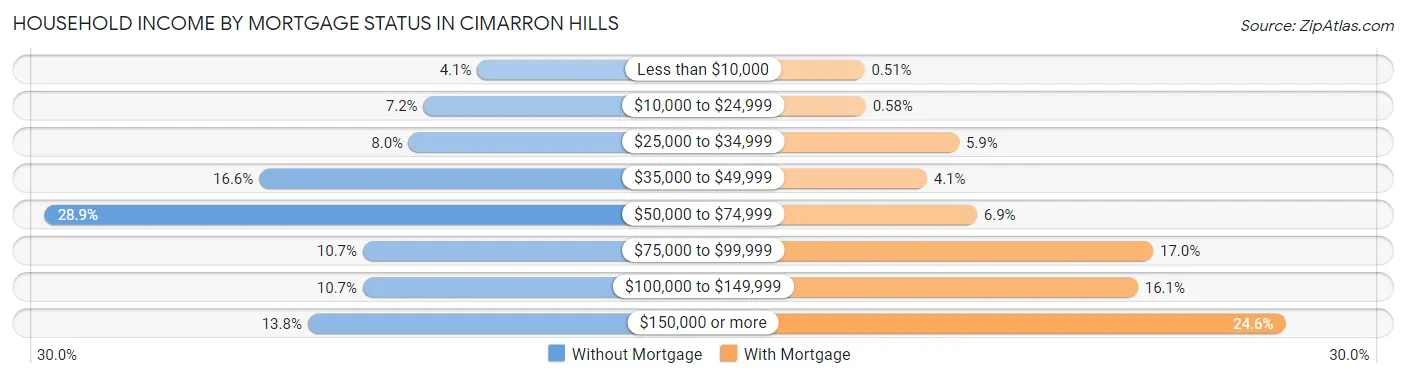
| Household Income | Without Mortgage | With Mortgage |
| Less than $10,000 | 55 (4.1%) | 21 (0.5%) |
| $10,000 to $24,999 | 96 (7.2%) | 24 (0.6%) |
| $25,000 to $34,999 | 107 (8.0%) | 244 (5.9%) |
| $35,000 to $49,999 | 221 (16.6%) | 168 (4.1%) |
| $50,000 to $74,999 | 384 (28.8%) | 286 (6.9%) |
| $75,000 to $99,999 | 142 (10.7%) | 702 (17.0%) |
| $100,000 to $149,999 | 142 (10.7%) | 666 (16.1%) |
| $150,000 or more | 184 (13.8%) | 1,014 (24.6%) |
| Total | 1,331 (100.0%) | 4,129 (100.0%) |
Property Value to Household Income Ratio in Cimarron Hills
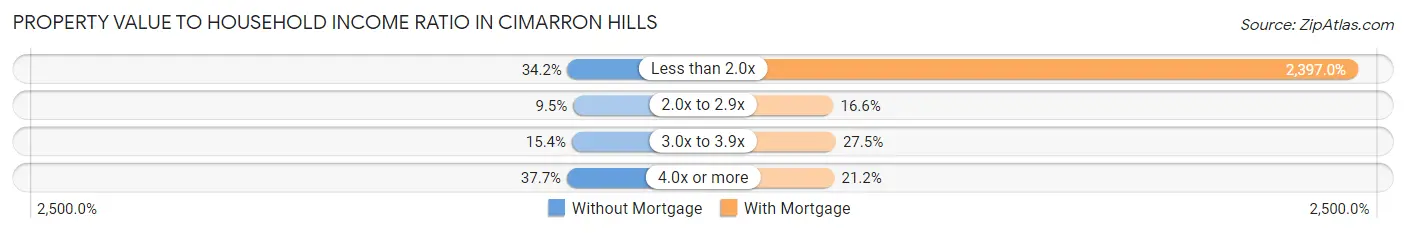
| Value-to-Income Ratio | Without Mortgage | With Mortgage |
| Less than 2.0x | 455 (34.2%) | 98,972 (2,397.0%) |
| 2.0x to 2.9x | 127 (9.5%) | 685 (16.6%) |
| 3.0x to 3.9x | 205 (15.4%) | 1,134 (27.5%) |
| 4.0x or more | 502 (37.7%) | 875 (21.2%) |
| Total | 1,331 (100.0%) | 4,129 (100.0%) |
Real Estate Taxes by Mortgage Status in Cimarron Hills
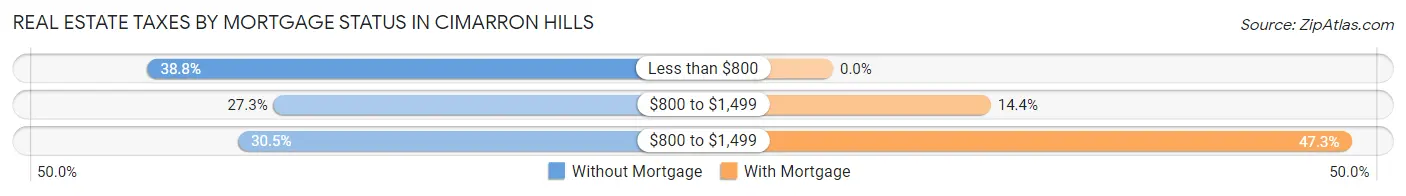
| Property Taxes | Without Mortgage | With Mortgage |
| Less than $800 | 516 (38.8%) | 0 (0.0%) |
| $800 to $1,499 | 363 (27.3%) | 595 (14.4%) |
| $800 to $1,499 | 406 (30.5%) | 1,954 (47.3%) |
| Total | 1,331 (100.0%) | 4,129 (100.0%) |
Health & Disability in Cimarron Hills
Health Insurance Coverage by Age in Cimarron Hills
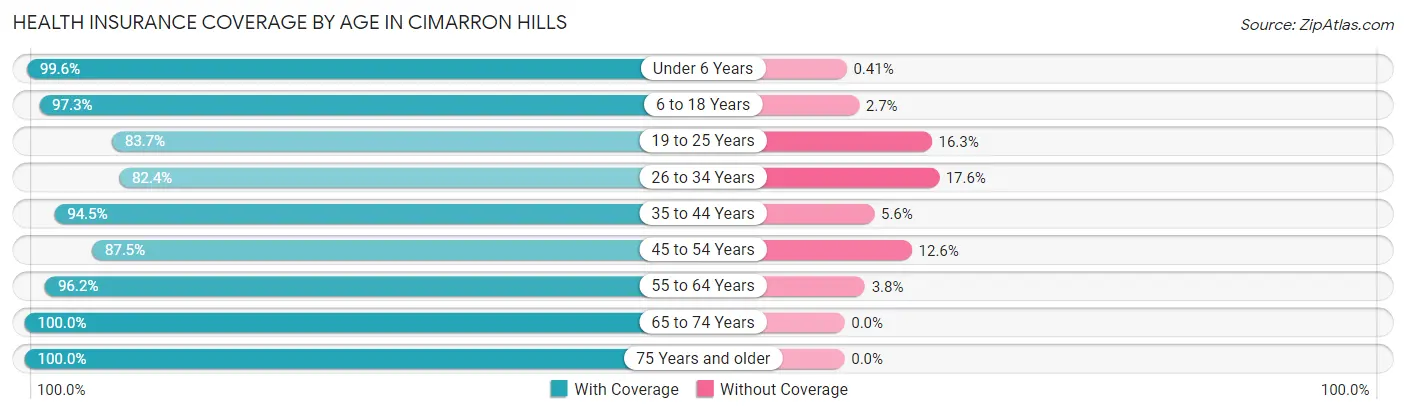
| Age Bracket | With Coverage | Without Coverage |
| Under 6 Years | 1,208 (99.6%) | 5 (0.4%) |
| 6 to 18 Years | 3,654 (97.3%) | 102 (2.7%) |
| 19 to 25 Years | 1,734 (83.7%) | 337 (16.3%) |
| 26 to 34 Years | 2,538 (82.4%) | 542 (17.6%) |
| 35 to 44 Years | 2,638 (94.5%) | 155 (5.6%) |
| 45 to 54 Years | 1,554 (87.5%) | 223 (12.6%) |
| 55 to 64 Years | 2,194 (96.2%) | 87 (3.8%) |
| 65 to 74 Years | 1,043 (100.0%) | 0 (0.0%) |
| 75 Years and older | 422 (100.0%) | 0 (0.0%) |
| Total | 16,985 (92.1%) | 1,451 (7.9%) |
Health Insurance Coverage by Citizenship Status in Cimarron Hills
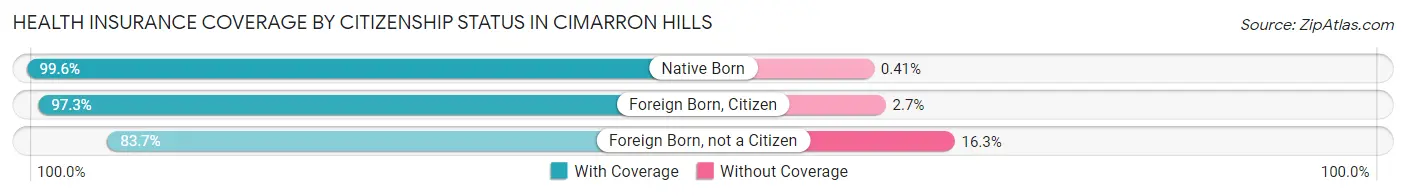
| Citizenship Status | With Coverage | Without Coverage |
| Native Born | 1,208 (99.6%) | 5 (0.4%) |
| Foreign Born, Citizen | 3,654 (97.3%) | 102 (2.7%) |
| Foreign Born, not a Citizen | 1,734 (83.7%) | 337 (16.3%) |
Health Insurance Coverage by Household Income in Cimarron Hills
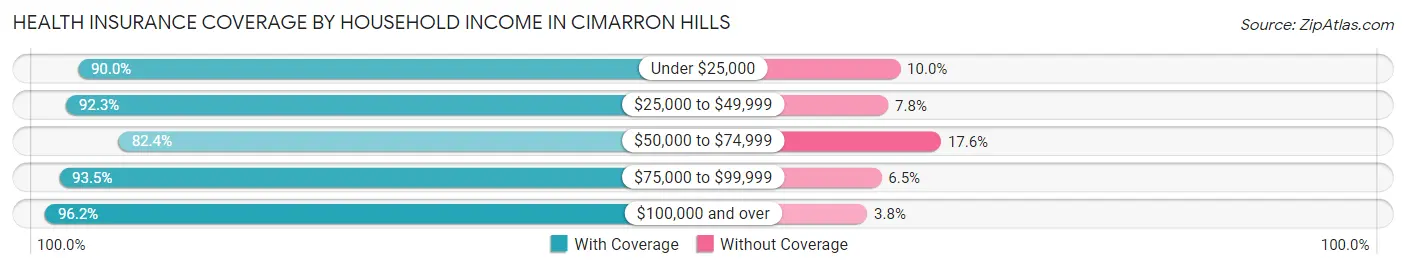
| Household Income | With Coverage | Without Coverage |
| Under $25,000 | 1,134 (90.0%) | 126 (10.0%) |
| $25,000 to $49,999 | 3,058 (92.2%) | 257 (7.7%) |
| $50,000 to $74,999 | 2,773 (82.4%) | 594 (17.6%) |
| $75,000 to $99,999 | 2,603 (93.5%) | 180 (6.5%) |
| $100,000 and over | 7,395 (96.2%) | 294 (3.8%) |
Public vs Private Health Insurance Coverage by Age in Cimarron Hills
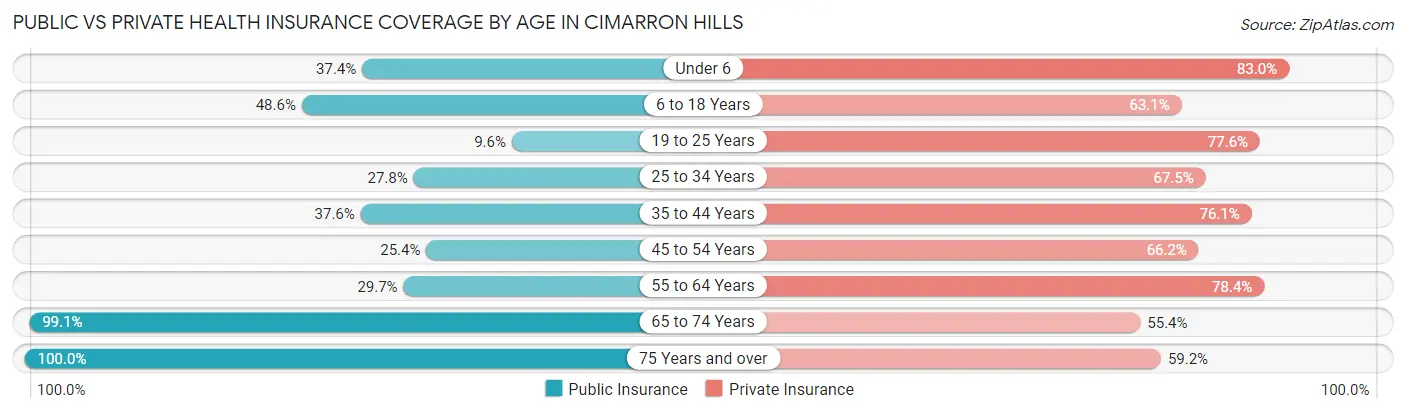
| Age Bracket | Public Insurance | Private Insurance |
| Under 6 | 453 (37.3%) | 1,007 (83.0%) |
| 6 to 18 Years | 1,824 (48.6%) | 2,368 (63.0%) |
| 19 to 25 Years | 198 (9.6%) | 1,607 (77.6%) |
| 25 to 34 Years | 856 (27.8%) | 2,080 (67.5%) |
| 35 to 44 Years | 1,051 (37.6%) | 2,125 (76.1%) |
| 45 to 54 Years | 452 (25.4%) | 1,177 (66.2%) |
| 55 to 64 Years | 677 (29.7%) | 1,788 (78.4%) |
| 65 to 74 Years | 1,034 (99.1%) | 578 (55.4%) |
| 75 Years and over | 422 (100.0%) | 250 (59.2%) |
| Total | 6,967 (37.8%) | 12,980 (70.4%) |
Disability Status by Sex by Age in Cimarron Hills
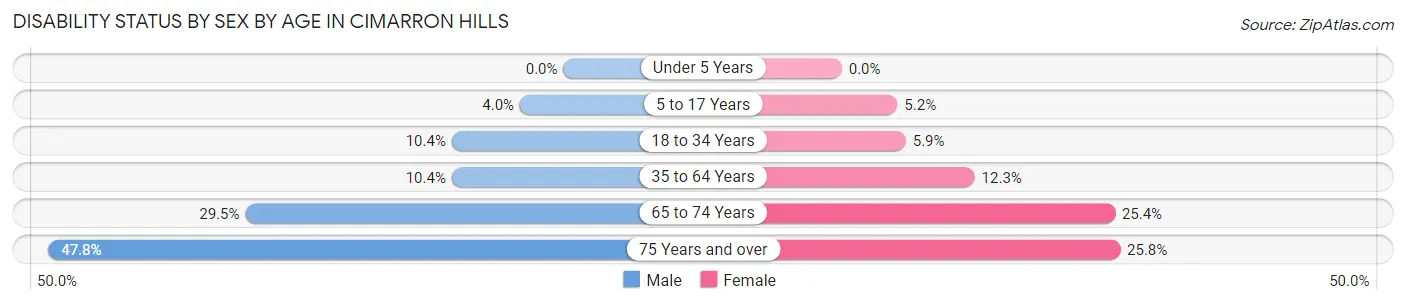
| Age Bracket | Male | Female |
| Under 5 Years | 0 (0.0%) | 0 (0.0%) |
| 5 to 17 Years | 83 (4.0%) | 90 (5.2%) |
| 18 to 34 Years | 273 (10.4%) | 160 (5.9%) |
| 35 to 64 Years | 367 (10.4%) | 408 (12.3%) |
| 65 to 74 Years | 160 (29.5%) | 127 (25.4%) |
| 75 Years and over | 87 (47.8%) | 62 (25.8%) |
Disability Class by Sex by Age in Cimarron Hills
Disability Class: Hearing Difficulty
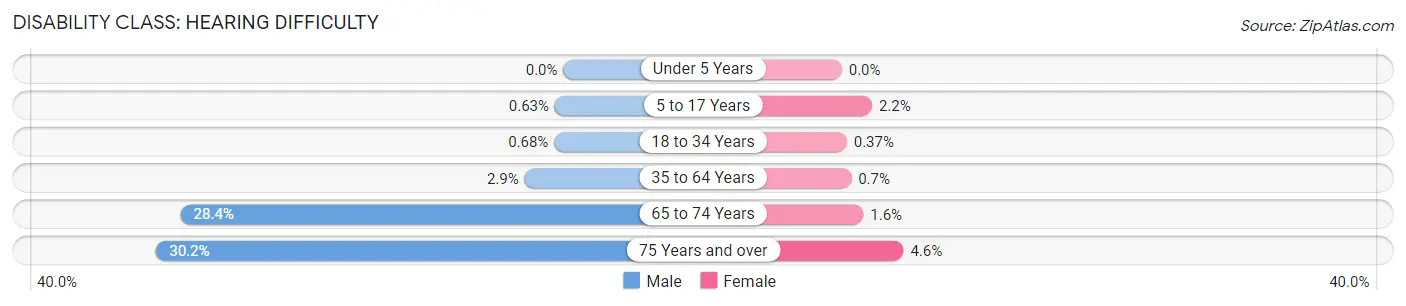
| Age Bracket | Male | Female |
| Under 5 Years | 0 (0.0%) | 0 (0.0%) |
| 5 to 17 Years | 13 (0.6%) | 39 (2.2%) |
| 18 to 34 Years | 18 (0.7%) | 10 (0.4%) |
| 35 to 64 Years | 102 (2.9%) | 23 (0.7%) |
| 65 to 74 Years | 154 (28.4%) | 8 (1.6%) |
| 75 Years and over | 55 (30.2%) | 11 (4.6%) |
Disability Class: Vision Difficulty
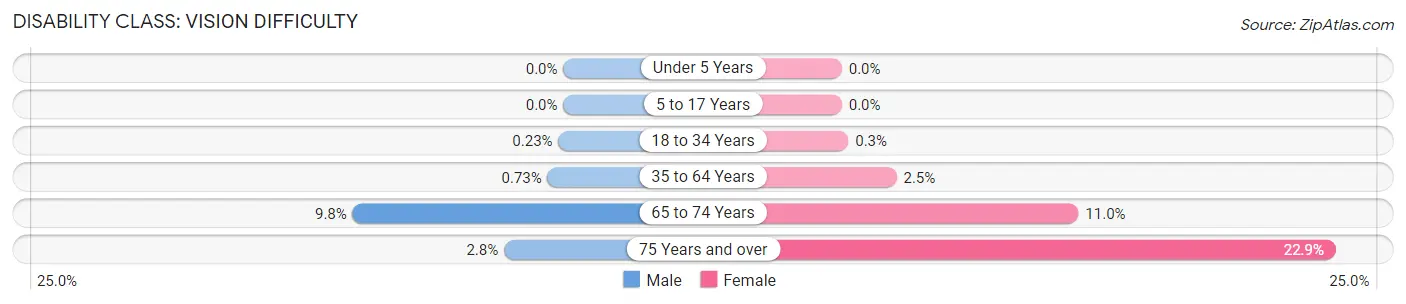
| Age Bracket | Male | Female |
| Under 5 Years | 0 (0.0%) | 0 (0.0%) |
| 5 to 17 Years | 0 (0.0%) | 0 (0.0%) |
| 18 to 34 Years | 6 (0.2%) | 8 (0.3%) |
| 35 to 64 Years | 26 (0.7%) | 84 (2.5%) |
| 65 to 74 Years | 53 (9.8%) | 55 (11.0%) |
| 75 Years and over | 5 (2.8%) | 55 (22.9%) |
Disability Class: Cognitive Difficulty
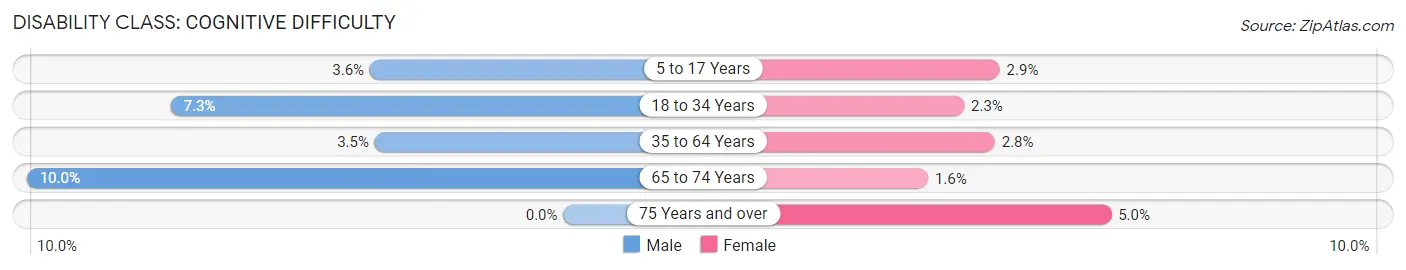
| Age Bracket | Male | Female |
| 5 to 17 Years | 74 (3.6%) | 51 (2.9%) |
| 18 to 34 Years | 192 (7.3%) | 61 (2.3%) |
| 35 to 64 Years | 124 (3.5%) | 94 (2.8%) |
| 65 to 74 Years | 54 (10.0%) | 8 (1.6%) |
| 75 Years and over | 0 (0.0%) | 12 (5.0%) |
Disability Class: Ambulatory Difficulty
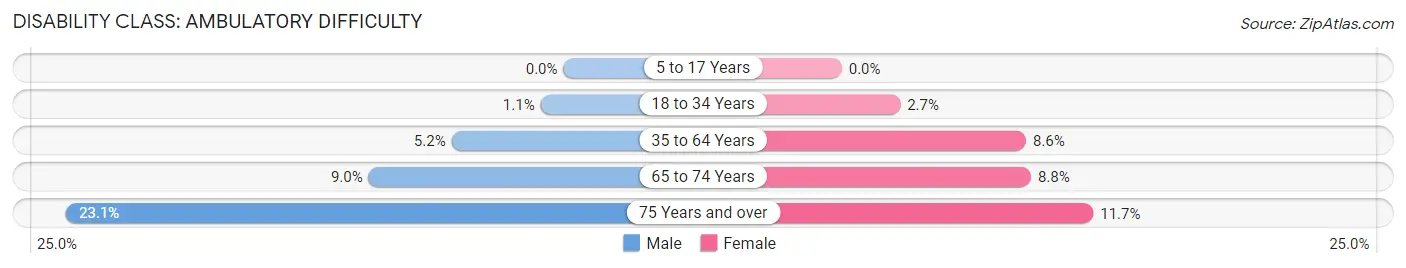
| Age Bracket | Male | Female |
| 5 to 17 Years | 0 (0.0%) | 0 (0.0%) |
| 18 to 34 Years | 28 (1.1%) | 73 (2.7%) |
| 35 to 64 Years | 184 (5.2%) | 283 (8.6%) |
| 65 to 74 Years | 49 (9.0%) | 44 (8.8%) |
| 75 Years and over | 42 (23.1%) | 28 (11.7%) |
Disability Class: Self-Care Difficulty
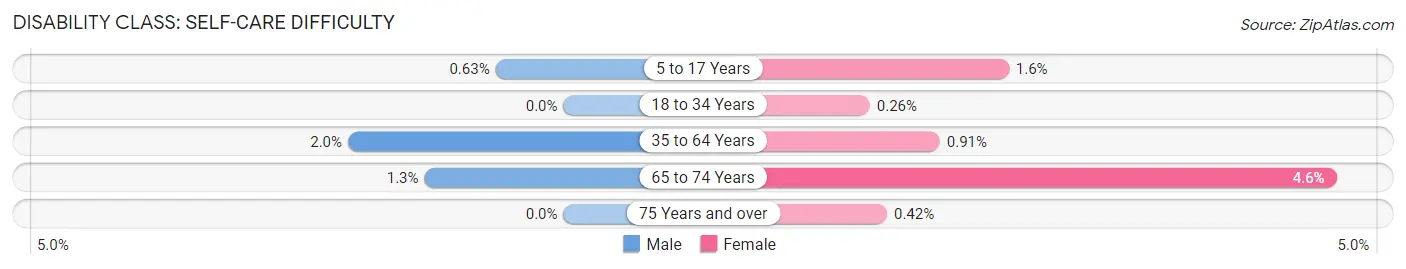
| Age Bracket | Male | Female |
| 5 to 17 Years | 13 (0.6%) | 27 (1.5%) |
| 18 to 34 Years | 0 (0.0%) | 7 (0.3%) |
| 35 to 64 Years | 71 (2.0%) | 30 (0.9%) |
| 65 to 74 Years | 7 (1.3%) | 23 (4.6%) |
| 75 Years and over | 0 (0.0%) | 1 (0.4%) |
Technology Access in Cimarron Hills
Computing Device Access in Cimarron Hills
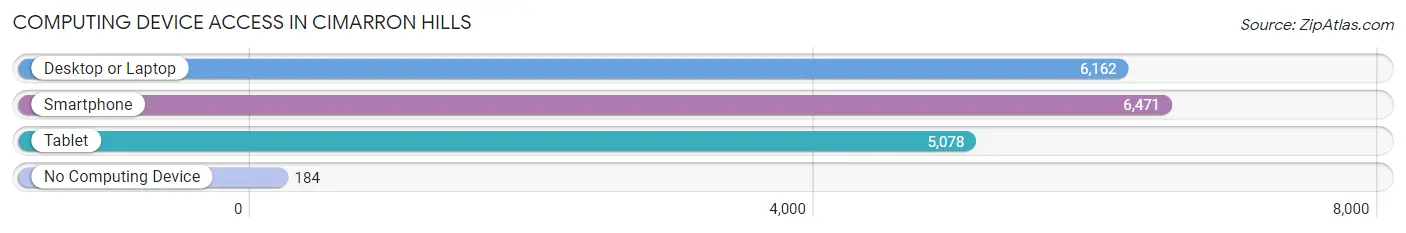
| Device Type | # Households | % Households |
| Desktop or Laptop | 6,162 | 87.2% |
| Smartphone | 6,471 | 91.5% |
| Tablet | 5,078 | 71.8% |
| No Computing Device | 184 | 2.6% |
| Total | 7,070 | 100.0% |
Internet Access in Cimarron Hills
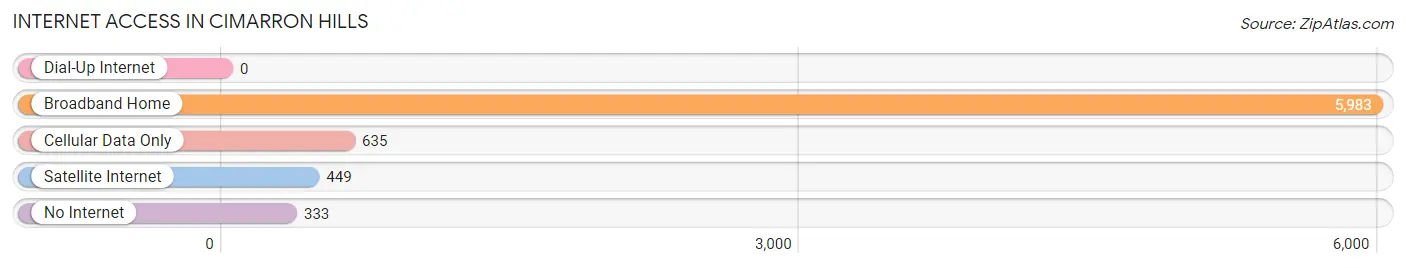
| Internet Type | # Households | % Households |
| Dial-Up Internet | 0 | 0.0% |
| Broadband Home | 5,983 | 84.6% |
| Cellular Data Only | 635 | 9.0% |
| Satellite Internet | 449 | 6.4% |
| No Internet | 333 | 4.7% |
| Total | 7,070 | 100.0% |
Cimarron Hills Summary
Cimarron Hills is a census-designated place (CDP) located in El Paso County, Colorado, United States. The population was 8,845 at the 2010 census. It is part of the Colorado Springs, CO Metropolitan Statistical Area.
Geography
Cimarron Hills is located at 38 51 25 North 104 45 45 West 38 856944 104 762500
According to the United States Census Bureau, the CDP has a total area of 4.2 square miles (10.8 km2), all of it land.
History
Cimarron Hills was originally part of the Ute Indian Reservation, which was established in 1868. The area was later opened up to homesteaders in the late 1800s. The first settlers in the area were ranchers and farmers, who established small communities.
In the early 1900s, the area was developed as a resort community. The first resort was built in 1910 and was called the Cimarron Hills Resort. The resort was a popular destination for tourists and locals alike.
In the 1950s, the area began to be developed as a residential community. The first homes were built in the late 1950s and early 1960s. The area continued to grow and by the 1970s, Cimarron Hills had become a thriving residential community.
Economy
Cimarron Hills is a primarily residential community, with most of its residents employed in the nearby cities of Colorado Springs and Pueblo. The area is home to several small businesses, including restaurants, retail stores, and professional services.
Demographics
As of the census of 2000, there were 8,845 people, 3,541 households, and 2,541 families residing in the CDP. The population density was 2,093.3 people per square mile (807.3/km2). There were 3,717 housing units at an average density of 876.3 per square mile (338.3/km2). The racial makeup of the CDP was 91.2% White, 1.2% African American, 0.7% Native American, 1.7% Asian, 0.1% Pacific Islander, 3.2% from other races, and 2.0% from two or more races. Hispanic or Latino of any race were 8.7% of the population.
There were 3,541 households, out of which 33.2% had children under the age of 18 living with them, 58.2% were married couples living together, 8.7% had a female householder with no husband present, and 29.2% were non-families. 22.7% of all households were made up of individuals, and 5.2% had someone living alone who was 65 years of age or older. The average household size was 2.50 and the average family size was 2.94.
In the CDP, the population was spread out, with 25.2% under the age of 18, 6.2% from 18 to 24, 32.2% from 25 to 44, 27.2% from 45 to 64, and 9.2% who were 65 years of age or older. The median age was 38 years. For every 100 females, there were 97.2 males. For every 100 females age 18 and over, there were 94.2 males.
The median income for a household in the CDP was $50,945, and the median income for a family was $56,917. Males had a median income of $41,919 versus $30,917 for females. The per capita income for the CDP was $24,945. About 3.2% of families and 4.3% of the population were below the poverty line, including 5.2% of those under age 18 and 4.2% of those age 65 or over.
Common Questions
What is Per Capita Income in Cimarron Hills?
Per Capita income in Cimarron Hills is $34,425.
What is the Median Family Income in Cimarron Hills?
Median Family Income in Cimarron Hills is $82,321.
What is the Median Household income in Cimarron Hills?
Median Household Income in Cimarron Hills is $74,646.
What is Income or Wage Gap in Cimarron Hills?
Income or Wage Gap in Cimarron Hills is 41.9%.
Women in Cimarron Hills earn 58.1 cents for every dollar earned by a man.
What is Inequality or Gini Index in Cimarron Hills?
Inequality or Gini Index in Cimarron Hills is 0.39.
What is the Total Population of Cimarron Hills?
Total Population of Cimarron Hills is 19,039.
What is the Total Male Population of Cimarron Hills?
Total Male Population of Cimarron Hills is 10,204.
What is the Total Female Population of Cimarron Hills?
Total Female Population of Cimarron Hills is 8,835.
What is the Ratio of Males per 100 Females in Cimarron Hills?
There are 115.50 Males per 100 Females in Cimarron Hills.
What is the Ratio of Females per 100 Males in Cimarron Hills?
There are 86.58 Females per 100 Males in Cimarron Hills.
What is the Median Population Age in Cimarron Hills?
Median Population Age in Cimarron Hills is 32.6 Years.
What is the Average Family Size in Cimarron Hills
Average Family Size in Cimarron Hills is 3.1 People.
What is the Average Household Size in Cimarron Hills
Average Household Size in Cimarron Hills is 2.7 People.
How Large is the Labor Force in Cimarron Hills?
There are 10,602 People in the Labor Forcein in Cimarron Hills.
What is the Percentage of People in the Labor Force in Cimarron Hills?
71.4% of People are in the Labor Force in Cimarron Hills.
What is the Unemployment Rate in Cimarron Hills?
Unemployment Rate in Cimarron Hills is 5.4%.