Cities with the Highest Percentage of Somali Population in the United States
RELATED REPORTS & OPTIONS
Somali
United States
Compare Cities
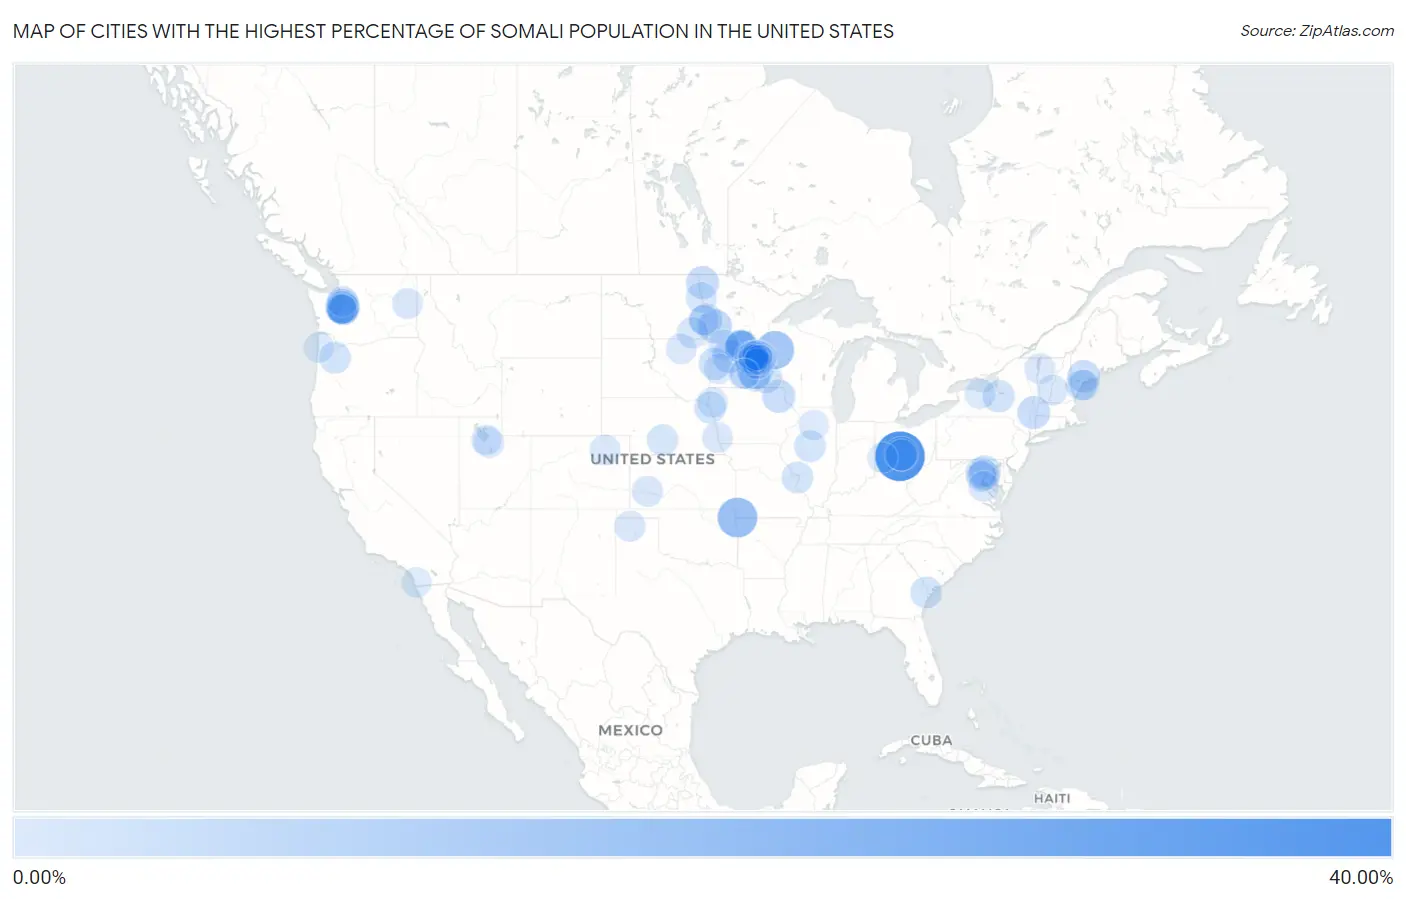
Map of Cities with the Highest Percentage of Somali Population in the United States
0.00%
40.00%
Cities with the Highest Percentage of Somali Population in the United States
| City | Somali | vs State | vs National | |
| 1. | Urbancrest | 37.34% | 0.21%(+37.1)#1 | 0.051%(+37.3)#1 |
| 2. | Noel | 18.08% | 0.042%(+18.0)#1 | 0.051%(+18.0)#2 |
| 3. | Barron | 15.16% | 0.044%(+15.1)#1 | 0.051%(+15.1)#3 |
| 4. | Faribault | 9.85% | 1.12%(+8.74)#1 | 0.051%(+9.80)#4 |
| 5. | Hilltop | 8.66% | 1.12%(+7.54)#2 | 0.051%(+8.61)#5 |
| 6. | Columbia Heights | 8.62% | 1.12%(+7.51)#3 | 0.051%(+8.57)#6 |
| 7. | Bryn Mawr Skyway | 7.87% | 0.21%(+7.67)#1 | 0.051%(+7.82)#7 |
| 8. | Minerva Park | 7.60% | 0.21%(+7.39)#2 | 0.051%(+7.55)#8 |
| 9. | Pelican Rapids | 7.26% | 1.12%(+6.15)#4 | 0.051%(+7.21)#9 |
| 10. | St Cloud | 6.37% | 1.12%(+5.25)#5 | 0.051%(+6.32)#10 |
| 11. | Kennedy | 5.65% | 1.12%(+4.53)#6 | 0.051%(+5.60)#11 |
| 12. | Postville | 5.58% | 0.052%(+5.53)#1 | 0.051%(+5.53)#12 |
| 13. | Willmar | 5.56% | 1.12%(+4.44)#7 | 0.051%(+5.51)#13 |
| 14. | Philmont | 5.39% | 0.023%(+5.37)#1 | 0.051%(+5.34)#14 |
| 15. | Waite Park | 5.14% | 1.12%(+4.02)#8 | 0.051%(+5.09)#15 |
| 16. | Dilworth | 5.09% | 1.12%(+3.97)#9 | 0.051%(+5.03)#16 |
| 17. | Lewiston | 4.96% | 0.28%(+4.68)#1 | 0.051%(+4.91)#17 |
| 18. | Seatac | 4.93% | 0.21%(+4.73)#2 | 0.051%(+4.88)#18 |
| 19. | Minneapolis | 4.81% | 1.12%(+3.69)#10 | 0.051%(+4.76)#19 |
| 20. | Tukwila | 4.58% | 0.21%(+4.37)#3 | 0.051%(+4.53)#20 |
| 21. | Fridley | 4.07% | 1.12%(+2.95)#11 | 0.051%(+4.02)#21 |
| 22. | Lyncourt | 4.03% | 0.023%(+4.01)#2 | 0.051%(+3.98)#22 |
| 23. | St Leo | 3.97% | 1.12%(+2.86)#12 | 0.051%(+3.92)#23 |
| 24. | St Joseph | 3.96% | 1.12%(+2.85)#13 | 0.051%(+3.91)#24 |
| 25. | Mendota Heights | 3.58% | 1.12%(+2.47)#14 | 0.051%(+3.53)#25 |
| 26. | Savage | 3.57% | 1.12%(+2.45)#15 | 0.051%(+3.52)#26 |
| 27. | Shakopee | 3.31% | 1.12%(+2.20)#16 | 0.051%(+3.26)#27 |
| 28. | Eden Prairie | 3.20% | 1.12%(+2.09)#17 | 0.051%(+3.15)#28 |
| 29. | South Sioux City | 3.16% | 0.14%(+3.02)#1 | 0.051%(+3.11)#29 |
| 30. | Silverton | 3.12% | 0.063%(+3.06)#1 | 0.051%(+3.07)#30 |
| 31. | Loretto | 3.06% | 1.12%(+1.95)#18 | 0.051%(+3.01)#31 |
| 32. | Port Wentworth | 3.03% | 0.036%(+2.99)#1 | 0.051%(+2.98)#32 |
| 33. | Layhill | 3.01% | 0.0074%(+3.00)#1 | 0.051%(+2.96)#33 |
| 34. | Dellwood | 2.96% | 0.042%(+2.92)#2 | 0.051%(+2.91)#34 |
| 35. | Hopedale | 2.95% | 0.013%(+2.93)#1 | 0.051%(+2.89)#35 |
| 36. | Rochester | 2.83% | 1.12%(+1.72)#19 | 0.051%(+2.78)#36 |
| 37. | East Lansdowne Borough | 2.77% | 0.0081%(+2.77)#1 | 0.051%(+2.72)#37 |
| 38. | Kent | 2.71% | 0.21%(+2.51)#4 | 0.051%(+2.66)#38 |
| 39. | Columbus | 2.43% | 0.21%(+2.22)#3 | 0.051%(+2.38)#39 |
| 40. | Lexington | 2.31% | 0.14%(+2.17)#2 | 0.051%(+2.26)#40 |
| 41. | Eagan | 2.24% | 1.12%(+1.13)#20 | 0.051%(+2.19)#41 |
| 42. | Bloomington | 2.15% | 1.12%(+1.04)#21 | 0.051%(+2.10)#42 |
| 43. | Gwinner | 2.11% | 0.25%(+1.87)#1 | 0.051%(+2.06)#43 |
| 44. | Burnsville | 2.08% | 1.12%(+0.963)#22 | 0.051%(+2.03)#44 |
| 45. | Mahtomedi | 2.04% | 1.12%(+0.928)#23 | 0.051%(+1.99)#45 |
| 46. | Garden City | 2.01% | 0.025%(+1.99)#1 | 0.051%(+1.96)#46 |
| 47. | St Paul | 1.95% | 1.12%(+0.835)#24 | 0.051%(+1.90)#47 |
| 48. | South Portland | 1.87% | 0.28%(+1.59)#2 | 0.051%(+1.82)#48 |
| 49. | Robbinsdale | 1.79% | 1.12%(+0.669)#25 | 0.051%(+1.73)#49 |
| 50. | Hopkins | 1.75% | 1.12%(+0.633)#26 | 0.051%(+1.70)#50 |
| 51. | East Grand Forks | 1.71% | 1.12%(+0.595)#27 | 0.051%(+1.66)#51 |
| 52. | New Hope | 1.71% | 1.12%(+0.591)#28 | 0.051%(+1.66)#52 |
| 53. | Fairwood Cdp King County | 1.67% | 0.21%(+1.46)#5 | 0.051%(+1.62)#53 |
| 54. | Sugarland Run | 1.66% | 0.042%(+1.62)#1 | 0.051%(+1.61)#54 |
| 55. | Winooski | 1.65% | 0.076%(+1.57)#1 | 0.051%(+1.60)#55 |
| 56. | Idylwood | 1.59% | 0.042%(+1.55)#2 | 0.051%(+1.54)#56 |
| 57. | Fairchild Afb | 1.57% | 0.21%(+1.36)#6 | 0.051%(+1.52)#57 |
| 58. | Cactus | 1.54% | 0.011%(+1.53)#1 | 0.051%(+1.49)#58 |
| 59. | Lake Forest Park | 1.54% | 0.21%(+1.33)#7 | 0.051%(+1.49)#59 |
| 60. | Portland | 1.50% | 0.28%(+1.22)#3 | 0.051%(+1.45)#60 |
| 61. | Fort Morgan | 1.45% | 0.042%(+1.41)#1 | 0.051%(+1.40)#61 |
| 62. | Apple Valley | 1.43% | 1.12%(+0.314)#29 | 0.051%(+1.38)#62 |
| 63. | Bayport | 1.41% | 1.12%(+0.293)#30 | 0.051%(+1.36)#63 |
| 64. | Long Beach | 1.33% | 1.12%(+0.213)#31 | 0.051%(+1.28)#64 |
| 65. | Roseville | 1.33% | 1.12%(+0.209)#32 | 0.051%(+1.27)#65 |
| 66. | Lilydale | 1.31% | 1.12%(+0.198)#33 | 0.051%(+1.26)#66 |
| 67. | Murray | 1.31% | 0.14%(+1.17)#3 | 0.051%(+1.26)#67 |
| 68. | New Brighton | 1.29% | 1.12%(+0.176)#34 | 0.051%(+1.24)#68 |
| 69. | Fairfax Station | 1.28% | 0.042%(+1.24)#3 | 0.051%(+1.23)#69 |
| 70. | Owatonna | 1.24% | 1.12%(+0.126)#35 | 0.051%(+1.19)#70 |
| 71. | Lakeland North | 1.23% | 0.21%(+1.02)#8 | 0.051%(+1.18)#71 |
| 72. | Aberdeen | 1.20% | 0.10%(+1.10)#1 | 0.051%(+1.15)#72 |
| 73. | Kearns | 1.19% | 0.077%(+1.11)#1 | 0.051%(+1.14)#73 |
| 74. | Richfield | 1.18% | 1.12%(+0.068)#36 | 0.051%(+1.13)#74 |
| 75. | Four Square Mile | 1.18% | 0.042%(+1.13)#2 | 0.051%(+1.13)#75 |
| 76. | Spring Park | 1.15% | 1.12%(+0.030)#37 | 0.051%(+1.10)#76 |
| 77. | Maple Grove | 1.11% | 1.12%(-0.009)#38 | 0.051%(+1.06)#77 |
| 78. | Claremont | 1.11% | 0.030%(+1.08)#1 | 0.051%(+1.06)#78 |
| 79. | Braddock Borough | 1.10% | 0.0081%(+1.09)#2 | 0.051%(+1.05)#79 |
| 80. | Sartell | 1.08% | 1.12%(-0.038)#39 | 0.051%(+1.03)#80 |
| 81. | King George | 1.08% | 0.042%(+1.04)#4 | 0.051%(+1.03)#81 |
| 82. | Maplewood | 1.05% | 1.12%(-0.066)#40 | 0.051%(+1.00)#82 |
| 83. | Edina | 1.05% | 1.12%(-0.066)#41 | 0.051%(+1.000)#83 |
| 84. | Marshall | 1.05% | 1.12%(-0.068)#42 | 0.051%(+0.997)#84 |
| 85. | Bay City | 1.03% | 0.063%(+0.971)#2 | 0.051%(+0.984)#85 |
| 86. | St Louis Park | 1.03% | 1.12%(-0.090)#43 | 0.051%(+0.976)#86 |
| 87. | Rosemount | 0.99% | 1.12%(-0.124)#44 | 0.051%(+0.942)#87 |
| 88. | Merrill | 0.94% | 0.052%(+0.885)#2 | 0.051%(+0.887)#88 |
| 89. | Fargo | 0.93% | 0.25%(+0.684)#2 | 0.051%(+0.879)#89 |
| 90. | Webster | 0.93% | 0.023%(+0.903)#3 | 0.051%(+0.875)#90 |
| 91. | Englewood | 0.83% | 0.21%(+0.620)#4 | 0.051%(+0.783)#91 |
| 92. | Brooklyn Park | 0.83% | 1.12%(-0.283)#45 | 0.051%(+0.783)#92 |
| 93. | Magna | 0.82% | 0.077%(+0.742)#2 | 0.051%(+0.769)#93 |
| 94. | North Mankato | 0.81% | 1.12%(-0.308)#46 | 0.051%(+0.757)#94 |
| 95. | Mendota | 0.80% | 0.013%(+0.792)#2 | 0.051%(+0.754)#95 |
| 96. | Mankato | 0.79% | 1.12%(-0.322)#47 | 0.051%(+0.744)#96 |
| 97. | Des Moines | 0.79% | 0.21%(+0.581)#9 | 0.051%(+0.736)#97 |
| 98. | Lemon Grove | 0.78% | 0.013%(+0.766)#1 | 0.051%(+0.728)#98 |
| 99. | Lino Lakes | 0.77% | 1.12%(-0.350)#48 | 0.051%(+0.716)#99 |
| 100. | Woodbury | 0.76% | 1.12%(-0.358)#49 | 0.051%(+0.708)#100 |
Common Questions
What are the Top 10 Cities with the Highest Percentage of Somali Population in the United States?
Top 10 Cities with the Highest Percentage of Somali Population in the United States are:
#1
37.34%
#2
18.08%
#3
15.16%
#4
9.85%
#5
8.66%
#6
8.62%
#7
7.87%
#8
7.60%
#9
7.26%
#10
6.37%
What city has the Highest Percentage of Somali Population in the United States?
Urbancrest has the Highest Percentage of Somali Population in the United States with 37.34%.
What is the Percentage of Somali Population in the United States?
Percentage of Somali Population in the United States is 0.051%.