Cities with the Highest Percentage of Population Enrolled in University in the United States
RELATED REPORTS & OPTIONS
University
United States
Compare Cities
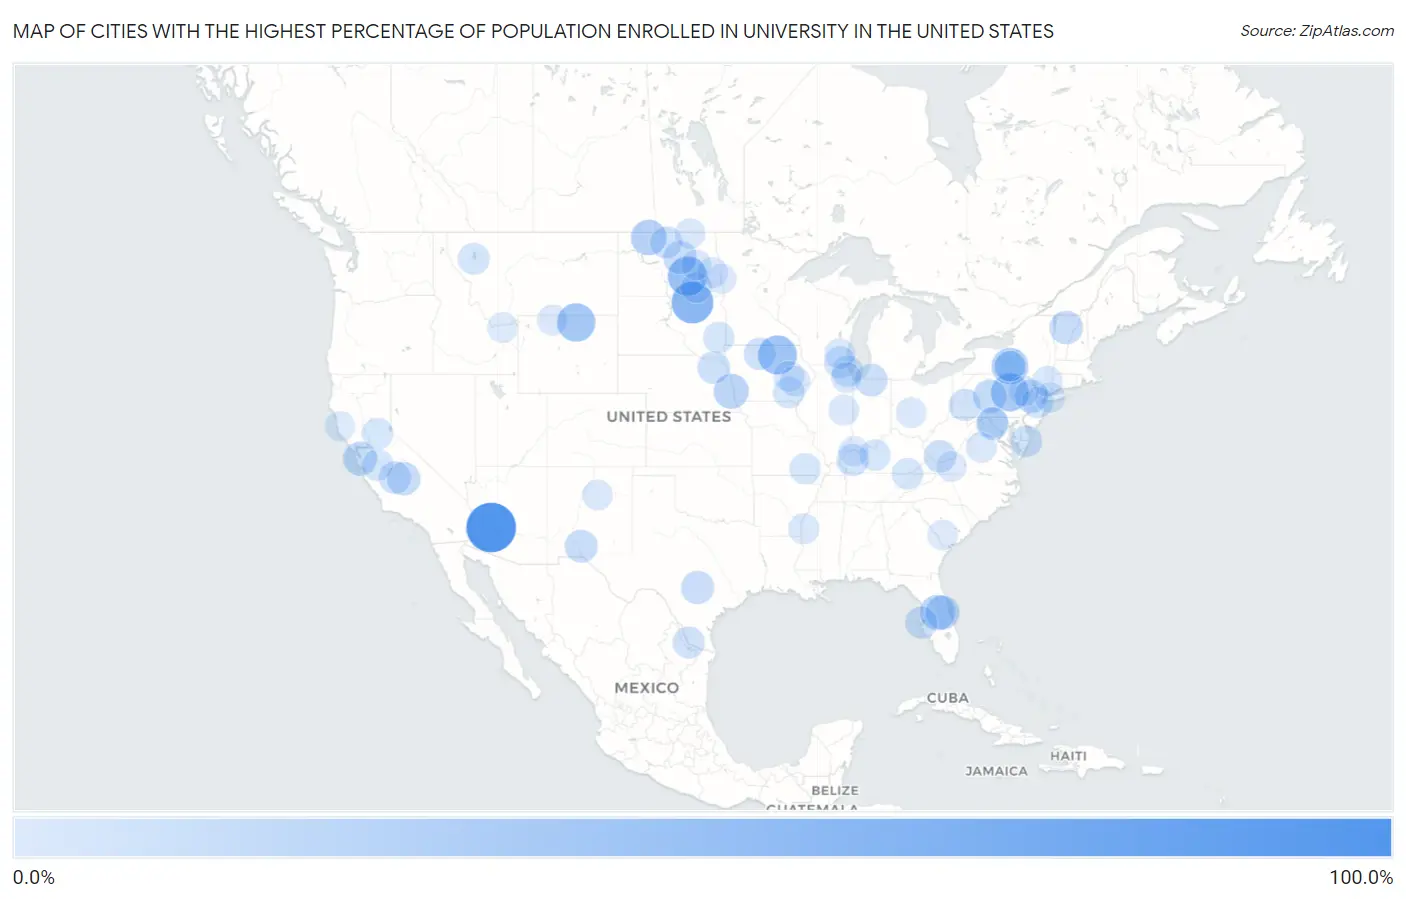
Map of Cities with the Highest Percentage of Population Enrolled in University in the United States
0.0%
100.0%
Cities with the Highest Percentage of Population Enrolled in University in the United States
| City | % in University | vs State | vs National | |
| 1. | Tonopah | 100.0% | 1.3%(+98.7)#1 | 1.4%(+98.6)#1 |
| 2. | Ohoopee | 80.5% | 1.4%(+79.1)#1 | 1.4%(+79.1)#2 |
| 3. | Wetonka | 63.6% | 0.88%(+62.8)#1 | 1.4%(+62.2)#3 |
| 4. | Statesville | 58.1% | 1.2%(+56.8)#1 | 1.4%(+56.7)#4 |
| 5. | Big Bow | 54.5% | 1.4%(+53.1)#1 | 1.4%(+53.1)#5 |
| 6. | Cleveland | 52.9% | 1.5%(+51.4)#1 | 1.4%(+51.5)#6 |
| 7. | Roseville | 50.0% | 1.1%(+48.9)#1 | 1.4%(+48.6)#7 |
| 8. | Big Horn | 47.2% | 1.3%(+45.9)#1 | 1.4%(+45.8)#8 |
| 9. | Buckhorn | 45.2% | 1.4%(+43.8)#1 | 1.4%(+43.8)#9 |
| 10. | Forest Home | 39.8% | 1.7%(+38.1)#1 | 1.4%(+38.4)#10 |
| 11. | Somerset | 37.3% | 1.4%(+35.8)#2 | 1.4%(+35.8)#11 |
| 12. | Graysville | 36.8% | 1.2%(+35.7)#1 | 1.4%(+35.4)#12 |
| 13. | Tolley | 35.7% | 1.5%(+34.2)#2 | 1.4%(+34.3)#13 |
| 14. | Bay Lake | 33.3% | 1.3%(+32.0)#1 | 1.4%(+31.9)#14 |
| 15. | Stephan | 32.6% | 0.88%(+31.7)#2 | 1.4%(+31.2)#15 |
| 16. | Richfield | 32.5% | 1.6%(+30.9)#1 | 1.4%(+31.1)#16 |
| 17. | Justice Addition | 30.7% | 1.1%(+29.6)#1 | 1.4%(+29.3)#17 |
| 18. | Panther Burn | 30.4% | 1.2%(+29.3)#1 | 1.4%(+29.0)#18 |
| 19. | Lake Hart | 29.1% | 1.3%(+27.8)#2 | 1.4%(+27.7)#19 |
| 20. | Stanford | 28.3% | 1.5%(+26.8)#1 | 1.4%(+26.9)#20 |
| 21. | Tunnelton | 26.6% | 1.2%(+25.4)#2 | 1.4%(+25.2)#21 |
| 22. | Toftrees | 26.3% | 1.4%(+24.9)#2 | 1.4%(+24.9)#22 |
| 23. | Double Horn | 25.8% | 1.3%(+24.5)#1 | 1.4%(+24.4)#23 |
| 24. | Worcester | 25.7% | 1.5%(+24.3)#1 | 1.4%(+24.3)#24 |
| 25. | Heimdal | 25.6% | 1.5%(+24.1)#3 | 1.4%(+24.2)#25 |
| 26. | Tooleville | 25.5% | 1.5%(+24.0)#2 | 1.4%(+24.1)#26 |
| 27. | Buttzville | 25.2% | 1.6%(+23.7)#1 | 1.4%(+23.8)#27 |
| 28. | Varna | 24.5% | 1.7%(+22.8)#2 | 1.4%(+23.1)#28 |
| 29. | Spring Branch | 24.3% | 1.3%(+23.0)#2 | 1.4%(+22.9)#29 |
| 30. | Organ | 23.5% | 1.4%(+22.1)#1 | 1.4%(+22.1)#30 |
| 31. | Dorseyville | 23.3% | 1.2%(+22.1)#1 | 1.4%(+21.9)#31 |
| 32. | Roseland | 23.1% | 1.2%(+21.9)#3 | 1.4%(+21.7)#32 |
| 33. | Bolton Valley | 23.0% | 1.5%(+21.6)#2 | 1.4%(+21.6)#33 |
| 34. | Big Foot Prairie | 22.2% | 1.1%(+21.1)#1 | 1.4%(+20.8)#34 |
| 35. | Yarrowsburg | 22.1% | 2.0%(+20.1)#1 | 1.4%(+20.7)#35 |
| 36. | Sholes | 21.7% | 1.6%(+20.1)#2 | 1.4%(+20.3)#36 |
| 37. | Itmann | 21.6% | 1.1%(+20.5)#2 | 1.4%(+20.2)#37 |
| 38. | Hardwick | 21.3% | 1.5%(+19.8)#3 | 1.4%(+19.9)#38 |
| 39. | Bear Creek | 20.9% | 1.3%(+19.6)#3 | 1.4%(+19.5)#39 |
| 40. | St Benedict | 20.5% | 1.1%(+19.3)#2 | 1.4%(+19.0)#40 |
| 41. | Harrison City | 20.3% | 1.4%(+18.8)#3 | 1.4%(+18.8)#41 |
| 42. | Manitou | 20.1% | 1.2%(+19.0)#1 | 1.4%(+18.7)#42 |
| 43. | Bantry | 20.0% | 1.5%(+18.5)#4 | 1.4%(+18.6)#43 |
| 44. | La Minita | 19.8% | 1.3%(+18.5)#3 | 1.4%(+18.4)#44 |
| 45. | Whaleyville | 19.0% | 2.0%(+17.0)#2 | 1.4%(+17.6)#45 |
| 46. | Springfield | 18.9% | 1.1%(+17.7)#2 | 1.4%(+17.5)#46 |
| 47. | East Ithaca | 18.6% | 1.7%(+16.9)#3 | 1.4%(+17.2)#47 |
| 48. | Armorel | 18.3% | 1.0%(+17.3)#1 | 1.4%(+16.9)#48 |
| 49. | Kings Point | 18.3% | 1.2%(+17.1)#1 | 1.4%(+16.9)#49 |
| 50. | East Alliance | 18.3% | 1.2%(+17.0)#1 | 1.4%(+16.9)#50 |
| 51. | Runnelstown | 18.2% | 1.2%(+17.1)#2 | 1.4%(+16.8)#51 |
| 52. | Longview | 18.0% | 1.2%(+16.8)#3 | 1.4%(+16.6)#52 |
| 53. | Bannockburn | 17.5% | 1.6%(+15.9)#1 | 1.4%(+16.1)#53 |
| 54. | Coloma | 17.2% | 1.5%(+15.7)#4 | 1.4%(+15.8)#54 |
| 55. | Maharishi Vedic City | 17.2% | 1.1%(+16.0)#3 | 1.4%(+15.7)#55 |
| 56. | Cumberland Gap | 16.9% | 1.2%(+15.7)#2 | 1.4%(+15.5)#56 |
| 57. | Volta | 16.8% | 1.5%(+15.3)#5 | 1.4%(+15.4)#57 |
| 58. | Big Rock | 16.7% | 1.1%(+15.5)#4 | 1.4%(+15.3)#58 |
| 59. | Hunter | 16.5% | 1.4%(+15.1)#1 | 1.4%(+15.1)#59 |
| 60. | Cecilia | 16.4% | 1.2%(+15.3)#2 | 1.4%(+15.0)#60 |
| 61. | University Of California-Santa Barbara | 16.3% | 1.5%(+14.8)#6 | 1.4%(+14.9)#61 |
| 62. | Brant Lake South | 16.2% | 0.88%(+15.3)#3 | 1.4%(+14.8)#62 |
| 63. | East Millstone | 16.2% | 1.6%(+14.6)#2 | 1.4%(+14.8)#63 |
| 64. | New Munster | 16.2% | 1.1%(+15.0)#3 | 1.4%(+14.8)#64 |
| 65. | Berlin | 16.0% | 1.5%(+14.5)#5 | 1.4%(+14.6)#65 |
| 66. | Mauna Loa Estates | 15.6% | 1.4%(+14.3)#1 | 1.4%(+14.2)#66 |
| 67. | Rio | 15.2% | 1.8%(+13.4)#1 | 1.4%(+13.8)#67 |
| 68. | Antietam | 15.1% | 2.0%(+13.1)#3 | 1.4%(+13.7)#68 |
| 69. | South Frydek | 14.9% | 1.3%(+13.6)#4 | 1.4%(+13.4)#69 |
| 70. | Letts | 14.8% | 1.2%(+13.6)#4 | 1.4%(+13.4)#70 |
| 71. | Trivoli | 14.6% | 1.6%(+12.9)#2 | 1.4%(+13.2)#71 |
| 72. | Oconomowoc Lake | 14.5% | 1.1%(+13.4)#4 | 1.4%(+13.1)#72 |
| 73. | Metcalfe | 14.5% | 1.2%(+13.3)#4 | 1.4%(+13.0)#73 |
| 74. | Garland | 14.4% | 1.3%(+13.1)#2 | 1.4%(+13.0)#74 |
| 75. | Watkins | 14.3% | 1.1%(+13.1)#5 | 1.4%(+12.9)#75 |
| 76. | Erie | 14.0% | 1.5%(+12.4)#6 | 1.4%(+12.5)#76 |
| 77. | Oakbrook Terrace | 13.7% | 1.6%(+12.1)#3 | 1.4%(+12.3)#77 |
| 78. | University Heights | 13.6% | 1.1%(+12.5)#6 | 1.4%(+12.2)#78 |
| 79. | New Market | 13.6% | 1.4%(+12.3)#2 | 1.4%(+12.2)#79 |
| 80. | Mansión Del Sol | 13.6% | 1.3%(+12.3)#1 | 1.4%(+12.2)#80 |
| 81. | Glenfield | 13.5% | 1.5%(+12.0)#7 | 1.4%(+12.1)#81 |
| 82. | Freedom Plains | 13.4% | 1.7%(+11.7)#4 | 1.4%(+12.0)#82 |
| 83. | Urbana | 13.4% | 1.6%(+11.8)#4 | 1.4%(+12.0)#83 |
| 84. | Ribera | 13.4% | 1.4%(+12.0)#2 | 1.4%(+12.0)#84 |
| 85. | Carlisle Barracks | 13.4% | 1.4%(+11.9)#4 | 1.4%(+12.0)#85 |
| 86. | Sarles | 13.3% | 1.5%(+11.8)#8 | 1.4%(+11.9)#86 |
| 87. | Plumwood | 13.3% | 1.2%(+12.1)#2 | 1.4%(+11.9)#87 |
| 88. | University Of Virginia | 13.1% | 1.8%(+11.4)#2 | 1.4%(+11.7)#88 |
| 89. | Greenvale | 13.1% | 1.7%(+11.4)#5 | 1.4%(+11.7)#89 |
| 90. | Ulmer | 13.0% | 1.2%(+11.9)#1 | 1.4%(+11.6)#90 |
| 91. | Spencer | 13.0% | 1.0%(+12.0)#1 | 1.4%(+11.6)#91 |
| 92. | El Paso | 13.0% | 1.0%(+12.0)#2 | 1.4%(+11.6)#92 |
| 93. | Pocono Pines | 12.7% | 1.4%(+11.3)#5 | 1.4%(+11.3)#93 |
| 94. | Snowville | 12.7% | 1.8%(+10.9)#3 | 1.4%(+11.3)#94 |
| 95. | Bennetts Switch | 12.6% | 1.2%(+11.4)#5 | 1.4%(+11.2)#95 |
| 96. | Comptche | 12.5% | 1.5%(+11.0)#7 | 1.4%(+11.1)#96 |
| 97. | Briarwood | 12.5% | 1.5%(+11.0)#9 | 1.4%(+11.1)#97 |
| 98. | Ithaca | 12.4% | 1.7%(+10.7)#6 | 1.4%(+11.0)#98 |
| 99. | Westford | 12.4% | 1.5%(+10.9)#3 | 1.4%(+11.0)#99 |
| 100. | Spottsville | 12.4% | 1.2%(+11.2)#3 | 1.4%(+11.0)#100 |
Common Questions
What are the Top 10 Cities with the Highest Percentage of Population Enrolled in University in the United States?
Top 10 Cities with the Highest Percentage of Population Enrolled in University in the United States are:
What city has the Highest Percentage of Population Enrolled in University in the United States?
Tonopah has the Highest Percentage of Population Enrolled in University in the United States with 100.0%.
What is the Percentage of Population Enrolled in University in the United States?
Percentage of Population Enrolled in University in the United States is 1.4%.