Cities with the Lowest Percentage of Births to Unmarried Women in the United States
RELATED REPORTS & OPTIONS
Lowest Illegitimacy | All Women
United States
Compare Cities
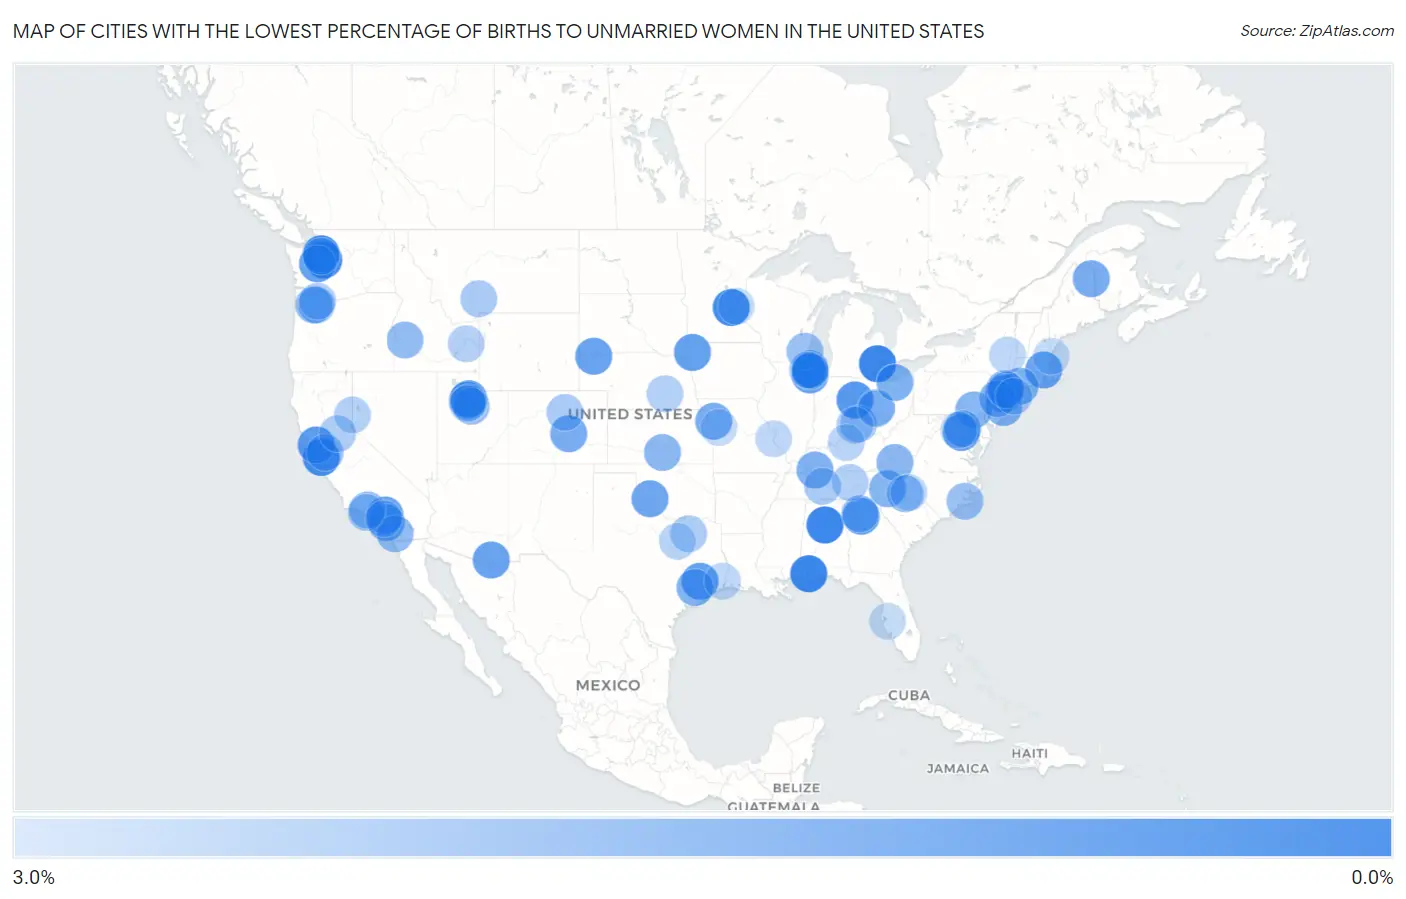
Map of Cities with the Lowest Percentage of Births to Unmarried Women in the United States
3.0%
0.0%
Cities with the Lowest Percentage of Births to Unmarried Women in the United States
| City | % Unmarried | vs State | vs National | |
| 1. | Daphne | 0.20% | 38.7%(-38.5)#1 | 32.1%(-31.9)#1 |
| 2. | Hamtramck | 0.20% | 34.8%(-34.6)#1 | 32.1%(-31.9)#2 |
| 3. | Mountain Brook | 0.20% | 38.7%(-38.5)#2 | 32.1%(-31.9)#3 |
| 4. | Sammamish | 0.30% | 24.1%(-23.8)#1 | 32.1%(-31.8)#4 |
| 5. | Andover | 0.30% | 24.7%(-24.4)#1 | 32.1%(-31.8)#5 |
| 6. | Highland Park | 0.30% | 32.2%(-31.9)#1 | 32.1%(-31.8)#6 |
| 7. | Palo Alto | 0.40% | 30.6%(-30.2)#1 | 32.1%(-31.7)#7 |
| 8. | Silver Firs | 0.40% | 24.1%(-23.7)#2 | 32.1%(-31.7)#8 |
| 9. | Cusseta Chattahoochee County Unified Government | 0.50% | 36.1%(-35.6)#1 | 32.1%(-31.6)#9 |
| 10. | Manheim Borough | 0.50% | 32.6%(-32.1)#1 | 32.1%(-31.6)#10 |
| 11. | Cottonwood Heights | 0.70% | 14.4%(-13.7)#1 | 32.1%(-31.4)#11 |
| 12. | Caldwell Borough | 0.70% | 26.4%(-25.7)#1 | 32.1%(-31.4)#12 |
| 13. | Coldwater | 0.70% | 37.8%(-37.1)#1 | 32.1%(-31.4)#13 |
| 14. | Novato | 0.80% | 30.6%(-29.8)#2 | 32.1%(-31.3)#14 |
| 15. | Edgewater Borough | 0.80% | 26.4%(-25.6)#2 | 32.1%(-31.3)#15 |
| 16. | The Woodlands | 0.90% | 32.3%(-31.4)#1 | 32.1%(-31.2)#16 |
| 17. | Upper Montclair | 0.90% | 26.4%(-25.5)#3 | 32.1%(-31.2)#17 |
| 18. | Vashon | 0.90% | 24.1%(-23.2)#3 | 32.1%(-31.2)#18 |
| 19. | Orange City | 0.90% | 28.1%(-27.2)#1 | 32.1%(-31.2)#19 |
| 20. | Johns Creek | 1.0% | 36.1%(-35.1)#2 | 32.1%(-31.1)#20 |
| 21. | Claremont | 1.0% | 30.6%(-29.6)#3 | 32.1%(-31.1)#21 |
| 22. | Franklin Town | 1.0% | 27.2%(-26.2)#1 | 32.1%(-31.1)#22 |
| 23. | Sierra Vista Southeast | 1.0% | 36.4%(-35.4)#1 | 32.1%(-31.1)#23 |
| 24. | Newington | 1.0% | 29.2%(-28.2)#1 | 32.1%(-31.1)#24 |
| 25. | Stickney | 1.0% | 32.2%(-31.2)#2 | 32.1%(-31.1)#25 |
| 26. | Chadron | 1.0% | 30.3%(-29.3)#1 | 32.1%(-31.1)#26 |
| 27. | Little Ferry Borough | 1.1% | 26.4%(-25.3)#4 | 32.1%(-31.0)#27 |
| 28. | Hobart | 1.1% | 32.5%(-31.4)#1 | 32.1%(-31.0)#28 |
| 29. | Rancho Santa Margarita | 1.3% | 30.6%(-29.3)#4 | 32.1%(-30.8)#29 |
| 30. | Fort Carson | 1.3% | 22.2%(-20.9)#1 | 32.1%(-30.8)#30 |
| 31. | Smithville | 1.3% | 30.2%(-28.9)#1 | 32.1%(-30.8)#31 |
| 32. | Presque Isle | 1.3% | 30.0%(-28.7)#1 | 32.1%(-30.8)#32 |
| 33. | Lakewood | 1.4% | 26.4%(-25.0)#5 | 32.1%(-30.7)#33 |
| 34. | Milford City Balance | 1.4% | 26.7%(-25.3)#1 | 32.1%(-30.7)#34 |
| 35. | Katy | 1.4% | 32.3%(-30.9)#2 | 32.1%(-30.7)#35 |
| 36. | Fort Campbell North | 1.4% | 33.8%(-32.4)#1 | 32.1%(-30.7)#36 |
| 37. | Pompton Plains | 1.4% | 26.4%(-25.0)#6 | 32.1%(-30.7)#37 |
| 38. | Tullytown Borough | 1.4% | 32.6%(-31.2)#2 | 32.1%(-30.7)#38 |
| 39. | Willow Street | 1.5% | 32.6%(-31.1)#3 | 32.1%(-30.6)#39 |
| 40. | Swannanoa | 1.5% | 34.6%(-33.1)#1 | 32.1%(-30.6)#40 |
| 41. | Westmont Borough | 1.5% | 32.6%(-31.1)#4 | 32.1%(-30.6)#41 |
| 42. | Bethesda | 1.6% | 31.9%(-30.3)#1 | 32.1%(-30.5)#42 |
| 43. | Draper | 1.6% | 14.4%(-12.8)#2 | 32.1%(-30.5)#43 |
| 44. | Lake Oswego | 1.6% | 23.4%(-21.8)#1 | 32.1%(-30.5)#44 |
| 45. | Monsey | 1.6% | 28.8%(-27.2)#1 | 32.1%(-30.5)#45 |
| 46. | Trumbull Center | 1.6% | 26.7%(-25.1)#2 | 32.1%(-30.5)#46 |
| 47. | Finderne | 1.6% | 26.4%(-24.8)#7 | 32.1%(-30.5)#47 |
| 48. | Richlands | 1.6% | 29.2%(-27.6)#2 | 32.1%(-30.5)#48 |
| 49. | Kingman | 1.6% | 28.5%(-26.9)#1 | 32.1%(-30.5)#49 |
| 50. | Poway | 1.7% | 30.6%(-28.9)#5 | 32.1%(-30.4)#50 |
| 51. | Pearl River | 1.7% | 28.8%(-27.1)#2 | 32.1%(-30.4)#51 |
| 52. | Garden City | 1.7% | 19.2%(-17.5)#1 | 32.1%(-30.4)#52 |
| 53. | Milton | 1.8% | 36.1%(-34.3)#3 | 32.1%(-30.3)#53 |
| 54. | Fillmore | 1.8% | 30.6%(-28.8)#6 | 32.1%(-30.3)#54 |
| 55. | Ranlo | 1.8% | 34.6%(-32.8)#2 | 32.1%(-30.3)#55 |
| 56. | Pleasanton | 1.9% | 30.6%(-28.7)#7 | 32.1%(-30.2)#56 |
| 57. | Brookfield | 1.9% | 28.1%(-26.2)#1 | 32.1%(-30.2)#57 |
| 58. | Springville | 1.9% | 14.4%(-12.5)#3 | 32.1%(-30.2)#58 |
| 59. | Havelock | 1.9% | 34.6%(-32.7)#3 | 32.1%(-30.2)#59 |
| 60. | Happy Valley | 2.0% | 23.4%(-21.4)#2 | 32.1%(-30.1)#60 |
| 61. | Rocky River | 2.0% | 37.8%(-35.8)#2 | 32.1%(-30.1)#61 |
| 62. | Bozeman | 2.1% | 25.6%(-23.5)#1 | 32.1%(-30.0)#62 |
| 63. | Spring Hill | 2.1% | 33.4%(-31.3)#1 | 32.1%(-30.0)#63 |
| 64. | Dublin | 2.1% | 37.8%(-35.7)#3 | 32.1%(-30.0)#64 |
| 65. | Sherrelwood | 2.1% | 22.2%(-20.1)#2 | 32.1%(-30.0)#65 |
| 66. | Blue Ash | 2.1% | 37.8%(-35.7)#4 | 32.1%(-30.0)#66 |
| 67. | Woodinville | 2.1% | 24.1%(-22.0)#4 | 32.1%(-30.0)#67 |
| 68. | Arlington Heights | 2.2% | 32.2%(-30.0)#3 | 32.1%(-29.9)#68 |
| 69. | Camarillo | 2.2% | 30.6%(-28.4)#8 | 32.1%(-29.9)#69 |
| 70. | El Dorado Hills | 2.2% | 30.6%(-28.4)#9 | 32.1%(-29.9)#70 |
| 71. | Hilliard | 2.2% | 37.8%(-35.6)#5 | 32.1%(-29.9)#71 |
| 72. | Royse City | 2.2% | 32.3%(-30.1)#3 | 32.1%(-29.9)#72 |
| 73. | South Farmingdale | 2.2% | 28.8%(-26.6)#3 | 32.1%(-29.9)#73 |
| 74. | New Providence Borough | 2.2% | 26.4%(-24.2)#8 | 32.1%(-29.9)#74 |
| 75. | Bridgetown | 2.2% | 37.8%(-35.6)#6 | 32.1%(-29.9)#75 |
| 76. | Glen Ridge Borough | 2.2% | 26.4%(-24.2)#9 | 32.1%(-29.9)#76 |
| 77. | Yorba Linda | 2.3% | 30.6%(-28.3)#10 | 32.1%(-29.8)#77 |
| 78. | North Attleborough | 2.3% | 27.2%(-24.9)#2 | 32.1%(-29.8)#78 |
| 79. | Camas | 2.3% | 24.1%(-21.8)#5 | 32.1%(-29.8)#79 |
| 80. | Ammon | 2.3% | 19.2%(-16.9)#2 | 32.1%(-29.8)#80 |
| 81. | Crossville | 2.3% | 33.4%(-31.1)#2 | 32.1%(-29.8)#81 |
| 82. | Cold Springs | 2.3% | 37.6%(-35.3)#1 | 32.1%(-29.8)#82 |
| 83. | Crafton Borough | 2.3% | 32.6%(-30.3)#5 | 32.1%(-29.8)#83 |
| 84. | Aurora | 2.3% | 30.3%(-28.0)#2 | 32.1%(-29.8)#84 |
| 85. | Mansfield | 2.4% | 32.3%(-29.9)#4 | 32.1%(-29.7)#85 |
| 86. | Glenview | 2.4% | 32.2%(-29.8)#4 | 32.1%(-29.7)#86 |
| 87. | American Fork | 2.4% | 14.4%(-12.0)#4 | 32.1%(-29.7)#87 |
| 88. | Shelbyville | 2.4% | 33.8%(-31.4)#2 | 32.1%(-29.7)#88 |
| 89. | Huntersville | 2.5% | 34.6%(-32.1)#4 | 32.1%(-29.6)#89 |
| 90. | Oakville | 2.5% | 30.2%(-27.7)#2 | 32.1%(-29.6)#90 |
| 91. | East Glenville | 2.5% | 28.8%(-26.3)#4 | 32.1%(-29.6)#91 |
| 92. | Vidor | 2.5% | 32.3%(-29.8)#5 | 32.1%(-29.6)#92 |
| 93. | Saratoga Springs | 2.6% | 14.4%(-11.8)#5 | 32.1%(-29.5)#93 |
| 94. | Park Ridge | 2.6% | 32.2%(-29.6)#5 | 32.1%(-29.5)#94 |
| 95. | Fair Oaks | 2.6% | 29.2%(-26.6)#3 | 32.1%(-29.5)#95 |
| 96. | Sun City Center | 2.6% | 37.7%(-35.1)#1 | 32.1%(-29.5)#96 |
| 97. | Newburyport | 2.6% | 27.2%(-24.6)#3 | 32.1%(-29.5)#97 |
| 98. | Fairview Park | 2.6% | 37.8%(-35.2)#7 | 32.1%(-29.5)#98 |
| 99. | Grain Valley | 2.6% | 30.2%(-27.6)#3 | 32.1%(-29.5)#99 |
| 100. | Wyoming | 2.6% | 24.7%(-22.1)#2 | 32.1%(-29.5)#100 |
Common Questions
What are the Top 10 Cities with the Lowest Percentage of Births to Unmarried Women in the United States?
Top 10 Cities with the Lowest Percentage of Births to Unmarried Women in the United States are:
#1
0.20%
#2
0.20%
#3
0.20%
#4
0.30%
#5
0.30%
#6
0.30%
#7
0.40%
#8
0.40%
#9
0.70%
#10
0.70%
What city has the Lowest Percentage of Births to Unmarried Women in the United States?
Daphne has the Lowest Percentage of Births to Unmarried Women in the United States with 0.20%.
What is the Percentage of Births to Unmarried Women in the United States?
Percentage of Births to Unmarried Women in the United States is 32.1%.