Cities with the Largest Mongolian Community in the United States
RELATED REPORTS & OPTIONS
Mongolian
United States
Compare Cities
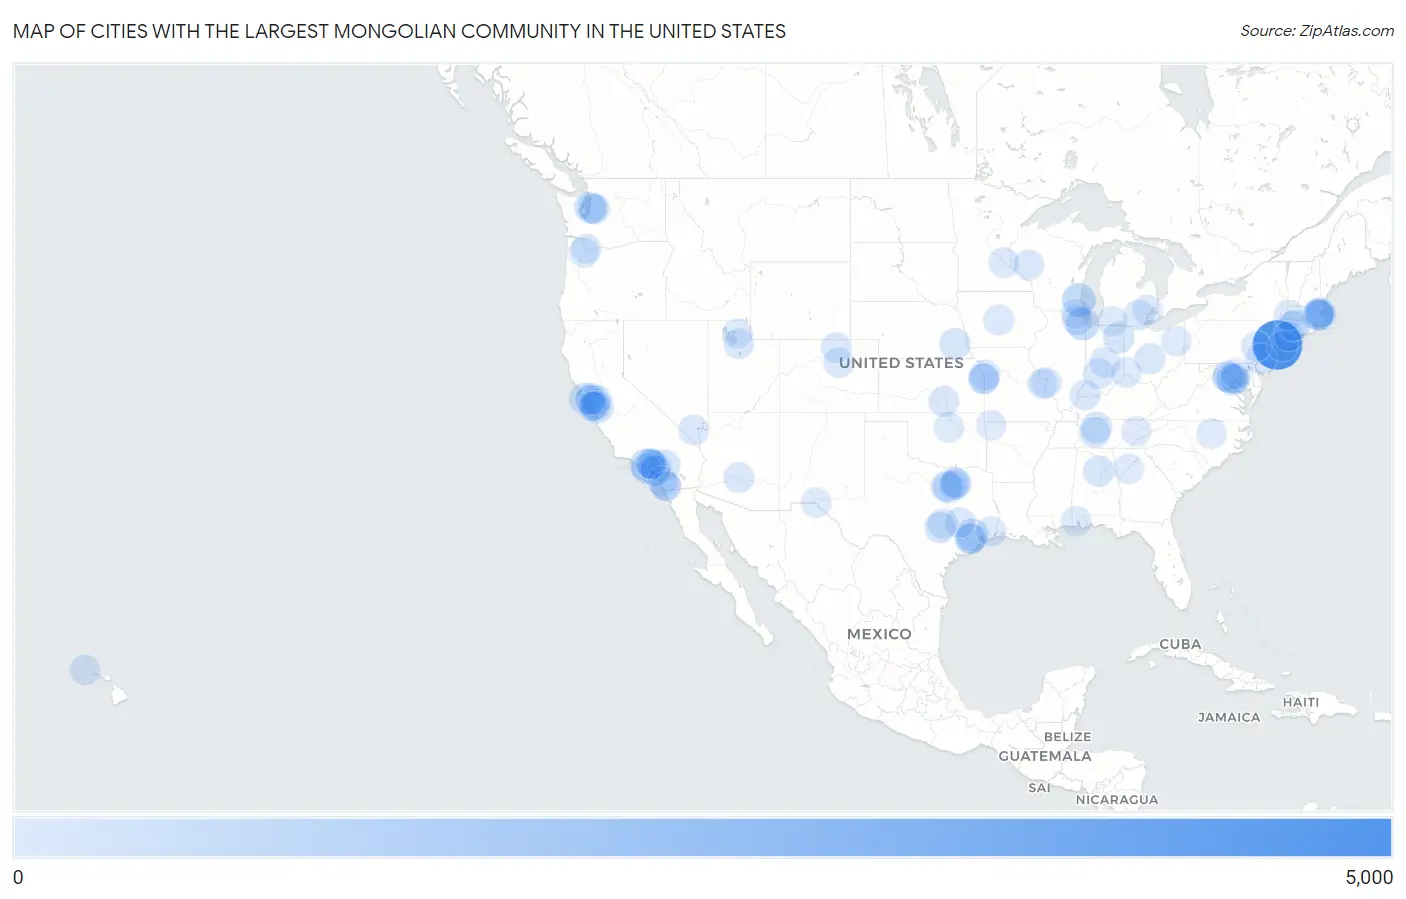
Map of Cities with the Largest Mongolian Community in the United States
0
5,000
Cities with the Largest Mongolian Community in the United States
| City | Mongolian | vs State | vs National | |
| 1. | New York | 4,009 | 5,296(75.70%)#1 | 38,751(10.35%)#1 |
| 2. | Milwaukee | 702 | 1,108(63.36%)#1 | 38,751(1.81%)#2 |
| 3. | Chicago | 668 | 1,708(39.11%)#1 | 38,751(1.72%)#3 |
| 4. | Los Angeles | 519 | 6,698(7.75%)#1 | 38,751(1.34%)#4 |
| 5. | Houston | 476 | 4,170(11.41%)#1 | 38,751(1.23%)#5 |
| 6. | San Francisco | 414 | 6,698(6.18%)#2 | 38,751(1.07%)#6 |
| 7. | San Jose | 381 | 6,698(5.69%)#3 | 38,751(0.98%)#7 |
| 8. | Seattle | 311 | 1,358(22.90%)#1 | 38,751(0.80%)#8 |
| 9. | Sienna | 299 | 4,170(7.17%)#2 | 38,751(0.77%)#9 |
| 10. | Fort Wayne | 295 | 970(30.41%)#1 | 38,751(0.76%)#10 |
| 11. | Lincoln | 290 | 300(96.67%)#1 | 38,751(0.75%)#11 |
| 12. | Nashville | 274 | 684(40.06%)#1 | 38,751(0.71%)#12 |
| 13. | Austin | 246 | 4,170(5.90%)#3 | 38,751(0.63%)#13 |
| 14. | Trussville | 243 | 440(55.23%)#1 | 38,751(0.63%)#14 |
| 15. | Oakland | 242 | 6,698(3.61%)#4 | 38,751(0.62%)#15 |
| 16. | Arlington | 242 | 4,170(5.80%)#4 | 38,751(0.62%)#16 |
| 17. | Newton | 240 | 1,157(20.74%)#1 | 38,751(0.62%)#17 |
| 18. | North Springfield | 237 | 1,388(17.07%)#1 | 38,751(0.61%)#18 |
| 19. | Philadelphia | 224 | 1,175(19.06%)#1 | 38,751(0.58%)#19 |
| 20. | Fort Worth | 218 | 4,170(5.23%)#5 | 38,751(0.56%)#20 |
| 21. | Yucaipa | 211 | 6,698(3.15%)#5 | 38,751(0.54%)#21 |
| 22. | San Diego | 201 | 6,698(3.00%)#6 | 38,751(0.52%)#22 |
| 23. | Stafford | 194 | 4,170(4.65%)#6 | 38,751(0.50%)#23 |
| 24. | Franklin | 179 | 684(26.17%)#2 | 38,751(0.46%)#24 |
| 25. | Columbus | 176 | 834(21.10%)#1 | 38,751(0.45%)#25 |
| 26. | Ames | 174 | 357(48.74%)#1 | 38,751(0.45%)#26 |
| 27. | Bloomington | 172 | 970(17.73%)#2 | 38,751(0.44%)#27 |
| 28. | Chandler | 169 | 401(42.14%)#1 | 38,751(0.44%)#28 |
| 29. | St Louis | 166 | 523(31.74%)#1 | 38,751(0.43%)#29 |
| 30. | Wichita | 163 | 509(32.02%)#1 | 38,751(0.42%)#30 |
| 31. | Irvine | 163 | 6,698(2.43%)#7 | 38,751(0.42%)#31 |
| 32. | Indianapolis | 160 | 970(16.49%)#3 | 38,751(0.41%)#32 |
| 33. | Mcnair | 154 | 1,388(11.10%)#2 | 38,751(0.40%)#33 |
| 34. | Tustin | 146 | 6,698(2.18%)#8 | 38,751(0.38%)#34 |
| 35. | Eau Claire | 146 | 1,108(13.18%)#2 | 38,751(0.38%)#35 |
| 36. | Sugar Land | 142 | 4,170(3.41%)#7 | 38,751(0.37%)#36 |
| 37. | Fort Lee Borough | 142 | 802(17.71%)#1 | 38,751(0.37%)#37 |
| 38. | Garland | 136 | 4,170(3.26%)#8 | 38,751(0.35%)#38 |
| 39. | Fort Collins | 134 | 475(28.21%)#1 | 38,751(0.35%)#39 |
| 40. | Melody Hill | 133 | 970(13.71%)#4 | 38,751(0.34%)#40 |
| 41. | Leawood | 131 | 509(25.74%)#2 | 38,751(0.34%)#41 |
| 42. | Boston | 128 | 1,157(11.06%)#2 | 38,751(0.33%)#42 |
| 43. | Kansas City | 127 | 523(24.28%)#2 | 38,751(0.33%)#43 |
| 44. | Cambridge | 127 | 1,157(10.98%)#3 | 38,751(0.33%)#44 |
| 45. | Chino Hills | 127 | 6,698(1.90%)#9 | 38,751(0.33%)#45 |
| 46. | Brookline | 127 | 1,157(10.98%)#4 | 38,751(0.33%)#46 |
| 47. | Ashburn | 127 | 1,388(9.15%)#3 | 38,751(0.33%)#47 |
| 48. | Fremont | 126 | 6,698(1.88%)#10 | 38,751(0.33%)#48 |
| 49. | West Hartford | 122 | 527(23.15%)#1 | 38,751(0.31%)#49 |
| 50. | Ann Arbor | 121 | 687(17.61%)#1 | 38,751(0.31%)#50 |
| 51. | Minneapolis | 119 | 561(21.21%)#1 | 38,751(0.31%)#51 |
| 52. | Hewlett | 119 | 5,296(2.25%)#2 | 38,751(0.31%)#52 |
| 53. | Henderson | 117 | 312(37.50%)#1 | 38,751(0.30%)#53 |
| 54. | Alhambra | 116 | 6,698(1.73%)#11 | 38,751(0.30%)#54 |
| 55. | Urban Honolulu | 114 | 193(59.07%)#1 | 38,751(0.29%)#55 |
| 56. | Denver | 111 | 475(23.37%)#2 | 38,751(0.29%)#56 |
| 57. | Sammamish | 111 | 1,358(8.17%)#2 | 38,751(0.29%)#57 |
| 58. | Salt Lake City | 110 | 426(25.82%)#1 | 38,751(0.28%)#58 |
| 59. | College Station | 110 | 4,170(2.64%)#9 | 38,751(0.28%)#59 |
| 60. | Dublin | 109 | 6,698(1.63%)#12 | 38,751(0.28%)#60 |
| 61. | Beaumont | 107 | 4,170(2.57%)#10 | 38,751(0.28%)#61 |
| 62. | Brisbane | 107 | 6,698(1.60%)#13 | 38,751(0.28%)#62 |
| 63. | Torrance | 105 | 6,698(1.57%)#14 | 38,751(0.27%)#63 |
| 64. | Bellevue | 104 | 1,358(7.66%)#3 | 38,751(0.27%)#64 |
| 65. | Schaumburg | 102 | 1,708(5.97%)#2 | 38,751(0.26%)#65 |
| 66. | Stillwater | 102 | 259(39.38%)#1 | 38,751(0.26%)#66 |
| 67. | Atlanta | 101 | 955(10.58%)#1 | 38,751(0.26%)#67 |
| 68. | Mobile | 101 | 440(22.95%)#2 | 38,751(0.26%)#68 |
| 69. | Hutto | 101 | 4,170(2.42%)#11 | 38,751(0.26%)#69 |
| 70. | Lee | 101 | 1,157(8.73%)#5 | 38,751(0.26%)#70 |
| 71. | Oakton | 97 | 1,388(6.99%)#4 | 38,751(0.25%)#71 |
| 72. | North Ogden | 95 | 426(22.30%)#2 | 38,751(0.25%)#72 |
| 73. | White Oak | 95 | 834(11.39%)#2 | 38,751(0.25%)#73 |
| 74. | Overland Park | 94 | 509(18.47%)#3 | 38,751(0.24%)#74 |
| 75. | Encinitas | 92 | 6,698(1.37%)#15 | 38,751(0.24%)#75 |
| 76. | Richardson | 90 | 4,170(2.16%)#12 | 38,751(0.23%)#76 |
| 77. | West Covina | 90 | 6,698(1.34%)#16 | 38,751(0.23%)#77 |
| 78. | Alliance | 90 | 834(10.79%)#3 | 38,751(0.23%)#78 |
| 79. | Temple City | 89 | 6,698(1.33%)#17 | 38,751(0.23%)#79 |
| 80. | Round Lake | 89 | 1,708(5.21%)#3 | 38,751(0.23%)#80 |
| 81. | Columbia | 88 | 740(11.89%)#1 | 38,751(0.23%)#81 |
| 82. | Knoxville | 87 | 684(12.72%)#3 | 38,751(0.22%)#82 |
| 83. | Sunnyvale | 86 | 6,698(1.28%)#18 | 38,751(0.22%)#83 |
| 84. | Manchester | 86 | 523(16.44%)#3 | 38,751(0.22%)#84 |
| 85. | Fox Chapel Borough | 85 | 1,175(7.23%)#2 | 38,751(0.22%)#85 |
| 86. | Palo Alto | 84 | 6,698(1.25%)#19 | 38,751(0.22%)#86 |
| 87. | Bristol | 83 | 527(15.75%)#2 | 38,751(0.21%)#87 |
| 88. | Dallas | 81 | 4,170(1.94%)#13 | 38,751(0.21%)#88 |
| 89. | Washington | 80 | 80(100.00%)#1 | 38,751(0.21%)#89 |
| 90. | Beaverton | 80 | 307(26.06%)#1 | 38,751(0.21%)#90 |
| 91. | Raleigh | 79 | 615(12.85%)#1 | 38,751(0.20%)#91 |
| 92. | Troy | 79 | 687(11.50%)#2 | 38,751(0.20%)#92 |
| 93. | El Paso | 78 | 4,170(1.87%)#14 | 38,751(0.20%)#93 |
| 94. | Fullerton | 78 | 1,175(6.64%)#3 | 38,751(0.20%)#94 |
| 95. | Rogers | 77 | 175(44.00%)#1 | 38,751(0.20%)#95 |
| 96. | Vancouver | 76 | 1,358(5.60%)#4 | 38,751(0.20%)#96 |
| 97. | Bridgeport | 76 | 527(14.42%)#3 | 38,751(0.20%)#97 |
| 98. | El Cajon | 76 | 6,698(1.13%)#20 | 38,751(0.20%)#98 |
| 99. | Malden | 76 | 1,157(6.57%)#6 | 38,751(0.20%)#99 |
| 100. | Three Rivers | 76 | 687(11.06%)#3 | 38,751(0.20%)#100 |
Common Questions
What are the Top 10 Cities with the Largest Mongolian Community in the United States?
Top 10 Cities with the Largest Mongolian Community in the United States are:
What city has the Largest Mongolian Community in the United States?
New York has the Largest Mongolian Community in the United States with 4,009.
What is the Total Mongolian Population in the United States?
Total Mongolian Population in the United States is 38,751.