Cities with the Largest Bulgarian Community in the United States
RELATED REPORTS & OPTIONS
Bulgarian
United States
Compare Cities
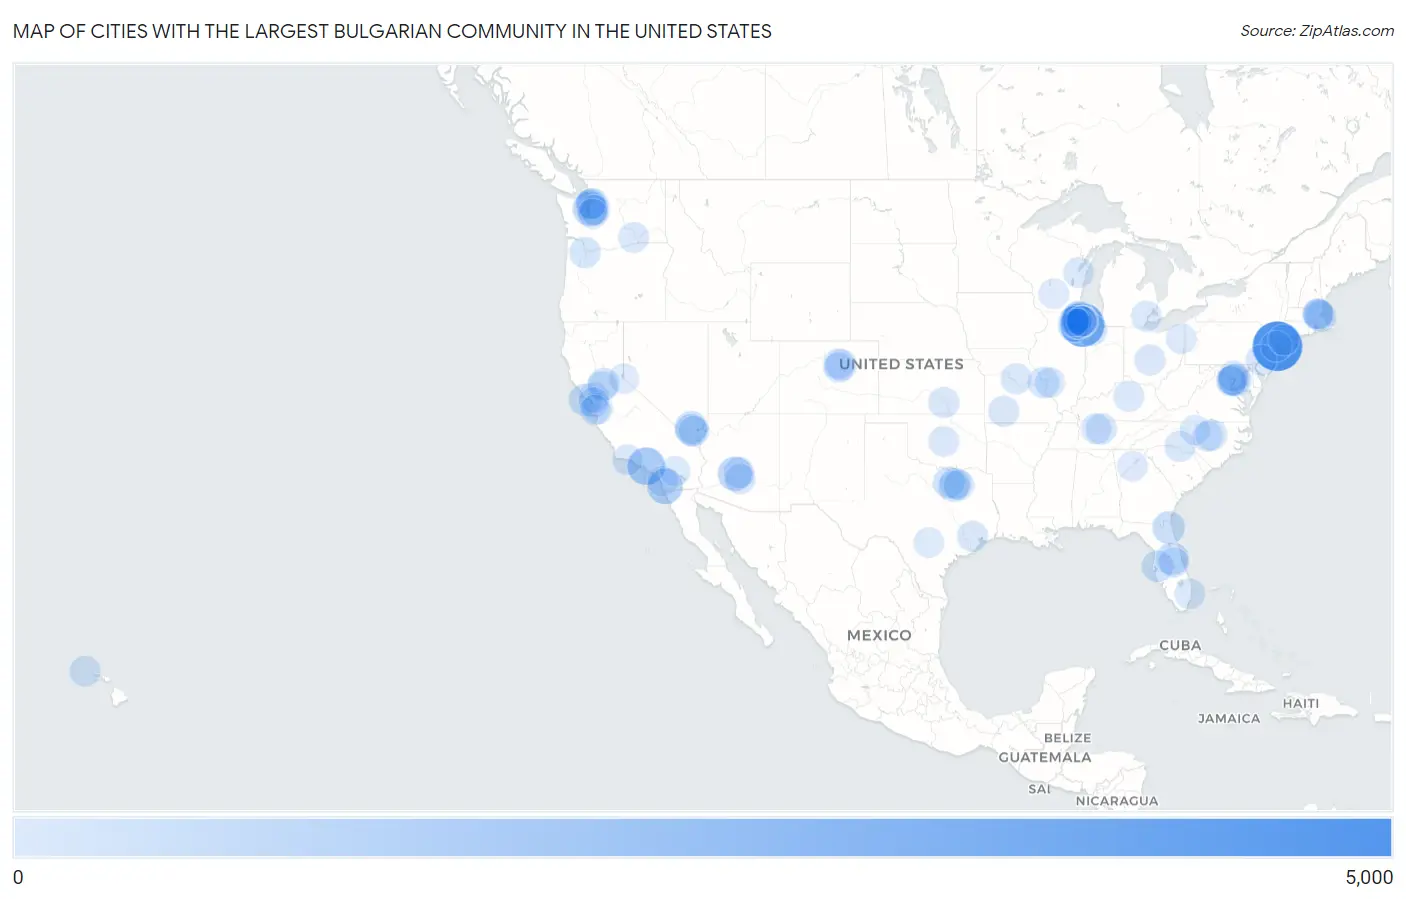
Map of Cities with the Largest Bulgarian Community in the United States
0
5,000
Cities with the Largest Bulgarian Community in the United States
| City | Bulgarian | vs State | vs National | |
| 1. | New York | 4,053 | 6,393(63.40%)#1 | 108,637(3.73%)#1 |
| 2. | Chicago | 2,837 | 17,106(16.58%)#1 | 108,637(2.61%)#2 |
| 3. | Los Angeles | 1,594 | 12,943(12.32%)#1 | 108,637(1.47%)#3 |
| 4. | San Diego | 1,183 | 12,943(9.14%)#2 | 108,637(1.09%)#4 |
| 5. | Arlington Heights | 1,174 | 17,106(6.86%)#2 | 108,637(1.08%)#5 |
| 6. | Mount Prospect | 1,041 | 17,106(6.09%)#3 | 108,637(0.96%)#6 |
| 7. | Seattle | 962 | 4,563(21.08%)#1 | 108,637(0.89%)#7 |
| 8. | Phoenix | 935 | 2,475(37.78%)#1 | 108,637(0.86%)#8 |
| 9. | Schaumburg | 794 | 17,106(4.64%)#4 | 108,637(0.73%)#9 |
| 10. | Palatine | 689 | 17,106(4.03%)#5 | 108,637(0.63%)#10 |
| 11. | Elk Grove Village | 648 | 17,106(3.79%)#6 | 108,637(0.60%)#11 |
| 12. | Las Vegas | 631 | 1,827(34.54%)#1 | 108,637(0.58%)#12 |
| 13. | Jacksonville | 612 | 8,863(6.91%)#1 | 108,637(0.56%)#13 |
| 14. | Washington | 606 | 606(100.00%)#1 | 108,637(0.56%)#14 |
| 15. | Orlando | 586 | 8,863(6.61%)#2 | 108,637(0.54%)#15 |
| 16. | San Francisco | 564 | 12,943(4.36%)#3 | 108,637(0.52%)#16 |
| 17. | Buffalo Grove | 564 | 17,106(3.30%)#7 | 108,637(0.52%)#17 |
| 18. | Des Plaines | 536 | 17,106(3.13%)#8 | 108,637(0.49%)#18 |
| 19. | Roselle | 534 | 17,106(3.12%)#9 | 108,637(0.49%)#19 |
| 20. | Spring Valley | 462 | 1,827(25.29%)#2 | 108,637(0.43%)#20 |
| 21. | Tampa | 460 | 8,863(5.19%)#3 | 108,637(0.42%)#21 |
| 22. | Naperville | 455 | 17,106(2.66%)#10 | 108,637(0.42%)#22 |
| 23. | Chesterton | 445 | 1,684(26.43%)#1 | 108,637(0.41%)#23 |
| 24. | Lantana | 390 | 4,287(9.10%)#1 | 108,637(0.36%)#24 |
| 25. | Antelope | 370 | 12,943(2.86%)#4 | 108,637(0.34%)#25 |
| 26. | Mill Creek | 370 | 4,563(8.11%)#2 | 108,637(0.34%)#26 |
| 27. | Rolling Meadows | 359 | 17,106(2.10%)#11 | 108,637(0.33%)#27 |
| 28. | Dallas | 357 | 4,287(8.33%)#2 | 108,637(0.33%)#28 |
| 29. | Richardson | 355 | 4,287(8.28%)#3 | 108,637(0.33%)#29 |
| 30. | Maryland Heights | 343 | 2,061(16.64%)#1 | 108,637(0.32%)#30 |
| 31. | Arlington | 336 | 3,176(10.58%)#1 | 108,637(0.31%)#31 |
| 32. | Raleigh | 326 | 2,393(13.62%)#1 | 108,637(0.30%)#32 |
| 33. | Aurora | 324 | 17,106(1.89%)#12 | 108,637(0.30%)#33 |
| 34. | Portland | 322 | 1,304(24.69%)#1 | 108,637(0.30%)#34 |
| 35. | Hoffman Estates | 314 | 17,106(1.84%)#13 | 108,637(0.29%)#35 |
| 36. | Urban Honolulu | 310 | 483(64.18%)#1 | 108,637(0.29%)#36 |
| 37. | Mundelein | 302 | 17,106(1.77%)#14 | 108,637(0.28%)#37 |
| 38. | Columbia | 299 | 2,061(14.51%)#2 | 108,637(0.28%)#38 |
| 39. | Charlotte | 297 | 2,393(12.41%)#2 | 108,637(0.27%)#39 |
| 40. | Skokie | 296 | 17,106(1.73%)#15 | 108,637(0.27%)#40 |
| 41. | Philadelphia | 291 | 3,783(7.69%)#1 | 108,637(0.27%)#41 |
| 42. | Jersey City | 289 | 3,657(7.90%)#1 | 108,637(0.27%)#42 |
| 43. | Stamford | 288 | 1,057(27.25%)#1 | 108,637(0.27%)#43 |
| 44. | Aspen Hill | 280 | 2,417(11.58%)#1 | 108,637(0.26%)#44 |
| 45. | Lebanon | 280 | 1,013(27.64%)#1 | 108,637(0.26%)#45 |
| 46. | Columbus | 279 | 3,050(9.15%)#1 | 108,637(0.26%)#46 |
| 47. | Aurora | 278 | 1,944(14.30%)#1 | 108,637(0.26%)#47 |
| 48. | Boston | 276 | 4,743(5.82%)#1 | 108,637(0.25%)#48 |
| 49. | Houston | 273 | 4,287(6.37%)#4 | 108,637(0.25%)#49 |
| 50. | Bellevue | 264 | 4,563(5.79%)#3 | 108,637(0.24%)#50 |
| 51. | Rockwall | 264 | 4,287(6.16%)#5 | 108,637(0.24%)#51 |
| 52. | Henderson | 263 | 1,827(14.40%)#3 | 108,637(0.24%)#52 |
| 53. | Somerville | 261 | 4,743(5.50%)#2 | 108,637(0.24%)#53 |
| 54. | Springfield | 260 | 2,061(12.62%)#3 | 108,637(0.24%)#54 |
| 55. | Wichita | 258 | 657(39.27%)#1 | 108,637(0.24%)#55 |
| 56. | Cambridge | 256 | 4,743(5.40%)#3 | 108,637(0.24%)#56 |
| 57. | San Jose | 253 | 12,943(1.95%)#5 | 108,637(0.23%)#57 |
| 58. | Scottsdale | 248 | 2,475(10.02%)#2 | 108,637(0.23%)#58 |
| 59. | Santa Barbara | 247 | 12,943(1.91%)#6 | 108,637(0.23%)#59 |
| 60. | Nashville | 240 | 1,013(23.69%)#2 | 108,637(0.22%)#60 |
| 61. | Walnut Creek | 239 | 12,943(1.85%)#7 | 108,637(0.22%)#61 |
| 62. | Lexington | 236 | 538(43.87%)#1 | 108,637(0.22%)#62 |
| 63. | Green Bay | 230 | 1,638(14.04%)#1 | 108,637(0.21%)#63 |
| 64. | Denver | 227 | 1,944(11.68%)#2 | 108,637(0.21%)#64 |
| 65. | Richland | 227 | 4,563(4.97%)#4 | 108,637(0.21%)#65 |
| 66. | Oklahoma City | 222 | 521(42.61%)#1 | 108,637(0.20%)#66 |
| 67. | Gilbert | 221 | 2,475(8.93%)#3 | 108,637(0.20%)#67 |
| 68. | Morton Grove | 220 | 17,106(1.29%)#16 | 108,637(0.20%)#68 |
| 69. | Streamwood | 215 | 17,106(1.26%)#17 | 108,637(0.20%)#69 |
| 70. | Lake Zurich | 215 | 17,106(1.26%)#18 | 108,637(0.20%)#70 |
| 71. | Lynnwood | 214 | 4,563(4.69%)#5 | 108,637(0.20%)#71 |
| 72. | Pompano Beach | 212 | 8,863(2.39%)#4 | 108,637(0.20%)#72 |
| 73. | Idylwood | 205 | 3,176(6.45%)#2 | 108,637(0.19%)#73 |
| 74. | Apex | 199 | 2,393(8.32%)#3 | 108,637(0.18%)#74 |
| 75. | Dearborn Heights | 199 | 3,044(6.54%)#1 | 108,637(0.18%)#75 |
| 76. | Sacramento | 193 | 12,943(1.49%)#8 | 108,637(0.18%)#76 |
| 77. | Hayward | 192 | 12,943(1.48%)#9 | 108,637(0.18%)#77 |
| 78. | Centennial | 190 | 1,944(9.77%)#3 | 108,637(0.17%)#78 |
| 79. | Evanston | 190 | 17,106(1.11%)#19 | 108,637(0.17%)#79 |
| 80. | Niles | 190 | 17,106(1.11%)#20 | 108,637(0.17%)#80 |
| 81. | Greensboro | 188 | 2,393(7.86%)#4 | 108,637(0.17%)#81 |
| 82. | Carlsbad | 188 | 12,943(1.45%)#10 | 108,637(0.17%)#82 |
| 83. | Martha Lake | 181 | 4,563(3.97%)#6 | 108,637(0.17%)#83 |
| 84. | Wind Gap Borough | 181 | 3,783(4.78%)#2 | 108,637(0.17%)#84 |
| 85. | Austintown | 180 | 3,050(5.90%)#2 | 108,637(0.17%)#85 |
| 86. | Lombard | 178 | 17,106(1.04%)#21 | 108,637(0.16%)#86 |
| 87. | Palm Desert | 177 | 12,943(1.37%)#11 | 108,637(0.16%)#87 |
| 88. | Lexington | 177 | 4,743(3.73%)#4 | 108,637(0.16%)#88 |
| 89. | St Cloud | 175 | 8,863(1.97%)#5 | 108,637(0.16%)#89 |
| 90. | Johns Creek | 171 | 2,219(7.71%)#1 | 108,637(0.16%)#90 |
| 91. | Carol Stream | 171 | 17,106(1.00%)#22 | 108,637(0.16%)#91 |
| 92. | South Lake Tahoe | 167 | 12,943(1.29%)#12 | 108,637(0.15%)#92 |
| 93. | San Antonio | 164 | 4,287(3.83%)#6 | 108,637(0.15%)#93 |
| 94. | Glen Carbon | 164 | 17,106(0.96%)#23 | 108,637(0.15%)#94 |
| 95. | Los Gatos | 162 | 12,943(1.25%)#13 | 108,637(0.15%)#95 |
| 96. | Woodburn | 161 | 3,176(5.07%)#3 | 108,637(0.15%)#96 |
| 97. | Sammamish | 159 | 4,563(3.48%)#7 | 108,637(0.15%)#97 |
| 98. | Kent | 158 | 4,563(3.46%)#8 | 108,637(0.15%)#98 |
| 99. | Baraboo | 158 | 1,638(9.65%)#2 | 108,637(0.15%)#99 |
| 100. | Elgin | 157 | 17,106(0.92%)#24 | 108,637(0.14%)#100 |
Common Questions
What are the Top 10 Cities with the Largest Bulgarian Community in the United States?
Top 10 Cities with the Largest Bulgarian Community in the United States are:
#1
4,053
#2
2,837
#3
1,594
#4
1,183
#5
1,174
#6
1,041
#7
962
#8
935
#9
794
#10
689
What city has the Largest Bulgarian Community in the United States?
New York has the Largest Bulgarian Community in the United States with 4,053.
What is the Total Bulgarian Population in the United States?
Total Bulgarian Population in the United States is 108,637.