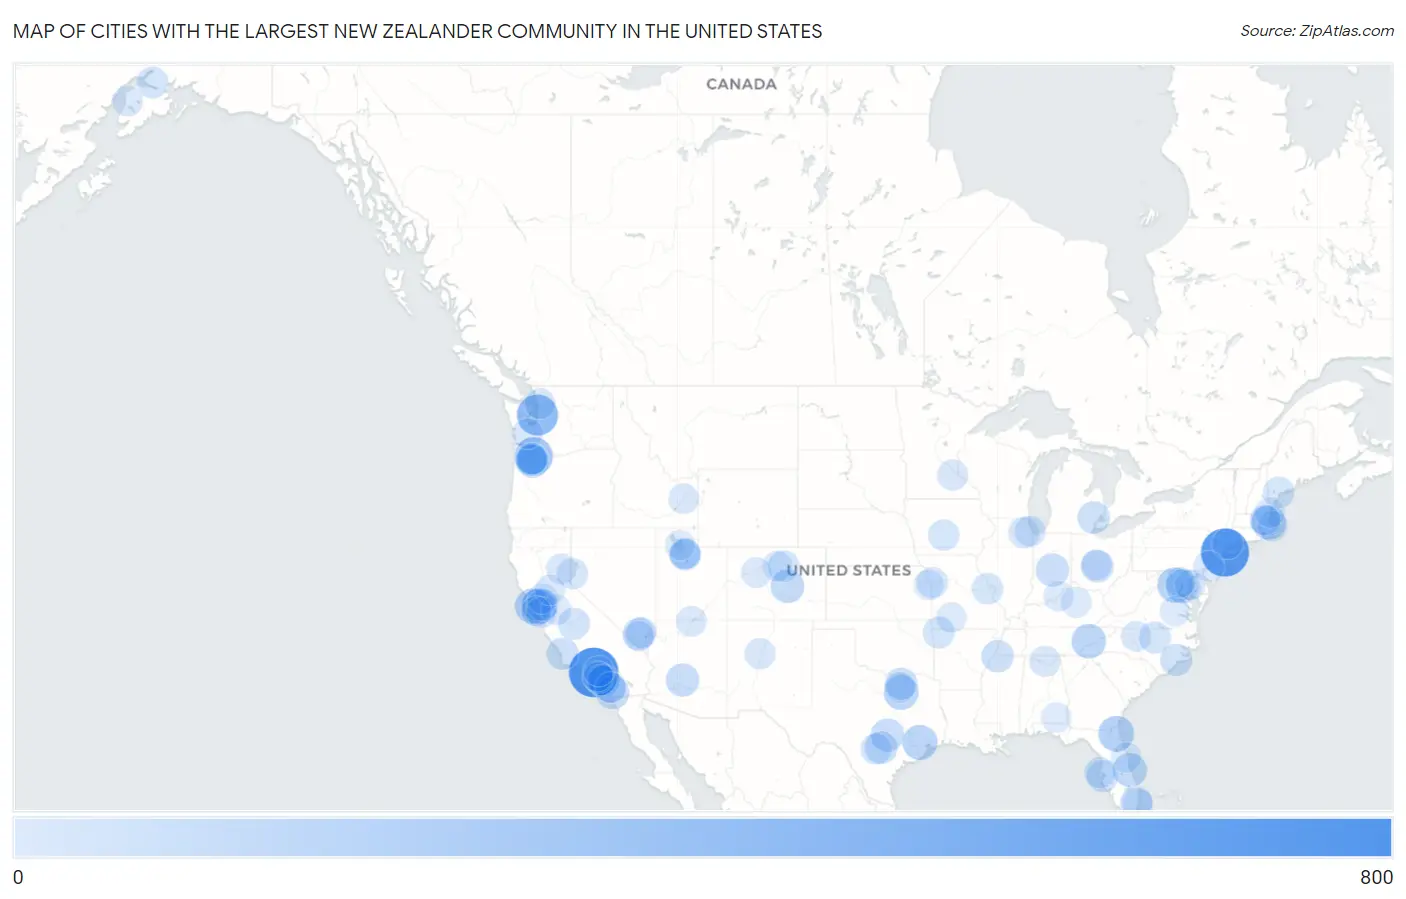
Cities with the Largest New Zealander Community in the United States
RELATED REPORTS & OPTIONS
New Zealander
United States
Compare Cities
Map of Cities with the Largest New Zealander Community in the United States
0
800
Cities with the Largest New Zealander Community in the United States
| City | New Zealander | vs State | vs National | |
| 1. | Los Angeles | 723 | 3,987(18.13%)#1 | 20,873(3.46%)#1 |
| 2. | New York | 669 | 912(73.36%)#1 | 20,873(3.21%)#2 |
| 3. | Seattle | 416 | 1,414(29.42%)#1 | 20,873(1.99%)#3 |
| 4. | Vancouver | 315 | 1,414(22.28%)#2 | 20,873(1.51%)#4 |
| 5. | Jacksonville | 229 | 1,441(15.89%)#1 | 20,873(1.10%)#5 |
| 6. | Oakland | 223 | 3,987(5.59%)#2 | 20,873(1.07%)#6 |
| 7. | Brambleton | 212 | 525(40.38%)#1 | 20,873(1.02%)#7 |
| 8. | San Francisco | 208 | 3,987(5.22%)#3 | 20,873(1.00%)#8 |
| 9. | Houston | 204 | 1,510(13.51%)#1 | 20,873(0.98%)#9 |
| 10. | Dallas | 193 | 1,510(12.78%)#2 | 20,873(0.92%)#10 |
| 11. | Pigeon Forge | 185 | 362(51.10%)#1 | 20,873(0.89%)#11 |
| 12. | Boston | 174 | 792(21.97%)#1 | 20,873(0.83%)#12 |
| 13. | Melbourne | 168 | 1,441(11.66%)#2 | 20,873(0.80%)#13 |
| 14. | Washington | 162 | 162(100.00%)#1 | 20,873(0.78%)#14 |
| 15. | Colorado Springs | 151 | 794(19.02%)#1 | 20,873(0.72%)#15 |
| 16. | San Diego | 149 | 3,987(3.74%)#4 | 20,873(0.71%)#16 |
| 17. | Phoenix | 143 | 399(35.84%)#1 | 20,873(0.69%)#17 |
| 18. | Austin | 139 | 1,510(9.21%)#3 | 20,873(0.67%)#18 |
| 19. | Indianapolis | 136 | 289(47.06%)#1 | 20,873(0.65%)#19 |
| 20. | Lake Oswego | 131 | 766(17.10%)#1 | 20,873(0.63%)#20 |
| 21. | Cibolo | 118 | 1,510(7.81%)#4 | 20,873(0.57%)#21 |
| 22. | Southaven | 113 | 164(68.90%)#1 | 20,873(0.54%)#22 |
| 23. | Bloomfield Hills | 113 | 277(40.79%)#1 | 20,873(0.54%)#23 |
| 24. | Columbus | 109 | 474(23.00%)#1 | 20,873(0.52%)#24 |
| 25. | Grover Beach | 107 | 3,987(2.68%)#5 | 20,873(0.51%)#25 |
| 26. | Celina | 106 | 1,510(7.02%)#5 | 20,873(0.51%)#26 |
| 27. | Jacksonville | 104 | 562(18.51%)#1 | 20,873(0.50%)#27 |
| 28. | Berkeley | 101 | 3,987(2.53%)#6 | 20,873(0.48%)#28 |
| 29. | Broadview Park | 100 | 1,441(6.94%)#3 | 20,873(0.48%)#29 |
| 30. | Las Vegas | 97 | 459(21.13%)#1 | 20,873(0.46%)#30 |
| 31. | Cedar Mill | 94 | 766(12.27%)#2 | 20,873(0.45%)#31 |
| 32. | St Petersburg | 93 | 1,441(6.45%)#4 | 20,873(0.45%)#32 |
| 33. | Fresno | 91 | 3,987(2.28%)#7 | 20,873(0.44%)#33 |
| 34. | Durham | 91 | 562(16.19%)#2 | 20,873(0.44%)#34 |
| 35. | Beaverton | 89 | 766(11.62%)#3 | 20,873(0.43%)#35 |
| 36. | Rogers | 89 | 109(81.65%)#1 | 20,873(0.43%)#36 |
| 37. | Laguna Niguel | 88 | 3,987(2.21%)#8 | 20,873(0.42%)#37 |
| 38. | Anchorage | 87 | 163(53.37%)#1 | 20,873(0.42%)#38 |
| 39. | Broomfield | 87 | 794(10.96%)#2 | 20,873(0.42%)#39 |
| 40. | Mission Viejo | 83 | 3,987(2.08%)#9 | 20,873(0.40%)#40 |
| 41. | Slippery Rock Borough | 83 | 516(16.09%)#1 | 20,873(0.40%)#41 |
| 42. | Yarmouth | 80 | 168(47.62%)#1 | 20,873(0.38%)#42 |
| 43. | Taylorsville | 79 | 590(13.39%)#1 | 20,873(0.38%)#43 |
| 44. | Alamo | 78 | 3,987(1.96%)#10 | 20,873(0.37%)#44 |
| 45. | Dardenne Prairie | 78 | 379(20.58%)#1 | 20,873(0.37%)#45 |
| 46. | San Antonio | 76 | 1,510(5.03%)#6 | 20,873(0.36%)#46 |
| 47. | Clearwater | 74 | 1,441(5.14%)#5 | 20,873(0.35%)#47 |
| 48. | Clive | 72 | 127(56.69%)#1 | 20,873(0.34%)#48 |
| 49. | Portland | 71 | 766(9.27%)#4 | 20,873(0.34%)#49 |
| 50. | Naperville | 71 | 406(17.49%)#1 | 20,873(0.34%)#50 |
| 51. | Chicago | 70 | 406(17.24%)#2 | 20,873(0.34%)#51 |
| 52. | Kansas City | 69 | 379(18.21%)#2 | 20,873(0.33%)#52 |
| 53. | Reno | 68 | 459(14.81%)#2 | 20,873(0.33%)#53 |
| 54. | South Jordan | 68 | 590(11.53%)#2 | 20,873(0.33%)#54 |
| 55. | Albuquerque | 67 | 126(53.17%)#1 | 20,873(0.32%)#55 |
| 56. | San Marcos | 67 | 3,987(1.68%)#11 | 20,873(0.32%)#56 |
| 57. | Apple Valley | 67 | 171(39.18%)#1 | 20,873(0.32%)#57 |
| 58. | Ossining | 67 | 912(7.35%)#2 | 20,873(0.32%)#58 |
| 59. | Carlsbad | 65 | 3,987(1.63%)#12 | 20,873(0.31%)#59 |
| 60. | Huntsville | 63 | 178(35.39%)#1 | 20,873(0.30%)#60 |
| 61. | Cambridge | 62 | 792(7.83%)#2 | 20,873(0.30%)#61 |
| 62. | Arlington | 62 | 1,414(4.38%)#3 | 20,873(0.30%)#62 |
| 63. | Hollywood | 60 | 1,441(4.16%)#6 | 20,873(0.29%)#63 |
| 64. | Mountain View | 55 | 3,987(1.38%)#13 | 20,873(0.26%)#64 |
| 65. | Philadelphia | 54 | 516(10.47%)#2 | 20,873(0.26%)#65 |
| 66. | North Las Vegas | 54 | 459(11.76%)#3 | 20,873(0.26%)#66 |
| 67. | Upper Arlington | 51 | 474(10.76%)#2 | 20,873(0.24%)#67 |
| 68. | Eastern Goleta Valley | 51 | 3,987(1.28%)#14 | 20,873(0.24%)#68 |
| 69. | Page | 51 | 399(12.78%)#2 | 20,873(0.24%)#69 |
| 70. | Fords Prairie | 51 | 1,414(3.61%)#4 | 20,873(0.24%)#70 |
| 71. | Winston Salem | 50 | 562(8.90%)#3 | 20,873(0.24%)#71 |
| 72. | Huntington Beach | 50 | 3,987(1.25%)#15 | 20,873(0.24%)#72 |
| 73. | Kalifornsky | 50 | 163(30.67%)#2 | 20,873(0.24%)#73 |
| 74. | Gypsum | 50 | 794(6.30%)#3 | 20,873(0.24%)#74 |
| 75. | Marshfield | 50 | 792(6.31%)#3 | 20,873(0.24%)#75 |
| 76. | Cromberg | 50 | 3,987(1.25%)#16 | 20,873(0.24%)#76 |
| 77. | Idaho Falls | 49 | 247(19.84%)#1 | 20,873(0.23%)#77 |
| 78. | Naval Academy | 49 | 293(16.72%)#1 | 20,873(0.23%)#78 |
| 79. | Lexington | 48 | 189(25.40%)#1 | 20,873(0.23%)#79 |
| 80. | Modesto | 48 | 3,987(1.20%)#17 | 20,873(0.23%)#80 |
| 81. | Frisco | 48 | 1,510(3.18%)#7 | 20,873(0.23%)#81 |
| 82. | Newport Beach | 48 | 3,987(1.20%)#18 | 20,873(0.23%)#82 |
| 83. | Jeffersonville | 48 | 289(16.61%)#2 | 20,873(0.23%)#83 |
| 84. | Springfield | 47 | 379(12.40%)#3 | 20,873(0.23%)#84 |
| 85. | Fairfield | 47 | 3,987(1.18%)#19 | 20,873(0.23%)#85 |
| 86. | Edgewater | 47 | 1,441(3.26%)#7 | 20,873(0.23%)#86 |
| 87. | Newburyport | 47 | 792(5.93%)#4 | 20,873(0.23%)#87 |
| 88. | Richmond | 46 | 525(8.76%)#2 | 20,873(0.22%)#88 |
| 89. | Lexington | 46 | 792(5.81%)#5 | 20,873(0.22%)#89 |
| 90. | Long Beach | 45 | 3,987(1.13%)#20 | 20,873(0.22%)#90 |
| 91. | Spring Valley | 45 | 459(9.80%)#4 | 20,873(0.22%)#91 |
| 92. | Rio Linda | 45 | 3,987(1.13%)#21 | 20,873(0.22%)#92 |
| 93. | Rockville | 44 | 293(15.02%)#2 | 20,873(0.21%)#93 |
| 94. | East San Gabriel | 44 | 3,987(1.10%)#22 | 20,873(0.21%)#94 |
| 95. | Nederland | 44 | 794(5.54%)#4 | 20,873(0.21%)#95 |
| 96. | West Valley City | 43 | 590(7.29%)#3 | 20,873(0.21%)#96 |
| 97. | Lenexa | 43 | 106(40.57%)#1 | 20,873(0.21%)#97 |
| 98. | Enterprise | 43 | 178(24.16%)#2 | 20,873(0.21%)#98 |
| 99. | Hooper | 43 | 590(7.29%)#4 | 20,873(0.21%)#99 |
| 100. | El Granada | 43 | 3,987(1.08%)#23 | 20,873(0.21%)#100 |
Common Questions
What are the Top 10 Cities with the Largest New Zealander Community in the United States?
Top 10 Cities with the Largest New Zealander Community in the United States are:
#1
723
#2
669
#3
416
#4
315
#5
229
#6
223
#7
212
#8
208
#9
204
#10
193
What city has the Largest New Zealander Community in the United States?
Los Angeles has the Largest New Zealander Community in the United States with 723.
What is the Total New Zealander Population in the United States?
Total New Zealander Population in the United States is 20,873.