Belville, NC Map & Demographics
Belville Map
Belville Overview
$34,190
PER CAPITA INCOME
$82,059
AVG FAMILY INCOME
$79,875
AVG HOUSEHOLD INCOME
30.2%
WAGE / INCOME GAP [ % ]
69.8¢/ $1
WAGE / INCOME GAP [ $ ]
0.30
INEQUALITY / GINI INDEX
3,380
TOTAL POPULATION
1,750
MALE POPULATION
1,630
FEMALE POPULATION
107.36
MALES / 100 FEMALES
93.14
FEMALES / 100 MALES
33.4
MEDIAN AGE
3.2
AVG FAMILY SIZE
2.7
AVG HOUSEHOLD SIZE
1,964
LABOR FORCE [ PEOPLE ]
68.6%
PERCENT IN LABOR FORCE
7.3%
UNEMPLOYMENT RATE
Belville Area Codes
Income in Belville
Income Overview in Belville
Per Capita Income in Belville is $34,190, while median incomes of families and households are $82,059 and $79,875 respectively.
| Characteristic | Number | Measure |
| Per Capita Income | 3,380 | $34,190 |
| Median Family Income | 812 | $82,059 |
| Mean Family Income | 812 | $92,523 |
| Median Household Income | 1,266 | $79,875 |
| Mean Household Income | 1,266 | $84,918 |
| Income Deficit | 812 | $0 |
| Wage / Income Gap (%) | 3,380 | 30.19% |
| Wage / Income Gap ($) | 3,380 | 69.81¢ per $1 |
| Gini / Inequality Index | 3,380 | 0.30 |
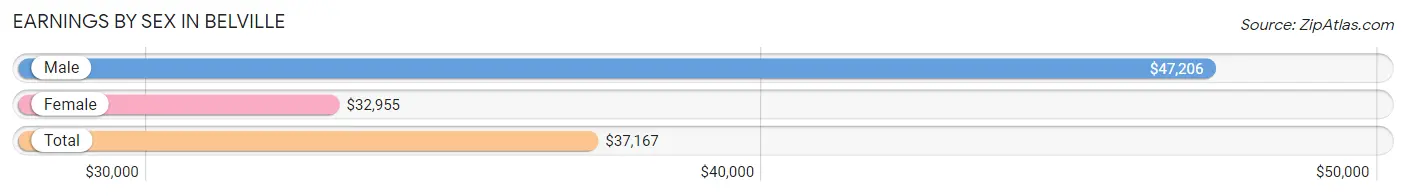
Earnings by Sex in Belville
Average Earnings in Belville are $37,167, $47,206 for men and $32,955 for women, a difference of 30.2%.
| Sex | Number | Average Earnings |
| Male | 1,078 (54.4%) | $47,206 |
| Female | 902 (45.6%) | $32,955 |
| Total | 1,980 (100.0%) | $37,167 |
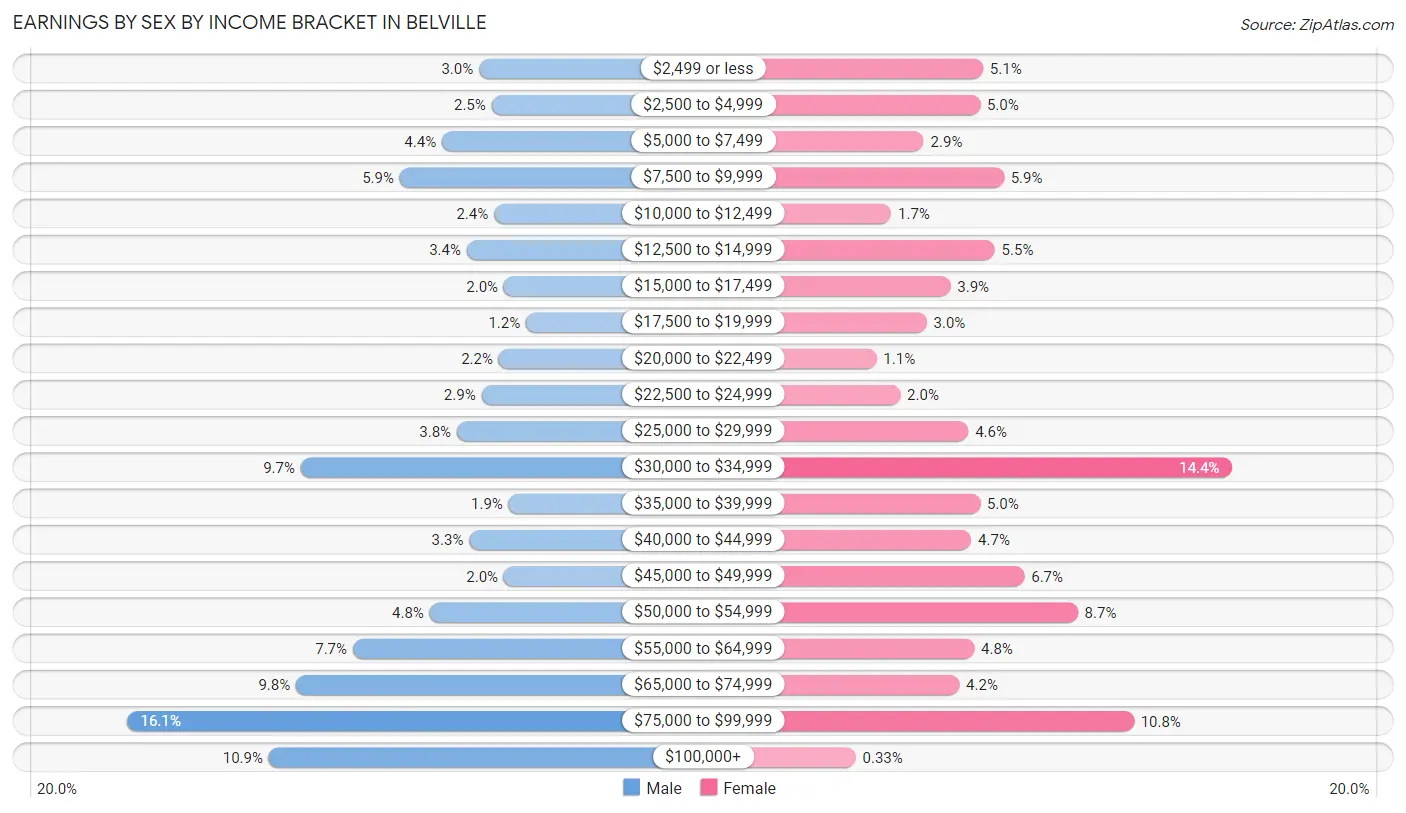
Earnings by Sex by Income Bracket in Belville
The most common earnings brackets in Belville are $75,000 to $99,999 for men (174 | 16.1%) and $30,000 to $34,999 for women (130 | 14.4%).
| Income | Male | Female |
| $2,499 or less | 32 (3.0%) | 46 (5.1%) |
| $2,500 to $4,999 | 27 (2.5%) | 45 (5.0%) |
| $5,000 to $7,499 | 47 (4.4%) | 26 (2.9%) |
| $7,500 to $9,999 | 64 (5.9%) | 53 (5.9%) |
| $10,000 to $12,499 | 26 (2.4%) | 15 (1.7%) |
| $12,500 to $14,999 | 37 (3.4%) | 50 (5.5%) |
| $15,000 to $17,499 | 22 (2.0%) | 35 (3.9%) |
| $17,500 to $19,999 | 13 (1.2%) | 27 (3.0%) |
| $20,000 to $22,499 | 24 (2.2%) | 10 (1.1%) |
| $22,500 to $24,999 | 31 (2.9%) | 18 (2.0%) |
| $25,000 to $29,999 | 41 (3.8%) | 41 (4.5%) |
| $30,000 to $34,999 | 104 (9.7%) | 130 (14.4%) |
| $35,000 to $39,999 | 20 (1.9%) | 45 (5.0%) |
| $40,000 to $44,999 | 36 (3.3%) | 42 (4.7%) |
| $45,000 to $49,999 | 22 (2.0%) | 60 (6.7%) |
| $50,000 to $54,999 | 52 (4.8%) | 78 (8.6%) |
| $55,000 to $64,999 | 83 (7.7%) | 43 (4.8%) |
| $65,000 to $74,999 | 106 (9.8%) | 38 (4.2%) |
| $75,000 to $99,999 | 174 (16.1%) | 97 (10.7%) |
| $100,000+ | 117 (10.8%) | 3 (0.3%) |
| Total | 1,078 (100.0%) | 902 (100.0%) |
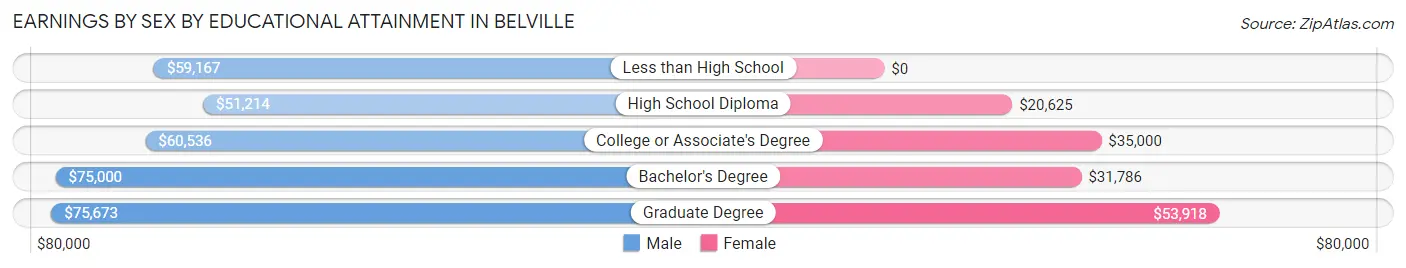
Earnings by Sex by Educational Attainment in Belville
Average earnings in Belville are $68,125 for men and $36,333 for women, a difference of 46.7%. Men with an educational attainment of graduate degree enjoy the highest average annual earnings of $75,673, while those with high school diploma education earn the least with $51,214. Women with an educational attainment of graduate degree earn the most with the average annual earnings of $53,918, while those with high school diploma education have the smallest earnings of $20,625.
| Educational Attainment | Male Income | Female Income |
| Less than High School | $59,167 | $0 |
| High School Diploma | $51,214 | $20,625 |
| College or Associate's Degree | $60,536 | $35,000 |
| Bachelor's Degree | $75,000 | $31,786 |
| Graduate Degree | $75,673 | $53,918 |
| Total | $68,125 | $36,333 |
Family Income in Belville
Family Income Brackets in Belville
According to the Belville family income data, there are 231 families falling into the $75,000 to $99,999 income range, which is the most common income bracket and makes up 28.4% of all families.
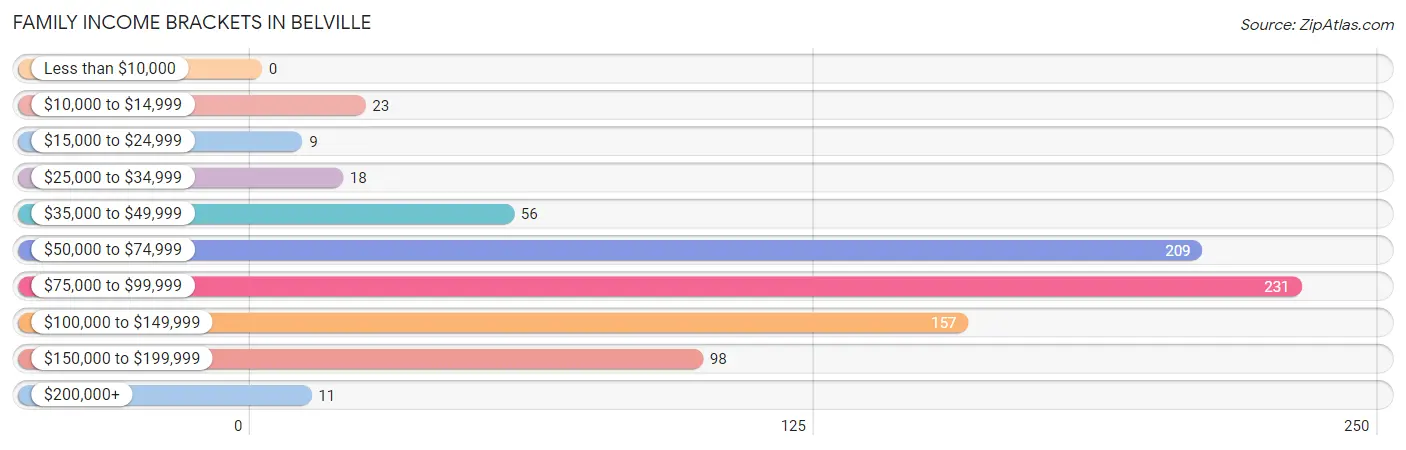
| Income Bracket | # Families | % Families |
| Less than $10,000 | 0 | 0.0% |
| $10,000 to $14,999 | 23 | 2.8% |
| $15,000 to $24,999 | 9 | 1.1% |
| $25,000 to $34,999 | 18 | 2.2% |
| $35,000 to $49,999 | 56 | 6.9% |
| $50,000 to $74,999 | 209 | 25.7% |
| $75,000 to $99,999 | 231 | 28.4% |
| $100,000 to $149,999 | 157 | 19.3% |
| $150,000 to $199,999 | 98 | 12.1% |
| $200,000+ | 11 | 1.4% |
Family Income by Famaliy Size in Belville
4-person families (108 | 13.3%) account for the highest median family income in Belville with $101,250 per family, while 2-person families (445 | 54.8%) have the highest median income of $44,662 per family member.
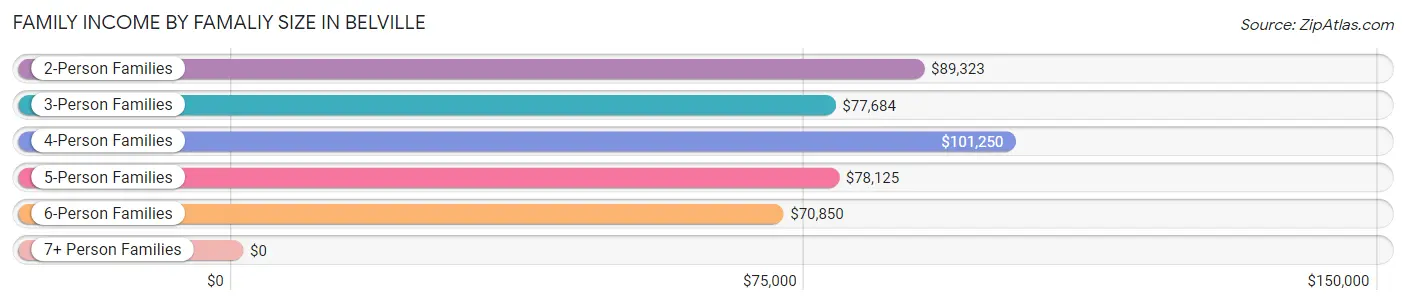
| Income Bracket | # Families | Median Income |
| 2-Person Families | 445 (54.8%) | $89,323 |
| 3-Person Families | 157 (19.3%) | $77,684 |
| 4-Person Families | 108 (13.3%) | $101,250 |
| 5-Person Families | 60 (7.4%) | $78,125 |
| 6-Person Families | 37 (4.6%) | $70,850 |
| 7+ Person Families | 5 (0.6%) | $0 |
| Total | 812 (100.0%) | $82,059 |
Family Income by Number of Earners in Belville
The median family income in Belville is $82,059, with families comprising 3+ earners (63) having the highest median family income of $150,417, while families with 1 earner (180) have the lowest median family income of $62,266, accounting for 7.8% and 22.2% of families, respectively.
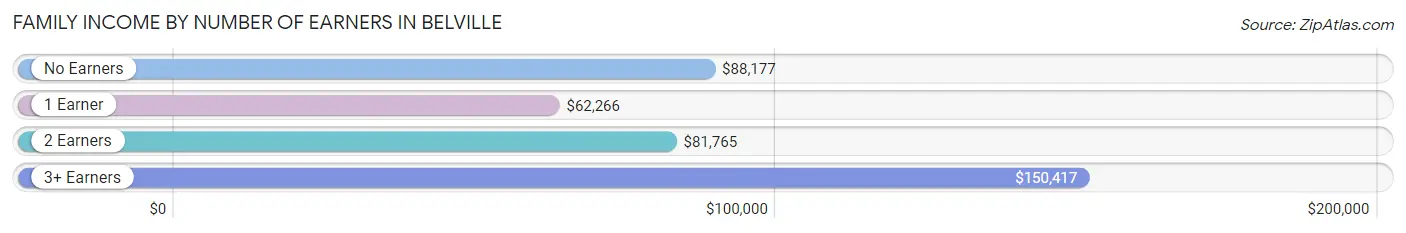
| Number of Earners | # Families | Median Income |
| No Earners | 143 (17.6%) | $88,177 |
| 1 Earner | 180 (22.2%) | $62,266 |
| 2 Earners | 426 (52.5%) | $81,765 |
| 3+ Earners | 63 (7.8%) | $150,417 |
| Total | 812 (100.0%) | $82,059 |
Household Income in Belville
Household Income Brackets in Belville
With 320 households falling in the category, the $75,000 to $99,999 income range is the most frequent in Belville, accounting for 25.3% of all households. In contrast, only 16 households (1.3%) fall into the $10,000 to $14,999 income bracket, making it the least populous group.
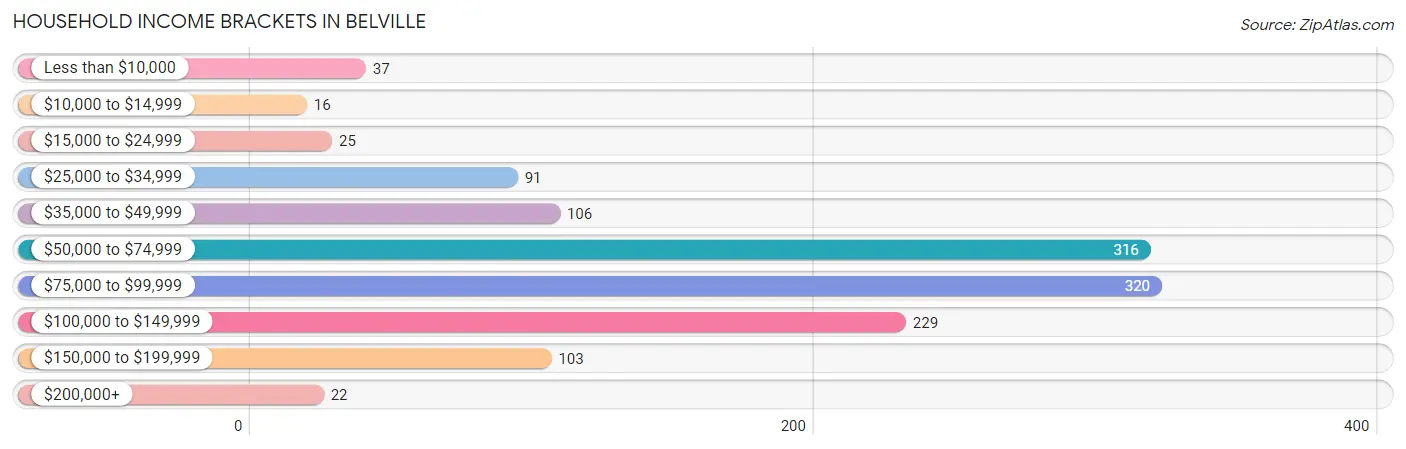
| Income Bracket | # Households | % Households |
| Less than $10,000 | 37 | 2.9% |
| $10,000 to $14,999 | 16 | 1.3% |
| $15,000 to $24,999 | 25 | 2.0% |
| $25,000 to $34,999 | 91 | 7.2% |
| $35,000 to $49,999 | 106 | 8.4% |
| $50,000 to $74,999 | 316 | 25.0% |
| $75,000 to $99,999 | 320 | 25.3% |
| $100,000 to $149,999 | 229 | 18.1% |
| $150,000 to $199,999 | 103 | 8.1% |
| $200,000+ | 22 | 1.7% |
Household Income by Householder Age in Belville
The median household income in Belville is $79,875, with the highest median household income of $88,151 found in the 65+ years age bracket for the primary householder. A total of 296 households (23.4%) fall into this category. Meanwhile, the 15 to 24 years age bracket for the primary householder has the lowest median household income of $52,781, with 77 households (6.1%) in this group.
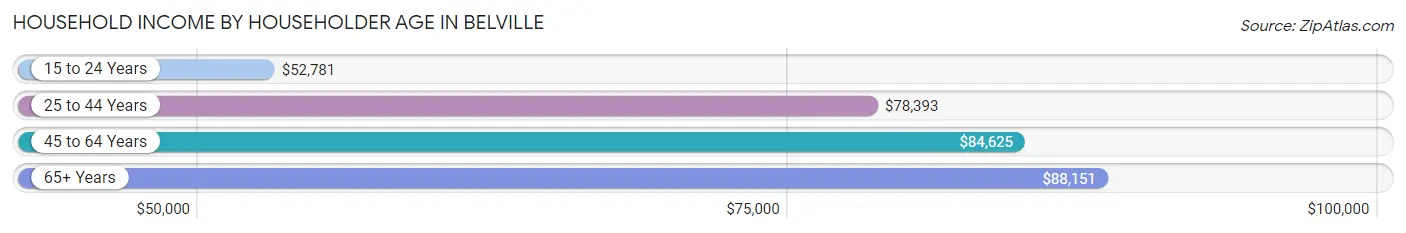
| Income Bracket | # Households | Median Income |
| 15 to 24 Years | 77 (6.1%) | $52,781 |
| 25 to 44 Years | 490 (38.7%) | $78,393 |
| 45 to 64 Years | 403 (31.8%) | $84,625 |
| 65+ Years | 296 (23.4%) | $88,151 |
| Total | 1,266 (100.0%) | $79,875 |
Poverty in Belville
Income Below Poverty by Sex and Age in Belville
With 9.5% poverty level for males and 8.1% for females among the residents of Belville, 18 to 24 year old males and 35 to 44 year old females are the most vulnerable to poverty, with 121 males (29.2%) and 57 females (24.7%) in their respective age groups living below the poverty level.
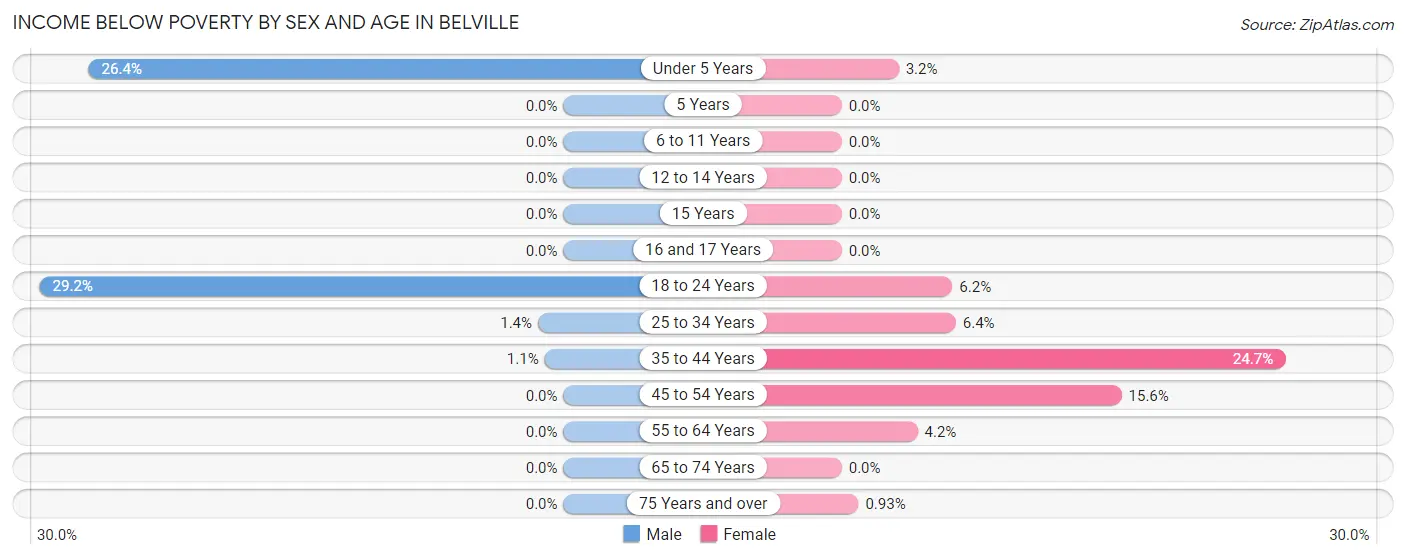
| Age Bracket | Male | Female |
| Under 5 Years | 37 (26.4%) | 2 (3.2%) |
| 5 Years | 0 (0.0%) | 0 (0.0%) |
| 6 to 11 Years | 0 (0.0%) | 0 (0.0%) |
| 12 to 14 Years | 0 (0.0%) | 0 (0.0%) |
| 15 Years | 0 (0.0%) | 0 (0.0%) |
| 16 and 17 Years | 0 (0.0%) | 0 (0.0%) |
| 18 to 24 Years | 121 (29.2%) | 9 (6.2%) |
| 25 to 34 Years | 4 (1.4%) | 19 (6.4%) |
| 35 to 44 Years | 2 (1.1%) | 57 (24.7%) |
| 45 to 54 Years | 0 (0.0%) | 36 (15.6%) |
| 55 to 64 Years | 0 (0.0%) | 7 (4.2%) |
| 65 to 74 Years | 0 (0.0%) | 0 (0.0%) |
| 75 Years and over | 0 (0.0%) | 1 (0.9%) |
| Total | 164 (9.5%) | 131 (8.1%) |
Income Above Poverty by Sex and Age in Belville
According to the poverty statistics in Belville, males aged 5 years and females aged 5 years are the age groups that are most secure financially, with 100.0% of males and 100.0% of females in these age groups living above the poverty line.
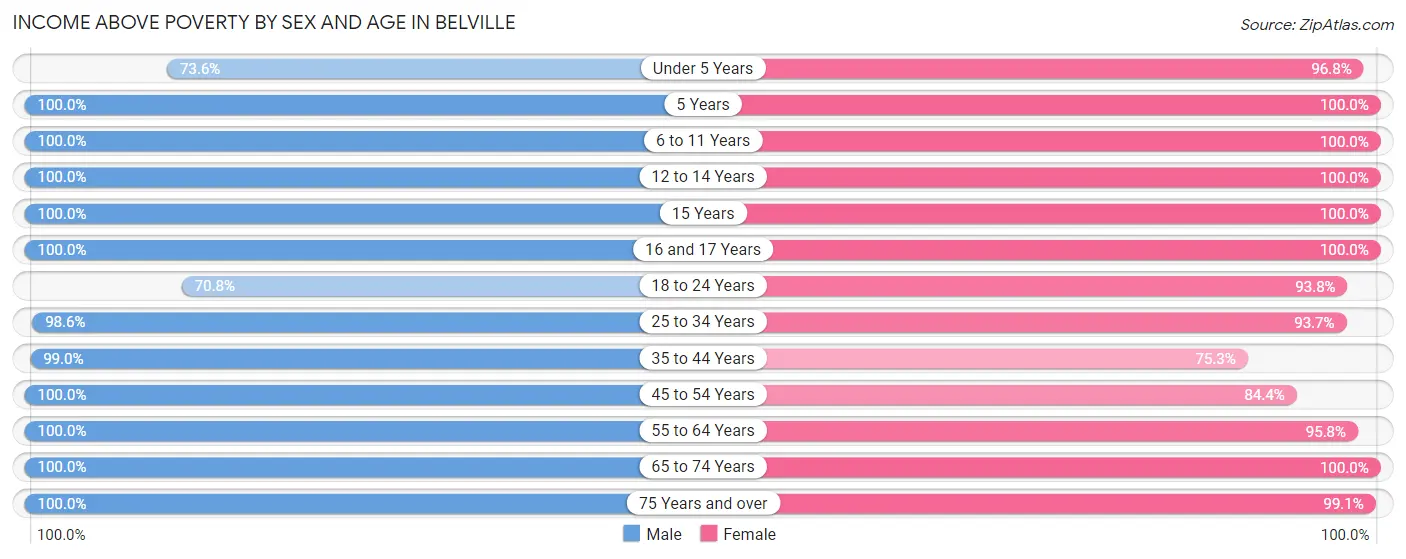
| Age Bracket | Male | Female |
| Under 5 Years | 103 (73.6%) | 61 (96.8%) |
| 5 Years | 15 (100.0%) | 1 (100.0%) |
| 6 to 11 Years | 72 (100.0%) | 107 (100.0%) |
| 12 to 14 Years | 10 (100.0%) | 53 (100.0%) |
| 15 Years | 5 (100.0%) | 26 (100.0%) |
| 16 and 17 Years | 65 (100.0%) | 41 (100.0%) |
| 18 to 24 Years | 294 (70.8%) | 137 (93.8%) |
| 25 to 34 Years | 277 (98.6%) | 280 (93.6%) |
| 35 to 44 Years | 188 (99.0%) | 174 (75.3%) |
| 45 to 54 Years | 153 (100.0%) | 195 (84.4%) |
| 55 to 64 Years | 129 (100.0%) | 159 (95.8%) |
| 65 to 74 Years | 206 (100.0%) | 156 (100.0%) |
| 75 Years and over | 46 (100.0%) | 107 (99.1%) |
| Total | 1,563 (90.5%) | 1,497 (91.9%) |
Income Below Poverty Among Married-Couple Families in Belville
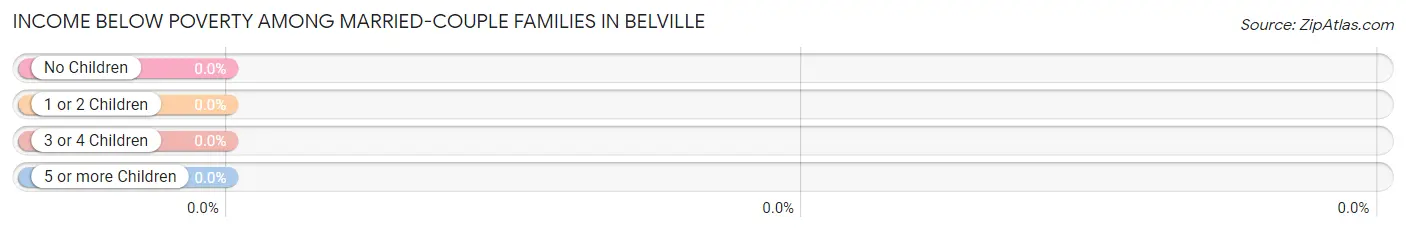
| Children | Above Poverty | Below Poverty |
| No Children | 388 (100.0%) | 0 (0.0%) |
| 1 or 2 Children | 131 (100.0%) | 0 (0.0%) |
| 3 or 4 Children | 67 (100.0%) | 0 (0.0%) |
| 5 or more Children | 5 (100.0%) | 0 (0.0%) |
| Total | 591 (100.0%) | 0 (0.0%) |
Income Below Poverty Among Single-Parent Households in Belville
According to the poverty data in Belville, 18.4% or 7 single-father households and 9.3% or 17 single-mother households are living below the poverty line. Among single-father households, those with no children have the highest poverty rate, with 7 households (31.8%) experiencing poverty. Likewise, among single-mother households, those with 1 or 2 children have the highest poverty rate, with 17 households (18.3%) falling below the poverty line.
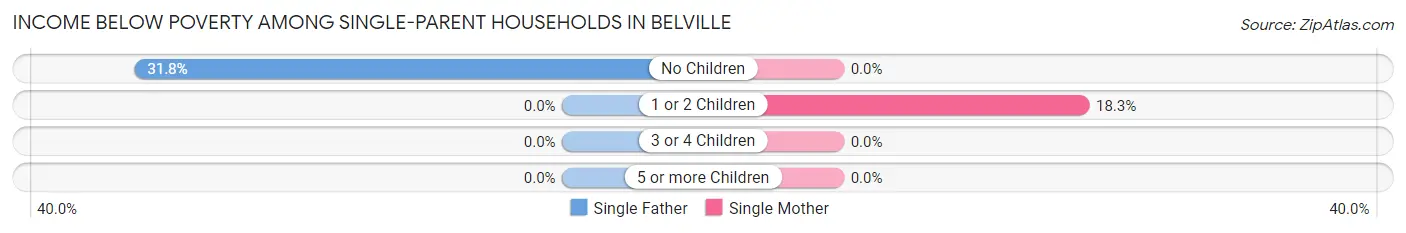
| Children | Single Father | Single Mother |
| No Children | 7 (31.8%) | 0 (0.0%) |
| 1 or 2 Children | 0 (0.0%) | 17 (18.3%) |
| 3 or 4 Children | 0 (0.0%) | 0 (0.0%) |
| 5 or more Children | 0 (0.0%) | 0 (0.0%) |
| Total | 7 (18.4%) | 17 (9.3%) |
Income Below Poverty Among Married-Couple vs Single-Parent Households in Belville
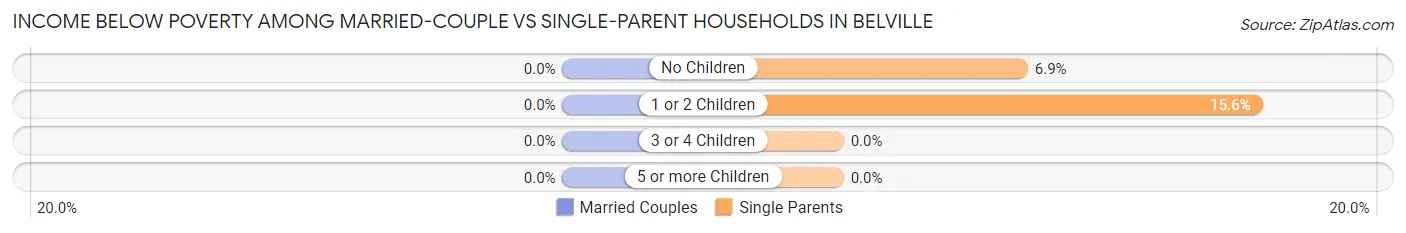
| Children | Married-Couple Families | Single-Parent Households |
| No Children | 0 (0.0%) | 7 (6.9%) |
| 1 or 2 Children | 0 (0.0%) | 17 (15.6%) |
| 3 or 4 Children | 0 (0.0%) | 0 (0.0%) |
| 5 or more Children | 0 (0.0%) | 0 (0.0%) |
| Total | 0 (0.0%) | 24 (10.9%) |
Race in Belville
The most populous races in Belville are White / Caucasian (2,250 | 66.6%), Black / African American (785 | 23.2%), and Two or more Races (282 | 8.3%).
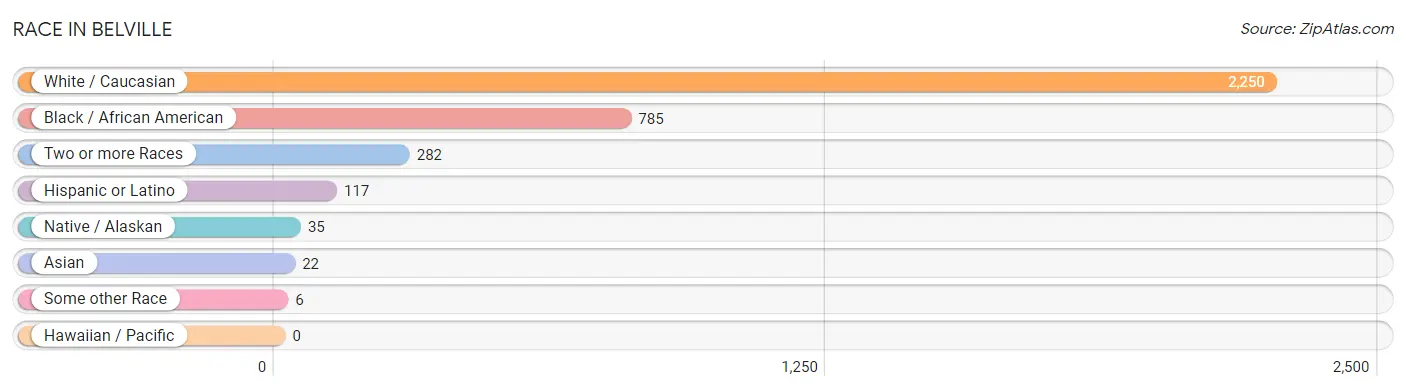
| Race | # Population | % Population |
| Asian | 22 | 0.6% |
| Black / African American | 785 | 23.2% |
| Hawaiian / Pacific | 0 | 0.0% |
| Hispanic or Latino | 117 | 3.5% |
| Native / Alaskan | 35 | 1.0% |
| White / Caucasian | 2,250 | 66.6% |
| Two or more Races | 282 | 8.3% |
| Some other Race | 6 | 0.2% |
| Total | 3,380 | 100.0% |
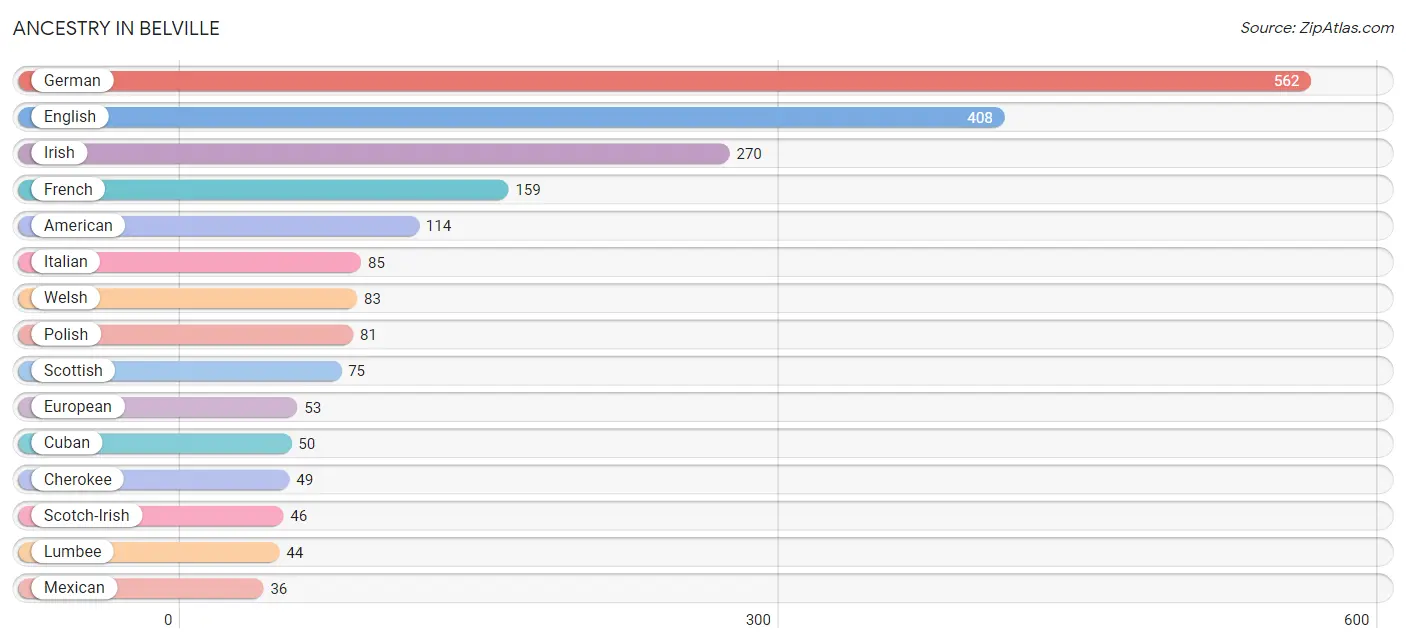
Ancestry in Belville
The most populous ancestries reported in Belville are German (562 | 16.6%), English (408 | 12.1%), Irish (270 | 8.0%), French (159 | 4.7%), and American (114 | 3.4%), together accounting for 44.8% of all Belville residents.
| Ancestry | # Population | % Population |
| Aleut | 1 | 0.0% |
| American | 114 | 3.4% |
| Apache | 4 | 0.1% |
| Australian | 10 | 0.3% |
| Austrian | 3 | 0.1% |
| Bhutanese | 19 | 0.6% |
| Central American | 20 | 0.6% |
| Cherokee | 49 | 1.5% |
| Cuban | 50 | 1.5% |
| Czech | 35 | 1.0% |
| Dutch | 7 | 0.2% |
| English | 408 | 12.1% |
| European | 53 | 1.6% |
| French | 159 | 4.7% |
| French Canadian | 20 | 0.6% |
| German | 562 | 16.6% |
| Honduran | 20 | 0.6% |
| Hungarian | 22 | 0.6% |
| Irish | 270 | 8.0% |
| Italian | 85 | 2.5% |
| Korean | 3 | 0.1% |
| Laotian | 10 | 0.3% |
| Latvian | 13 | 0.4% |
| Lumbee | 44 | 1.3% |
| Mexican | 36 | 1.1% |
| Norwegian | 7 | 0.2% |
| Polish | 81 | 2.4% |
| Russian | 7 | 0.2% |
| Samoan | 30 | 0.9% |
| Scotch-Irish | 46 | 1.4% |
| Scottish | 75 | 2.2% |
| Spaniard | 11 | 0.3% |
| Sri Lankan | 21 | 0.6% |
| Swedish | 10 | 0.3% |
| Swiss | 11 | 0.3% |
| Welsh | 83 | 2.5% |
| West Indian | 9 | 0.3% |
| Yugoslavian | 4 | 0.1% | View All 38 Rows |
Immigrants in Belville
The most numerous immigrant groups reported in Belville came from Central America (18 | 0.5%), Latin America (18 | 0.5%), Costa Rica (14 | 0.4%), Australia (13 | 0.4%), and Oceania (13 | 0.4%), together accounting for 2.2% of all Belville residents.
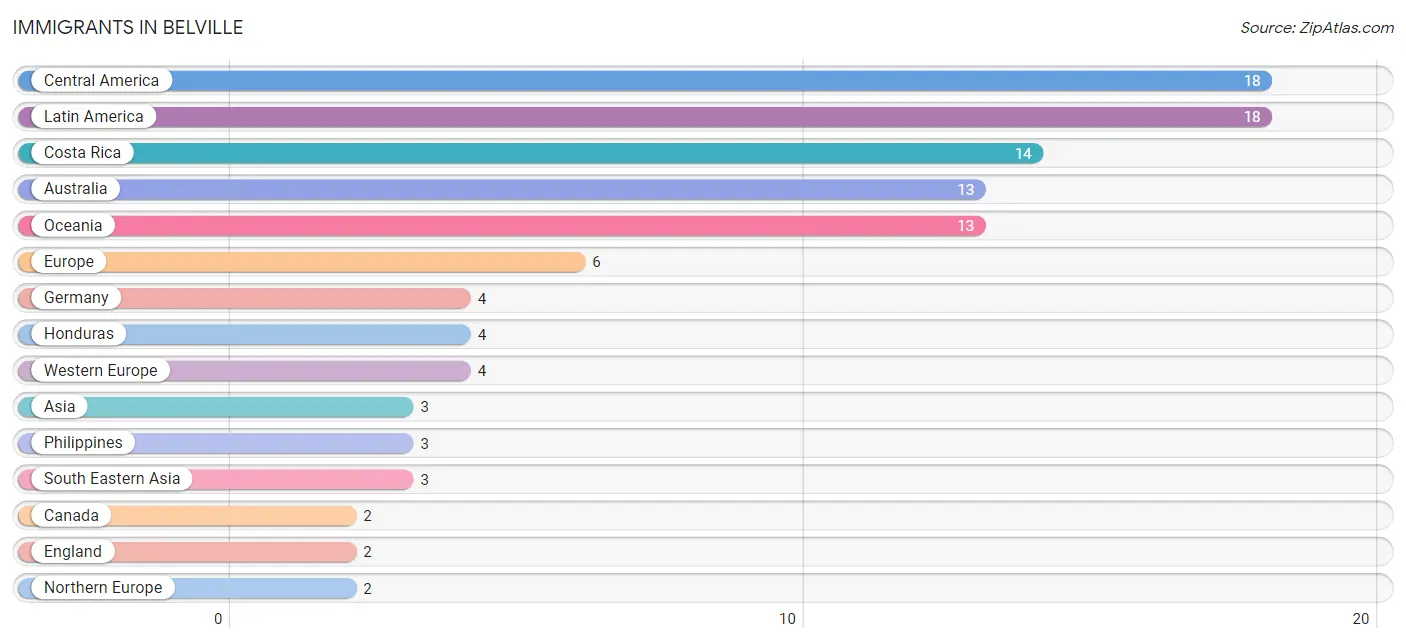
| Immigration Origin | # Population | % Population |
| Asia | 3 | 0.1% |
| Australia | 13 | 0.4% |
| Canada | 2 | 0.1% |
| Central America | 18 | 0.5% |
| Costa Rica | 14 | 0.4% |
| England | 2 | 0.1% |
| Europe | 6 | 0.2% |
| Germany | 4 | 0.1% |
| Honduras | 4 | 0.1% |
| Latin America | 18 | 0.5% |
| Northern Europe | 2 | 0.1% |
| Oceania | 13 | 0.4% |
| Philippines | 3 | 0.1% |
| South Eastern Asia | 3 | 0.1% |
| Western Europe | 4 | 0.1% | View All 15 Rows |
Sex and Age in Belville
Sex and Age in Belville
The most populous age groups in Belville are 20 to 24 Years (281 | 16.1%) for men and 30 to 34 Years (192 | 11.8%) for women.
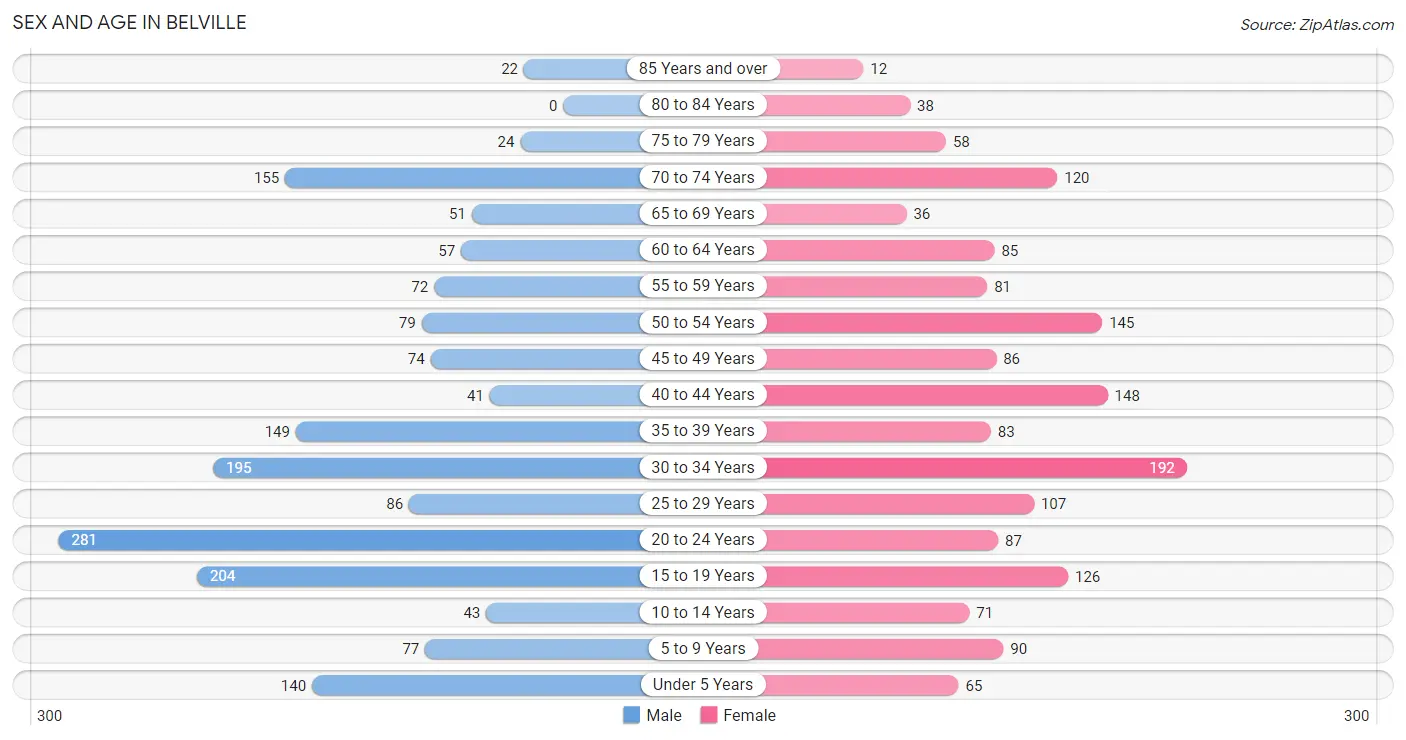
| Age Bracket | Male | Female |
| Under 5 Years | 140 (8.0%) | 65 (4.0%) |
| 5 to 9 Years | 77 (4.4%) | 90 (5.5%) |
| 10 to 14 Years | 43 (2.5%) | 71 (4.4%) |
| 15 to 19 Years | 204 (11.7%) | 126 (7.7%) |
| 20 to 24 Years | 281 (16.1%) | 87 (5.3%) |
| 25 to 29 Years | 86 (4.9%) | 107 (6.6%) |
| 30 to 34 Years | 195 (11.1%) | 192 (11.8%) |
| 35 to 39 Years | 149 (8.5%) | 83 (5.1%) |
| 40 to 44 Years | 41 (2.3%) | 148 (9.1%) |
| 45 to 49 Years | 74 (4.2%) | 86 (5.3%) |
| 50 to 54 Years | 79 (4.5%) | 145 (8.9%) |
| 55 to 59 Years | 72 (4.1%) | 81 (5.0%) |
| 60 to 64 Years | 57 (3.3%) | 85 (5.2%) |
| 65 to 69 Years | 51 (2.9%) | 36 (2.2%) |
| 70 to 74 Years | 155 (8.9%) | 120 (7.4%) |
| 75 to 79 Years | 24 (1.4%) | 58 (3.6%) |
| 80 to 84 Years | 0 (0.0%) | 38 (2.3%) |
| 85 Years and over | 22 (1.3%) | 12 (0.7%) |
| Total | 1,750 (100.0%) | 1,630 (100.0%) |
Families and Households in Belville
Median Family Size in Belville
The median family size in Belville is 3.20 persons per family, with single male/father families (38 | 4.7%) accounting for the largest median family size of 5.21 persons per family. On the other hand, married-couple families (591 | 72.8%) represent the smallest median family size with 2.98 persons per family.
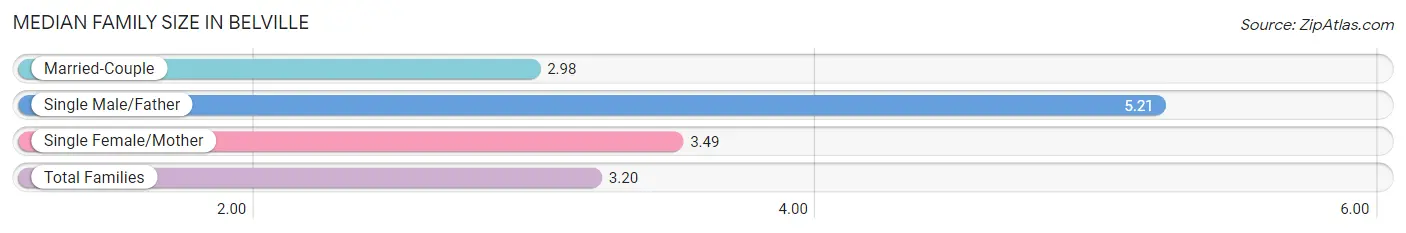
| Family Type | # Families | Family Size |
| Married-Couple | 591 (72.8%) | 2.98 |
| Single Male/Father | 38 (4.7%) | 5.21 |
| Single Female/Mother | 183 (22.5%) | 3.49 |
| Total Families | 812 (100.0%) | 3.20 |
Median Household Size in Belville
The median household size in Belville is 2.67 persons per household, with single male/father households (38 | 3.0%) accounting for the largest median household size of 6.21 persons per household. non-family households (454 | 35.9%) represent the smallest median household size with 1.45 persons per household.
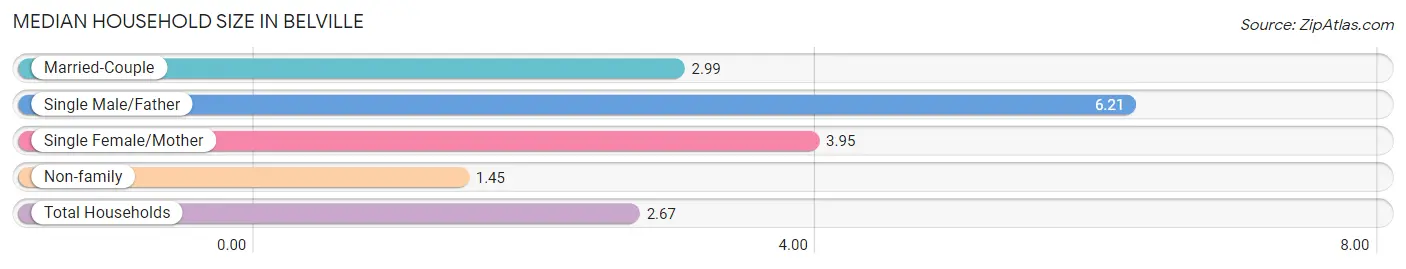
| Household Type | # Households | Household Size |
| Married-Couple | 591 (46.7%) | 2.99 |
| Single Male/Father | 38 (3.0%) | 6.21 |
| Single Female/Mother | 183 (14.4%) | 3.95 |
| Non-family | 454 (35.9%) | 1.45 |
| Total Households | 1,266 (100.0%) | 2.67 |
Household Size by Marriage Status in Belville
Out of a total of 1,266 households in Belville, 812 (64.1%) are family households, while 454 (35.9%) are nonfamily households. The most numerous type of family households are 2-person households, comprising 426, and the most common type of nonfamily households are 1-person households, comprising 294.
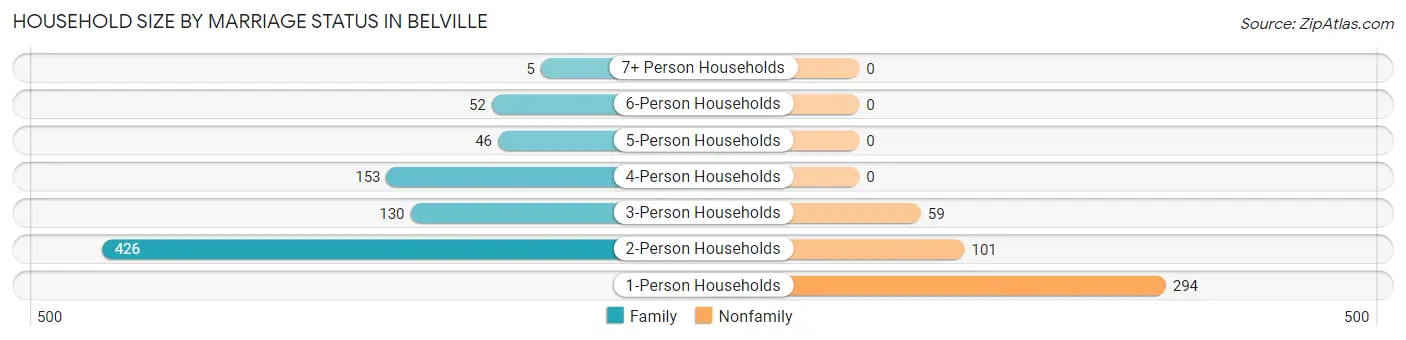
| Household Size | Family Households | Nonfamily Households |
| 1-Person Households | - | 294 (23.2%) |
| 2-Person Households | 426 (33.7%) | 101 (8.0%) |
| 3-Person Households | 130 (10.3%) | 59 (4.7%) |
| 4-Person Households | 153 (12.1%) | 0 (0.0%) |
| 5-Person Households | 46 (3.6%) | 0 (0.0%) |
| 6-Person Households | 52 (4.1%) | 0 (0.0%) |
| 7+ Person Households | 5 (0.4%) | 0 (0.0%) |
| Total | 812 (64.1%) | 454 (35.9%) |
Female Fertility in Belville
Fertility by Age in Belville
Average fertility rate in Belville is 126.0 births per 1,000 women. Women in the age bracket of 35 to 50 years have the highest fertility rate with 149.0 births per 1,000 women. Women in the age bracket of 20 to 34 years acount for 53.3% of all women with births.
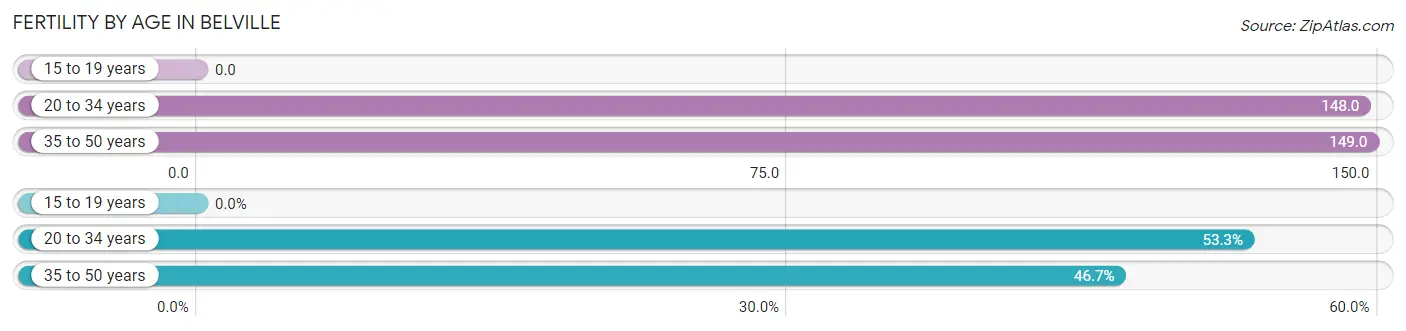
| Age Bracket | Women with Births | Births / 1,000 Women |
| 15 to 19 years | 0 (0.0%) | 0.0 |
| 20 to 34 years | 57 (53.3%) | 148.0 |
| 35 to 50 years | 50 (46.7%) | 149.0 |
| Total | 107 (100.0%) | 126.0 |
Fertility by Age by Marriage Status in Belville
78.5% of women with births (107) in Belville are married. The highest percentage of unmarried women with births falls into 20 to 34 years age bracket with 40.4% of them unmarried at the time of birth, while the lowest percentage of unmarried women with births belong to 35 to 50 years age bracket with 0.0% of them unmarried.
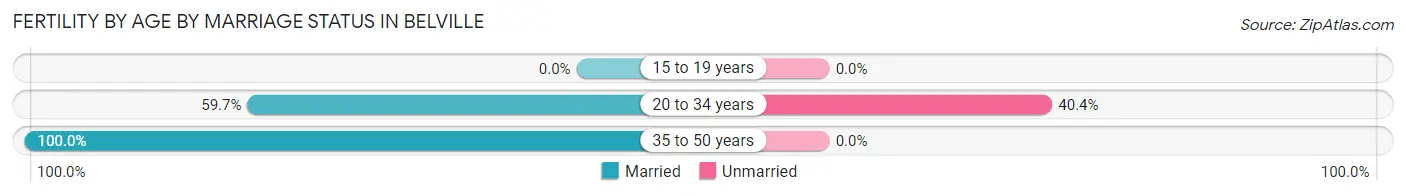
| Age Bracket | Married | Unmarried |
| 15 to 19 years | 0 (0.0%) | 0 (0.0%) |
| 20 to 34 years | 34 (59.7%) | 23 (40.4%) |
| 35 to 50 years | 50 (100.0%) | 0 (0.0%) |
| Total | 84 (78.5%) | 23 (21.5%) |
Fertility by Education in Belville
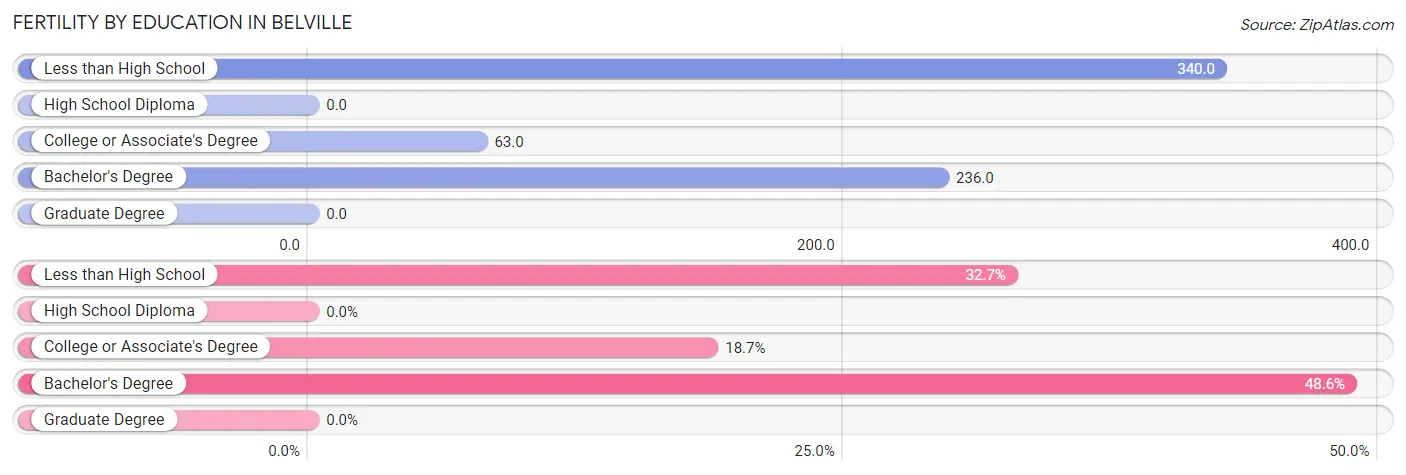
| Educational Attainment | Women with Births | Births / 1,000 Women |
| Less than High School | 35 (32.7%) | 340.0 |
| High School Diploma | 0 (0.0%) | 0.0 |
| College or Associate's Degree | 20 (18.7%) | 63.0 |
| Bachelor's Degree | 52 (48.6%) | 236.0 |
| Graduate Degree | 0 (0.0%) | 0.0 |
| Total | 107 (100.0%) | 126.0 |
Fertility by Education by Marriage Status in Belville
21.5% of women with births in Belville are unmarried. Women with the educational attainment of bachelor's degree are most likely to be married with 100.0% of them married at childbirth, while women with the educational attainment of college or associate's degree are least likely to be married with 100.0% of them unmarried at childbirth.
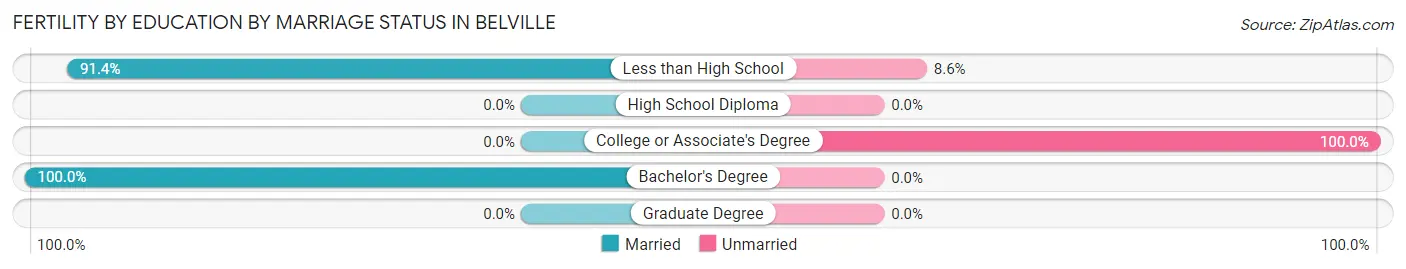
| Educational Attainment | Married | Unmarried |
| Less than High School | 32 (91.4%) | 3 (8.6%) |
| High School Diploma | 0 (0.0%) | 0 (0.0%) |
| College or Associate's Degree | 0 (0.0%) | 20 (100.0%) |
| Bachelor's Degree | 52 (100.0%) | 0 (0.0%) |
| Graduate Degree | 0 (0.0%) | 0 (0.0%) |
| Total | 84 (78.5%) | 23 (21.5%) |
Employment Characteristics in Belville
Employment by Class of Employer in Belville
Among the 1,779 employed individuals in Belville, private company employees (1,220 | 68.6%), not-for-profit organizations (153 | 8.6%), and state government employees (147 | 8.3%) make up the most common classes of employment.
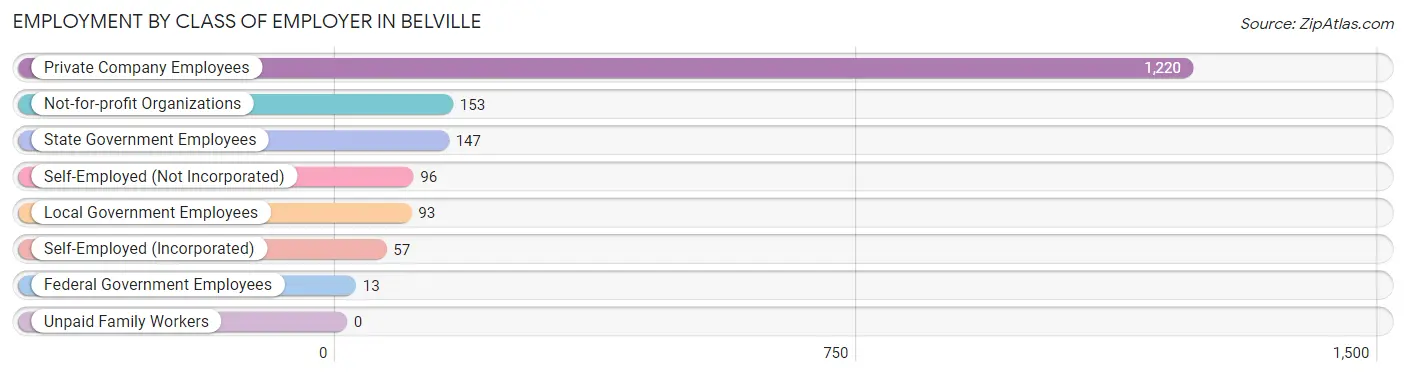
| Employer Class | # Employees | % Employees |
| Private Company Employees | 1,220 | 68.6% |
| Self-Employed (Incorporated) | 57 | 3.2% |
| Self-Employed (Not Incorporated) | 96 | 5.4% |
| Not-for-profit Organizations | 153 | 8.6% |
| Local Government Employees | 93 | 5.2% |
| State Government Employees | 147 | 8.3% |
| Federal Government Employees | 13 | 0.7% |
| Unpaid Family Workers | 0 | 0.0% |
| Total | 1,779 | 100.0% |
Employment Status by Age in Belville
According to the labor force statistics for Belville, out of the total population over 16 years of age (2,863), 68.6% or 1,964 individuals are in the labor force, with 7.3% or 143 of them unemployed. The age group with the highest labor force participation rate is 25 to 29 years, with 99.5% or 192 individuals in the labor force. Within the labor force, the 25 to 29 years age range has the highest percentage of unemployed individuals, with 28.1% or 54 of them being unemployed.
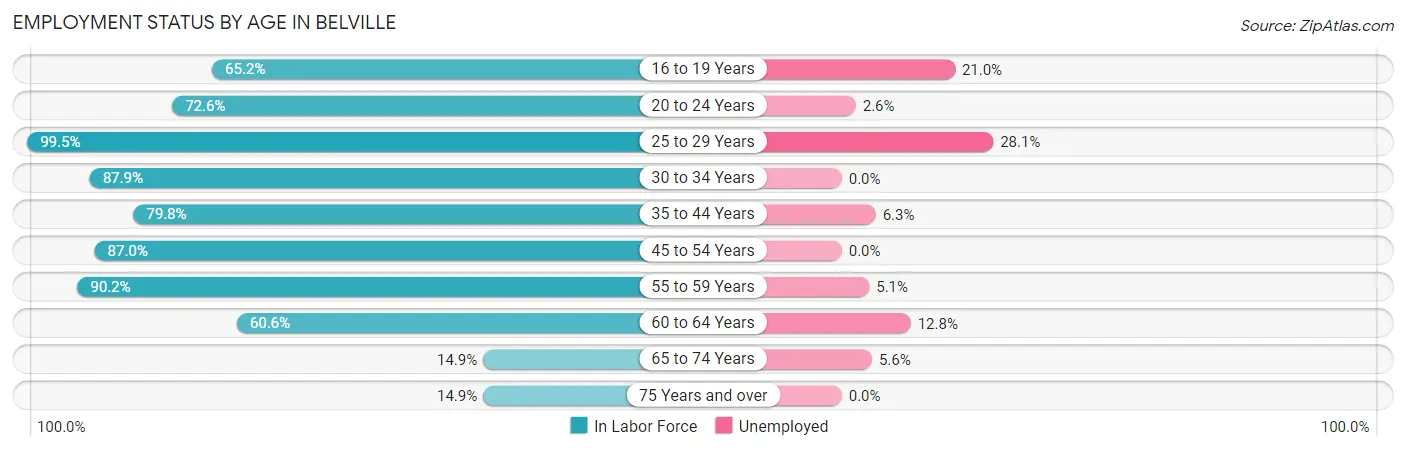
| Age Bracket | In Labor Force | Unemployed |
| 16 to 19 Years | 195 (65.2%) | 41 (21.0%) |
| 20 to 24 Years | 267 (72.6%) | 7 (2.6%) |
| 25 to 29 Years | 192 (99.5%) | 54 (28.1%) |
| 30 to 34 Years | 340 (87.9%) | 0 (0.0%) |
| 35 to 44 Years | 336 (79.8%) | 21 (6.3%) |
| 45 to 54 Years | 334 (87.0%) | 0 (0.0%) |
| 55 to 59 Years | 138 (90.2%) | 7 (5.1%) |
| 60 to 64 Years | 86 (60.6%) | 11 (12.8%) |
| 65 to 74 Years | 54 (14.9%) | 3 (5.6%) |
| 75 Years and over | 23 (14.9%) | 0 (0.0%) |
| Total | 1,964 (68.6%) | 143 (7.3%) |
Employment Status by Educational Attainment in Belville
According to labor force statistics for Belville, 84.9% of individuals (1,426) out of the total population between 25 and 64 years of age (1,680) are in the labor force, with 6.5% or 93 of them being unemployed. The group with the highest labor force participation rate are those with the educational attainment of bachelor's degree or higher, with 91.6% or 575 individuals in the labor force. Within the labor force, individuals with less than high school education have the highest percentage of unemployment, with 15.3% or 11 of them being unemployed.
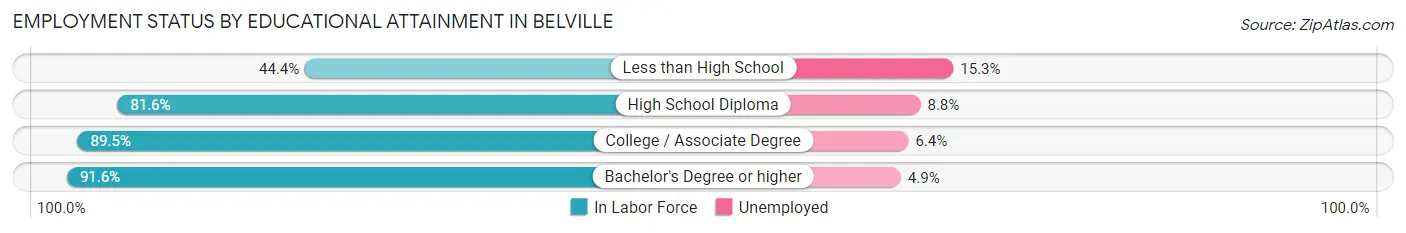
| Educational Attainment | In Labor Force | Unemployed |
| Less than High School | 72 (44.4%) | 25 (15.3%) |
| High School Diploma | 182 (81.6%) | 20 (8.8%) |
| College / Associate Degree | 597 (89.5%) | 43 (6.4%) |
| Bachelor's Degree or higher | 575 (91.6%) | 31 (4.9%) |
| Total | 1,426 (84.9%) | 109 (6.5%) |
Employment Occupations by Sex in Belville
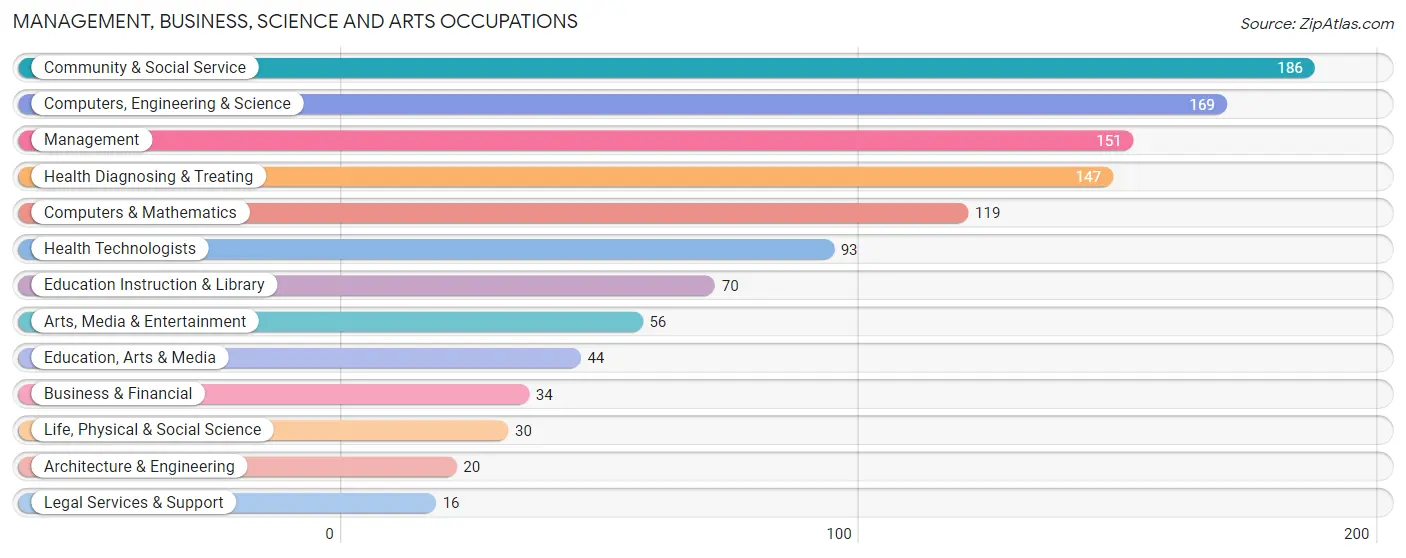
Management, Business, Science and Arts Occupations
The most common Management, Business, Science and Arts occupations in Belville are Community & Social Service (186 | 10.2%), Computers, Engineering & Science (169 | 9.3%), Management (151 | 8.3%), Health Diagnosing & Treating (147 | 8.1%), and Computers & Mathematics (119 | 6.5%).
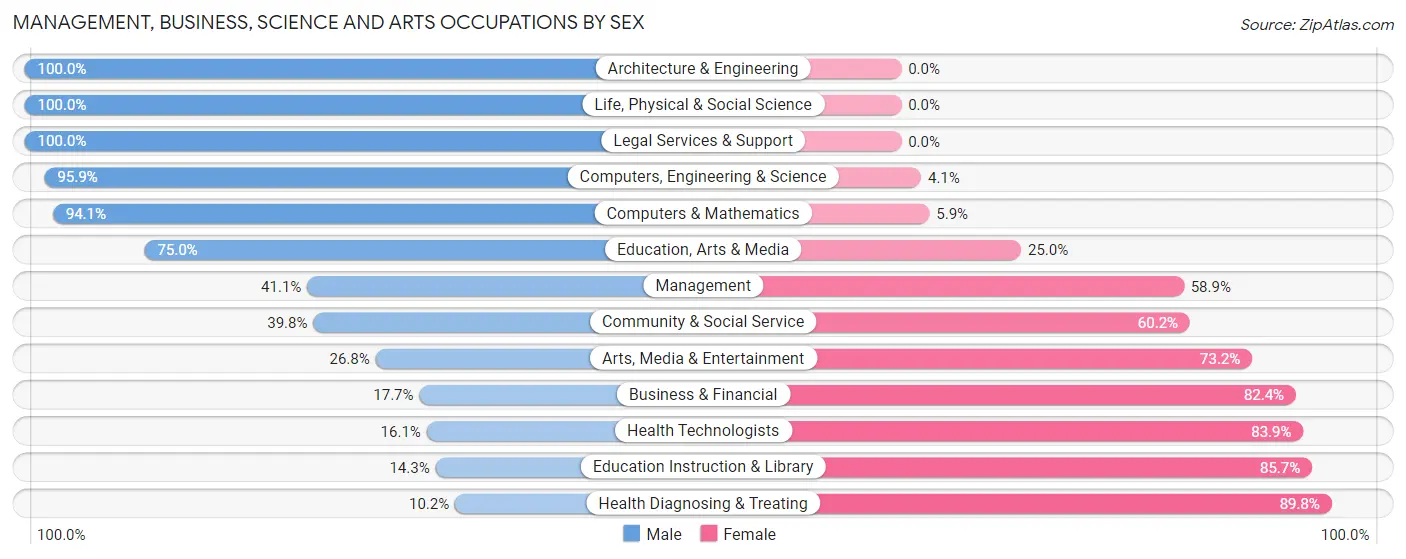
Management, Business, Science and Arts Occupations by Sex
Within the Management, Business, Science and Arts occupations in Belville, the most male-oriented occupations are Architecture & Engineering (100.0%), Life, Physical & Social Science (100.0%), and Legal Services & Support (100.0%), while the most female-oriented occupations are Health Diagnosing & Treating (89.8%), Education Instruction & Library (85.7%), and Health Technologists (83.9%).
| Occupation | Male | Female |
| Management | 62 (41.1%) | 89 (58.9%) |
| Business & Financial | 6 (17.6%) | 28 (82.4%) |
| Computers, Engineering & Science | 162 (95.9%) | 7 (4.1%) |
| Computers & Mathematics | 112 (94.1%) | 7 (5.9%) |
| Architecture & Engineering | 20 (100.0%) | 0 (0.0%) |
| Life, Physical & Social Science | 30 (100.0%) | 0 (0.0%) |
| Community & Social Service | 74 (39.8%) | 112 (60.2%) |
| Education, Arts & Media | 33 (75.0%) | 11 (25.0%) |
| Legal Services & Support | 16 (100.0%) | 0 (0.0%) |
| Education Instruction & Library | 10 (14.3%) | 60 (85.7%) |
| Arts, Media & Entertainment | 15 (26.8%) | 41 (73.2%) |
| Health Diagnosing & Treating | 15 (10.2%) | 132 (89.8%) |
| Health Technologists | 15 (16.1%) | 78 (83.9%) |
| Total (Category) | 319 (46.4%) | 368 (53.6%) |
| Total (Overall) | 1,017 (55.8%) | 804 (44.2%) |
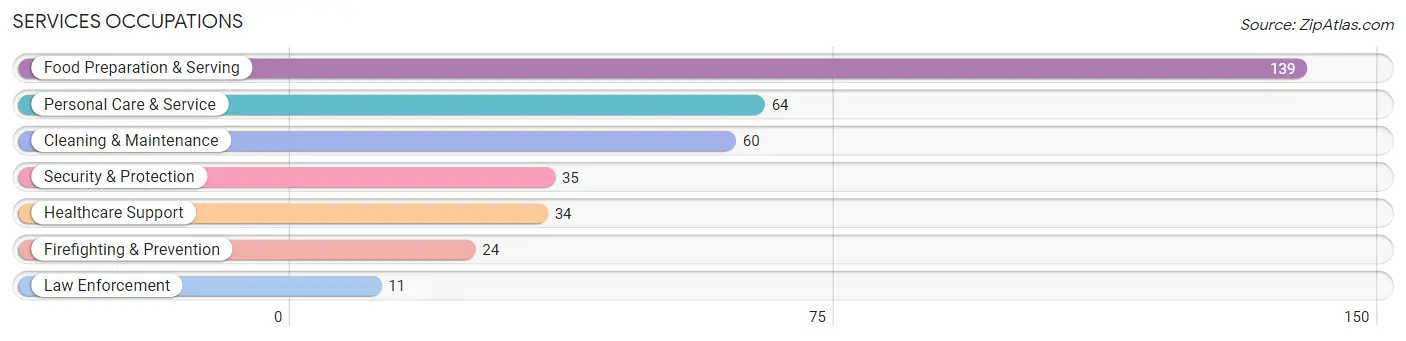
Services Occupations
The most common Services occupations in Belville are Food Preparation & Serving (139 | 7.6%), Personal Care & Service (64 | 3.5%), Cleaning & Maintenance (60 | 3.3%), Security & Protection (35 | 1.9%), and Healthcare Support (34 | 1.9%).
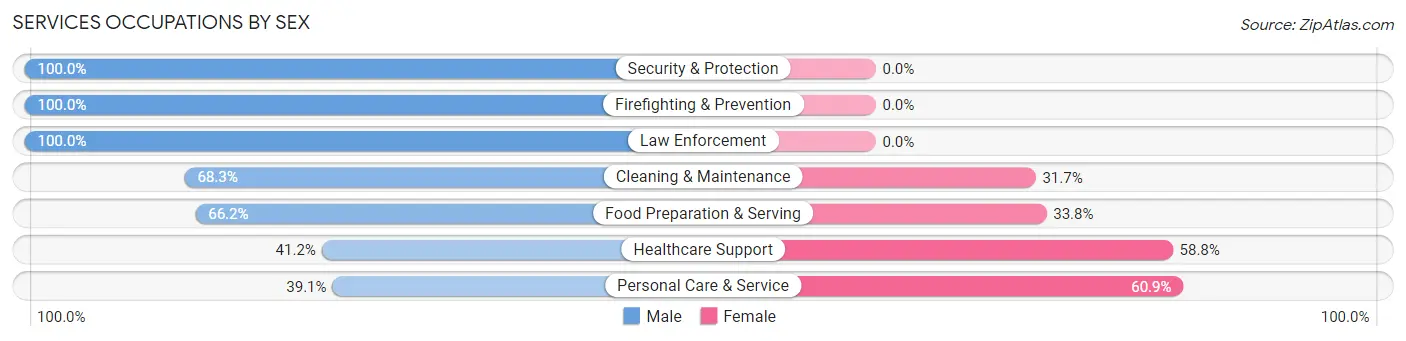
Services Occupations by Sex
Within the Services occupations in Belville, the most male-oriented occupations are Security & Protection (100.0%), Firefighting & Prevention (100.0%), and Law Enforcement (100.0%), while the most female-oriented occupations are Personal Care & Service (60.9%), Healthcare Support (58.8%), and Food Preparation & Serving (33.8%).
| Occupation | Male | Female |
| Healthcare Support | 14 (41.2%) | 20 (58.8%) |
| Security & Protection | 35 (100.0%) | 0 (0.0%) |
| Firefighting & Prevention | 24 (100.0%) | 0 (0.0%) |
| Law Enforcement | 11 (100.0%) | 0 (0.0%) |
| Food Preparation & Serving | 92 (66.2%) | 47 (33.8%) |
| Cleaning & Maintenance | 41 (68.3%) | 19 (31.7%) |
| Personal Care & Service | 25 (39.1%) | 39 (60.9%) |
| Total (Category) | 207 (62.4%) | 125 (37.7%) |
| Total (Overall) | 1,017 (55.8%) | 804 (44.2%) |
Sales and Office Occupations
The most common Sales and Office occupations in Belville are Office & Administration (277 | 15.2%), and Sales & Related (118 | 6.5%).

Sales and Office Occupations by Sex
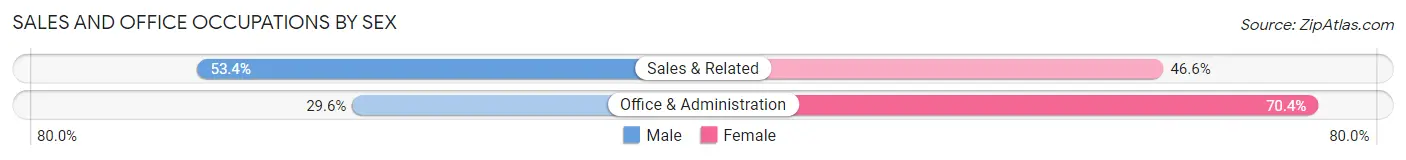
| Occupation | Male | Female |
| Sales & Related | 63 (53.4%) | 55 (46.6%) |
| Office & Administration | 82 (29.6%) | 195 (70.4%) |
| Total (Category) | 145 (36.7%) | 250 (63.3%) |
| Total (Overall) | 1,017 (55.8%) | 804 (44.2%) |
Natural Resources, Construction and Maintenance Occupations
The most common Natural Resources, Construction and Maintenance occupations in Belville are Installation, Maintenance & Repair (111 | 6.1%), and Construction & Extraction (55 | 3.0%).

Natural Resources, Construction and Maintenance Occupations by Sex

| Occupation | Male | Female |
| Farming, Fishing & Forestry | 0 (0.0%) | 0 (0.0%) |
| Construction & Extraction | 55 (100.0%) | 0 (0.0%) |
| Installation, Maintenance & Repair | 111 (100.0%) | 0 (0.0%) |
| Total (Category) | 166 (100.0%) | 0 (0.0%) |
| Total (Overall) | 1,017 (55.8%) | 804 (44.2%) |
Production, Transportation and Moving Occupations
The most common Production, Transportation and Moving occupations in Belville are Material Moving (147 | 8.1%), Production (76 | 4.2%), and Transportation (18 | 1.0%).
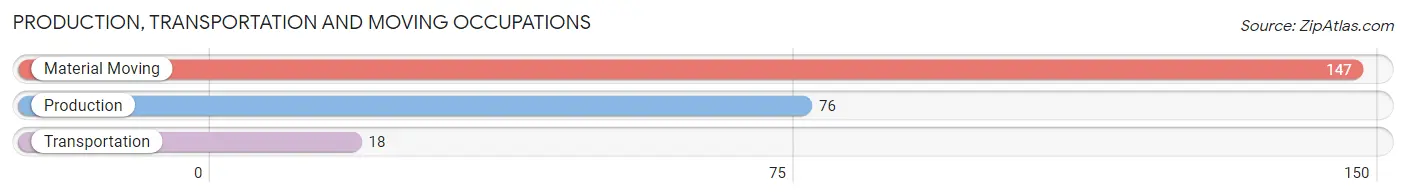
Production, Transportation and Moving Occupations by Sex

| Occupation | Male | Female |
| Production | 61 (80.3%) | 15 (19.7%) |
| Transportation | 18 (100.0%) | 0 (0.0%) |
| Material Moving | 101 (68.7%) | 46 (31.3%) |
| Total (Category) | 180 (74.7%) | 61 (25.3%) |
| Total (Overall) | 1,017 (55.8%) | 804 (44.2%) |
Employment Industries by Sex in Belville
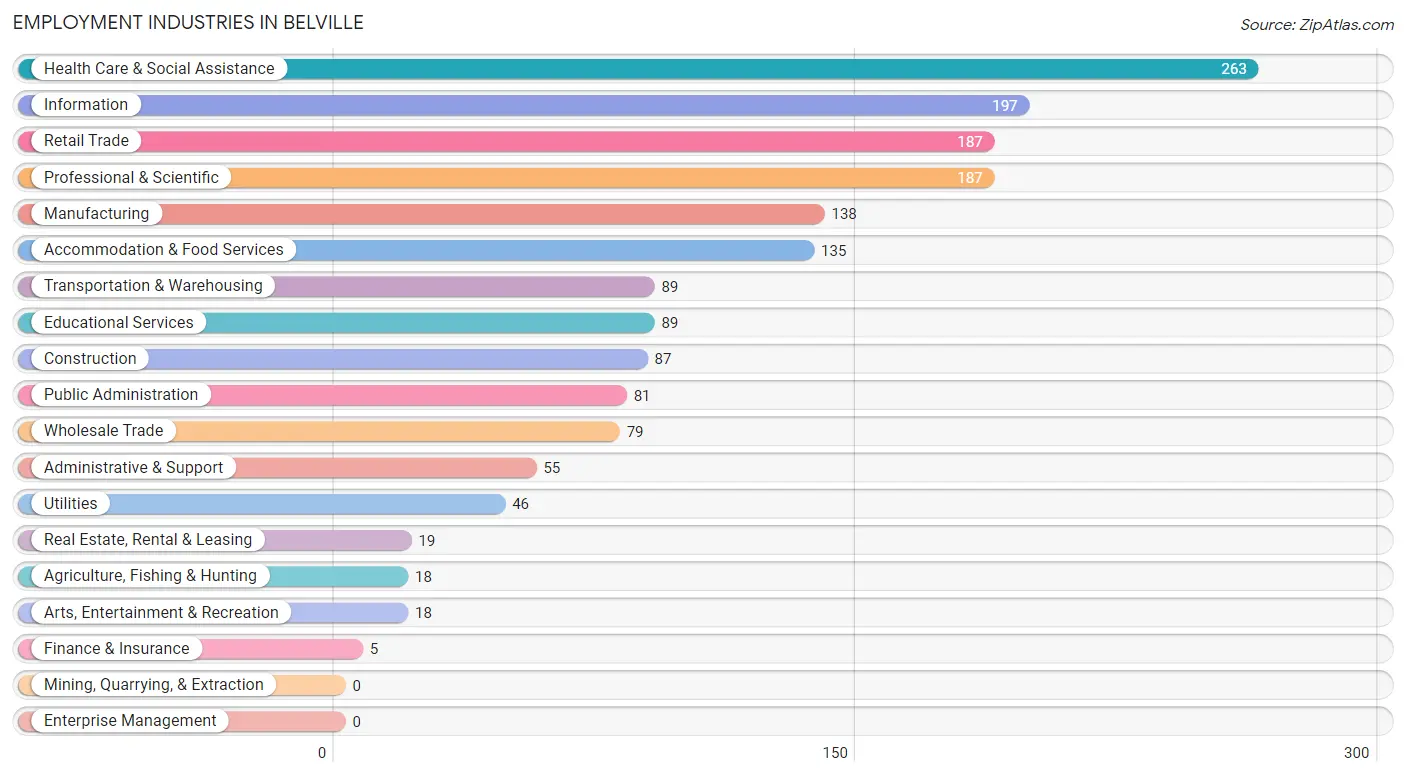
Employment Industries in Belville
The major employment industries in Belville include Health Care & Social Assistance (263 | 14.4%), Information (197 | 10.8%), Retail Trade (187 | 10.3%), Professional & Scientific (187 | 10.3%), and Manufacturing (138 | 7.6%).
Employment Industries by Sex in Belville
The Belville industries that see more men than women are Wholesale Trade (96.2%), Utilities (91.3%), and Administrative & Support (90.9%), whereas the industries that tend to have a higher number of women are Agriculture, Fishing & Hunting (100.0%), Real Estate, Rental & Leasing (100.0%), and Arts, Entertainment & Recreation (100.0%).
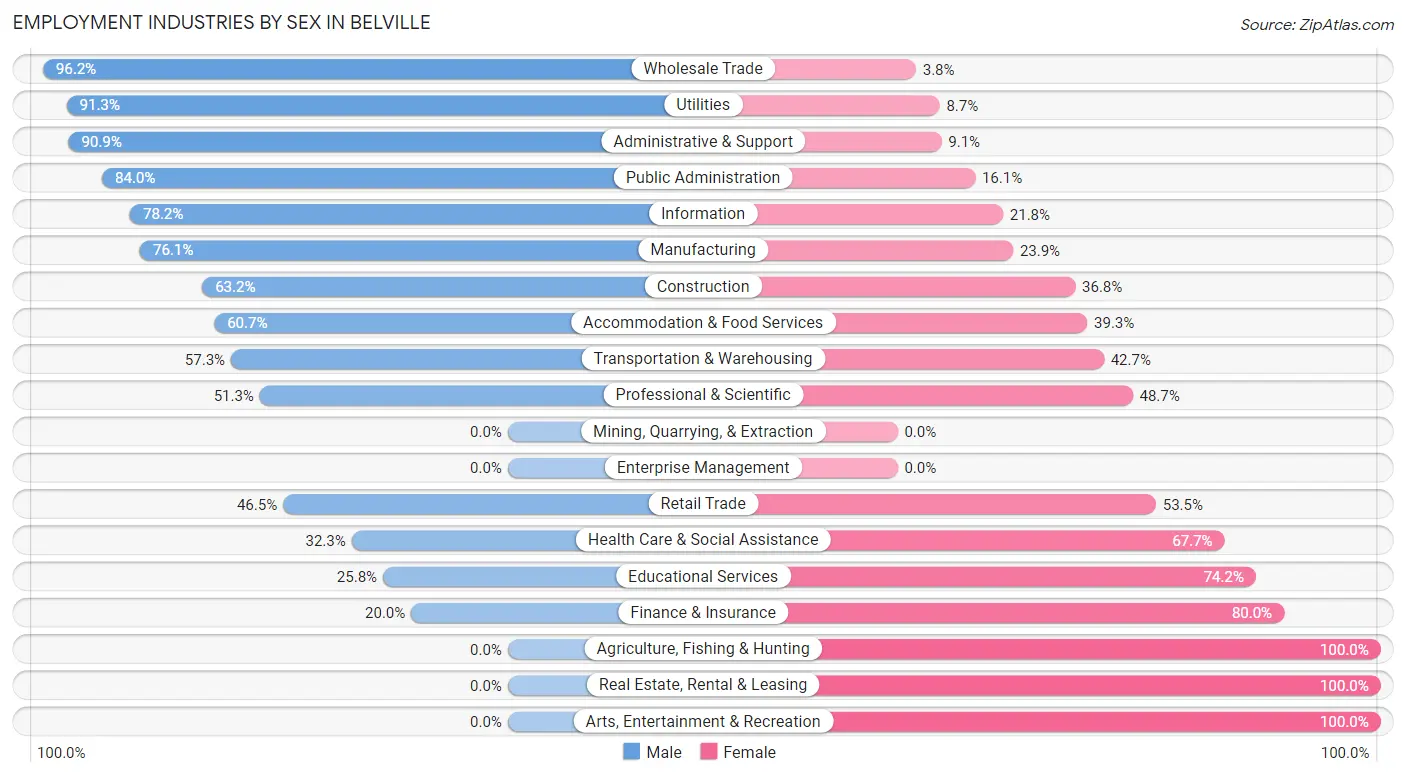
| Industry | Male | Female |
| Agriculture, Fishing & Hunting | 0 (0.0%) | 18 (100.0%) |
| Mining, Quarrying, & Extraction | 0 (0.0%) | 0 (0.0%) |
| Construction | 55 (63.2%) | 32 (36.8%) |
| Manufacturing | 105 (76.1%) | 33 (23.9%) |
| Wholesale Trade | 76 (96.2%) | 3 (3.8%) |
| Retail Trade | 87 (46.5%) | 100 (53.5%) |
| Transportation & Warehousing | 51 (57.3%) | 38 (42.7%) |
| Utilities | 42 (91.3%) | 4 (8.7%) |
| Information | 154 (78.2%) | 43 (21.8%) |
| Finance & Insurance | 1 (20.0%) | 4 (80.0%) |
| Real Estate, Rental & Leasing | 0 (0.0%) | 19 (100.0%) |
| Professional & Scientific | 96 (51.3%) | 91 (48.7%) |
| Enterprise Management | 0 (0.0%) | 0 (0.0%) |
| Administrative & Support | 50 (90.9%) | 5 (9.1%) |
| Educational Services | 23 (25.8%) | 66 (74.2%) |
| Health Care & Social Assistance | 85 (32.3%) | 178 (67.7%) |
| Arts, Entertainment & Recreation | 0 (0.0%) | 18 (100.0%) |
| Accommodation & Food Services | 82 (60.7%) | 53 (39.3%) |
| Public Administration | 68 (84.0%) | 13 (16.1%) |
| Total | 1,017 (55.8%) | 804 (44.2%) |
Education in Belville
School Enrollment in Belville
The most common levels of schooling among the 817 students in Belville are college / undergraduate (268 | 32.8%), high school (184 | 22.5%), and elementary school (129 | 15.8%).
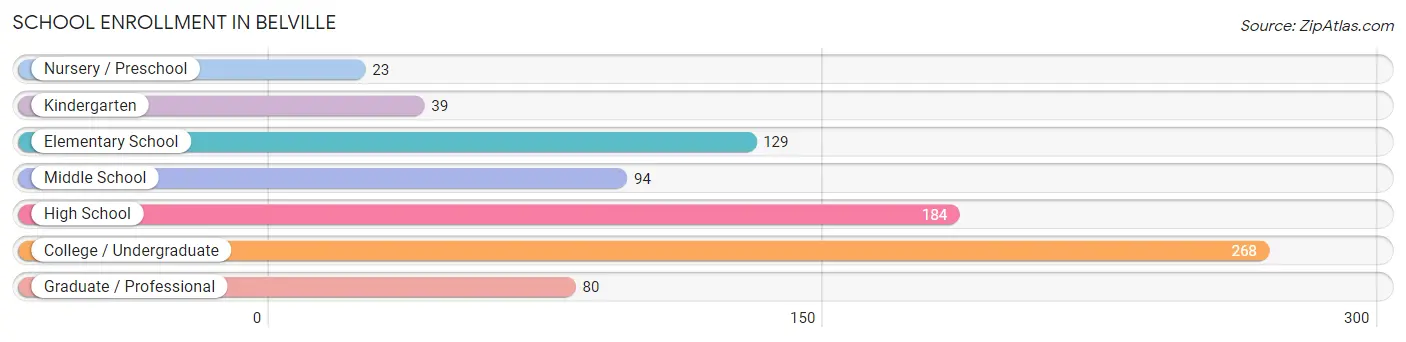
| School Level | # Students | % Students |
| Nursery / Preschool | 23 | 2.8% |
| Kindergarten | 39 | 4.8% |
| Elementary School | 129 | 15.8% |
| Middle School | 94 | 11.5% |
| High School | 184 | 22.5% |
| College / Undergraduate | 268 | 32.8% |
| Graduate / Professional | 80 | 9.8% |
| Total | 817 | 100.0% |
School Enrollment by Age by Funding Source in Belville
Out of a total of 817 students who are enrolled in schools in Belville, 72 (8.8%) attend a private institution, while the remaining 745 (91.2%) are enrolled in public schools. The age group of 3 to 4 year olds has the highest likelihood of being enrolled in private schools, with 16 (100.0% in the age bracket) enrolled. Conversely, the age group of 5 to 9 year old has the lowest likelihood of being enrolled in a private school, with 165 (100.0% in the age bracket) attending a public institution.
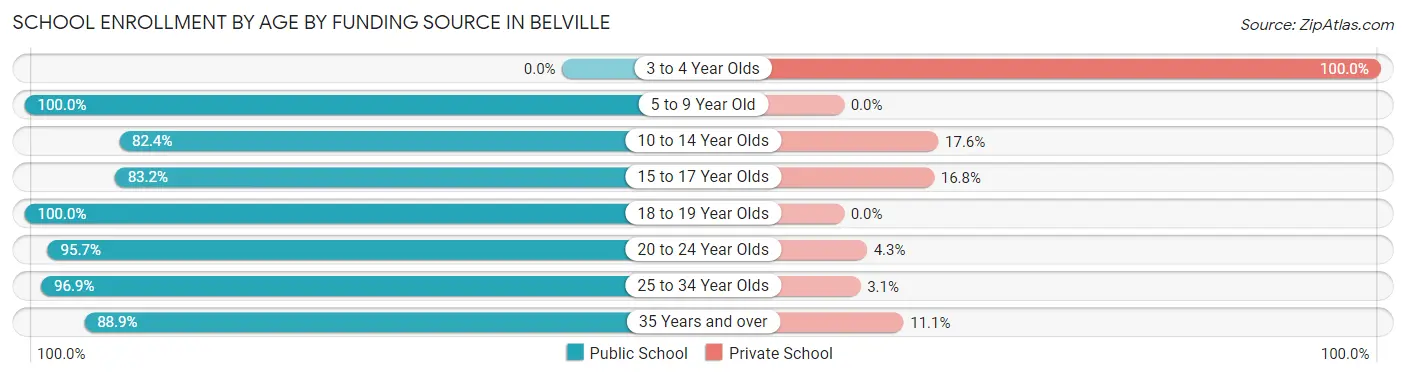
| Age Bracket | Public School | Private School |
| 3 to 4 Year Olds | 0 (0.0%) | 16 (100.0%) |
| 5 to 9 Year Old | 165 (100.0%) | 0 (0.0%) |
| 10 to 14 Year Olds | 89 (82.4%) | 19 (17.6%) |
| 15 to 17 Year Olds | 114 (83.2%) | 23 (16.8%) |
| 18 to 19 Year Olds | 71 (100.0%) | 0 (0.0%) |
| 20 to 24 Year Olds | 156 (95.7%) | 7 (4.3%) |
| 25 to 34 Year Olds | 126 (96.9%) | 4 (3.1%) |
| 35 Years and over | 24 (88.9%) | 3 (11.1%) |
| Total | 745 (91.2%) | 72 (8.8%) |
Educational Attainment by Field of Study in Belville
Business (239 | 25.8%), engineering (116 | 12.5%), liberal arts & history (89 | 9.6%), education (84 | 9.1%), and psychology (80 | 8.6%) are the most common fields of study among 925 individuals in Belville who have obtained a bachelor's degree or higher.
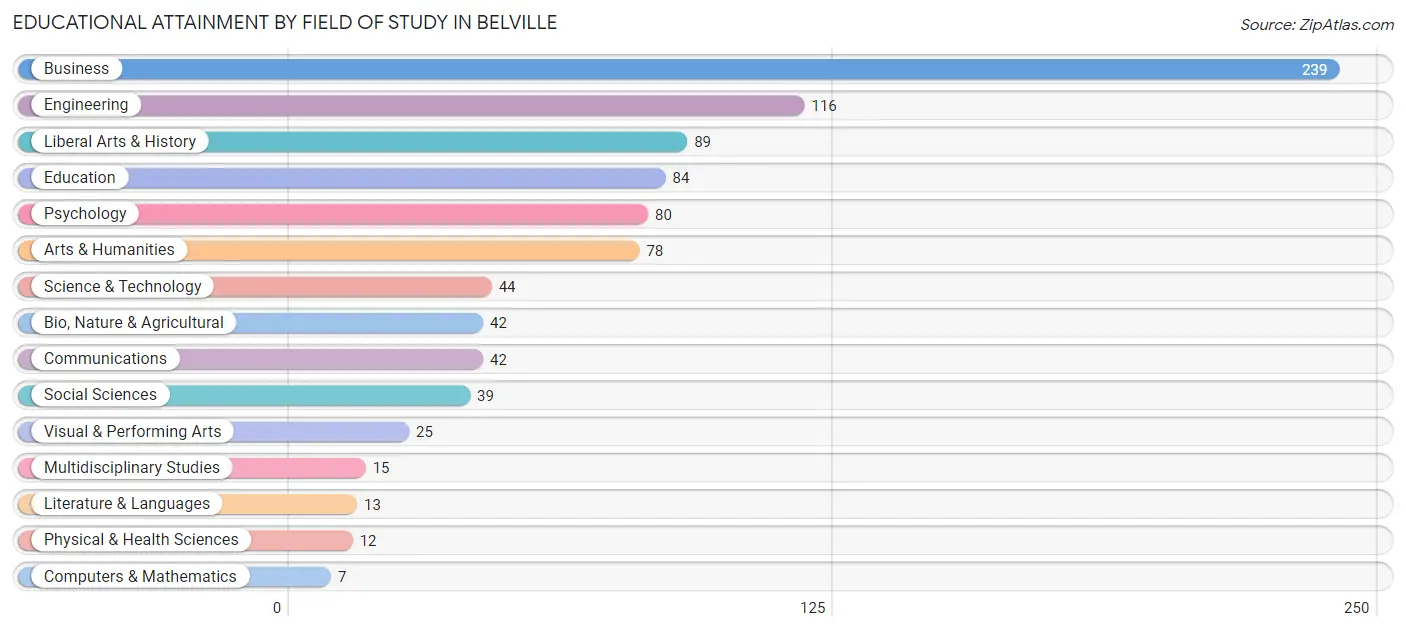
| Field of Study | # Graduates | % Graduates |
| Computers & Mathematics | 7 | 0.8% |
| Bio, Nature & Agricultural | 42 | 4.5% |
| Physical & Health Sciences | 12 | 1.3% |
| Psychology | 80 | 8.6% |
| Social Sciences | 39 | 4.2% |
| Engineering | 116 | 12.5% |
| Multidisciplinary Studies | 15 | 1.6% |
| Science & Technology | 44 | 4.8% |
| Business | 239 | 25.8% |
| Education | 84 | 9.1% |
| Literature & Languages | 13 | 1.4% |
| Liberal Arts & History | 89 | 9.6% |
| Visual & Performing Arts | 25 | 2.7% |
| Communications | 42 | 4.5% |
| Arts & Humanities | 78 | 8.4% |
| Total | 925 | 100.0% |
Transportation & Commute in Belville
Vehicle Availability by Sex in Belville
The most prevalent vehicle ownership categories in Belville are males with 2 vehicles (426, accounting for 42.2%) and females with 2 vehicles (441, making up 55.4%).
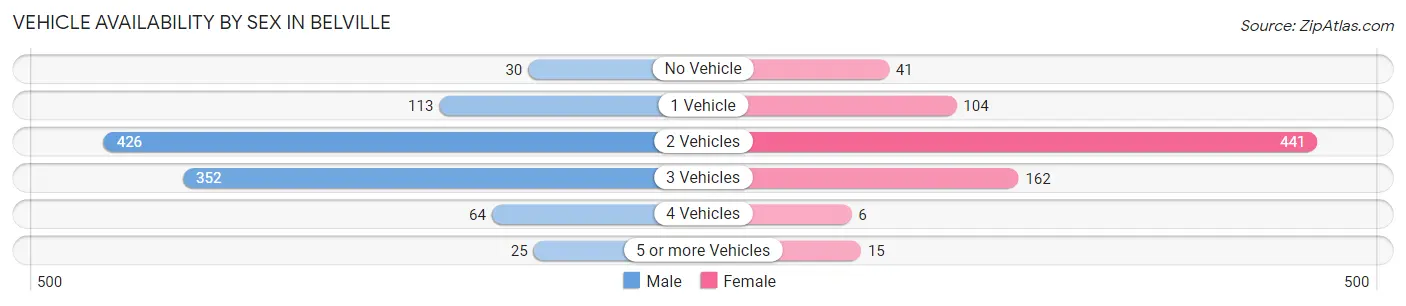
| Vehicles Available | Male | Female |
| No Vehicle | 30 (3.0%) | 41 (5.3%) |
| 1 Vehicle | 113 (11.2%) | 104 (13.5%) |
| 2 Vehicles | 426 (42.2%) | 441 (57.4%) |
| 3 Vehicles | 352 (34.8%) | 162 (21.1%) |
| 4 Vehicles | 64 (6.3%) | 6 (0.8%) |
| 5 or more Vehicles | 25 (2.5%) | 15 (1.9%) |
| Total | 1,010 (100.0%) | 769 (100.0%) |
Commute Time in Belville
The most frequently occuring commute durations in Belville are 20 to 24 minutes (440 commuters, 26.0%), 15 to 19 minutes (398 commuters, 23.5%), and 10 to 14 minutes (174 commuters, 10.3%).
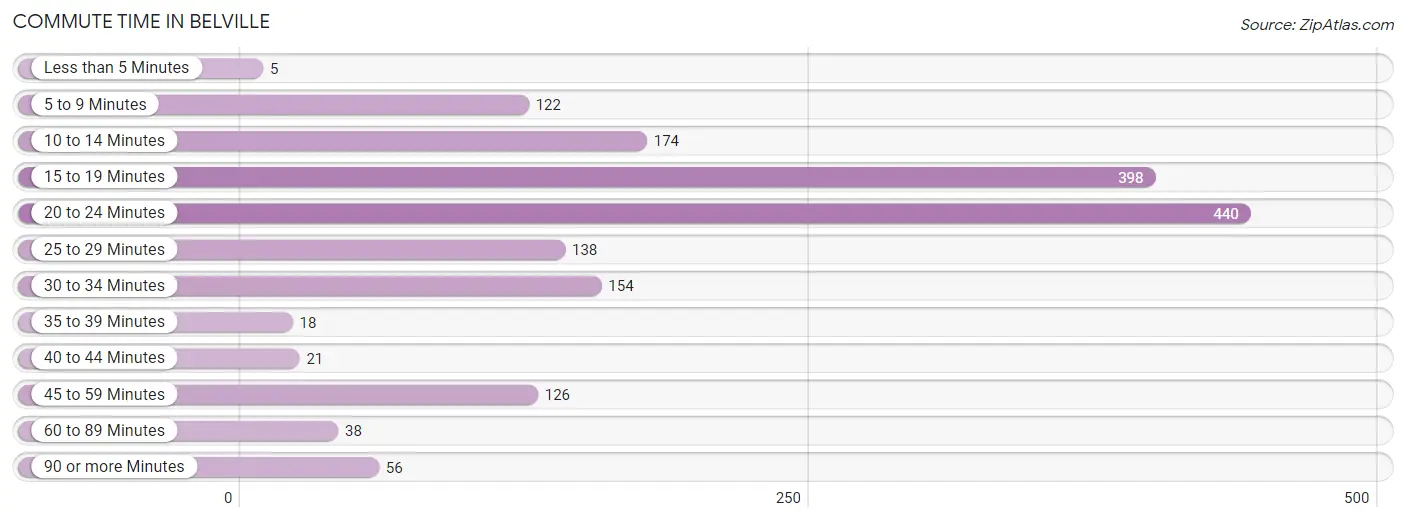
| Commute Time | # Commuters | % Commuters |
| Less than 5 Minutes | 5 | 0.3% |
| 5 to 9 Minutes | 122 | 7.2% |
| 10 to 14 Minutes | 174 | 10.3% |
| 15 to 19 Minutes | 398 | 23.5% |
| 20 to 24 Minutes | 440 | 26.0% |
| 25 to 29 Minutes | 138 | 8.2% |
| 30 to 34 Minutes | 154 | 9.1% |
| 35 to 39 Minutes | 18 | 1.1% |
| 40 to 44 Minutes | 21 | 1.2% |
| 45 to 59 Minutes | 126 | 7.5% |
| 60 to 89 Minutes | 38 | 2.2% |
| 90 or more Minutes | 56 | 3.3% |
Commute Time by Sex in Belville
The most common commute times in Belville are 20 to 24 minutes (308 commuters, 32.0%) for males and 15 to 19 minutes (180 commuters, 24.8%) for females.
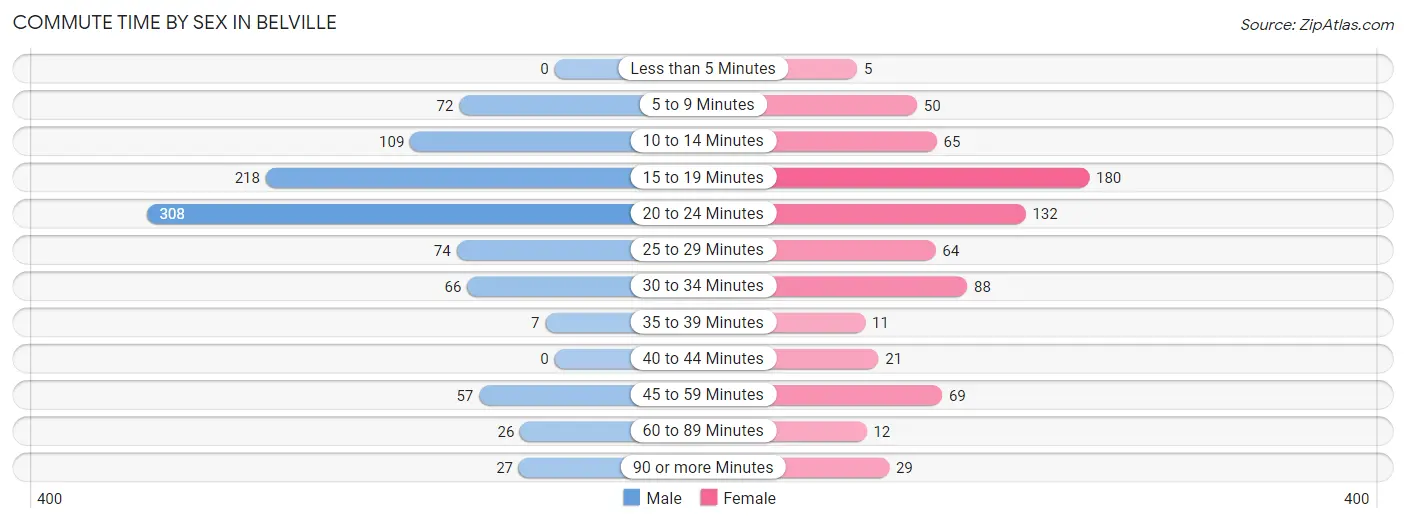
| Commute Time | Male | Female |
| Less than 5 Minutes | 0 (0.0%) | 5 (0.7%) |
| 5 to 9 Minutes | 72 (7.5%) | 50 (6.9%) |
| 10 to 14 Minutes | 109 (11.3%) | 65 (8.9%) |
| 15 to 19 Minutes | 218 (22.6%) | 180 (24.8%) |
| 20 to 24 Minutes | 308 (32.0%) | 132 (18.2%) |
| 25 to 29 Minutes | 74 (7.7%) | 64 (8.8%) |
| 30 to 34 Minutes | 66 (6.9%) | 88 (12.1%) |
| 35 to 39 Minutes | 7 (0.7%) | 11 (1.5%) |
| 40 to 44 Minutes | 0 (0.0%) | 21 (2.9%) |
| 45 to 59 Minutes | 57 (5.9%) | 69 (9.5%) |
| 60 to 89 Minutes | 26 (2.7%) | 12 (1.7%) |
| 90 or more Minutes | 27 (2.8%) | 29 (4.0%) |
Time of Departure to Work by Sex in Belville
The most frequent times of departure to work in Belville are 6:30 AM to 6:59 AM (186, 19.3%) for males and 7:00 AM to 7:29 AM (183, 25.2%) for females.
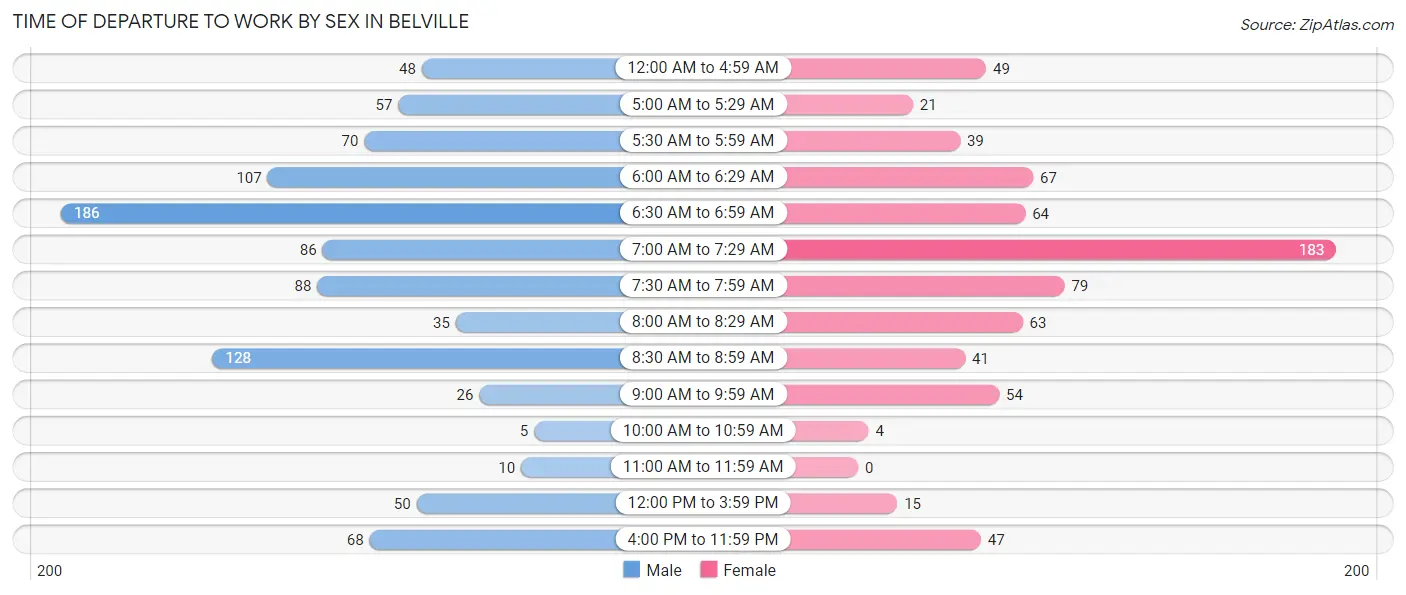
| Time of Departure | Male | Female |
| 12:00 AM to 4:59 AM | 48 (5.0%) | 49 (6.8%) |
| 5:00 AM to 5:29 AM | 57 (5.9%) | 21 (2.9%) |
| 5:30 AM to 5:59 AM | 70 (7.3%) | 39 (5.4%) |
| 6:00 AM to 6:29 AM | 107 (11.1%) | 67 (9.2%) |
| 6:30 AM to 6:59 AM | 186 (19.3%) | 64 (8.8%) |
| 7:00 AM to 7:29 AM | 86 (8.9%) | 183 (25.2%) |
| 7:30 AM to 7:59 AM | 88 (9.1%) | 79 (10.9%) |
| 8:00 AM to 8:29 AM | 35 (3.6%) | 63 (8.7%) |
| 8:30 AM to 8:59 AM | 128 (13.3%) | 41 (5.7%) |
| 9:00 AM to 9:59 AM | 26 (2.7%) | 54 (7.4%) |
| 10:00 AM to 10:59 AM | 5 (0.5%) | 4 (0.5%) |
| 11:00 AM to 11:59 AM | 10 (1.0%) | 0 (0.0%) |
| 12:00 PM to 3:59 PM | 50 (5.2%) | 15 (2.1%) |
| 4:00 PM to 11:59 PM | 68 (7.0%) | 47 (6.5%) |
| Total | 964 (100.0%) | 726 (100.0%) |
Housing Occupancy in Belville
Occupancy by Ownership in Belville
Of the total 1,266 dwellings in Belville, owner-occupied units account for 798 (63.0%), while renter-occupied units make up 468 (37.0%).
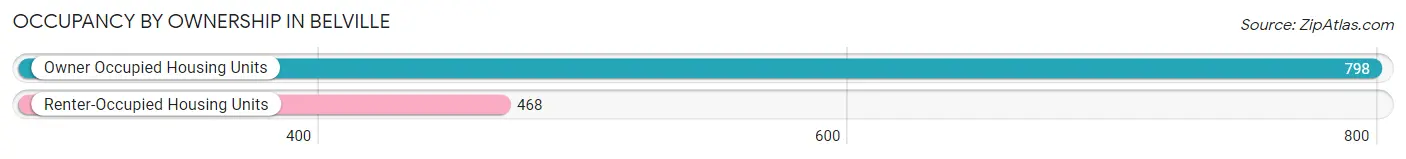
| Occupancy | # Housing Units | % Housing Units |
| Owner Occupied Housing Units | 798 | 63.0% |
| Renter-Occupied Housing Units | 468 | 37.0% |
| Total Occupied Housing Units | 1,266 | 100.0% |
Occupancy by Household Size in Belville
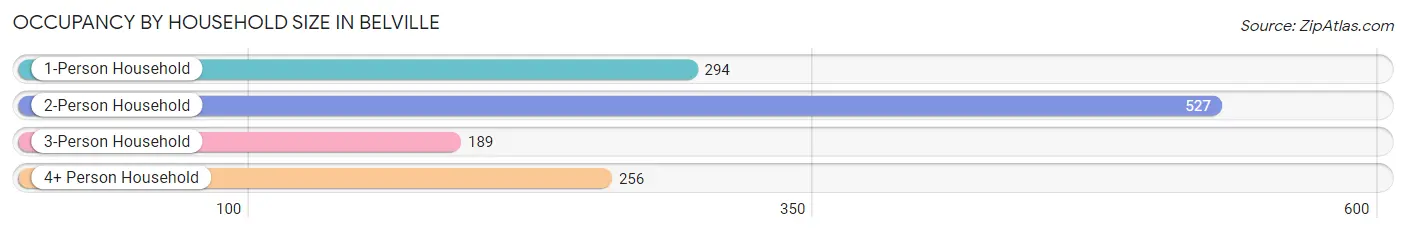
| Household Size | # Housing Units | % Housing Units |
| 1-Person Household | 294 | 23.2% |
| 2-Person Household | 527 | 41.6% |
| 3-Person Household | 189 | 14.9% |
| 4+ Person Household | 256 | 20.2% |
| Total Housing Units | 1,266 | 100.0% |
Occupancy by Ownership by Household Size in Belville
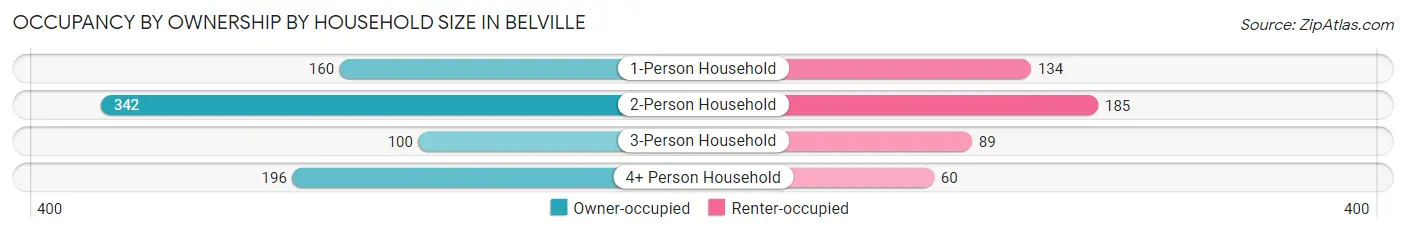
| Household Size | Owner-occupied | Renter-occupied |
| 1-Person Household | 160 (54.4%) | 134 (45.6%) |
| 2-Person Household | 342 (64.9%) | 185 (35.1%) |
| 3-Person Household | 100 (52.9%) | 89 (47.1%) |
| 4+ Person Household | 196 (76.6%) | 60 (23.4%) |
| Total Housing Units | 798 (63.0%) | 468 (37.0%) |
Occupancy by Educational Attainment in Belville
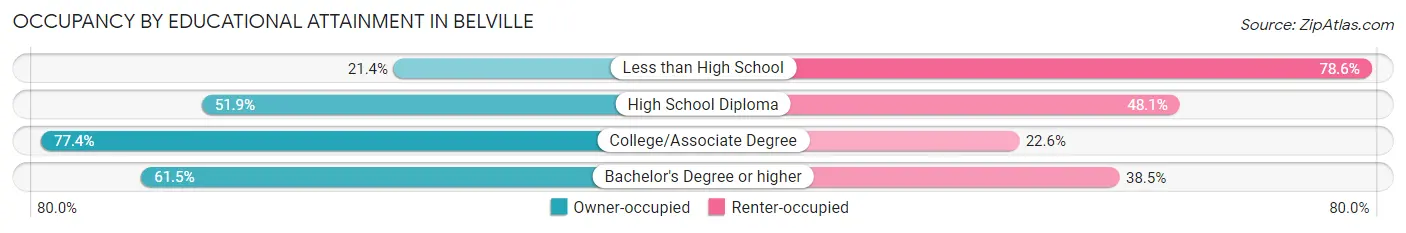
| Household Size | Owner-occupied | Renter-occupied |
| Less than High School | 21 (21.4%) | 77 (78.6%) |
| High School Diploma | 96 (51.9%) | 89 (48.1%) |
| College/Associate Degree | 373 (77.4%) | 109 (22.6%) |
| Bachelor's Degree or higher | 308 (61.5%) | 193 (38.5%) |
Occupancy by Age of Householder in Belville
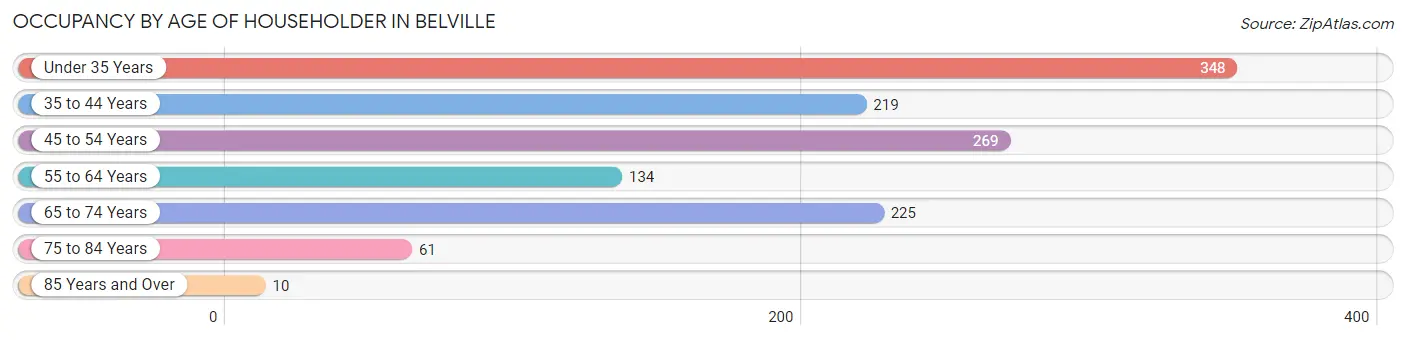
| Age Bracket | # Households | % Households |
| Under 35 Years | 348 | 27.5% |
| 35 to 44 Years | 219 | 17.3% |
| 45 to 54 Years | 269 | 21.2% |
| 55 to 64 Years | 134 | 10.6% |
| 65 to 74 Years | 225 | 17.8% |
| 75 to 84 Years | 61 | 4.8% |
| 85 Years and Over | 10 | 0.8% |
| Total | 1,266 | 100.0% |
Housing Finances in Belville
Median Income by Occupancy in Belville
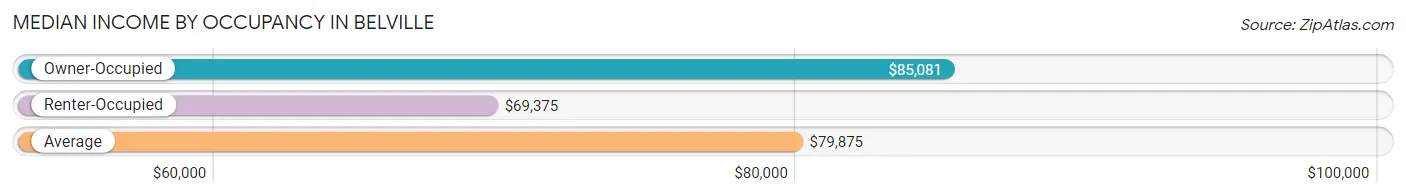
| Occupancy Type | # Households | Median Income |
| Owner-Occupied | 798 (63.0%) | $85,081 |
| Renter-Occupied | 468 (37.0%) | $69,375 |
| Average | 1,266 (100.0%) | $79,875 |
Occupancy by Householder Income Bracket in Belville
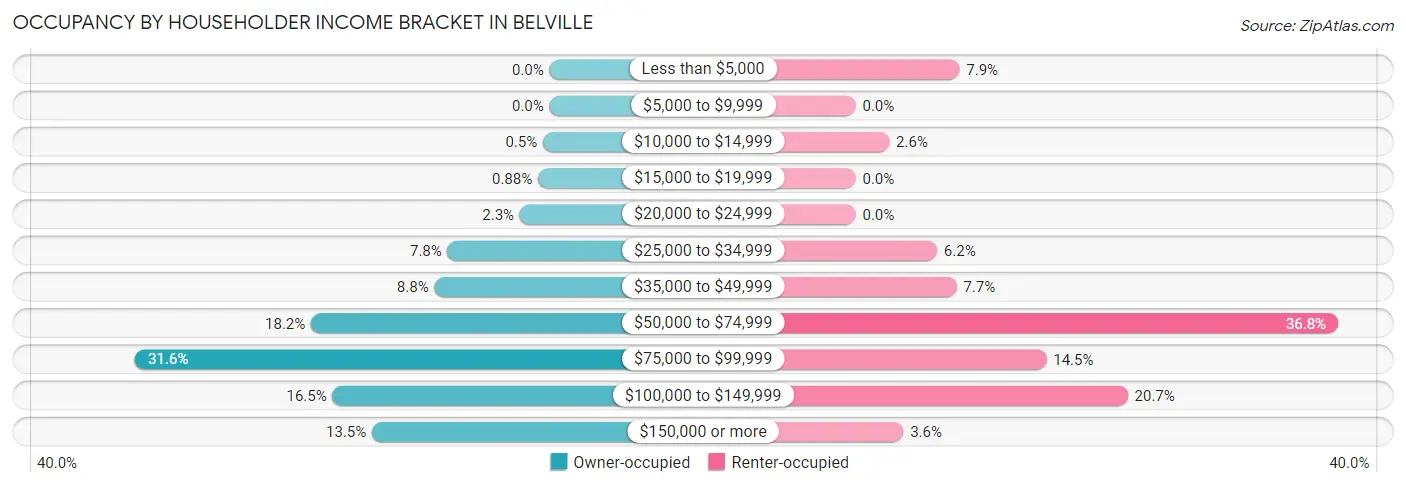
| Income Bracket | Owner-occupied | Renter-occupied |
| Less than $5,000 | 0 (0.0%) | 37 (7.9%) |
| $5,000 to $9,999 | 0 (0.0%) | 0 (0.0%) |
| $10,000 to $14,999 | 4 (0.5%) | 12 (2.6%) |
| $15,000 to $19,999 | 7 (0.9%) | 0 (0.0%) |
| $20,000 to $24,999 | 18 (2.3%) | 0 (0.0%) |
| $25,000 to $34,999 | 62 (7.8%) | 29 (6.2%) |
| $35,000 to $49,999 | 70 (8.8%) | 36 (7.7%) |
| $50,000 to $74,999 | 145 (18.2%) | 172 (36.7%) |
| $75,000 to $99,999 | 252 (31.6%) | 68 (14.5%) |
| $100,000 to $149,999 | 132 (16.5%) | 97 (20.7%) |
| $150,000 or more | 108 (13.5%) | 17 (3.6%) |
| Total | 798 (100.0%) | 468 (100.0%) |
Monthly Housing Cost Tiers in Belville
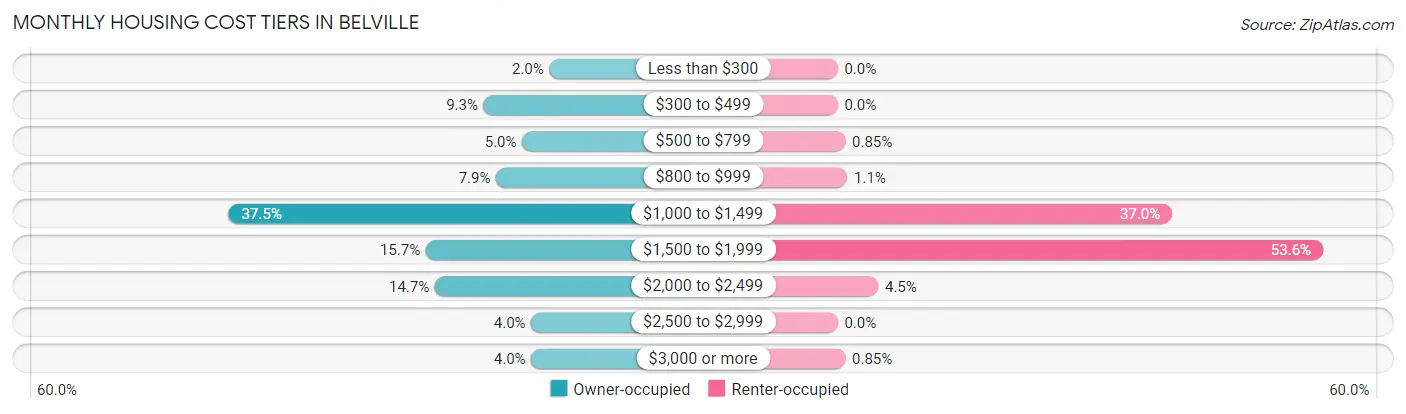
| Monthly Cost | Owner-occupied | Renter-occupied |
| Less than $300 | 16 (2.0%) | 0 (0.0%) |
| $300 to $499 | 74 (9.3%) | 0 (0.0%) |
| $500 to $799 | 40 (5.0%) | 4 (0.9%) |
| $800 to $999 | 63 (7.9%) | 5 (1.1%) |
| $1,000 to $1,499 | 299 (37.5%) | 173 (37.0%) |
| $1,500 to $1,999 | 125 (15.7%) | 251 (53.6%) |
| $2,000 to $2,499 | 117 (14.7%) | 21 (4.5%) |
| $2,500 to $2,999 | 32 (4.0%) | 0 (0.0%) |
| $3,000 or more | 32 (4.0%) | 4 (0.9%) |
| Total | 798 (100.0%) | 468 (100.0%) |
Physical Housing Characteristics in Belville
Housing Structures in Belville
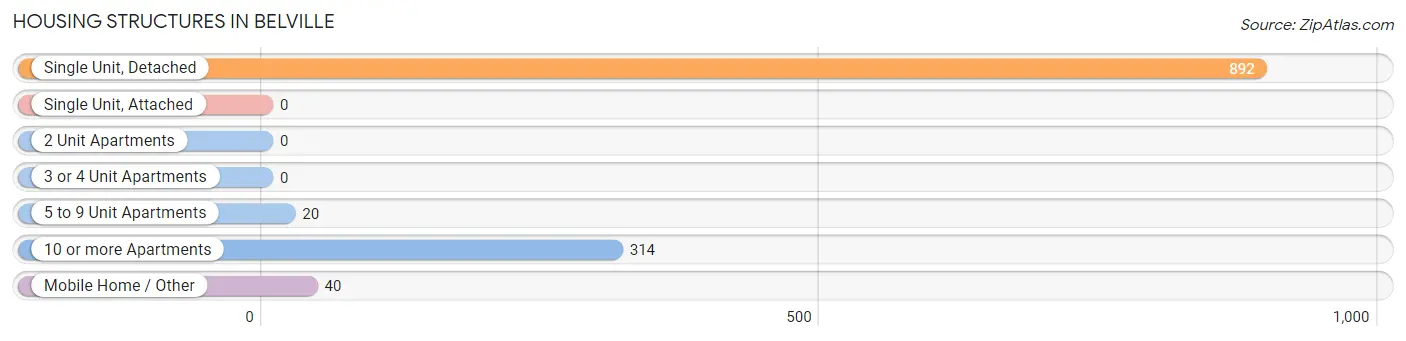
| Structure Type | # Housing Units | % Housing Units |
| Single Unit, Detached | 892 | 70.5% |
| Single Unit, Attached | 0 | 0.0% |
| 2 Unit Apartments | 0 | 0.0% |
| 3 or 4 Unit Apartments | 0 | 0.0% |
| 5 to 9 Unit Apartments | 20 | 1.6% |
| 10 or more Apartments | 314 | 24.8% |
| Mobile Home / Other | 40 | 3.2% |
| Total | 1,266 | 100.0% |
Housing Structures by Occupancy in Belville
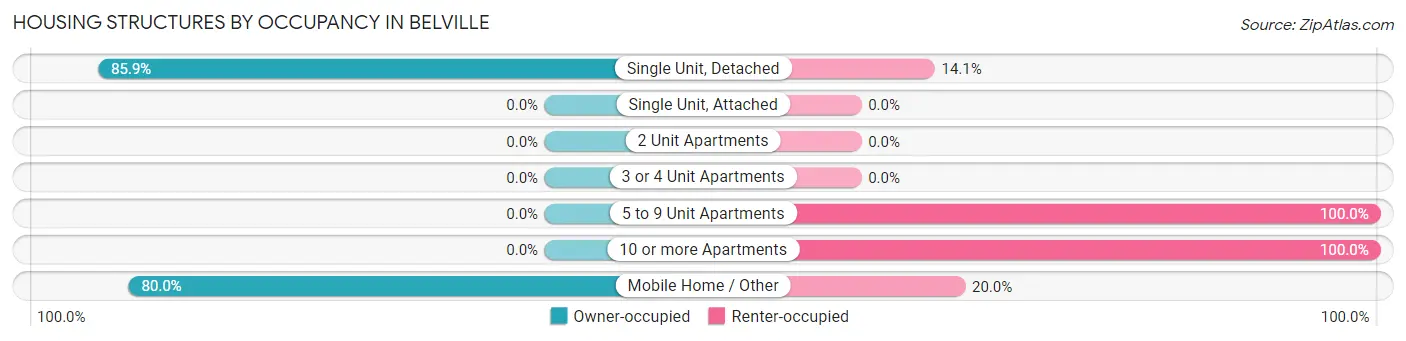
| Structure Type | Owner-occupied | Renter-occupied |
| Single Unit, Detached | 766 (85.9%) | 126 (14.1%) |
| Single Unit, Attached | 0 (0.0%) | 0 (0.0%) |
| 2 Unit Apartments | 0 (0.0%) | 0 (0.0%) |
| 3 or 4 Unit Apartments | 0 (0.0%) | 0 (0.0%) |
| 5 to 9 Unit Apartments | 0 (0.0%) | 20 (100.0%) |
| 10 or more Apartments | 0 (0.0%) | 314 (100.0%) |
| Mobile Home / Other | 32 (80.0%) | 8 (20.0%) |
| Total | 798 (63.0%) | 468 (37.0%) |
Housing Structures by Number of Rooms in Belville
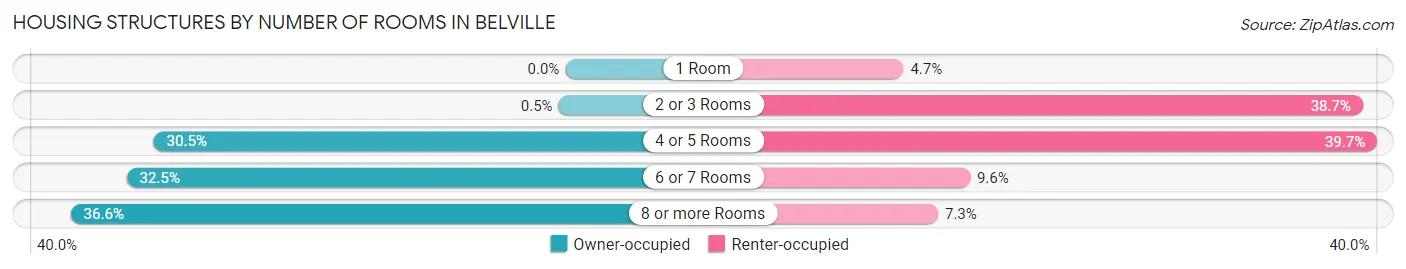
| Number of Rooms | Owner-occupied | Renter-occupied |
| 1 Room | 0 (0.0%) | 22 (4.7%) |
| 2 or 3 Rooms | 4 (0.5%) | 181 (38.7%) |
| 4 or 5 Rooms | 243 (30.4%) | 186 (39.7%) |
| 6 or 7 Rooms | 259 (32.5%) | 45 (9.6%) |
| 8 or more Rooms | 292 (36.6%) | 34 (7.3%) |
| Total | 798 (100.0%) | 468 (100.0%) |
Housing Structure by Heating Type in Belville
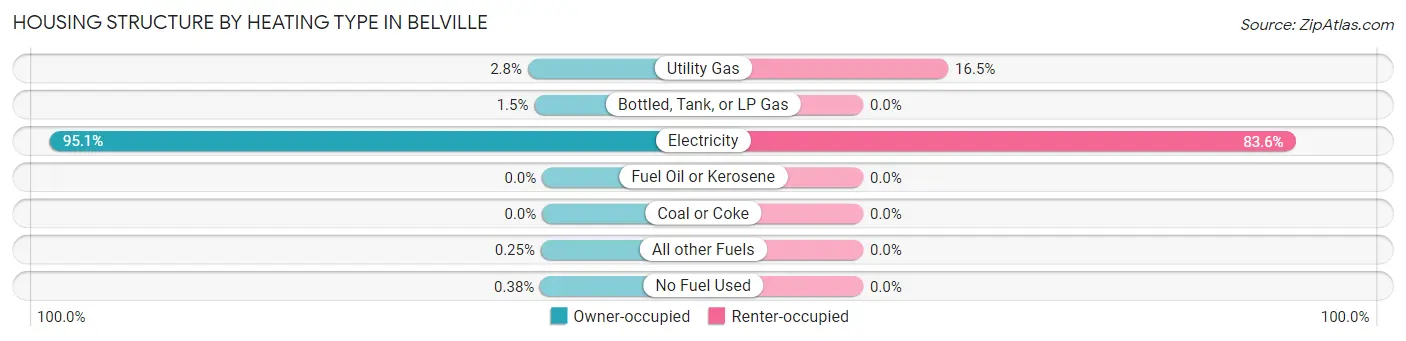
| Heating Type | Owner-occupied | Renter-occupied |
| Utility Gas | 22 (2.8%) | 77 (16.5%) |
| Bottled, Tank, or LP Gas | 12 (1.5%) | 0 (0.0%) |
| Electricity | 759 (95.1%) | 391 (83.6%) |
| Fuel Oil or Kerosene | 0 (0.0%) | 0 (0.0%) |
| Coal or Coke | 0 (0.0%) | 0 (0.0%) |
| All other Fuels | 2 (0.3%) | 0 (0.0%) |
| No Fuel Used | 3 (0.4%) | 0 (0.0%) |
| Total | 798 (100.0%) | 468 (100.0%) |
Household Vehicle Usage in Belville
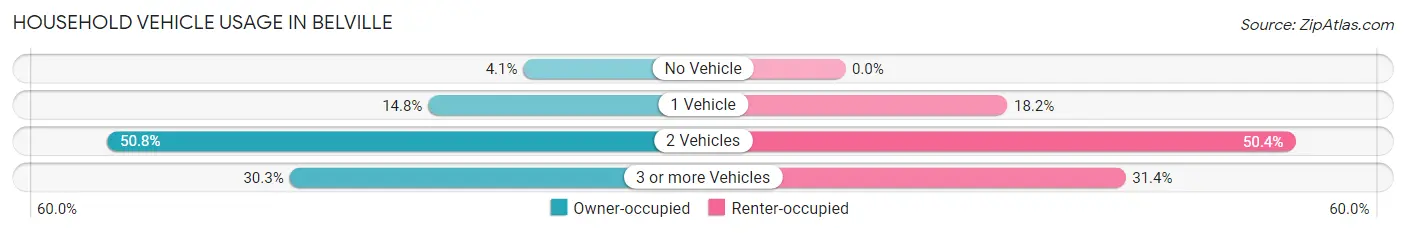
| Vehicles per Household | Owner-occupied | Renter-occupied |
| No Vehicle | 33 (4.1%) | 0 (0.0%) |
| 1 Vehicle | 118 (14.8%) | 85 (18.2%) |
| 2 Vehicles | 405 (50.7%) | 236 (50.4%) |
| 3 or more Vehicles | 242 (30.3%) | 147 (31.4%) |
| Total | 798 (100.0%) | 468 (100.0%) |
Real Estate & Mortgages in Belville
Real Estate and Mortgage Overview in Belville
| Characteristic | Without Mortgage | With Mortgage |
| Housing Units | 112 | 686 |
| Median Property Value | $191,100 | $241,800 |
| Median Household Income | $65,682 | $99 |
| Monthly Housing Costs | $407 | $32 |
| Real Estate Taxes | $1,304 | $8 |
Property Value by Mortgage Status in Belville
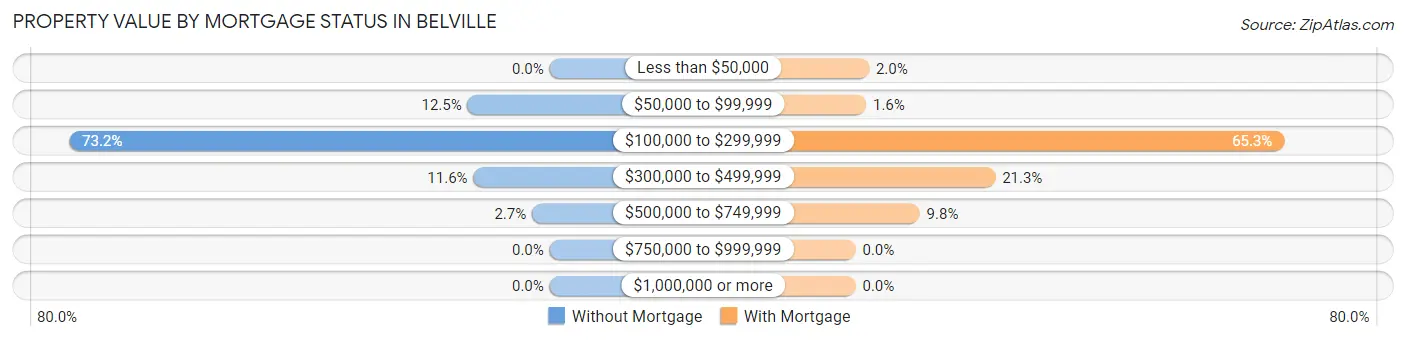
| Property Value | Without Mortgage | With Mortgage |
| Less than $50,000 | 0 (0.0%) | 14 (2.0%) |
| $50,000 to $99,999 | 14 (12.5%) | 11 (1.6%) |
| $100,000 to $299,999 | 82 (73.2%) | 448 (65.3%) |
| $300,000 to $499,999 | 13 (11.6%) | 146 (21.3%) |
| $500,000 to $749,999 | 3 (2.7%) | 67 (9.8%) |
| $750,000 to $999,999 | 0 (0.0%) | 0 (0.0%) |
| $1,000,000 or more | 0 (0.0%) | 0 (0.0%) |
| Total | 112 (100.0%) | 686 (100.0%) |
Household Income by Mortgage Status in Belville
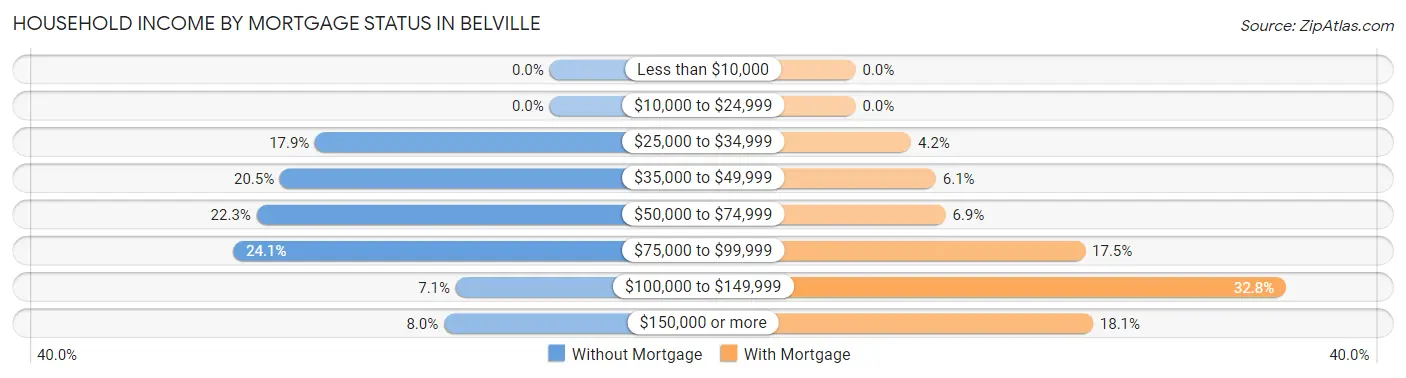
| Household Income | Without Mortgage | With Mortgage |
| Less than $10,000 | 0 (0.0%) | 0 (0.0%) |
| $10,000 to $24,999 | 0 (0.0%) | 0 (0.0%) |
| $25,000 to $34,999 | 20 (17.9%) | 29 (4.2%) |
| $35,000 to $49,999 | 23 (20.5%) | 42 (6.1%) |
| $50,000 to $74,999 | 25 (22.3%) | 47 (6.9%) |
| $75,000 to $99,999 | 27 (24.1%) | 120 (17.5%) |
| $100,000 to $149,999 | 8 (7.1%) | 225 (32.8%) |
| $150,000 or more | 9 (8.0%) | 124 (18.1%) |
| Total | 112 (100.0%) | 686 (100.0%) |
Property Value to Household Income Ratio in Belville
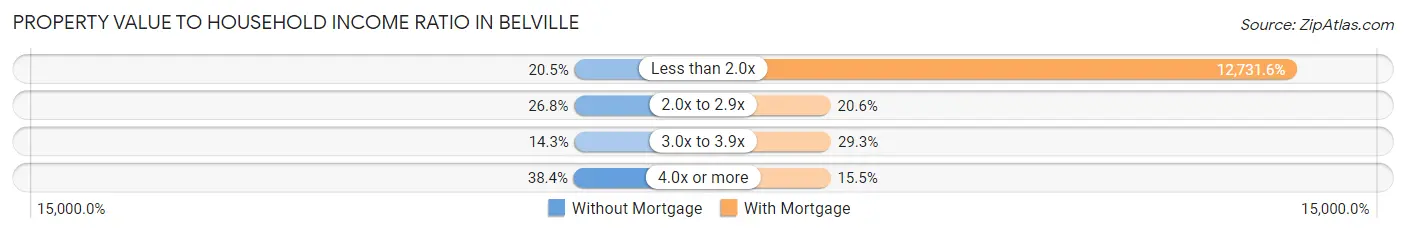
| Value-to-Income Ratio | Without Mortgage | With Mortgage |
| Less than 2.0x | 23 (20.5%) | 87,339 (12,731.6%) |
| 2.0x to 2.9x | 30 (26.8%) | 141 (20.5%) |
| 3.0x to 3.9x | 16 (14.3%) | 201 (29.3%) |
| 4.0x or more | 43 (38.4%) | 106 (15.4%) |
| Total | 112 (100.0%) | 686 (100.0%) |
Real Estate Taxes by Mortgage Status in Belville
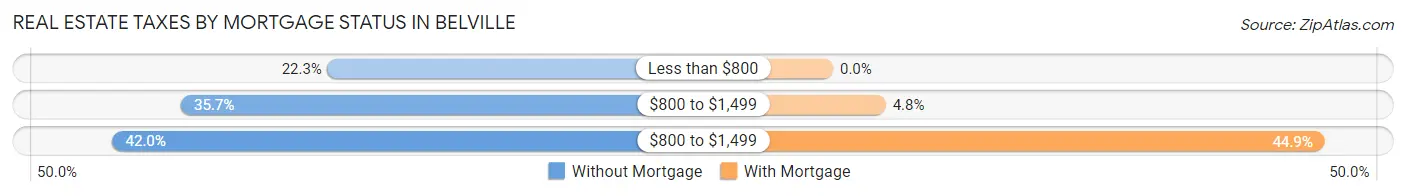
| Property Taxes | Without Mortgage | With Mortgage |
| Less than $800 | 25 (22.3%) | 0 (0.0%) |
| $800 to $1,499 | 40 (35.7%) | 33 (4.8%) |
| $800 to $1,499 | 47 (42.0%) | 308 (44.9%) |
| Total | 112 (100.0%) | 686 (100.0%) |
Health & Disability in Belville
Health Insurance Coverage by Age in Belville
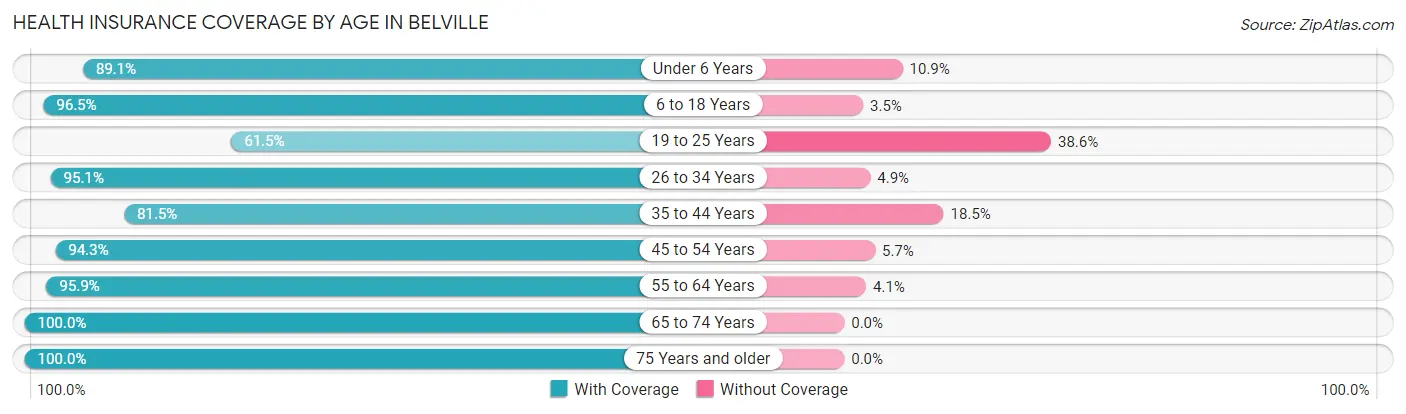
| Age Bracket | With Coverage | Without Coverage |
| Under 6 Years | 197 (89.1%) | 24 (10.9%) |
| 6 to 18 Years | 467 (96.5%) | 17 (3.5%) |
| 19 to 25 Years | 322 (61.5%) | 202 (38.6%) |
| 26 to 34 Years | 509 (95.1%) | 26 (4.9%) |
| 35 to 44 Years | 343 (81.5%) | 78 (18.5%) |
| 45 to 54 Years | 362 (94.3%) | 22 (5.7%) |
| 55 to 64 Years | 283 (95.9%) | 12 (4.1%) |
| 65 to 74 Years | 362 (100.0%) | 0 (0.0%) |
| 75 Years and older | 154 (100.0%) | 0 (0.0%) |
| Total | 2,999 (88.7%) | 381 (11.3%) |
Health Insurance Coverage by Citizenship Status in Belville
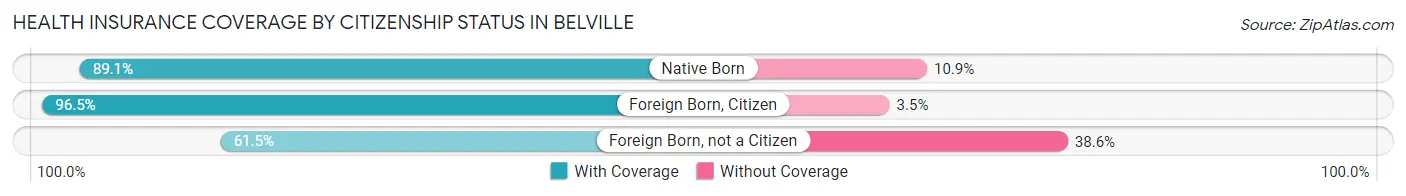
| Citizenship Status | With Coverage | Without Coverage |
| Native Born | 197 (89.1%) | 24 (10.9%) |
| Foreign Born, Citizen | 467 (96.5%) | 17 (3.5%) |
| Foreign Born, not a Citizen | 322 (61.5%) | 202 (38.6%) |
Health Insurance Coverage by Household Income in Belville
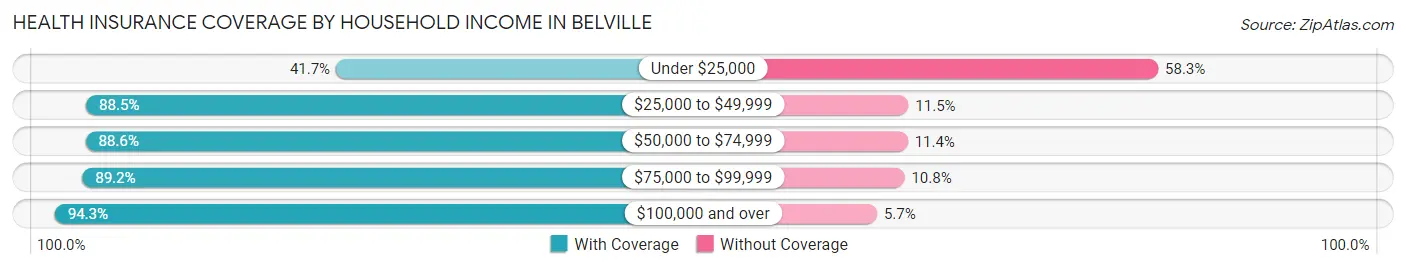
| Household Income | With Coverage | Without Coverage |
| Under $25,000 | 50 (41.7%) | 70 (58.3%) |
| $25,000 to $49,999 | 368 (88.5%) | 48 (11.5%) |
| $50,000 to $74,999 | 823 (88.6%) | 106 (11.4%) |
| $75,000 to $99,999 | 842 (89.2%) | 102 (10.8%) |
| $100,000 and over | 916 (94.3%) | 55 (5.7%) |
Public vs Private Health Insurance Coverage by Age in Belville
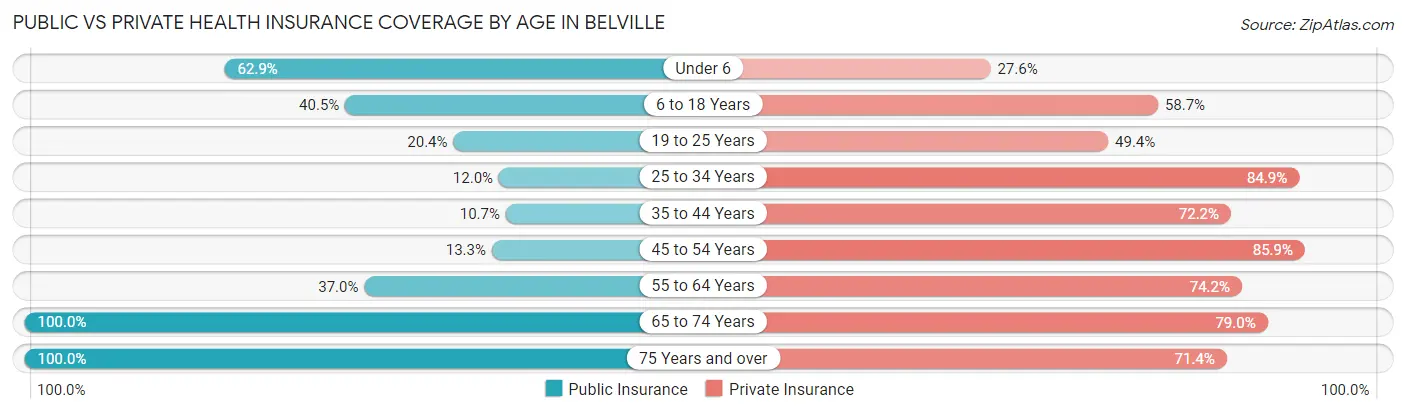
| Age Bracket | Public Insurance | Private Insurance |
| Under 6 | 139 (62.9%) | 61 (27.6%) |
| 6 to 18 Years | 196 (40.5%) | 284 (58.7%) |
| 19 to 25 Years | 107 (20.4%) | 259 (49.4%) |
| 25 to 34 Years | 64 (12.0%) | 454 (84.9%) |
| 35 to 44 Years | 45 (10.7%) | 304 (72.2%) |
| 45 to 54 Years | 51 (13.3%) | 330 (85.9%) |
| 55 to 64 Years | 109 (36.9%) | 219 (74.2%) |
| 65 to 74 Years | 362 (100.0%) | 286 (79.0%) |
| 75 Years and over | 154 (100.0%) | 110 (71.4%) |
| Total | 1,227 (36.3%) | 2,307 (68.2%) |
Disability Status by Sex by Age in Belville
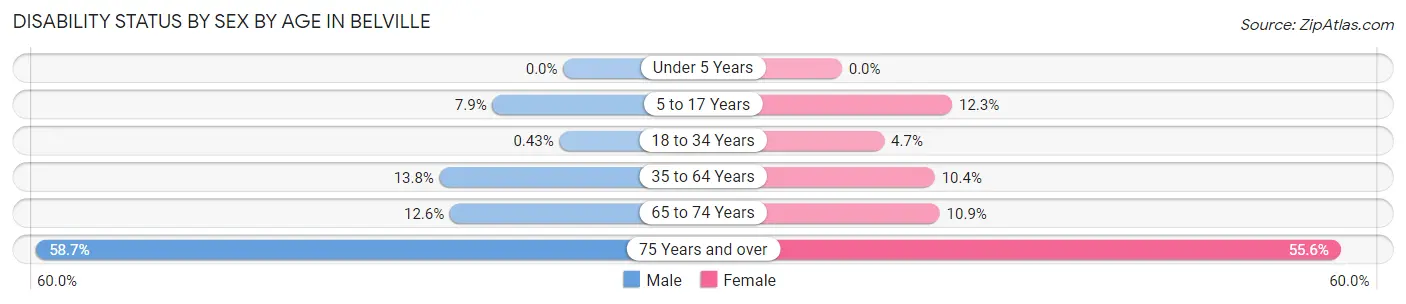
| Age Bracket | Male | Female |
| Under 5 Years | 0 (0.0%) | 0 (0.0%) |
| 5 to 17 Years | 15 (7.9%) | 28 (12.3%) |
| 18 to 34 Years | 3 (0.4%) | 21 (4.7%) |
| 35 to 64 Years | 65 (13.8%) | 65 (10.3%) |
| 65 to 74 Years | 26 (12.6%) | 17 (10.9%) |
| 75 Years and over | 27 (58.7%) | 60 (55.6%) |
Disability Class by Sex by Age in Belville
Disability Class: Hearing Difficulty
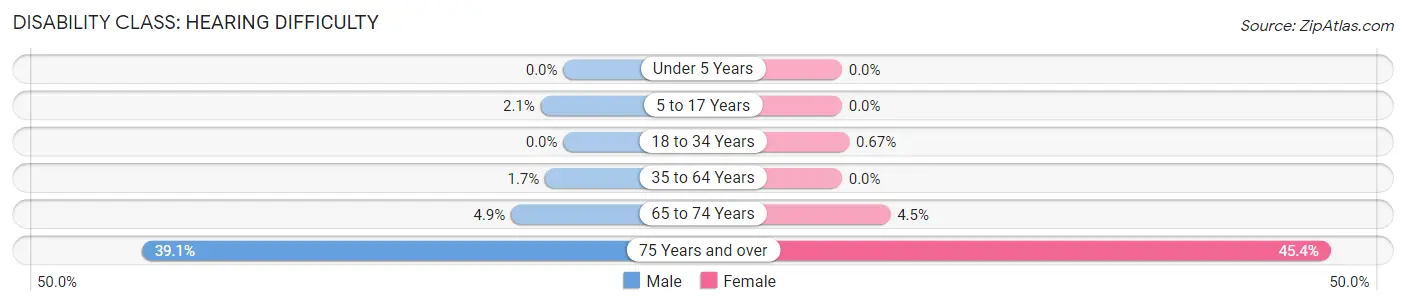
| Age Bracket | Male | Female |
| Under 5 Years | 0 (0.0%) | 0 (0.0%) |
| 5 to 17 Years | 4 (2.1%) | 0 (0.0%) |
| 18 to 34 Years | 0 (0.0%) | 3 (0.7%) |
| 35 to 64 Years | 8 (1.7%) | 0 (0.0%) |
| 65 to 74 Years | 10 (4.9%) | 7 (4.5%) |
| 75 Years and over | 18 (39.1%) | 49 (45.4%) |
Disability Class: Vision Difficulty
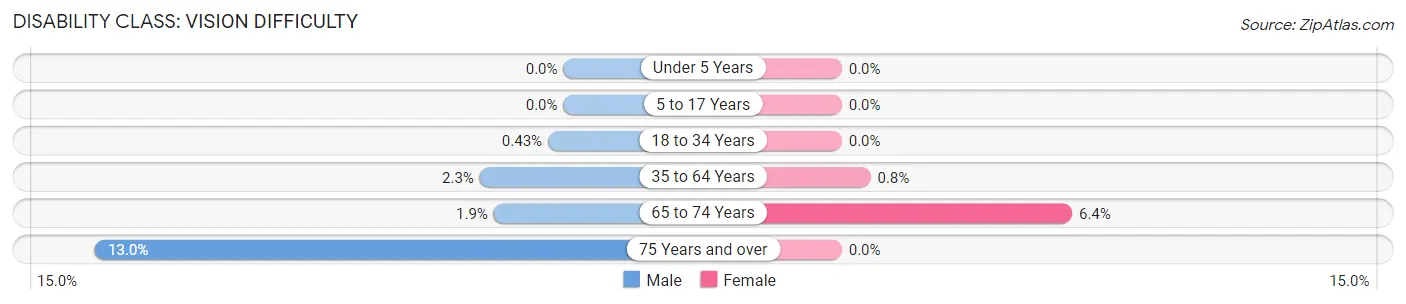
| Age Bracket | Male | Female |
| Under 5 Years | 0 (0.0%) | 0 (0.0%) |
| 5 to 17 Years | 0 (0.0%) | 0 (0.0%) |
| 18 to 34 Years | 3 (0.4%) | 0 (0.0%) |
| 35 to 64 Years | 11 (2.3%) | 5 (0.8%) |
| 65 to 74 Years | 4 (1.9%) | 10 (6.4%) |
| 75 Years and over | 6 (13.0%) | 0 (0.0%) |
Disability Class: Cognitive Difficulty
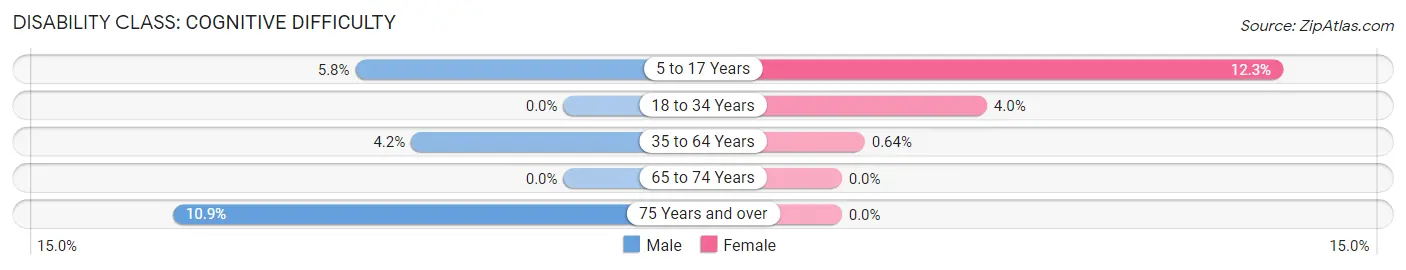
| Age Bracket | Male | Female |
| 5 to 17 Years | 11 (5.8%) | 28 (12.3%) |
| 18 to 34 Years | 0 (0.0%) | 18 (4.0%) |
| 35 to 64 Years | 20 (4.2%) | 4 (0.6%) |
| 65 to 74 Years | 0 (0.0%) | 0 (0.0%) |
| 75 Years and over | 5 (10.9%) | 0 (0.0%) |
Disability Class: Ambulatory Difficulty
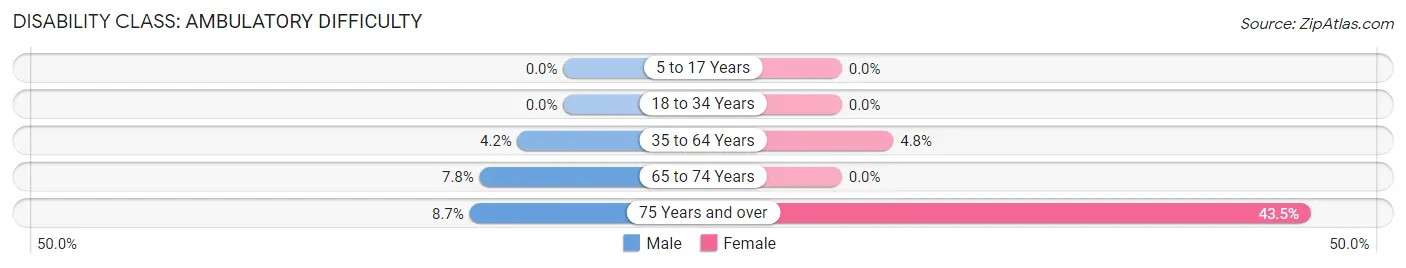
| Age Bracket | Male | Female |
| 5 to 17 Years | 0 (0.0%) | 0 (0.0%) |
| 18 to 34 Years | 0 (0.0%) | 0 (0.0%) |
| 35 to 64 Years | 20 (4.2%) | 30 (4.8%) |
| 65 to 74 Years | 16 (7.8%) | 0 (0.0%) |
| 75 Years and over | 4 (8.7%) | 47 (43.5%) |
Disability Class: Self-Care Difficulty
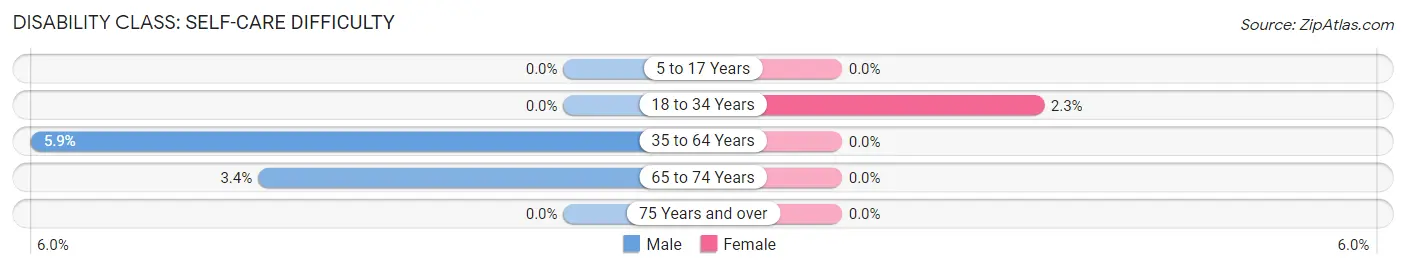
| Age Bracket | Male | Female |
| 5 to 17 Years | 0 (0.0%) | 0 (0.0%) |
| 18 to 34 Years | 0 (0.0%) | 10 (2.2%) |
| 35 to 64 Years | 28 (5.9%) | 0 (0.0%) |
| 65 to 74 Years | 7 (3.4%) | 0 (0.0%) |
| 75 Years and over | 0 (0.0%) | 0 (0.0%) |
Technology Access in Belville
Computing Device Access in Belville
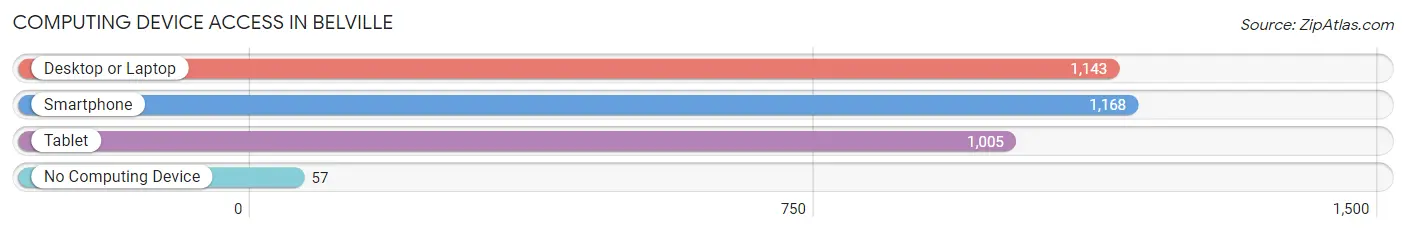
| Device Type | # Households | % Households |
| Desktop or Laptop | 1,143 | 90.3% |
| Smartphone | 1,168 | 92.3% |
| Tablet | 1,005 | 79.4% |
| No Computing Device | 57 | 4.5% |
| Total | 1,266 | 100.0% |
Internet Access in Belville
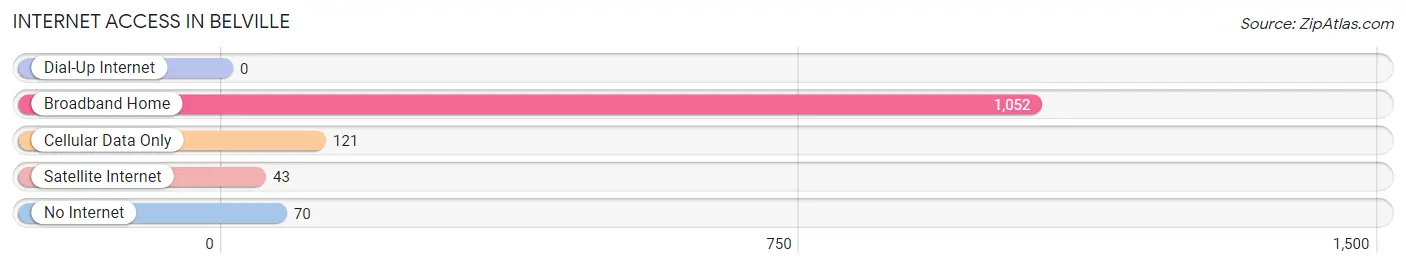
| Internet Type | # Households | % Households |
| Dial-Up Internet | 0 | 0.0% |
| Broadband Home | 1,052 | 83.1% |
| Cellular Data Only | 121 | 9.6% |
| Satellite Internet | 43 | 3.4% |
| No Internet | 70 | 5.5% |
| Total | 1,266 | 100.0% |
Belville Summary
Belville, NC is a small town located in Brunswick County, North Carolina. It is situated on the banks of the Cape Fear River, just south of Wilmington. The town was founded in 1887 and has a population of approximately 2,500 people.
Geography
Belville is located in the southeastern corner of Brunswick County, North Carolina. It is situated on the banks of the Cape Fear River, just south of Wilmington. The town is bordered by the towns of Leland, Navassa, and Winnabow. The town is located in the Cape Fear region of North Carolina, which is known for its coastal plains and sandy beaches. The town is also located near the Intracoastal Waterway, which provides access to the Atlantic Ocean.
The town is located in a humid subtropical climate zone, with hot summers and mild winters. The average annual temperature is around 70 degrees Fahrenheit. The average annual precipitation is around 50 inches.
Economy
Belville’s economy is largely based on tourism and agriculture. The town is home to several tourist attractions, including the Brunswick County Historical Society Museum, the Belville Riverwalk, and the Belville Arts and Crafts Festival. The town is also home to several farms, which produce a variety of crops, including corn, soybeans, and cotton.
The town is also home to several businesses, including restaurants, retail stores, and service providers. The town is also home to several manufacturing companies, including a furniture manufacturer and a boat manufacturer.
Demographics
As of the 2010 census, the population of Belville was 2,500. The racial makeup of the town was 79.2% White, 15.2% African American, 0.4% Native American, 0.8% Asian, 0.1% Pacific Islander, and 4.3% from other races. The median household income was $37,500, and the median family income was $45,000.
The town is served by the Brunswick County School District, which includes two elementary schools, one middle school, and one high school. The town is also home to several churches, including the Belville United Methodist Church and the Belville Baptist Church.
Belville is a small town with a rich history and a vibrant economy. It is home to a diverse population and a variety of businesses and attractions. The town is a great place to live, work, and play.
Common Questions
What is Per Capita Income in Belville?
Per Capita income in Belville is $34,190.
What is the Median Family Income in Belville?
Median Family Income in Belville is $82,059.
What is the Median Household income in Belville?
Median Household Income in Belville is $79,875.
What is Income or Wage Gap in Belville?
Income or Wage Gap in Belville is 30.2%.
Women in Belville earn 69.8 cents for every dollar earned by a man.
What is Inequality or Gini Index in Belville?
Inequality or Gini Index in Belville is 0.30.
What is the Total Population of Belville?
Total Population of Belville is 3,380.
What is the Total Male Population of Belville?
Total Male Population of Belville is 1,750.
What is the Total Female Population of Belville?
Total Female Population of Belville is 1,630.
What is the Ratio of Males per 100 Females in Belville?
There are 107.36 Males per 100 Females in Belville.
What is the Ratio of Females per 100 Males in Belville?
There are 93.14 Females per 100 Males in Belville.
What is the Median Population Age in Belville?
Median Population Age in Belville is 33.4 Years.
What is the Average Family Size in Belville
Average Family Size in Belville is 3.2 People.
What is the Average Household Size in Belville
Average Household Size in Belville is 2.7 People.
How Large is the Labor Force in Belville?
There are 1,964 People in the Labor Forcein in Belville.
What is the Percentage of People in the Labor Force in Belville?
68.6% of People are in the Labor Force in Belville.
What is the Unemployment Rate in Belville?
Unemployment Rate in Belville is 7.3%.