Cities with the Largest Somali Community in the United States
RELATED REPORTS & OPTIONS
Somali
United States
Compare Cities
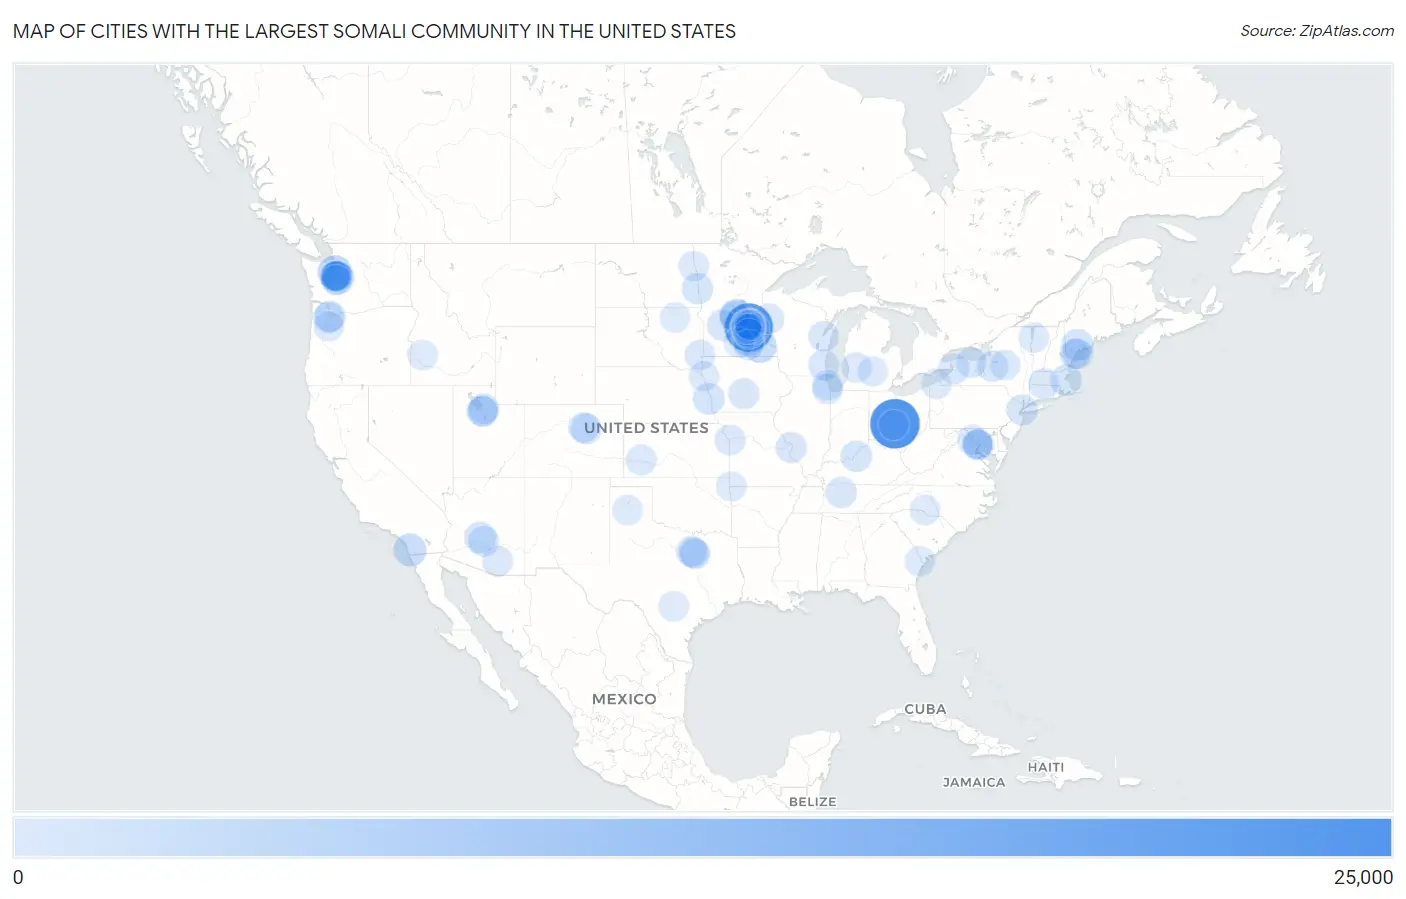
Map of Cities with the Largest Somali Community in the United States
0
25,000
Cities with the Largest Somali Community in the United States
| City | Somali | vs State | vs National | |
| 1. | Columbus | 21,947 | 25,199(87.09%)#1 | 167,300(13.12%)#1 |
| 2. | Minneapolis | 20,533 | 63,569(32.30%)#1 | 167,300(12.27%)#2 |
| 3. | St Paul | 6,024 | 63,569(9.48%)#2 | 167,300(3.60%)#3 |
| 4. | Seattle | 4,803 | 15,832(30.34%)#1 | 167,300(2.87%)#4 |
| 5. | St Cloud | 4,387 | 63,569(6.90%)#3 | 167,300(2.62%)#5 |
| 6. | Kent | 3,668 | 15,832(23.17%)#2 | 167,300(2.19%)#6 |
| 7. | Rochester | 3,426 | 63,569(5.39%)#4 | 167,300(2.05%)#7 |
| 8. | San Diego | 3,076 | 4,921(62.51%)#1 | 167,300(1.84%)#8 |
| 9. | Faribault | 2,406 | 63,569(3.78%)#5 | 167,300(1.44%)#9 |
| 10. | Eden Prairie | 2,038 | 63,569(3.21%)#6 | 167,300(1.22%)#10 |
| 11. | Bloomington | 1,923 | 63,569(3.03%)#7 | 167,300(1.15%)#11 |
| 12. | Columbia Heights | 1,882 | 63,569(2.96%)#8 | 167,300(1.12%)#12 |
| 13. | Lewiston | 1,863 | 3,851(48.38%)#1 | 167,300(1.11%)#13 |
| 14. | Omaha | 1,670 | 2,730(61.17%)#1 | 167,300(1.00%)#14 |
| 15. | Eagan | 1,532 | 63,569(2.41%)#9 | 167,300(0.92%)#15 |
| 16. | Seatac | 1,525 | 15,832(9.63%)#3 | 167,300(0.91%)#16 |
| 17. | Shakopee | 1,463 | 63,569(2.30%)#10 | 167,300(0.87%)#17 |
| 18. | Boston | 1,440 | 2,551(56.45%)#1 | 167,300(0.86%)#18 |
| 19. | Bryn Mawr Skyway | 1,420 | 15,832(8.97%)#4 | 167,300(0.85%)#19 |
| 20. | Phoenix | 1,369 | 3,078(44.48%)#1 | 167,300(0.82%)#20 |
| 21. | Burnsville | 1,332 | 63,569(2.10%)#11 | 167,300(0.80%)#21 |
| 22. | Louisville | 1,289 | 1,681(76.68%)#1 | 167,300(0.77%)#22 |
| 23. | Fridley | 1,209 | 63,569(1.90%)#12 | 167,300(0.72%)#23 |
| 24. | Fargo | 1,183 | 1,906(62.07%)#1 | 167,300(0.71%)#24 |
| 25. | Willmar | 1,167 | 63,569(1.84%)#13 | 167,300(0.70%)#25 |
| 26. | St Louis | 1,164 | 2,594(44.87%)#1 | 167,300(0.70%)#26 |
| 27. | Savage | 1,157 | 63,569(1.82%)#14 | 167,300(0.69%)#27 |
| 28. | Nashville | 1,127 | 1,591(70.84%)#1 | 167,300(0.67%)#28 |
| 29. | Des Moines | 1,096 | 1,664(65.87%)#1 | 167,300(0.66%)#29 |
| 30. | Syracuse | 1,081 | 4,598(23.51%)#1 | 167,300(0.65%)#30 |
| 31. | Portland | 1,080 | 2,658(40.63%)#1 | 167,300(0.65%)#31 |
| 32. | Portland | 1,024 | 3,851(26.59%)#2 | 167,300(0.61%)#32 |
| 33. | New York | 1,023 | 4,598(22.25%)#2 | 167,300(0.61%)#33 |
| 34. | Tukwila | 987 | 15,832(6.23%)#5 | 167,300(0.59%)#34 |
| 35. | West Valley City | 978 | 2,542(38.47%)#1 | 167,300(0.58%)#35 |
| 36. | Milwaukee | 974 | 2,579(37.77%)#1 | 167,300(0.58%)#36 |
| 37. | Aurora | 850 | 2,431(34.97%)#1 | 167,300(0.51%)#37 |
| 38. | Tempe | 842 | 3,078(27.36%)#2 | 167,300(0.50%)#38 |
| 39. | Buffalo | 817 | 4,598(17.77%)#3 | 167,300(0.49%)#39 |
| 40. | Apple Valley | 795 | 63,569(1.25%)#15 | 167,300(0.48%)#40 |
| 41. | Maple Grove | 776 | 63,569(1.22%)#16 | 167,300(0.46%)#41 |
| 42. | Rochester | 727 | 4,598(15.81%)#4 | 167,300(0.43%)#42 |
| 43. | Kansas City | 722 | 2,594(27.83%)#2 | 167,300(0.43%)#43 |
| 44. | Arlington | 711 | 3,177(22.38%)#1 | 167,300(0.42%)#44 |
| 45. | Brooklyn Park | 708 | 63,569(1.11%)#17 | 167,300(0.42%)#45 |
| 46. | Green Bay | 683 | 2,579(26.48%)#2 | 167,300(0.41%)#46 |
| 47. | Denver | 668 | 2,431(27.48%)#2 | 167,300(0.40%)#47 |
| 48. | Springfield | 665 | 2,551(26.07%)#2 | 167,300(0.40%)#48 |
| 49. | Chicago | 650 | 1,637(39.71%)#1 | 167,300(0.39%)#49 |
| 50. | Tucson | 643 | 3,078(20.89%)#3 | 167,300(0.38%)#50 |
| 51. | Renton | 599 | 15,832(3.78%)#6 | 167,300(0.36%)#51 |
| 52. | Salt Lake City | 587 | 2,542(23.09%)#2 | 167,300(0.35%)#52 |
| 53. | Woodbury | 573 | 63,569(0.90%)#18 | 167,300(0.34%)#53 |
| 54. | Garden City | 562 | 740(75.95%)#1 | 167,300(0.34%)#54 |
| 55. | Barron | 560 | 2,579(21.71%)#3 | 167,300(0.33%)#55 |
| 56. | Edina | 557 | 63,569(0.88%)#19 | 167,300(0.33%)#56 |
| 57. | Fort Worth | 546 | 3,177(17.19%)#2 | 167,300(0.33%)#57 |
| 58. | St Louis Park | 508 | 63,569(0.80%)#20 | 167,300(0.30%)#58 |
| 59. | South Portland | 499 | 3,851(12.96%)#3 | 167,300(0.30%)#59 |
| 60. | Beaverton | 496 | 2,658(18.66%)#2 | 167,300(0.30%)#60 |
| 61. | Roseville | 478 | 63,569(0.75%)#21 | 167,300(0.29%)#61 |
| 62. | Sioux Falls | 469 | 918(51.09%)#1 | 167,300(0.28%)#62 |
| 63. | Alexandria | 458 | 3,611(12.68%)#1 | 167,300(0.27%)#63 |
| 64. | Blaine | 445 | 63,569(0.70%)#22 | 167,300(0.27%)#64 |
| 65. | Kearns | 439 | 2,542(17.27%)#3 | 167,300(0.26%)#65 |
| 66. | South Sioux City | 437 | 2,730(16.01%)#2 | 167,300(0.26%)#66 |
| 67. | Richfield | 436 | 63,569(0.69%)#23 | 167,300(0.26%)#67 |
| 68. | Maplewood | 435 | 63,569(0.68%)#24 | 167,300(0.26%)#68 |
| 69. | Coon Rapids | 433 | 63,569(0.68%)#25 | 167,300(0.26%)#69 |
| 70. | Urbancrest | 432 | 25,199(1.71%)#2 | 167,300(0.26%)#70 |
| 71. | Waite Park | 426 | 63,569(0.67%)#26 | 167,300(0.25%)#71 |
| 72. | San Antonio | 423 | 3,177(13.31%)#3 | 167,300(0.25%)#72 |
| 73. | Mendota Heights | 417 | 63,569(0.66%)#27 | 167,300(0.25%)#73 |
| 74. | Charlotte | 398 | 1,218(32.68%)#1 | 167,300(0.24%)#74 |
| 75. | Grand Rapids | 392 | 1,385(28.30%)#1 | 167,300(0.23%)#75 |
| 76. | Grand Forks | 383 | 1,906(20.09%)#2 | 167,300(0.23%)#76 |
| 77. | New Hope | 369 | 63,569(0.58%)#28 | 167,300(0.22%)#77 |
| 78. | Auburn | 365 | 15,832(2.31%)#7 | 167,300(0.22%)#78 |
| 79. | Boise City | 360 | 376(95.74%)#1 | 167,300(0.22%)#79 |
| 80. | Utica | 359 | 4,598(7.81%)#5 | 167,300(0.21%)#80 |
| 81. | Burien | 354 | 15,832(2.24%)#8 | 167,300(0.21%)#81 |
| 82. | Mankato | 353 | 63,569(0.56%)#29 | 167,300(0.21%)#82 |
| 83. | Noel | 349 | 2,594(13.45%)#3 | 167,300(0.21%)#83 |
| 84. | Aberdeen | 342 | 918(37.25%)#2 | 167,300(0.20%)#84 |
| 85. | Port Wentworth | 336 | 3,830(8.77%)#1 | 167,300(0.20%)#85 |
| 86. | Owatonna | 328 | 63,569(0.52%)#30 | 167,300(0.20%)#86 |
| 87. | Hopkins | 328 | 63,569(0.52%)#31 | 167,300(0.20%)#87 |
| 88. | Lansing | 327 | 1,385(23.61%)#2 | 167,300(0.20%)#88 |
| 89. | Silverton | 326 | 2,658(12.26%)#3 | 167,300(0.19%)#89 |
| 90. | Amarillo | 319 | 3,177(10.04%)#4 | 167,300(0.19%)#90 |
| 91. | Lakeville | 312 | 63,569(0.49%)#32 | 167,300(0.19%)#91 |
| 92. | Annandale | 310 | 3,611(8.58%)#2 | 167,300(0.19%)#92 |
| 93. | Fairwood Cdp King County | 310 | 15,832(1.96%)#9 | 167,300(0.19%)#93 |
| 94. | Burlington | 306 | 489(62.58%)#1 | 167,300(0.18%)#94 |
| 95. | New Brighton | 299 | 63,569(0.47%)#33 | 167,300(0.18%)#95 |
| 96. | Skokie | 290 | 1,637(17.72%)#2 | 167,300(0.17%)#96 |
| 97. | Grand Prairie | 286 | 3,177(9.00%)#5 | 167,300(0.17%)#97 |
| 98. | Leesburg | 285 | 3,611(7.89%)#3 | 167,300(0.17%)#98 |
| 99. | Idylwood | 283 | 3,611(7.84%)#4 | 167,300(0.17%)#99 |
| 100. | Erie | 280 | 1,046(26.77%)#1 | 167,300(0.17%)#100 |
Common Questions
What are the Top 10 Cities with the Largest Somali Community in the United States?
Top 10 Cities with the Largest Somali Community in the United States are:
What city has the Largest Somali Community in the United States?
Columbus has the Largest Somali Community in the United States with 21,947.
What is the Total Somali Population in the United States?
Total Somali Population in the United States is 167,300.