Bee Cave, TX Map & Demographics
Bee Cave Map
Bee Cave Overview
$73,630
PER CAPITA INCOME
$150,673
AVG FAMILY INCOME
$104,949
AVG HOUSEHOLD INCOME
40.2%
WAGE / INCOME GAP [ % ]
59.8¢/ $1
WAGE / INCOME GAP [ $ ]
0.46
INEQUALITY / GINI INDEX
8,771
TOTAL POPULATION
4,578
MALE POPULATION
4,193
FEMALE POPULATION
109.18
MALES / 100 FEMALES
91.59
FEMALES / 100 MALES
37.7
MEDIAN AGE
2.9
AVG FAMILY SIZE
2.2
AVG HOUSEHOLD SIZE
4,509
LABOR FORCE [ PEOPLE ]
67.8%
PERCENT IN LABOR FORCE
1.2%
UNEMPLOYMENT RATE
Bee Cave Area Codes
Income in Bee Cave
Income Overview in Bee Cave
Per Capita Income in Bee Cave is $73,630, while median incomes of families and households are $150,673 and $104,949 respectively.
| Characteristic | Number | Measure |
| Per Capita Income | 8,771 | $73,630 |
| Median Family Income | 2,327 | $150,673 |
| Mean Family Income | 2,327 | $200,070 |
| Median Household Income | 3,964 | $104,949 |
| Mean Household Income | 3,964 | $160,902 |
| Income Deficit | 2,327 | $0 |
| Wage / Income Gap (%) | 8,771 | 40.18% |
| Wage / Income Gap ($) | 8,771 | 59.82¢ per $1 |
| Gini / Inequality Index | 8,771 | 0.46 |
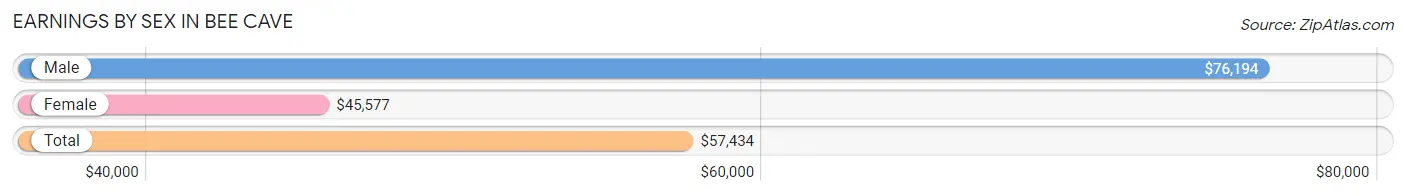
Earnings by Sex in Bee Cave
Average Earnings in Bee Cave are $57,434, $76,194 for men and $45,577 for women, a difference of 40.2%.
| Sex | Number | Average Earnings |
| Male | 2,856 (61.1%) | $76,194 |
| Female | 1,818 (38.9%) | $45,577 |
| Total | 4,674 (100.0%) | $57,434 |
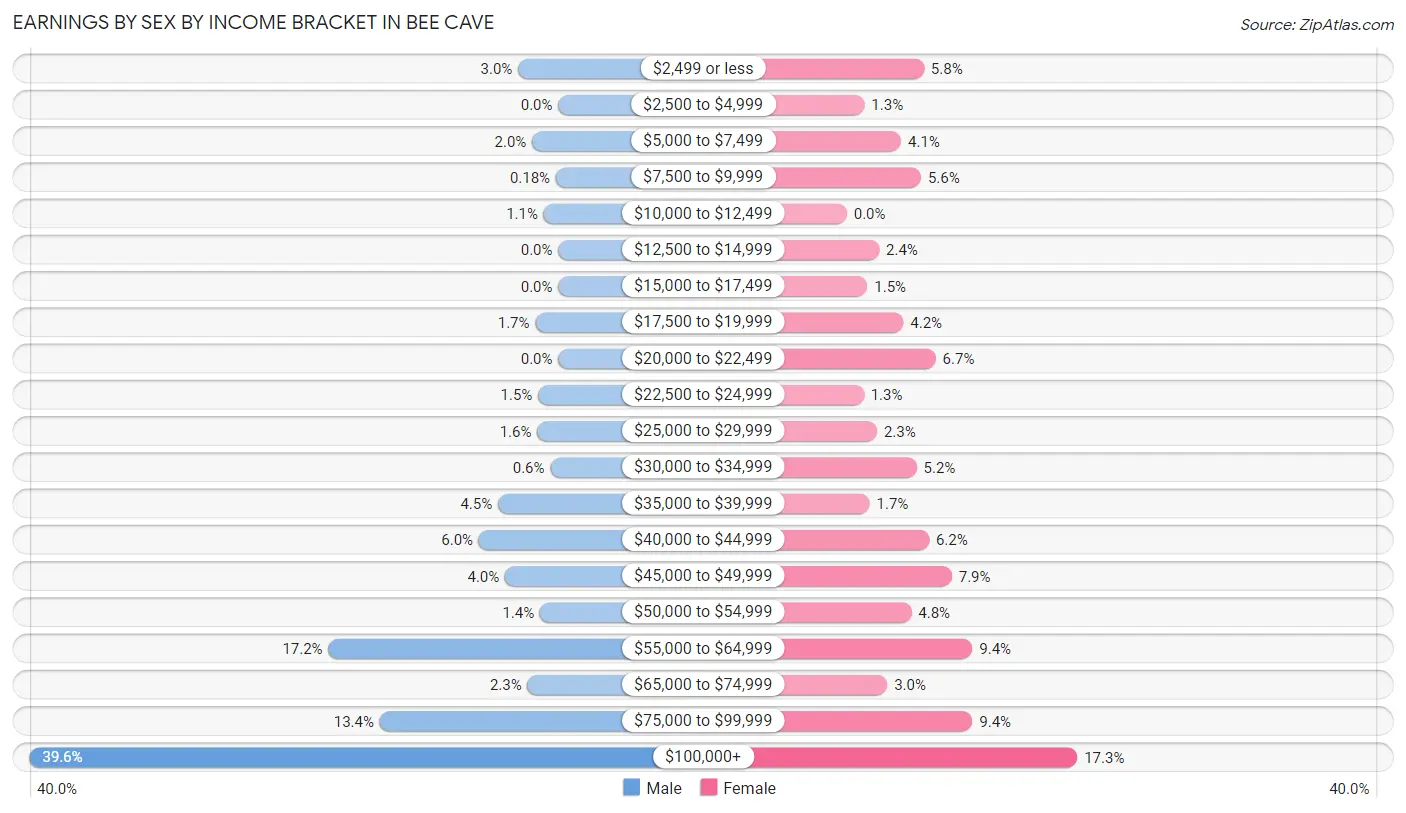
Earnings by Sex by Income Bracket in Bee Cave
The most common earnings brackets in Bee Cave are $100,000+ for men (1,132 | 39.6%) and $100,000+ for women (314 | 17.3%).
| Income | Male | Female |
| $2,499 or less | 86 (3.0%) | 105 (5.8%) |
| $2,500 to $4,999 | 0 (0.0%) | 24 (1.3%) |
| $5,000 to $7,499 | 56 (2.0%) | 74 (4.1%) |
| $7,500 to $9,999 | 5 (0.2%) | 101 (5.6%) |
| $10,000 to $12,499 | 31 (1.1%) | 0 (0.0%) |
| $12,500 to $14,999 | 0 (0.0%) | 44 (2.4%) |
| $15,000 to $17,499 | 0 (0.0%) | 28 (1.5%) |
| $17,500 to $19,999 | 49 (1.7%) | 77 (4.2%) |
| $20,000 to $22,499 | 0 (0.0%) | 121 (6.7%) |
| $22,500 to $24,999 | 43 (1.5%) | 23 (1.3%) |
| $25,000 to $29,999 | 45 (1.6%) | 41 (2.3%) |
| $30,000 to $34,999 | 17 (0.6%) | 95 (5.2%) |
| $35,000 to $39,999 | 129 (4.5%) | 31 (1.7%) |
| $40,000 to $44,999 | 170 (5.9%) | 112 (6.2%) |
| $45,000 to $49,999 | 114 (4.0%) | 143 (7.9%) |
| $50,000 to $54,999 | 39 (1.4%) | 88 (4.8%) |
| $55,000 to $64,999 | 492 (17.2%) | 171 (9.4%) |
| $65,000 to $74,999 | 66 (2.3%) | 55 (3.0%) |
| $75,000 to $99,999 | 382 (13.4%) | 171 (9.4%) |
| $100,000+ | 1,132 (39.6%) | 314 (17.3%) |
| Total | 2,856 (100.0%) | 1,818 (100.0%) |
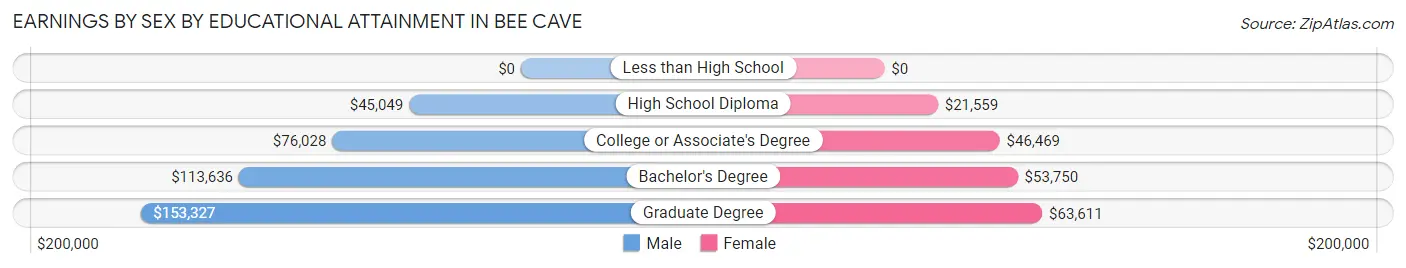
Earnings by Sex by Educational Attainment in Bee Cave
Average earnings in Bee Cave are $77,063 for men and $46,705 for women, a difference of 39.4%. Men with an educational attainment of graduate degree enjoy the highest average annual earnings of $153,327, while those with high school diploma education earn the least with $45,049. Women with an educational attainment of graduate degree earn the most with the average annual earnings of $63,611, while those with high school diploma education have the smallest earnings of $21,559.
| Educational Attainment | Male Income | Female Income |
| Less than High School | - | - |
| High School Diploma | $45,049 | $21,559 |
| College or Associate's Degree | $76,028 | $46,469 |
| Bachelor's Degree | $113,636 | $53,750 |
| Graduate Degree | $153,327 | $63,611 |
| Total | $77,063 | $46,705 |
Family Income in Bee Cave
Family Income Brackets in Bee Cave
According to the Bee Cave family income data, there are 921 families falling into the $200,000+ income range, which is the most common income bracket and makes up 39.6% of all families.
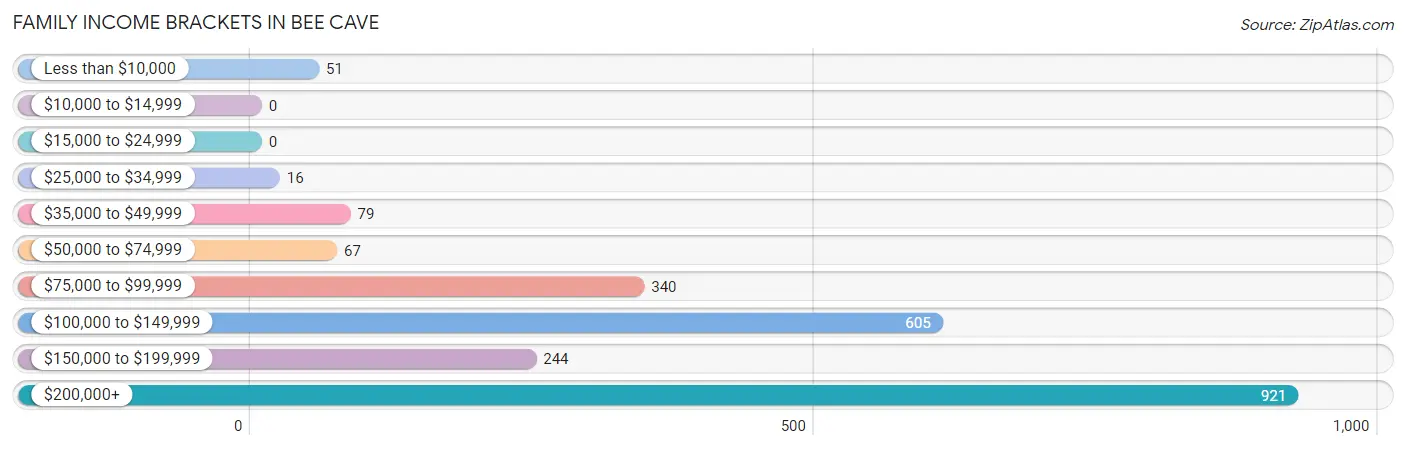
| Income Bracket | # Families | % Families |
| Less than $10,000 | 51 | 2.2% |
| $10,000 to $14,999 | 0 | 0.0% |
| $15,000 to $24,999 | 0 | 0.0% |
| $25,000 to $34,999 | 16 | 0.7% |
| $35,000 to $49,999 | 79 | 3.4% |
| $50,000 to $74,999 | 67 | 2.9% |
| $75,000 to $99,999 | 340 | 14.6% |
| $100,000 to $149,999 | 605 | 26.0% |
| $150,000 to $199,999 | 244 | 10.5% |
| $200,000+ | 921 | 39.6% |
Family Income by Famaliy Size in Bee Cave
3-person families (219 | 9.4%) account for the highest median family income in Bee Cave with $250,001 per family, while 3-person families (219 | 9.4%) have the highest median income of $83,334 per family member.
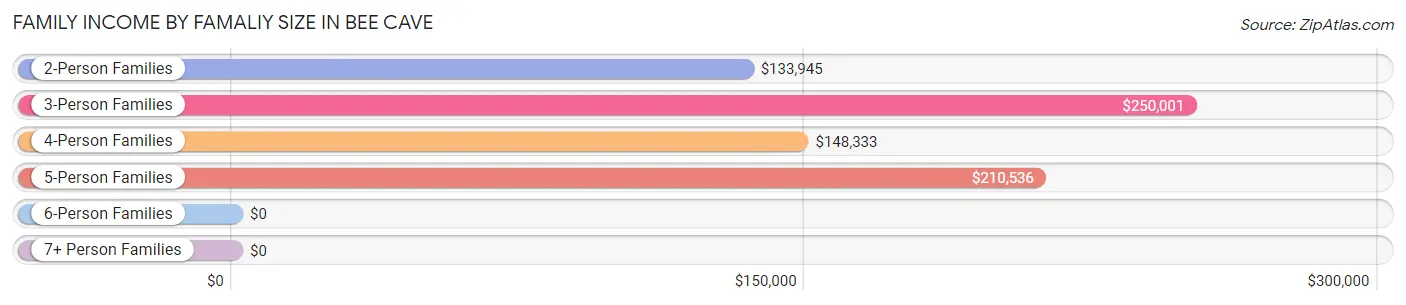
| Income Bracket | # Families | Median Income |
| 2-Person Families | 1,225 (52.6%) | $133,945 |
| 3-Person Families | 219 (9.4%) | $250,001 |
| 4-Person Families | 656 (28.2%) | $148,333 |
| 5-Person Families | 158 (6.8%) | $210,536 |
| 6-Person Families | 55 (2.4%) | $0 |
| 7+ Person Families | 14 (0.6%) | $0 |
| Total | 2,327 (100.0%) | $150,673 |
Family Income by Number of Earners in Bee Cave
The median family income in Bee Cave is $150,673, with families comprising 2 earners (1,111) having the highest median family income of $189,044, while families with no earners (343) have the lowest median family income of $111,823, accounting for 47.7% and 14.7% of families, respectively.
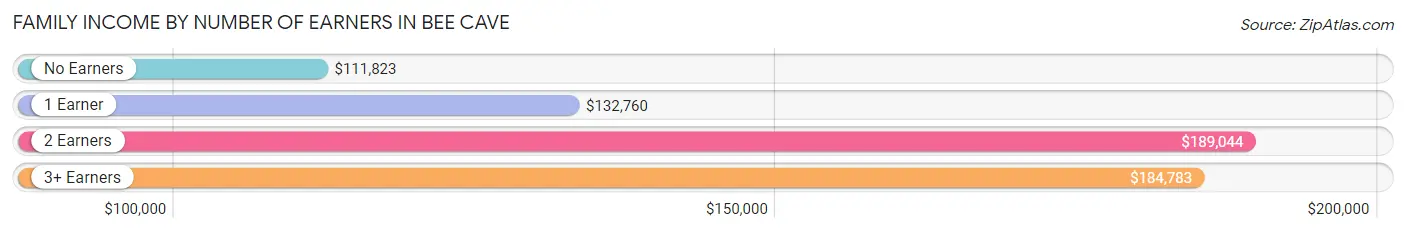
| Number of Earners | # Families | Median Income |
| No Earners | 343 (14.7%) | $111,823 |
| 1 Earner | 807 (34.7%) | $132,760 |
| 2 Earners | 1,111 (47.7%) | $189,044 |
| 3+ Earners | 66 (2.8%) | $184,783 |
| Total | 2,327 (100.0%) | $150,673 |
Household Income in Bee Cave
Household Income Brackets in Bee Cave
With 1,233 households falling in the category, the $200,000+ income range is the most frequent in Bee Cave, accounting for 31.1% of all households. In contrast, only 32 households (0.8%) fall into the $15,000 to $24,999 income bracket, making it the least populous group.
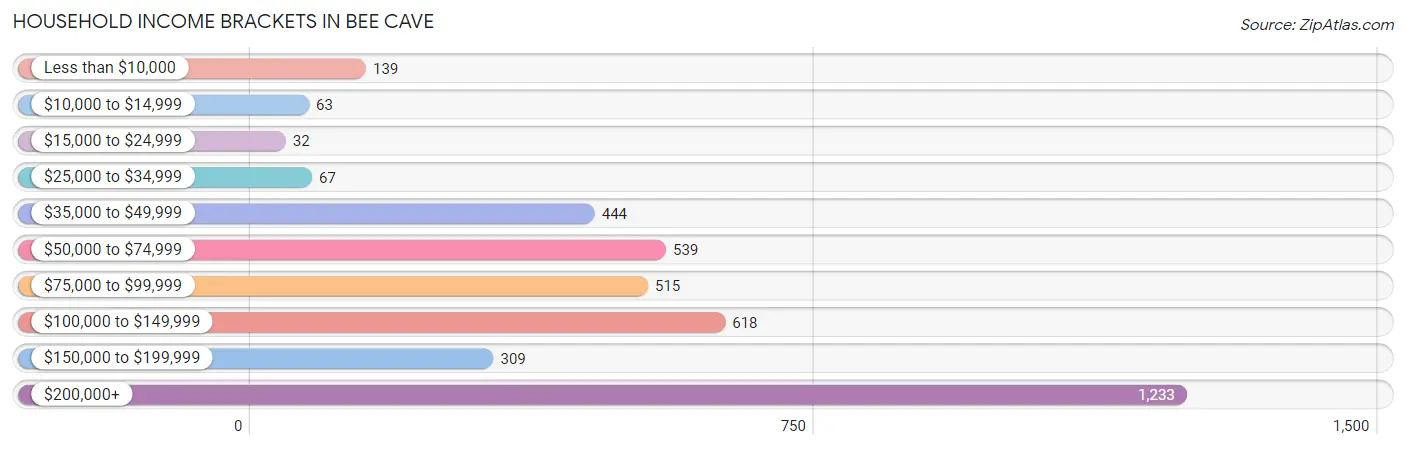
| Income Bracket | # Households | % Households |
| Less than $10,000 | 139 | 3.5% |
| $10,000 to $14,999 | 63 | 1.6% |
| $15,000 to $24,999 | 32 | 0.8% |
| $25,000 to $34,999 | 67 | 1.7% |
| $35,000 to $49,999 | 444 | 11.2% |
| $50,000 to $74,999 | 539 | 13.6% |
| $75,000 to $99,999 | 515 | 13.0% |
| $100,000 to $149,999 | 618 | 15.6% |
| $150,000 to $199,999 | 309 | 7.8% |
| $200,000+ | 1,233 | 31.1% |
Household Income by Householder Age in Bee Cave
The median household income in Bee Cave is $104,949, with the highest median household income of $178,839 found in the 45 to 64 years age bracket for the primary householder. A total of 1,335 households (33.7%) fall into this category. Meanwhile, the 25 to 44 years age bracket for the primary householder has the lowest median household income of $76,896, with 1,731 households (43.7%) in this group.
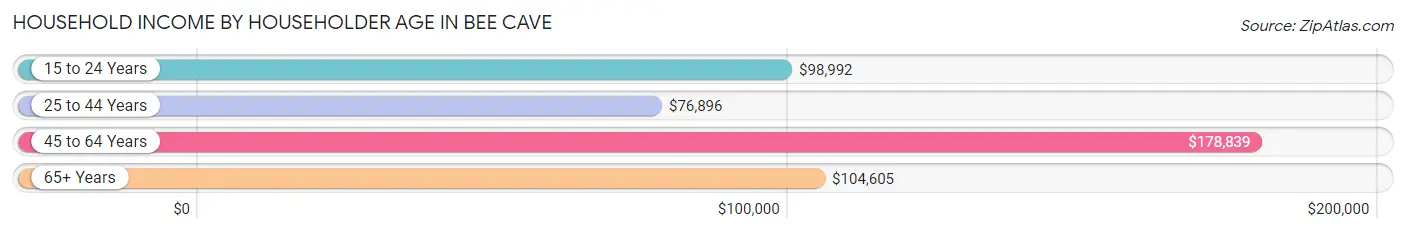
| Income Bracket | # Households | Median Income |
| 15 to 24 Years | 93 (2.4%) | $98,992 |
| 25 to 44 Years | 1,731 (43.7%) | $76,896 |
| 45 to 64 Years | 1,335 (33.7%) | $178,839 |
| 65+ Years | 805 (20.3%) | $104,605 |
| Total | 3,964 (100.0%) | $104,949 |
Poverty in Bee Cave
Income Below Poverty by Sex and Age in Bee Cave
With 1.5% poverty level for males and 5.6% for females among the residents of Bee Cave, 25 to 34 year old males and under 5 year old females are the most vulnerable to poverty, with 35 males (4.3%) and 27 females (10.4%) in their respective age groups living below the poverty level.
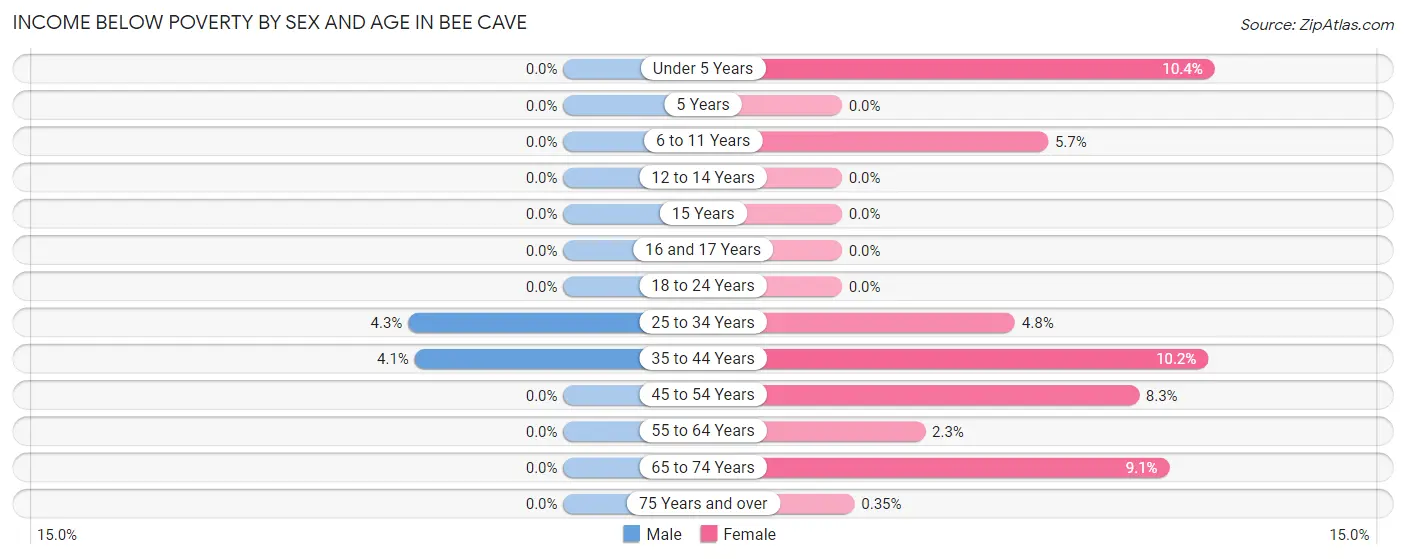
| Age Bracket | Male | Female |
| Under 5 Years | 0 (0.0%) | 27 (10.4%) |
| 5 Years | 0 (0.0%) | 0 (0.0%) |
| 6 to 11 Years | 0 (0.0%) | 27 (5.7%) |
| 12 to 14 Years | 0 (0.0%) | 0 (0.0%) |
| 15 Years | 0 (0.0%) | 0 (0.0%) |
| 16 and 17 Years | 0 (0.0%) | 0 (0.0%) |
| 18 to 24 Years | 0 (0.0%) | 0 (0.0%) |
| 25 to 34 Years | 35 (4.3%) | 23 (4.8%) |
| 35 to 44 Years | 36 (4.1%) | 72 (10.2%) |
| 45 to 54 Years | 0 (0.0%) | 46 (8.3%) |
| 55 to 64 Years | 0 (0.0%) | 13 (2.3%) |
| 65 to 74 Years | 0 (0.0%) | 26 (9.1%) |
| 75 Years and over | 0 (0.0%) | 1 (0.4%) |
| Total | 71 (1.5%) | 235 (5.6%) |
Income Above Poverty by Sex and Age in Bee Cave
According to the poverty statistics in Bee Cave, males aged under 5 years and females aged 5 years are the age groups that are most secure financially, with 100.0% of males and 100.0% of females in these age groups living above the poverty line.
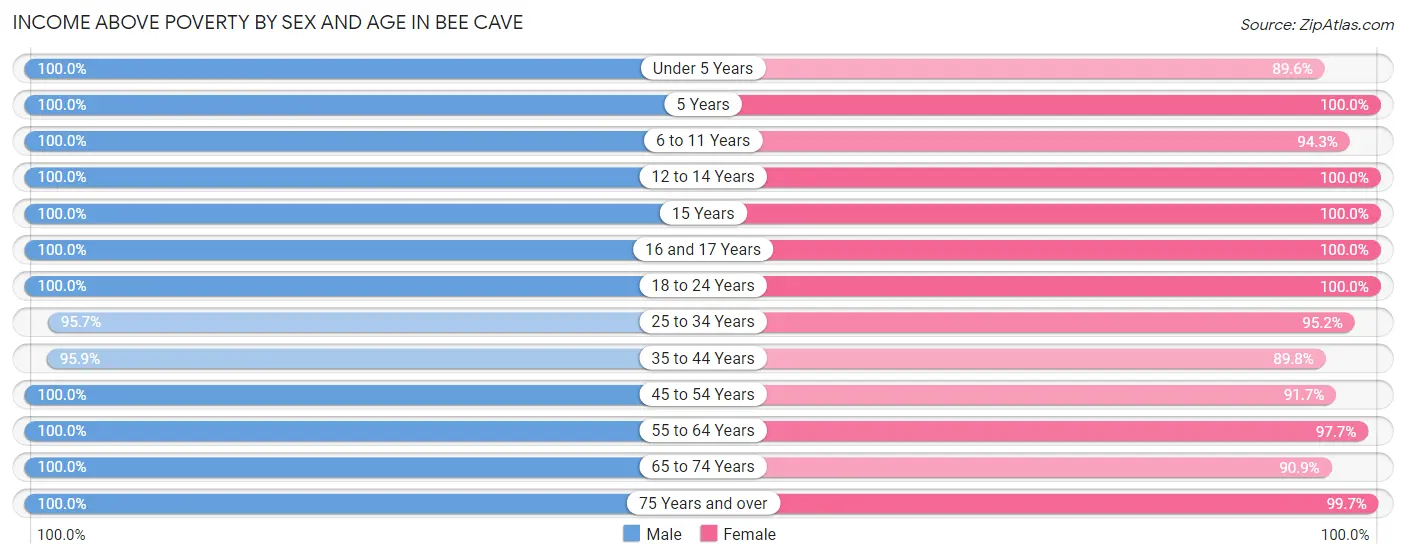
| Age Bracket | Male | Female |
| Under 5 Years | 200 (100.0%) | 233 (89.6%) |
| 5 Years | 78 (100.0%) | 114 (100.0%) |
| 6 to 11 Years | 490 (100.0%) | 443 (94.3%) |
| 12 to 14 Years | 144 (100.0%) | 166 (100.0%) |
| 15 Years | 58 (100.0%) | 141 (100.0%) |
| 16 and 17 Years | 69 (100.0%) | 60 (100.0%) |
| 18 to 24 Years | 98 (100.0%) | 98 (100.0%) |
| 25 to 34 Years | 775 (95.7%) | 454 (95.2%) |
| 35 to 44 Years | 834 (95.9%) | 634 (89.8%) |
| 45 to 54 Years | 549 (100.0%) | 510 (91.7%) |
| 55 to 64 Years | 491 (100.0%) | 547 (97.7%) |
| 65 to 74 Years | 333 (100.0%) | 259 (90.9%) |
| 75 Years and over | 384 (100.0%) | 281 (99.7%) |
| Total | 4,503 (98.5%) | 3,940 (94.4%) |
Income Below Poverty Among Married-Couple Families in Bee Cave
The poverty statistics for married-couple families in Bee Cave show that 0.3% or 5 of the total 1,951 families live below the poverty line. Families with no children have the highest poverty rate of 0.5%, comprising of 5 families. On the other hand, families with 1 or 2 children have the lowest poverty rate of 0.0%, which includes 0 families.
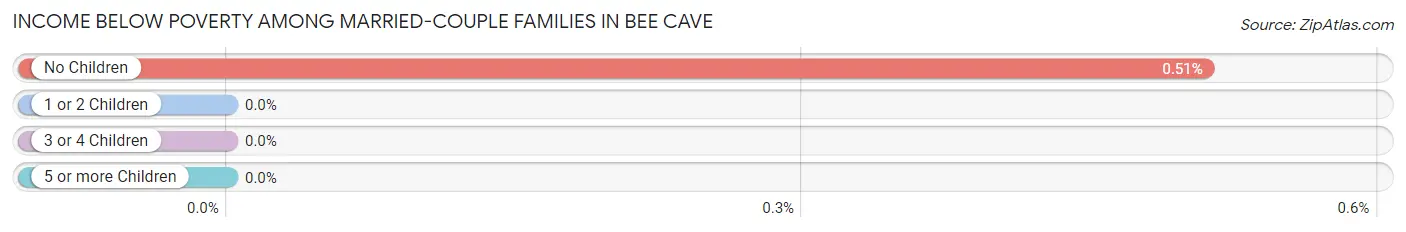
| Children | Above Poverty | Below Poverty |
| No Children | 984 (99.5%) | 5 (0.5%) |
| 1 or 2 Children | 778 (100.0%) | 0 (0.0%) |
| 3 or 4 Children | 170 (100.0%) | 0 (0.0%) |
| 5 or more Children | 14 (100.0%) | 0 (0.0%) |
| Total | 1,946 (99.7%) | 5 (0.3%) |
Income Below Poverty Among Single-Parent Households in Bee Cave
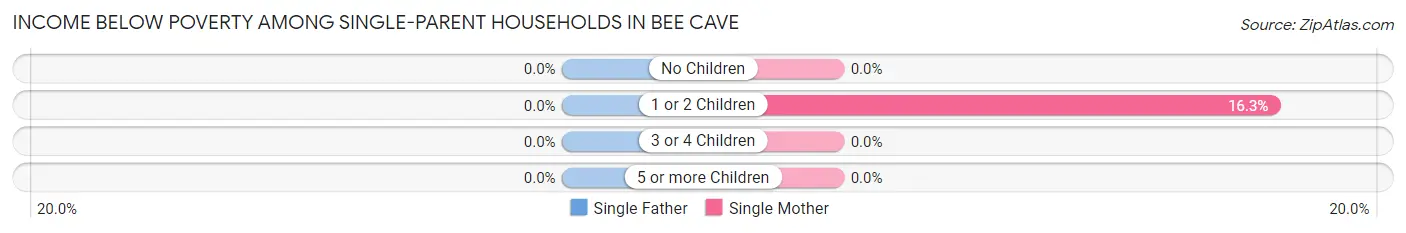
| Children | Single Father | Single Mother |
| No Children | 0 (0.0%) | 0 (0.0%) |
| 1 or 2 Children | 0 (0.0%) | 47 (16.3%) |
| 3 or 4 Children | 0 (0.0%) | 0 (0.0%) |
| 5 or more Children | 0 (0.0%) | 0 (0.0%) |
| Total | 0 (0.0%) | 47 (14.1%) |
Income Below Poverty Among Married-Couple vs Single-Parent Households in Bee Cave
The poverty data for Bee Cave shows that 5 of the married-couple family households (0.3%) and 47 of the single-parent households (12.5%) are living below the poverty level. Within the married-couple family households, those with no children have the highest poverty rate, with 5 households (0.5%) falling below the poverty line. Among the single-parent households, those with 1 or 2 children have the highest poverty rate, with 47 household (14.2%) living below poverty.
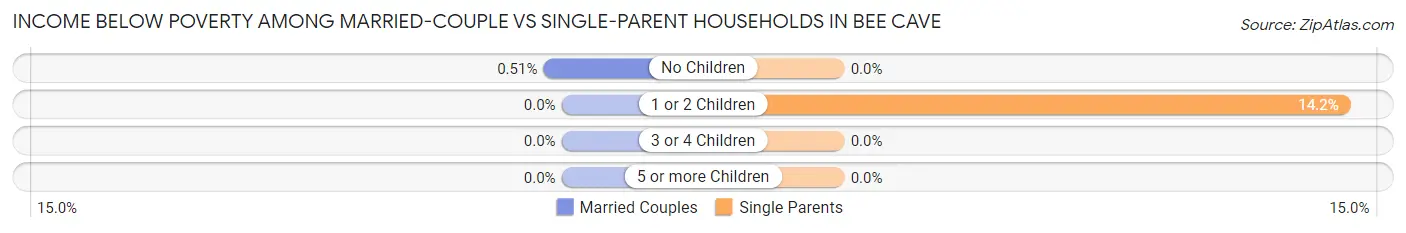
| Children | Married-Couple Families | Single-Parent Households |
| No Children | 5 (0.5%) | 0 (0.0%) |
| 1 or 2 Children | 0 (0.0%) | 47 (14.2%) |
| 3 or 4 Children | 0 (0.0%) | 0 (0.0%) |
| 5 or more Children | 0 (0.0%) | 0 (0.0%) |
| Total | 5 (0.3%) | 47 (12.5%) |
Race in Bee Cave
The most populous races in Bee Cave are White / Caucasian (6,581 | 75.0%), Hispanic or Latino (1,438 | 16.4%), and Asian (1,099 | 12.5%).
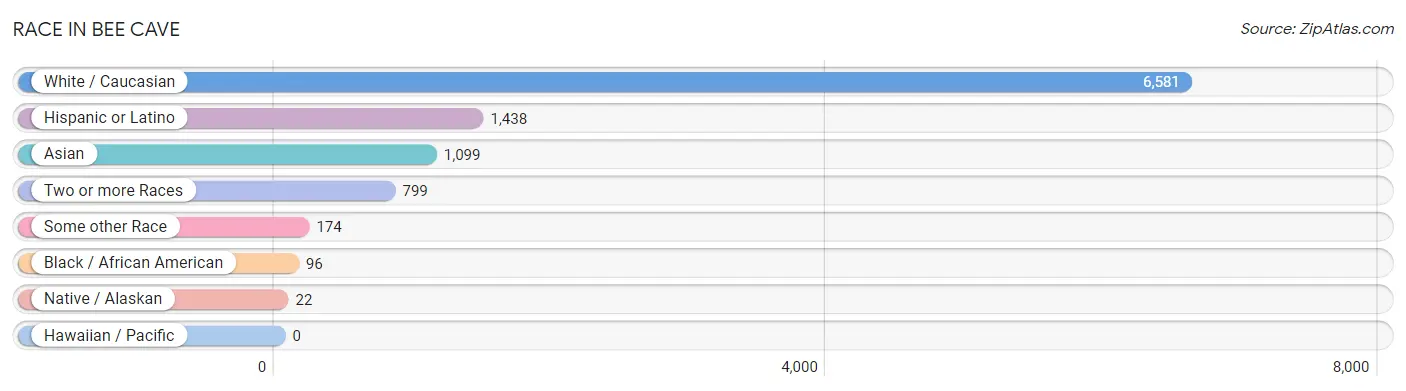
| Race | # Population | % Population |
| Asian | 1,099 | 12.5% |
| Black / African American | 96 | 1.1% |
| Hawaiian / Pacific | 0 | 0.0% |
| Hispanic or Latino | 1,438 | 16.4% |
| Native / Alaskan | 22 | 0.3% |
| White / Caucasian | 6,581 | 75.0% |
| Two or more Races | 799 | 9.1% |
| Some other Race | 174 | 2.0% |
| Total | 8,771 | 100.0% |
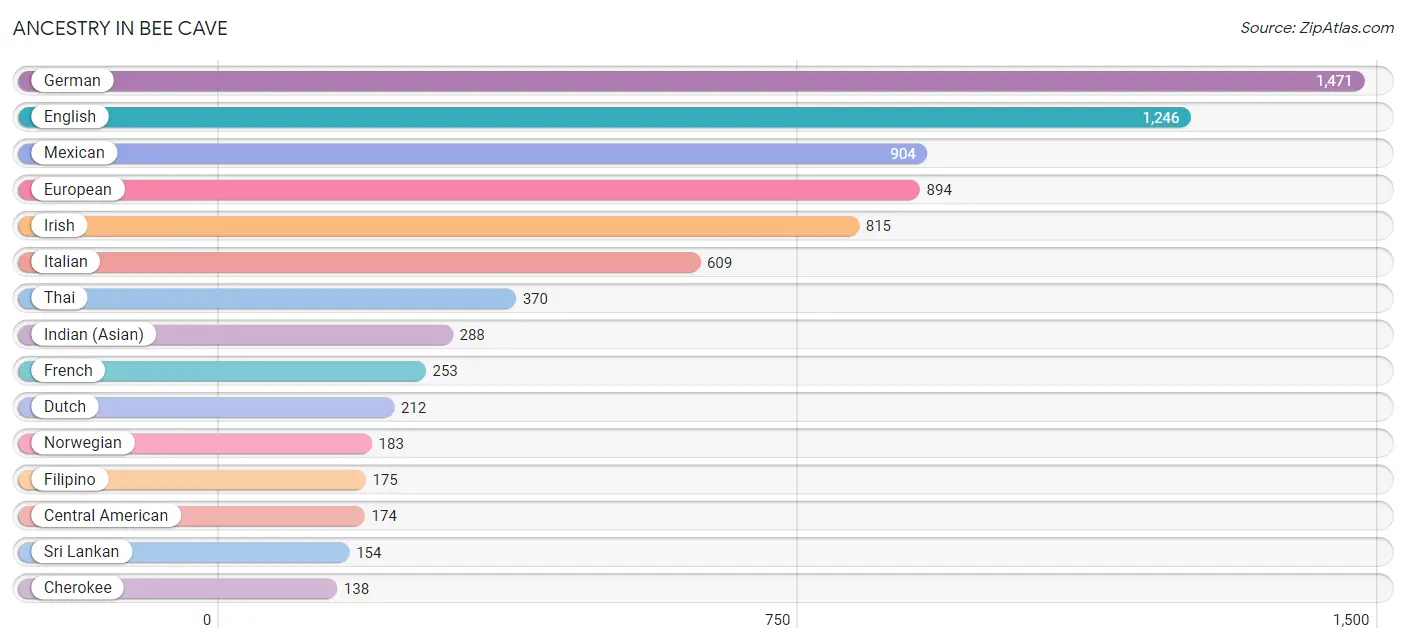
Ancestry in Bee Cave
The most populous ancestries reported in Bee Cave are German (1,471 | 16.8%), English (1,246 | 14.2%), Mexican (904 | 10.3%), European (894 | 10.2%), and Irish (815 | 9.3%), together accounting for 60.8% of all Bee Cave residents.
| Ancestry | # Population | % Population |
| American | 136 | 1.5% |
| Arab | 126 | 1.4% |
| Argentinean | 86 | 1.0% |
| Armenian | 34 | 0.4% |
| Austrian | 18 | 0.2% |
| Belgian | 32 | 0.4% |
| Brazilian | 122 | 1.4% |
| British | 62 | 0.7% |
| Burmese | 121 | 1.4% |
| Cajun | 17 | 0.2% |
| Canadian | 10 | 0.1% |
| Central American | 174 | 2.0% |
| Cherokee | 138 | 1.6% |
| Chickasaw | 22 | 0.3% |
| Creek | 10 | 0.1% |
| Croatian | 52 | 0.6% |
| Czech | 44 | 0.5% |
| Czechoslovakian | 40 | 0.5% |
| Danish | 26 | 0.3% |
| Dutch | 212 | 2.4% |
| Eastern European | 34 | 0.4% |
| English | 1,246 | 14.2% |
| European | 894 | 10.2% |
| Filipino | 175 | 2.0% |
| French | 253 | 2.9% |
| French Canadian | 10 | 0.1% |
| German | 1,471 | 16.8% |
| Hungarian | 50 | 0.6% |
| Indian (Asian) | 288 | 3.3% |
| Iranian | 5 | 0.1% |
| Iraqi | 88 | 1.0% |
| Irish | 815 | 9.3% |
| Italian | 609 | 6.9% |
| Korean | 117 | 1.3% |
| Laotian | 47 | 0.5% |
| Lebanese | 38 | 0.4% |
| Mexican | 904 | 10.3% |
| Northern European | 20 | 0.2% |
| Norwegian | 183 | 2.1% |
| Panamanian | 65 | 0.7% |
| Polish | 137 | 1.6% |
| Portuguese | 30 | 0.3% |
| Puerto Rican | 113 | 1.3% |
| Russian | 106 | 1.2% |
| Salvadoran | 109 | 1.2% |
| Scandinavian | 13 | 0.2% |
| Scotch-Irish | 51 | 0.6% |
| Scottish | 137 | 1.6% |
| South American | 86 | 1.0% |
| Spaniard | 91 | 1.0% |
| Sri Lankan | 154 | 1.8% |
| Swedish | 35 | 0.4% |
| Swiss | 18 | 0.2% |
| Thai | 370 | 4.2% |
| Ukrainian | 67 | 0.8% |
| Welsh | 90 | 1.0% |
| West Indian | 16 | 0.2% | View All 57 Rows |
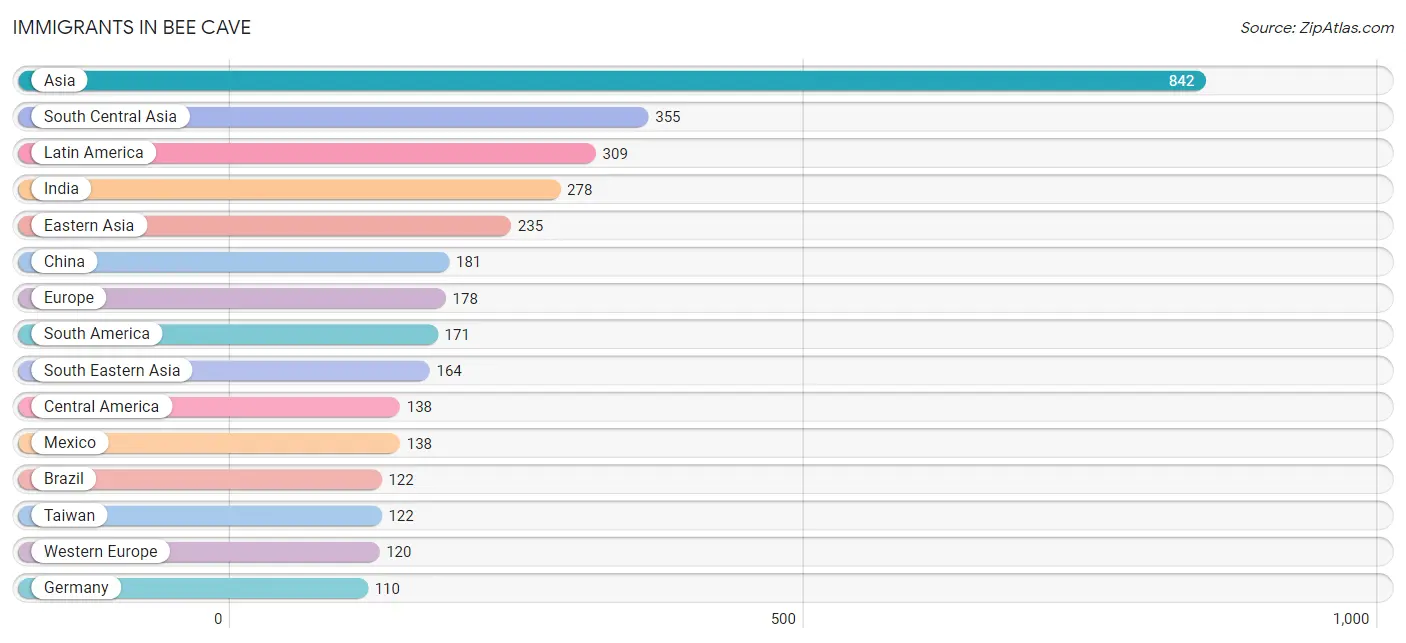
Immigrants in Bee Cave
The most numerous immigrant groups reported in Bee Cave came from Asia (842 | 9.6%), South Central Asia (355 | 4.1%), Latin America (309 | 3.5%), India (278 | 3.2%), and Eastern Asia (235 | 2.7%), together accounting for 23.0% of all Bee Cave residents.
| Immigration Origin | # Population | % Population |
| Argentina | 49 | 0.6% |
| Asia | 842 | 9.6% |
| Brazil | 122 | 1.4% |
| Canada | 81 | 0.9% |
| Central America | 138 | 1.6% |
| China | 181 | 2.1% |
| Croatia | 19 | 0.2% |
| Eastern Asia | 235 | 2.7% |
| Eastern Europe | 34 | 0.4% |
| Europe | 178 | 2.0% |
| France | 10 | 0.1% |
| Germany | 110 | 1.3% |
| Hungary | 15 | 0.2% |
| India | 278 | 3.2% |
| Indonesia | 18 | 0.2% |
| Iraq | 88 | 1.0% |
| Ireland | 24 | 0.3% |
| Korea | 54 | 0.6% |
| Latin America | 309 | 3.5% |
| Mexico | 138 | 1.6% |
| Nepal | 77 | 0.9% |
| Northern Europe | 24 | 0.3% |
| Philippines | 110 | 1.3% |
| South America | 171 | 1.9% |
| South Central Asia | 355 | 4.1% |
| South Eastern Asia | 164 | 1.9% |
| Taiwan | 122 | 1.4% |
| Vietnam | 36 | 0.4% |
| Western Asia | 88 | 1.0% |
| Western Europe | 120 | 1.4% | View All 30 Rows |
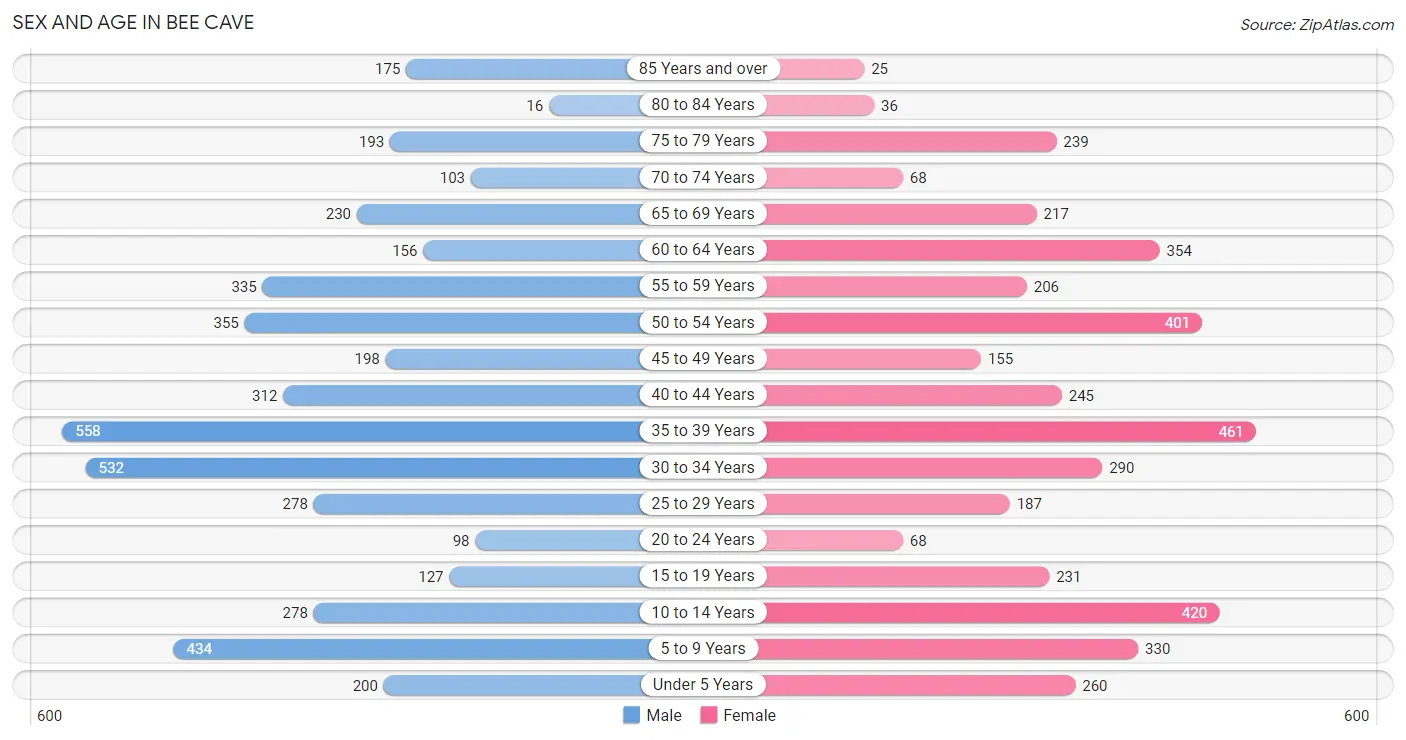
Sex and Age in Bee Cave
Sex and Age in Bee Cave
The most populous age groups in Bee Cave are 35 to 39 Years (558 | 12.2%) for men and 35 to 39 Years (461 | 11.0%) for women.
| Age Bracket | Male | Female |
| Under 5 Years | 200 (4.4%) | 260 (6.2%) |
| 5 to 9 Years | 434 (9.5%) | 330 (7.9%) |
| 10 to 14 Years | 278 (6.1%) | 420 (10.0%) |
| 15 to 19 Years | 127 (2.8%) | 231 (5.5%) |
| 20 to 24 Years | 98 (2.1%) | 68 (1.6%) |
| 25 to 29 Years | 278 (6.1%) | 187 (4.5%) |
| 30 to 34 Years | 532 (11.6%) | 290 (6.9%) |
| 35 to 39 Years | 558 (12.2%) | 461 (11.0%) |
| 40 to 44 Years | 312 (6.8%) | 245 (5.8%) |
| 45 to 49 Years | 198 (4.3%) | 155 (3.7%) |
| 50 to 54 Years | 355 (7.7%) | 401 (9.6%) |
| 55 to 59 Years | 335 (7.3%) | 206 (4.9%) |
| 60 to 64 Years | 156 (3.4%) | 354 (8.4%) |
| 65 to 69 Years | 230 (5.0%) | 217 (5.2%) |
| 70 to 74 Years | 103 (2.2%) | 68 (1.6%) |
| 75 to 79 Years | 193 (4.2%) | 239 (5.7%) |
| 80 to 84 Years | 16 (0.4%) | 36 (0.9%) |
| 85 Years and over | 175 (3.8%) | 25 (0.6%) |
| Total | 4,578 (100.0%) | 4,193 (100.0%) |
Families and Households in Bee Cave
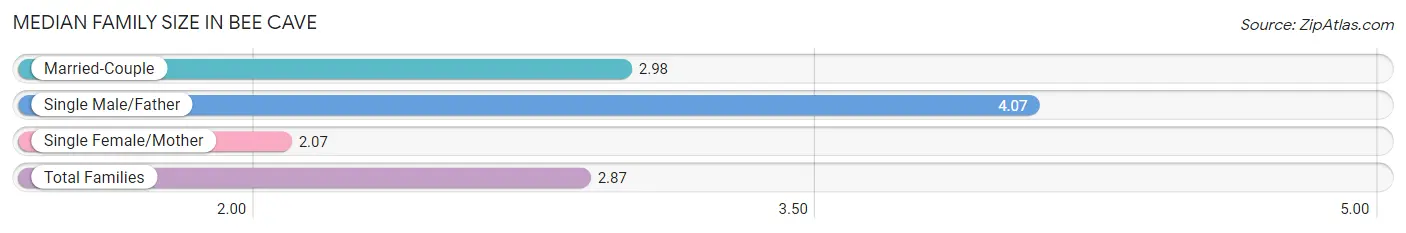
Median Family Size in Bee Cave
The median family size in Bee Cave is 2.87 persons per family, with single male/father families (43 | 1.8%) accounting for the largest median family size of 4.07 persons per family. On the other hand, single female/mother families (333 | 14.3%) represent the smallest median family size with 2.07 persons per family.
| Family Type | # Families | Family Size |
| Married-Couple | 1,951 (83.8%) | 2.98 |
| Single Male/Father | 43 (1.8%) | 4.07 |
| Single Female/Mother | 333 (14.3%) | 2.07 |
| Total Families | 2,327 (100.0%) | 2.87 |
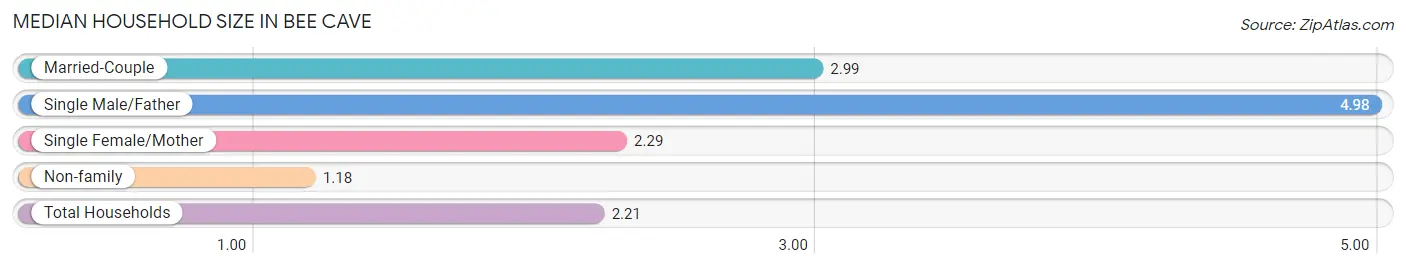
Median Household Size in Bee Cave
The median household size in Bee Cave is 2.21 persons per household, with single male/father households (43 | 1.1%) accounting for the largest median household size of 4.98 persons per household. non-family households (1,637 | 41.3%) represent the smallest median household size with 1.18 persons per household.
| Household Type | # Households | Household Size |
| Married-Couple | 1,951 (49.2%) | 2.99 |
| Single Male/Father | 43 (1.1%) | 4.98 |
| Single Female/Mother | 333 (8.4%) | 2.29 |
| Non-family | 1,637 (41.3%) | 1.18 |
| Total Households | 3,964 (100.0%) | 2.21 |
Household Size by Marriage Status in Bee Cave
Out of a total of 3,964 households in Bee Cave, 2,327 (58.7%) are family households, while 1,637 (41.3%) are nonfamily households. The most numerous type of family households are 2-person households, comprising 1,171, and the most common type of nonfamily households are 1-person households, comprising 1,389.
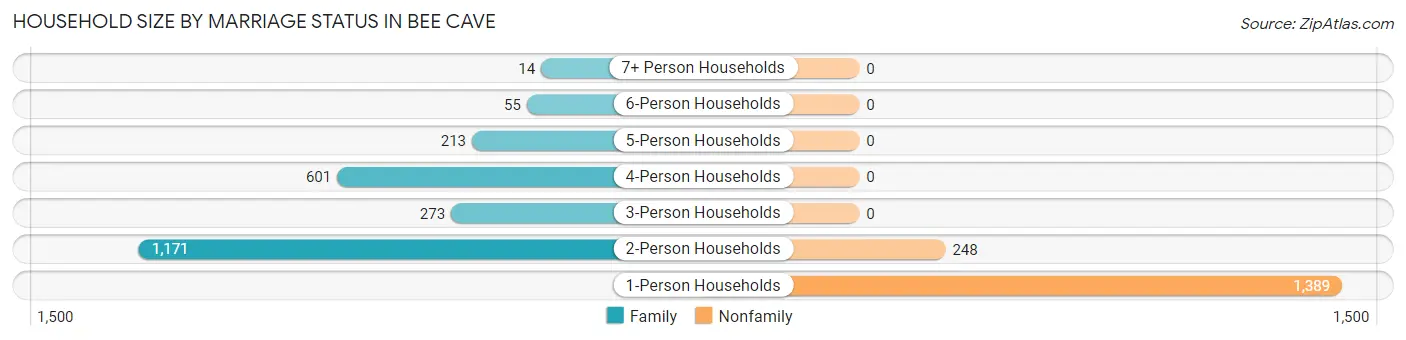
| Household Size | Family Households | Nonfamily Households |
| 1-Person Households | - | 1,389 (35.0%) |
| 2-Person Households | 1,171 (29.5%) | 248 (6.3%) |
| 3-Person Households | 273 (6.9%) | 0 (0.0%) |
| 4-Person Households | 601 (15.2%) | 0 (0.0%) |
| 5-Person Households | 213 (5.4%) | 0 (0.0%) |
| 6-Person Households | 55 (1.4%) | 0 (0.0%) |
| 7+ Person Households | 14 (0.4%) | 0 (0.0%) |
| Total | 2,327 (58.7%) | 1,637 (41.3%) |
Female Fertility in Bee Cave
Fertility by Age in Bee Cave
Average fertility rate in Bee Cave is 41.0 births per 1,000 women. Women in the age bracket of 35 to 50 years have the highest fertility rate with 74.0 births per 1,000 women. Women in the age bracket of 35 to 50 years acount for 100.0% of all women with births.
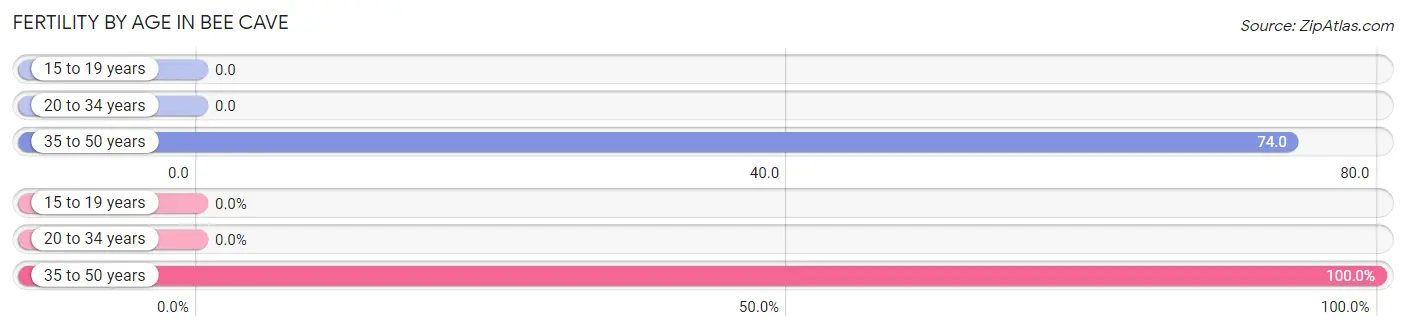
| Age Bracket | Women with Births | Births / 1,000 Women |
| 15 to 19 years | 0 (0.0%) | 0.0 |
| 20 to 34 years | 0 (0.0%) | 0.0 |
| 35 to 50 years | 73 (100.0%) | 74.0 |
| Total | 73 (100.0%) | 41.0 |
Fertility by Age by Marriage Status in Bee Cave
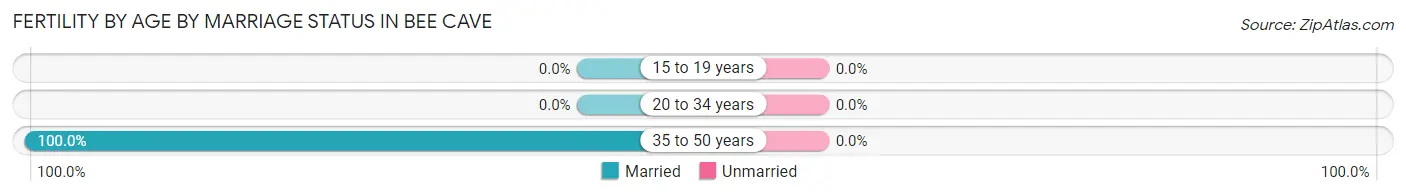
| Age Bracket | Married | Unmarried |
| 15 to 19 years | 0 (0.0%) | 0 (0.0%) |
| 20 to 34 years | 0 (0.0%) | 0 (0.0%) |
| 35 to 50 years | 73 (100.0%) | 0 (0.0%) |
| Total | 73 (100.0%) | 0 (0.0%) |
Fertility by Education in Bee Cave
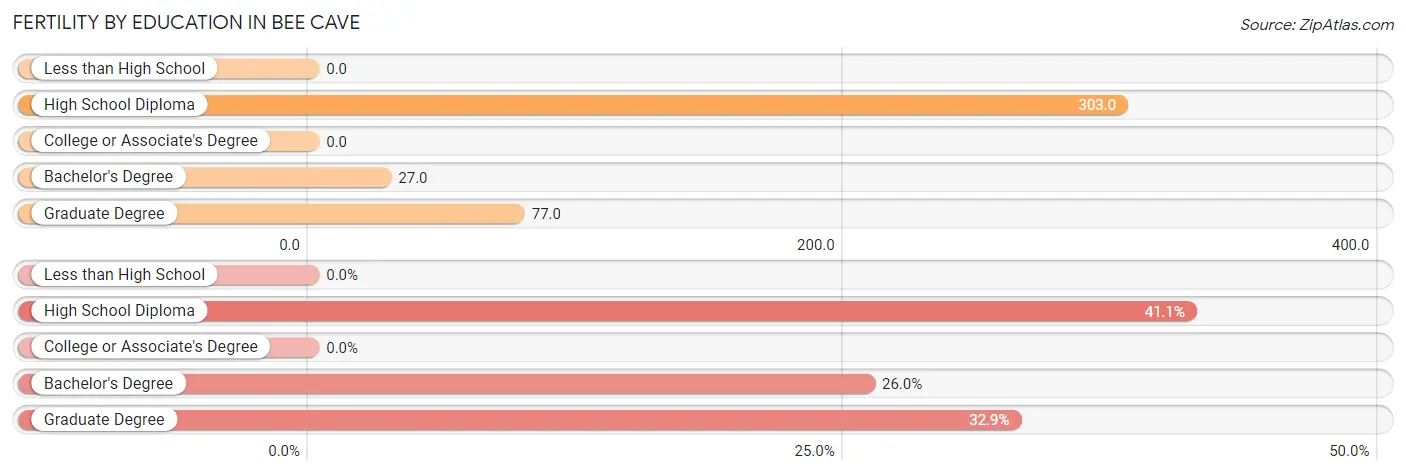
| Educational Attainment | Women with Births | Births / 1,000 Women |
| Less than High School | 0 (0.0%) | 0.0 |
| High School Diploma | 30 (41.1%) | 303.0 |
| College or Associate's Degree | 0 (0.0%) | 0.0 |
| Bachelor's Degree | 19 (26.0%) | 27.0 |
| Graduate Degree | 24 (32.9%) | 77.0 |
| Total | 73 (100.0%) | 41.0 |
Fertility by Education by Marriage Status in Bee Cave
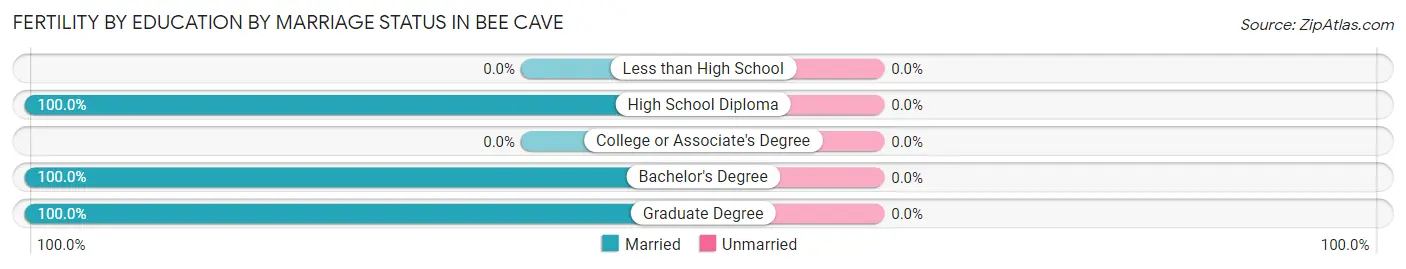
| Educational Attainment | Married | Unmarried |
| Less than High School | 0 (0.0%) | 0 (0.0%) |
| High School Diploma | 30 (100.0%) | 0 (0.0%) |
| College or Associate's Degree | 0 (0.0%) | 0 (0.0%) |
| Bachelor's Degree | 19 (100.0%) | 0 (0.0%) |
| Graduate Degree | 24 (100.0%) | 0 (0.0%) |
| Total | 73 (100.0%) | 0 (0.0%) |
Employment Characteristics in Bee Cave
Employment by Class of Employer in Bee Cave
Among the 4,413 employed individuals in Bee Cave, private company employees (3,387 | 76.7%), state government employees (248 | 5.6%), and local government employees (223 | 5.1%) make up the most common classes of employment.
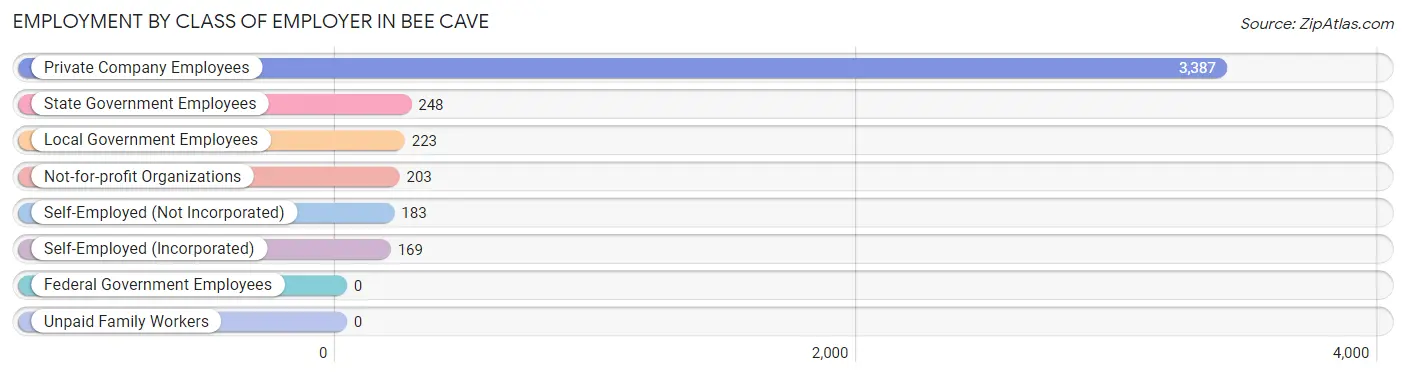
| Employer Class | # Employees | % Employees |
| Private Company Employees | 3,387 | 76.7% |
| Self-Employed (Incorporated) | 169 | 3.8% |
| Self-Employed (Not Incorporated) | 183 | 4.2% |
| Not-for-profit Organizations | 203 | 4.6% |
| Local Government Employees | 223 | 5.1% |
| State Government Employees | 248 | 5.6% |
| Federal Government Employees | 0 | 0.0% |
| Unpaid Family Workers | 0 | 0.0% |
| Total | 4,413 | 100.0% |
Employment Status by Age in Bee Cave
According to the labor force statistics for Bee Cave, out of the total population over 16 years of age (6,650), 67.8% or 4,509 individuals are in the labor force, with 1.2% or 54 of them unemployed. The age group with the highest labor force participation rate is 30 to 34 years, with 96.0% or 789 individuals in the labor force. Within the labor force, the 25 to 29 years age range has the highest percentage of unemployed individuals, with 4.2% or 12 of them being unemployed.
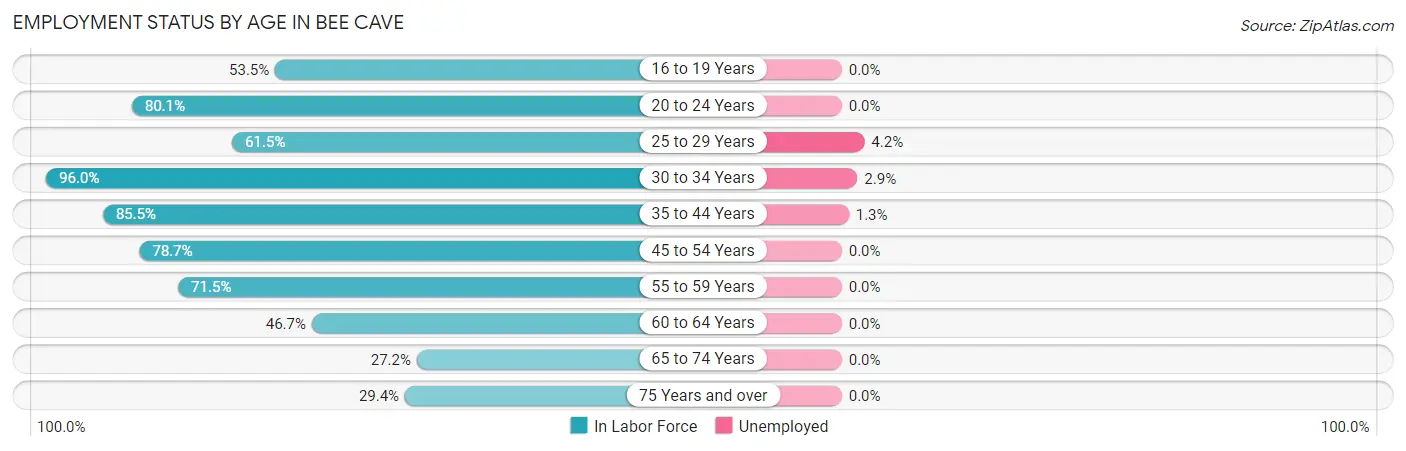
| Age Bracket | In Labor Force | Unemployed |
| 16 to 19 Years | 85 (53.5%) | 0 (0.0%) |
| 20 to 24 Years | 133 (80.1%) | 0 (0.0%) |
| 25 to 29 Years | 286 (61.5%) | 12 (4.2%) |
| 30 to 34 Years | 789 (96.0%) | 23 (2.9%) |
| 35 to 44 Years | 1,347 (85.5%) | 18 (1.3%) |
| 45 to 54 Years | 873 (78.7%) | 0 (0.0%) |
| 55 to 59 Years | 387 (71.5%) | 0 (0.0%) |
| 60 to 64 Years | 238 (46.7%) | 0 (0.0%) |
| 65 to 74 Years | 168 (27.2%) | 0 (0.0%) |
| 75 Years and over | 201 (29.4%) | 0 (0.0%) |
| Total | 4,509 (67.8%) | 54 (1.2%) |
Employment Status by Educational Attainment in Bee Cave
According to labor force statistics for Bee Cave, 78.1% of individuals (3,923) out of the total population between 25 and 64 years of age (5,023) are in the labor force, with 1.4% or 55 of them being unemployed. The group with the highest labor force participation rate are those with the educational attainment of less than high school, with 95.7% or 44 individuals in the labor force. Within the labor force, individuals with bachelor's degree or higher education have the highest percentage of unemployment, with 2.0% or 52 of them being unemployed.
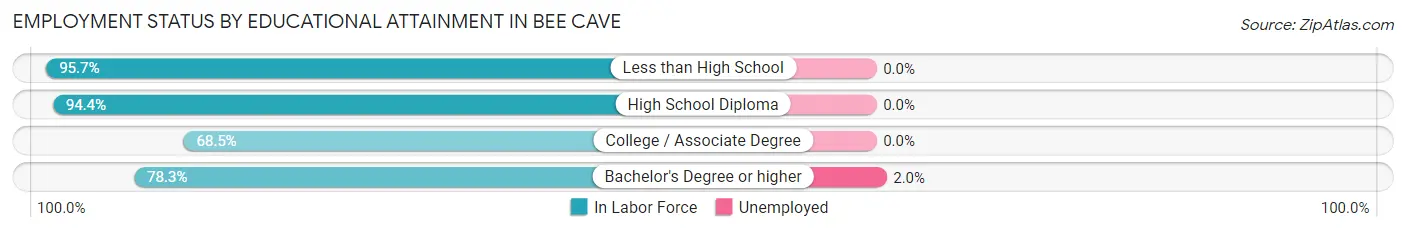
| Educational Attainment | In Labor Force | Unemployed |
| Less than High School | 44 (95.7%) | 0 (0.0%) |
| High School Diploma | 519 (94.4%) | 0 (0.0%) |
| College / Associate Degree | 746 (68.5%) | 0 (0.0%) |
| Bachelor's Degree or higher | 2,614 (78.3%) | 67 (2.0%) |
| Total | 3,923 (78.1%) | 70 (1.4%) |
Employment Occupations by Sex in Bee Cave
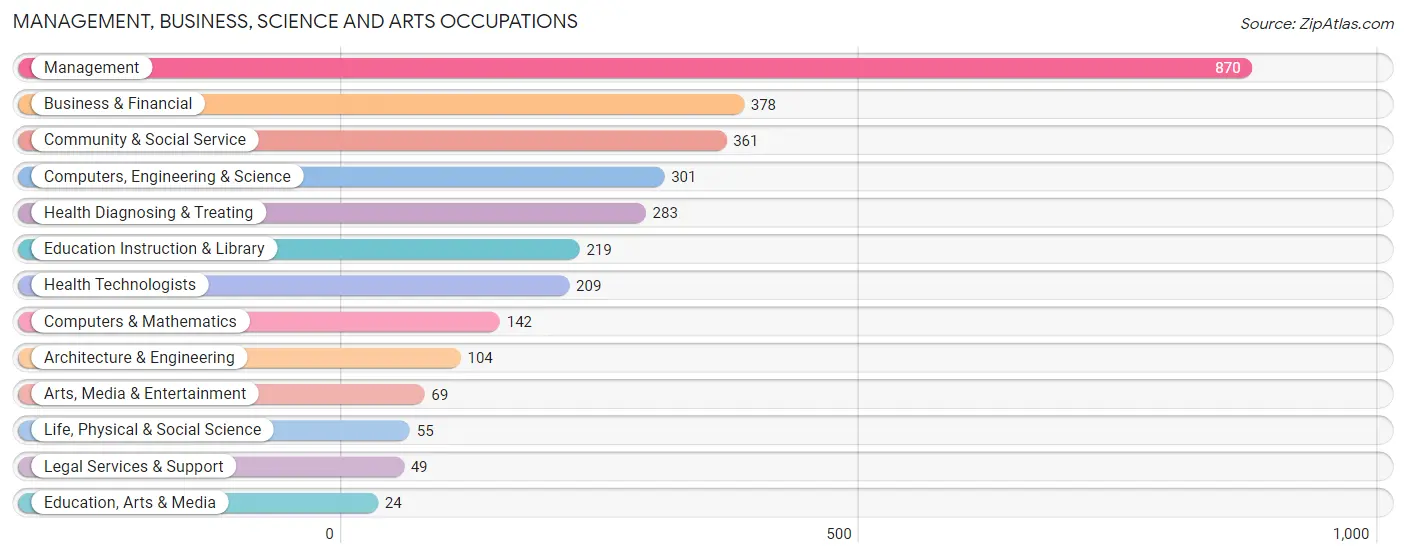
Management, Business, Science and Arts Occupations
The most common Management, Business, Science and Arts occupations in Bee Cave are Management (870 | 19.5%), Business & Financial (378 | 8.5%), Community & Social Service (361 | 8.1%), Computers, Engineering & Science (301 | 6.8%), and Health Diagnosing & Treating (283 | 6.4%).
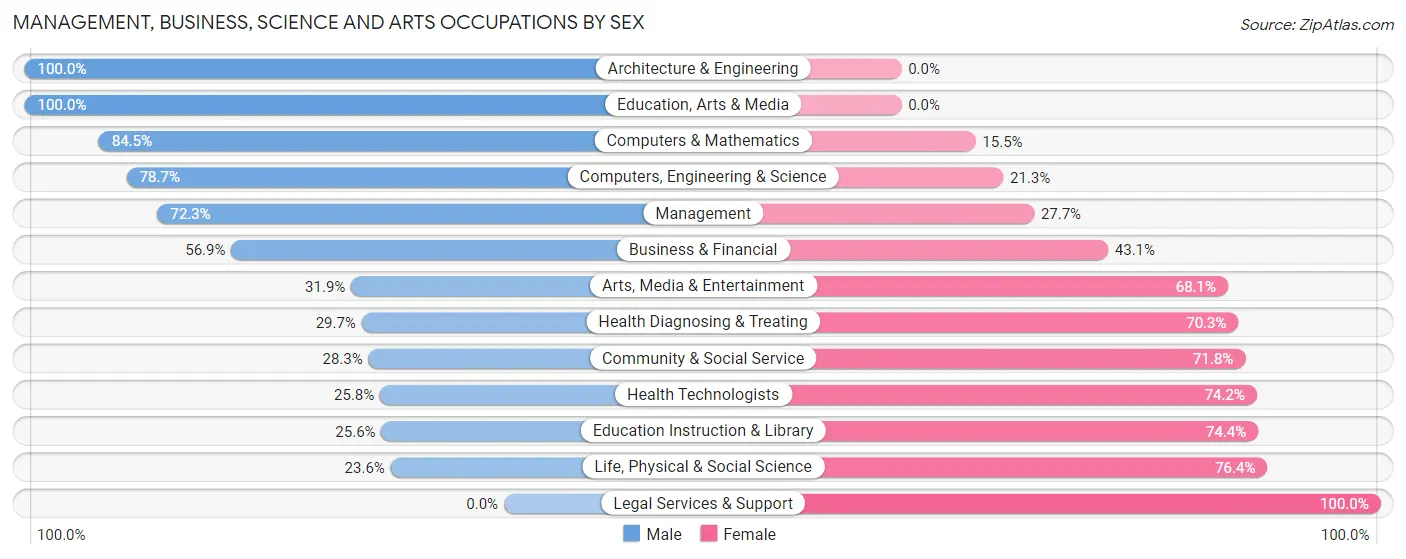
Management, Business, Science and Arts Occupations by Sex
Within the Management, Business, Science and Arts occupations in Bee Cave, the most male-oriented occupations are Architecture & Engineering (100.0%), Education, Arts & Media (100.0%), and Computers & Mathematics (84.5%), while the most female-oriented occupations are Legal Services & Support (100.0%), Life, Physical & Social Science (76.4%), and Education Instruction & Library (74.4%).
| Occupation | Male | Female |
| Management | 629 (72.3%) | 241 (27.7%) |
| Business & Financial | 215 (56.9%) | 163 (43.1%) |
| Computers, Engineering & Science | 237 (78.7%) | 64 (21.3%) |
| Computers & Mathematics | 120 (84.5%) | 22 (15.5%) |
| Architecture & Engineering | 104 (100.0%) | 0 (0.0%) |
| Life, Physical & Social Science | 13 (23.6%) | 42 (76.4%) |
| Community & Social Service | 102 (28.2%) | 259 (71.8%) |
| Education, Arts & Media | 24 (100.0%) | 0 (0.0%) |
| Legal Services & Support | 0 (0.0%) | 49 (100.0%) |
| Education Instruction & Library | 56 (25.6%) | 163 (74.4%) |
| Arts, Media & Entertainment | 22 (31.9%) | 47 (68.1%) |
| Health Diagnosing & Treating | 84 (29.7%) | 199 (70.3%) |
| Health Technologists | 54 (25.8%) | 155 (74.2%) |
| Total (Category) | 1,267 (57.8%) | 926 (42.2%) |
| Total (Overall) | 2,774 (62.3%) | 1,681 (37.7%) |
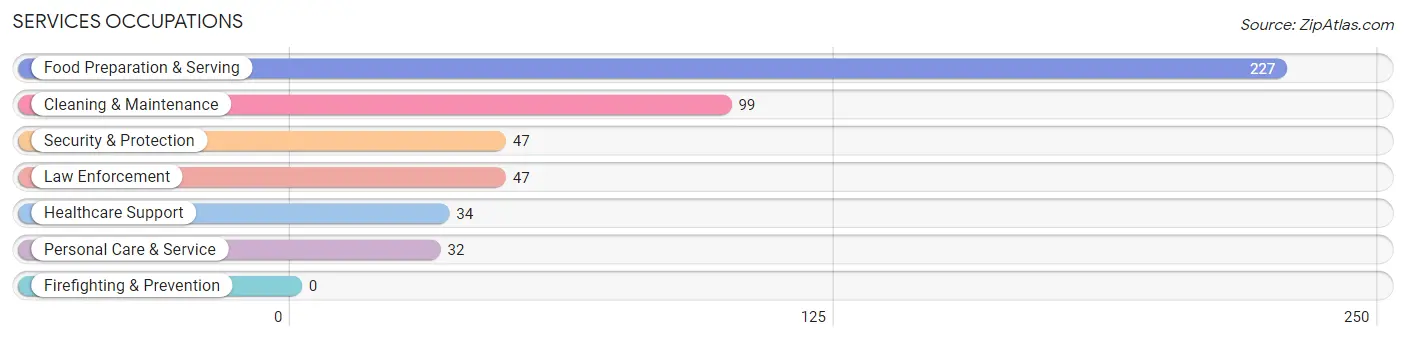
Services Occupations
The most common Services occupations in Bee Cave are Food Preparation & Serving (227 | 5.1%), Cleaning & Maintenance (99 | 2.2%), Security & Protection (47 | 1.1%), Law Enforcement (47 | 1.1%), and Healthcare Support (34 | 0.8%).
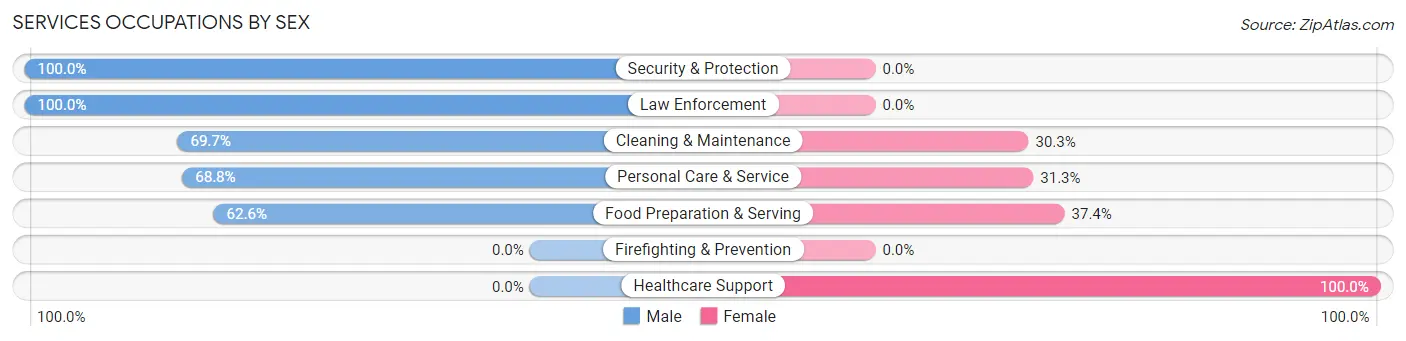
Services Occupations by Sex
Within the Services occupations in Bee Cave, the most male-oriented occupations are Security & Protection (100.0%), Law Enforcement (100.0%), and Cleaning & Maintenance (69.7%), while the most female-oriented occupations are Healthcare Support (100.0%), Food Preparation & Serving (37.4%), and Personal Care & Service (31.2%).
| Occupation | Male | Female |
| Healthcare Support | 0 (0.0%) | 34 (100.0%) |
| Security & Protection | 47 (100.0%) | 0 (0.0%) |
| Firefighting & Prevention | 0 (0.0%) | 0 (0.0%) |
| Law Enforcement | 47 (100.0%) | 0 (0.0%) |
| Food Preparation & Serving | 142 (62.6%) | 85 (37.4%) |
| Cleaning & Maintenance | 69 (69.7%) | 30 (30.3%) |
| Personal Care & Service | 22 (68.8%) | 10 (31.2%) |
| Total (Category) | 280 (63.8%) | 159 (36.2%) |
| Total (Overall) | 2,774 (62.3%) | 1,681 (37.7%) |
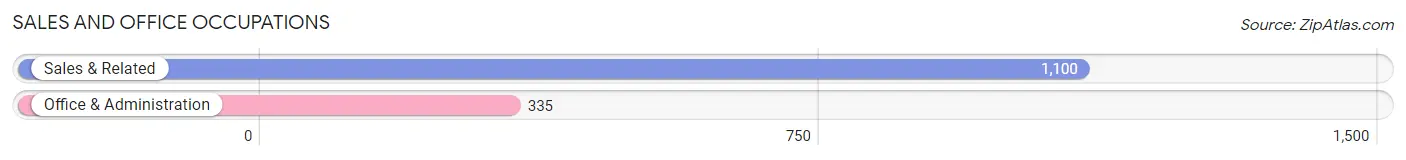
Sales and Office Occupations
The most common Sales and Office occupations in Bee Cave are Sales & Related (1,100 | 24.7%), and Office & Administration (335 | 7.5%).
Sales and Office Occupations by Sex
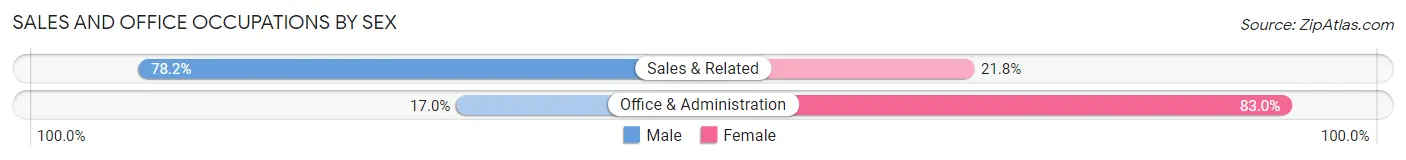
| Occupation | Male | Female |
| Sales & Related | 860 (78.2%) | 240 (21.8%) |
| Office & Administration | 57 (17.0%) | 278 (83.0%) |
| Total (Category) | 917 (63.9%) | 518 (36.1%) |
| Total (Overall) | 2,774 (62.3%) | 1,681 (37.7%) |
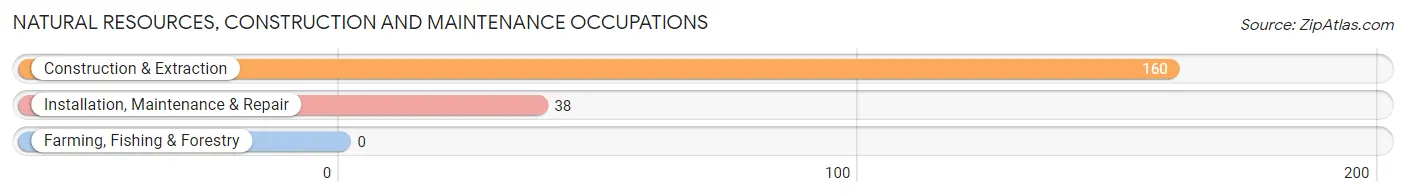
Natural Resources, Construction and Maintenance Occupations
The most common Natural Resources, Construction and Maintenance occupations in Bee Cave are Construction & Extraction (160 | 3.6%), and Installation, Maintenance & Repair (38 | 0.9%).
Natural Resources, Construction and Maintenance Occupations by Sex
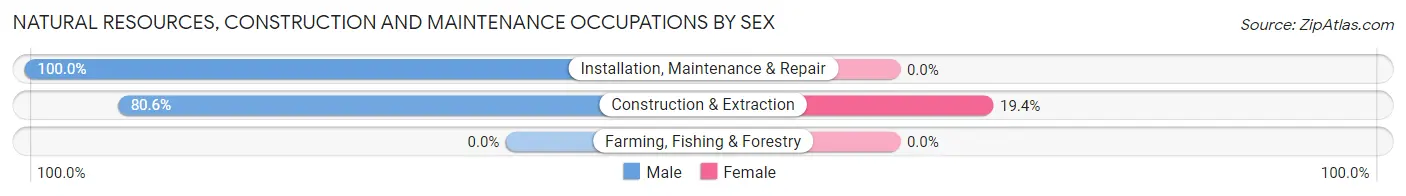
| Occupation | Male | Female |
| Farming, Fishing & Forestry | 0 (0.0%) | 0 (0.0%) |
| Construction & Extraction | 129 (80.6%) | 31 (19.4%) |
| Installation, Maintenance & Repair | 38 (100.0%) | 0 (0.0%) |
| Total (Category) | 167 (84.3%) | 31 (15.7%) |
| Total (Overall) | 2,774 (62.3%) | 1,681 (37.7%) |
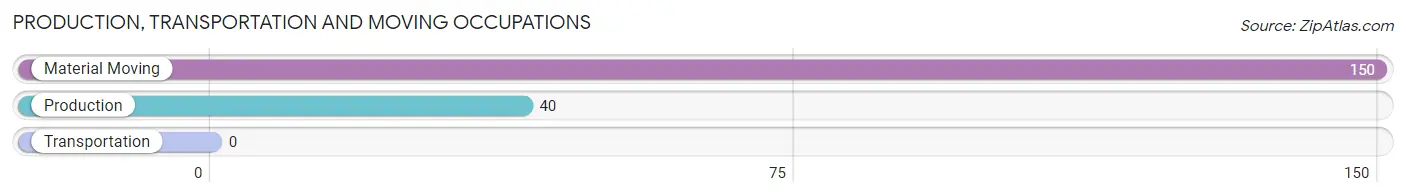
Production, Transportation and Moving Occupations
The most common Production, Transportation and Moving occupations in Bee Cave are Material Moving (150 | 3.4%), and Production (40 | 0.9%).
Production, Transportation and Moving Occupations by Sex
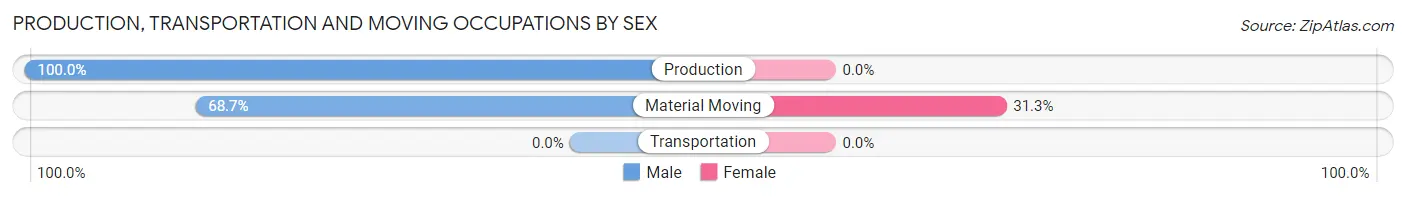
| Occupation | Male | Female |
| Production | 40 (100.0%) | 0 (0.0%) |
| Transportation | 0 (0.0%) | 0 (0.0%) |
| Material Moving | 103 (68.7%) | 47 (31.3%) |
| Total (Category) | 143 (75.3%) | 47 (24.7%) |
| Total (Overall) | 2,774 (62.3%) | 1,681 (37.7%) |
Employment Industries by Sex in Bee Cave
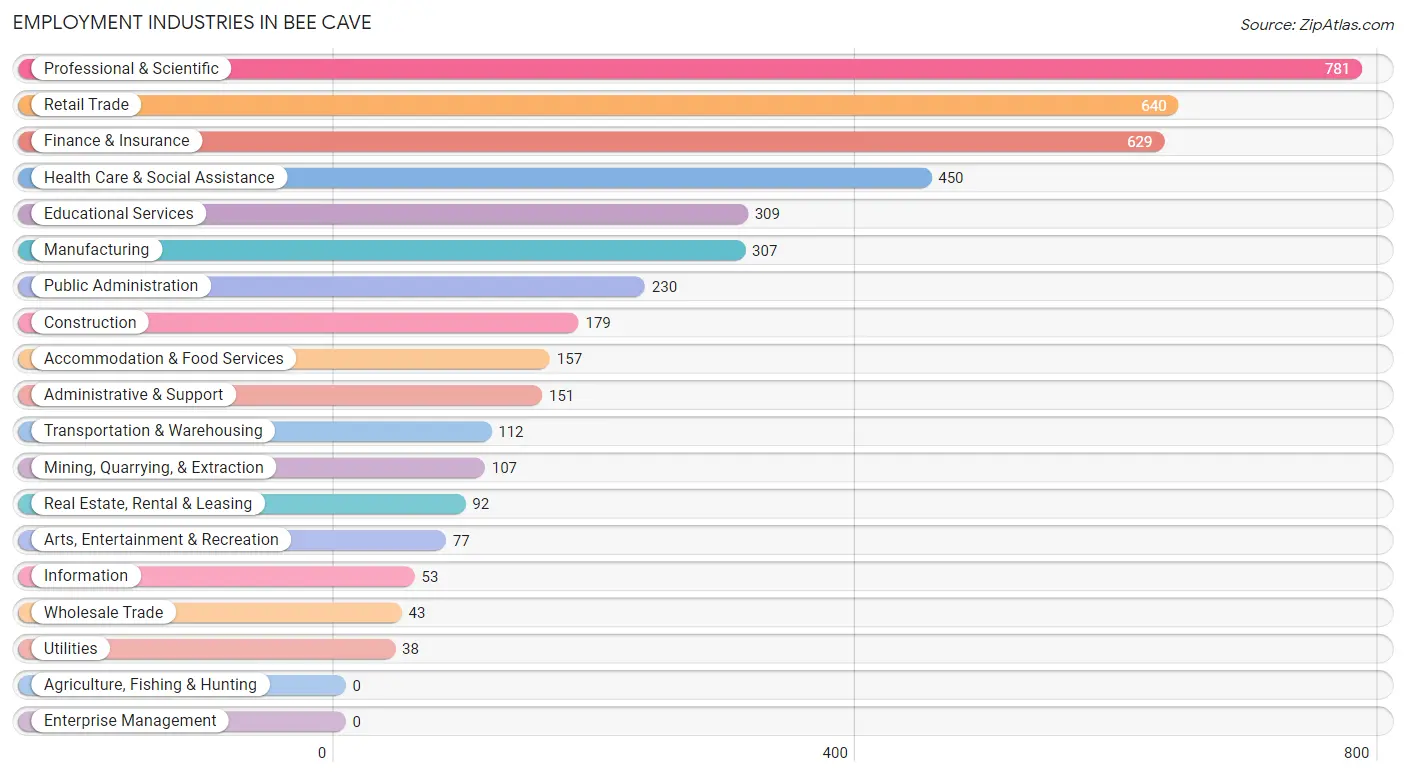
Employment Industries in Bee Cave
The major employment industries in Bee Cave include Professional & Scientific (781 | 17.5%), Retail Trade (640 | 14.4%), Finance & Insurance (629 | 14.1%), Health Care & Social Assistance (450 | 10.1%), and Educational Services (309 | 6.9%).
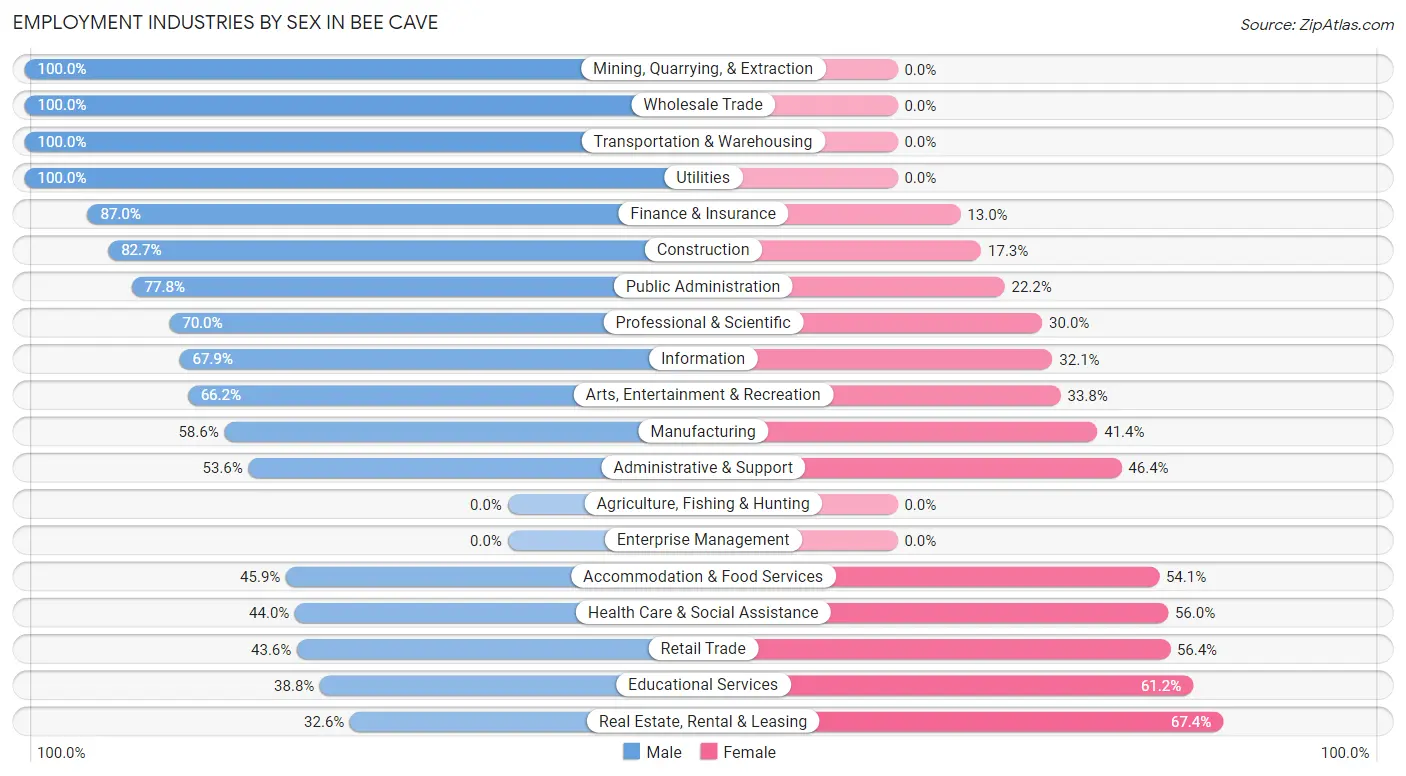
Employment Industries by Sex in Bee Cave
The Bee Cave industries that see more men than women are Mining, Quarrying, & Extraction (100.0%), Wholesale Trade (100.0%), and Transportation & Warehousing (100.0%), whereas the industries that tend to have a higher number of women are Real Estate, Rental & Leasing (67.4%), Educational Services (61.2%), and Retail Trade (56.4%).
| Industry | Male | Female |
| Agriculture, Fishing & Hunting | 0 (0.0%) | 0 (0.0%) |
| Mining, Quarrying, & Extraction | 107 (100.0%) | 0 (0.0%) |
| Construction | 148 (82.7%) | 31 (17.3%) |
| Manufacturing | 180 (58.6%) | 127 (41.4%) |
| Wholesale Trade | 43 (100.0%) | 0 (0.0%) |
| Retail Trade | 279 (43.6%) | 361 (56.4%) |
| Transportation & Warehousing | 112 (100.0%) | 0 (0.0%) |
| Utilities | 38 (100.0%) | 0 (0.0%) |
| Information | 36 (67.9%) | 17 (32.1%) |
| Finance & Insurance | 547 (87.0%) | 82 (13.0%) |
| Real Estate, Rental & Leasing | 30 (32.6%) | 62 (67.4%) |
| Professional & Scientific | 547 (70.0%) | 234 (30.0%) |
| Enterprise Management | 0 (0.0%) | 0 (0.0%) |
| Administrative & Support | 81 (53.6%) | 70 (46.4%) |
| Educational Services | 120 (38.8%) | 189 (61.2%) |
| Health Care & Social Assistance | 198 (44.0%) | 252 (56.0%) |
| Arts, Entertainment & Recreation | 51 (66.2%) | 26 (33.8%) |
| Accommodation & Food Services | 72 (45.9%) | 85 (54.1%) |
| Public Administration | 179 (77.8%) | 51 (22.2%) |
| Total | 2,774 (62.3%) | 1,681 (37.7%) |
Education in Bee Cave
School Enrollment in Bee Cave
The most common levels of schooling among the 2,072 students in Bee Cave are elementary school (688 | 33.2%), middle school (459 | 22.2%), and high school (398 | 19.2%).
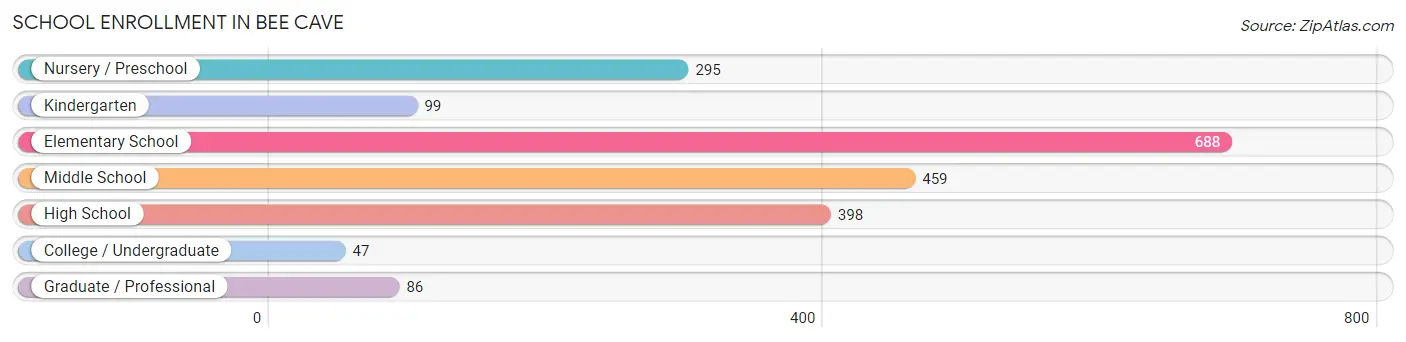
| School Level | # Students | % Students |
| Nursery / Preschool | 295 | 14.2% |
| Kindergarten | 99 | 4.8% |
| Elementary School | 688 | 33.2% |
| Middle School | 459 | 22.2% |
| High School | 398 | 19.2% |
| College / Undergraduate | 47 | 2.3% |
| Graduate / Professional | 86 | 4.2% |
| Total | 2,072 | 100.0% |
School Enrollment by Age by Funding Source in Bee Cave
Out of a total of 2,072 students who are enrolled in schools in Bee Cave, 390 (18.8%) attend a private institution, while the remaining 1,682 (81.2%) are enrolled in public schools. The age group of 18 to 19 year olds has the highest likelihood of being enrolled in private schools, with 30 (100.0% in the age bracket) enrolled. Conversely, the age group of 10 to 14 year olds has the lowest likelihood of being enrolled in a private school, with 698 (100.0% in the age bracket) attending a public institution.
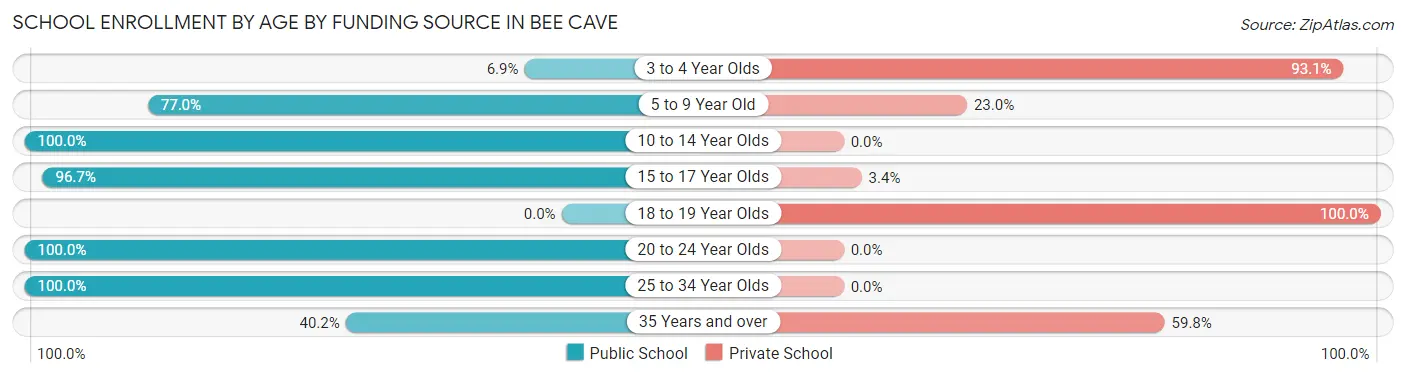
| Age Bracket | Public School | Private School |
| 3 to 4 Year Olds | 9 (6.9%) | 121 (93.1%) |
| 5 to 9 Year Old | 580 (77.0%) | 173 (23.0%) |
| 10 to 14 Year Olds | 698 (100.0%) | 0 (0.0%) |
| 15 to 17 Year Olds | 317 (96.7%) | 11 (3.4%) |
| 18 to 19 Year Olds | 0 (0.0%) | 30 (100.0%) |
| 20 to 24 Year Olds | 29 (100.0%) | 0 (0.0%) |
| 25 to 34 Year Olds | 12 (100.0%) | 0 (0.0%) |
| 35 Years and over | 37 (40.2%) | 55 (59.8%) |
| Total | 1,682 (81.2%) | 390 (18.8%) |
Educational Attainment by Field of Study in Bee Cave
Business (1,465 | 33.7%), engineering (553 | 12.7%), education (397 | 9.1%), social sciences (326 | 7.5%), and computers & mathematics (245 | 5.6%) are the most common fields of study among 4,353 individuals in Bee Cave who have obtained a bachelor's degree or higher.
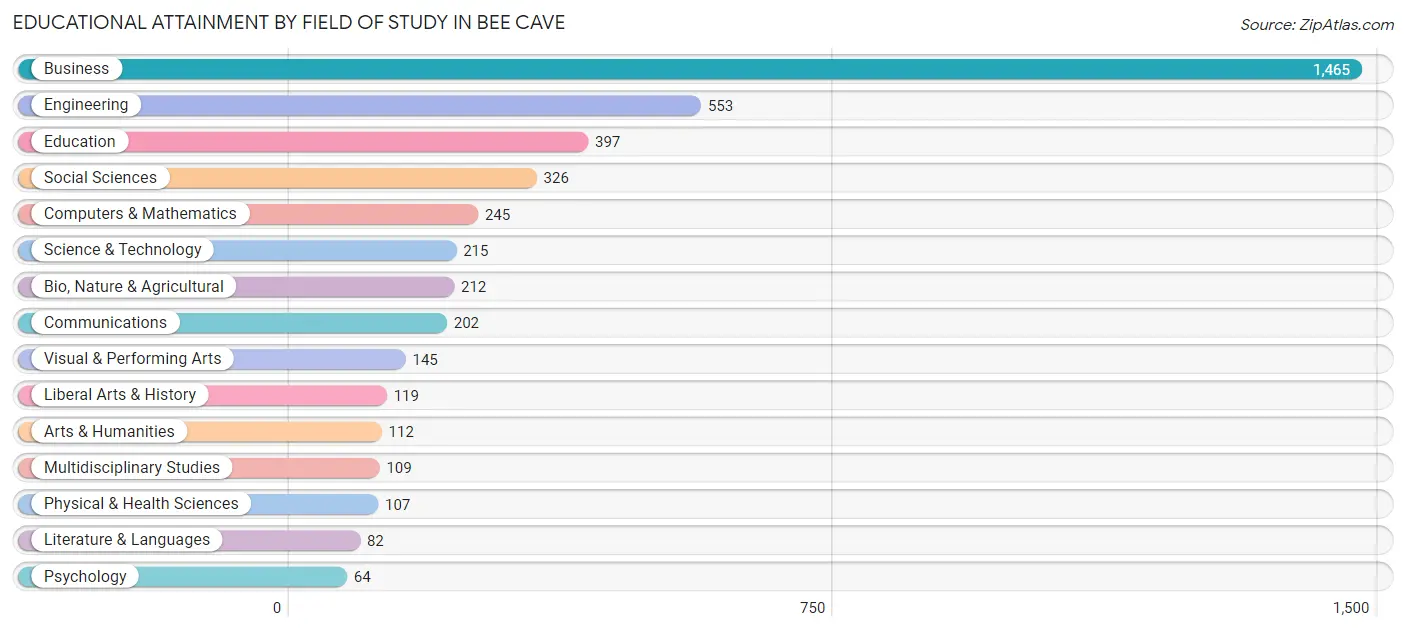
| Field of Study | # Graduates | % Graduates |
| Computers & Mathematics | 245 | 5.6% |
| Bio, Nature & Agricultural | 212 | 4.9% |
| Physical & Health Sciences | 107 | 2.5% |
| Psychology | 64 | 1.5% |
| Social Sciences | 326 | 7.5% |
| Engineering | 553 | 12.7% |
| Multidisciplinary Studies | 109 | 2.5% |
| Science & Technology | 215 | 4.9% |
| Business | 1,465 | 33.7% |
| Education | 397 | 9.1% |
| Literature & Languages | 82 | 1.9% |
| Liberal Arts & History | 119 | 2.7% |
| Visual & Performing Arts | 145 | 3.3% |
| Communications | 202 | 4.6% |
| Arts & Humanities | 112 | 2.6% |
| Total | 4,353 | 100.0% |
Transportation & Commute in Bee Cave
Vehicle Availability by Sex in Bee Cave
The most prevalent vehicle ownership categories in Bee Cave are males with 2 vehicles (1,271, accounting for 46.1%) and females with 2 vehicles (764, making up 76.9%).
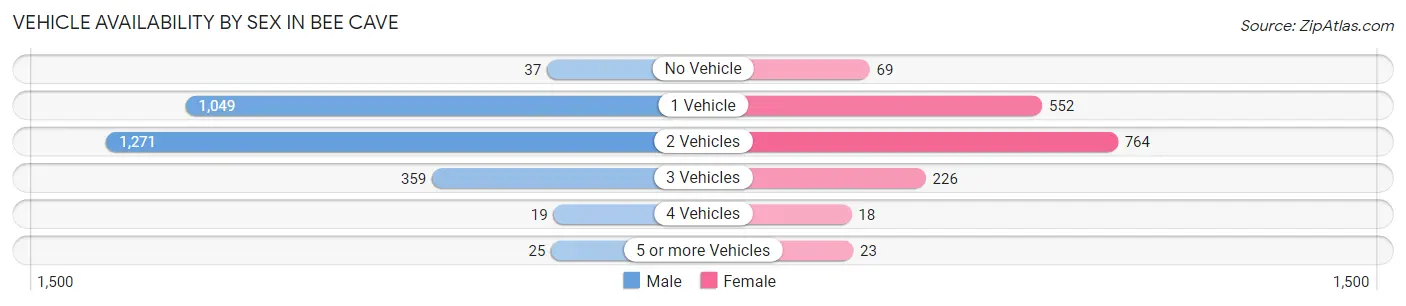
| Vehicles Available | Male | Female |
| No Vehicle | 37 (1.3%) | 69 (4.2%) |
| 1 Vehicle | 1,049 (38.0%) | 552 (33.4%) |
| 2 Vehicles | 1,271 (46.1%) | 764 (46.3%) |
| 3 Vehicles | 359 (13.0%) | 226 (13.7%) |
| 4 Vehicles | 19 (0.7%) | 18 (1.1%) |
| 5 or more Vehicles | 25 (0.9%) | 23 (1.4%) |
| Total | 2,760 (100.0%) | 1,652 (100.0%) |
Commute Time in Bee Cave
The most frequently occuring commute durations in Bee Cave are 10 to 14 minutes (684 commuters, 21.0%), 30 to 34 minutes (542 commuters, 16.7%), and 15 to 19 minutes (504 commuters, 15.5%).
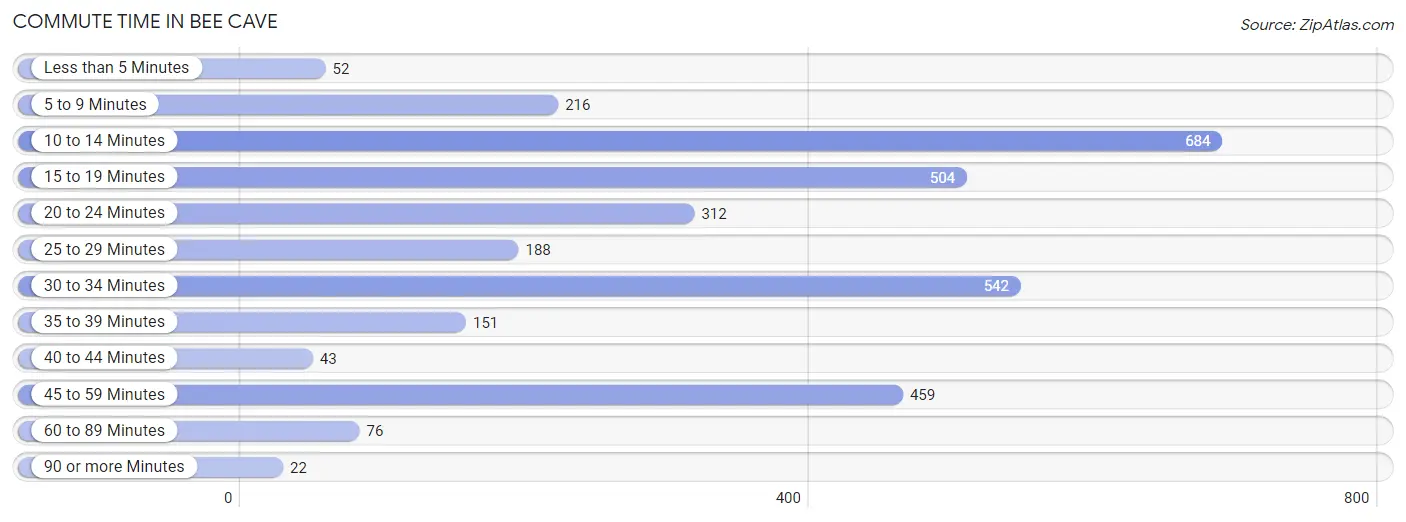
| Commute Time | # Commuters | % Commuters |
| Less than 5 Minutes | 52 | 1.6% |
| 5 to 9 Minutes | 216 | 6.7% |
| 10 to 14 Minutes | 684 | 21.0% |
| 15 to 19 Minutes | 504 | 15.5% |
| 20 to 24 Minutes | 312 | 9.6% |
| 25 to 29 Minutes | 188 | 5.8% |
| 30 to 34 Minutes | 542 | 16.7% |
| 35 to 39 Minutes | 151 | 4.6% |
| 40 to 44 Minutes | 43 | 1.3% |
| 45 to 59 Minutes | 459 | 14.1% |
| 60 to 89 Minutes | 76 | 2.3% |
| 90 or more Minutes | 22 | 0.7% |
Commute Time by Sex in Bee Cave
The most common commute times in Bee Cave are 30 to 34 minutes (442 commuters, 23.3%) for males and 10 to 14 minutes (383 commuters, 28.4%) for females.
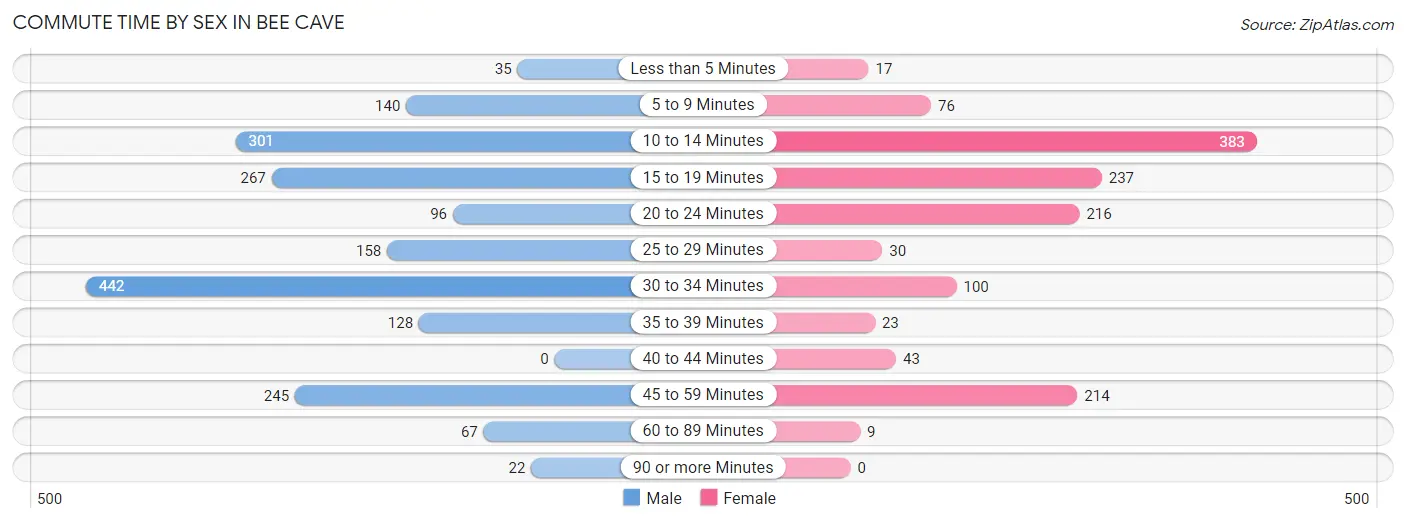
| Commute Time | Male | Female |
| Less than 5 Minutes | 35 (1.8%) | 17 (1.3%) |
| 5 to 9 Minutes | 140 (7.4%) | 76 (5.6%) |
| 10 to 14 Minutes | 301 (15.8%) | 383 (28.4%) |
| 15 to 19 Minutes | 267 (14.1%) | 237 (17.6%) |
| 20 to 24 Minutes | 96 (5.1%) | 216 (16.0%) |
| 25 to 29 Minutes | 158 (8.3%) | 30 (2.2%) |
| 30 to 34 Minutes | 442 (23.3%) | 100 (7.4%) |
| 35 to 39 Minutes | 128 (6.7%) | 23 (1.7%) |
| 40 to 44 Minutes | 0 (0.0%) | 43 (3.2%) |
| 45 to 59 Minutes | 245 (12.9%) | 214 (15.9%) |
| 60 to 89 Minutes | 67 (3.5%) | 9 (0.7%) |
| 90 or more Minutes | 22 (1.2%) | 0 (0.0%) |
Time of Departure to Work by Sex in Bee Cave
The most frequent times of departure to work in Bee Cave are 7:00 AM to 7:29 AM (325, 17.1%) for males and 7:30 AM to 7:59 AM (423, 31.4%) for females.
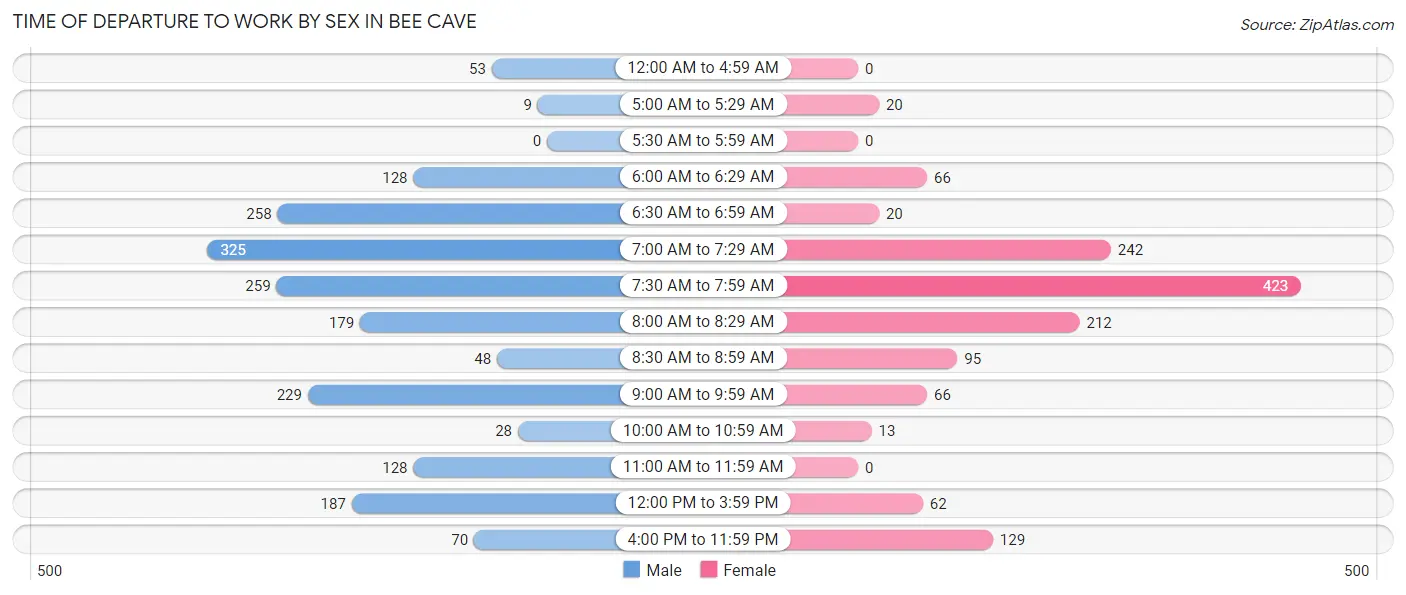
| Time of Departure | Male | Female |
| 12:00 AM to 4:59 AM | 53 (2.8%) | 0 (0.0%) |
| 5:00 AM to 5:29 AM | 9 (0.5%) | 20 (1.5%) |
| 5:30 AM to 5:59 AM | 0 (0.0%) | 0 (0.0%) |
| 6:00 AM to 6:29 AM | 128 (6.7%) | 66 (4.9%) |
| 6:30 AM to 6:59 AM | 258 (13.6%) | 20 (1.5%) |
| 7:00 AM to 7:29 AM | 325 (17.1%) | 242 (17.9%) |
| 7:30 AM to 7:59 AM | 259 (13.6%) | 423 (31.4%) |
| 8:00 AM to 8:29 AM | 179 (9.4%) | 212 (15.7%) |
| 8:30 AM to 8:59 AM | 48 (2.5%) | 95 (7.0%) |
| 9:00 AM to 9:59 AM | 229 (12.0%) | 66 (4.9%) |
| 10:00 AM to 10:59 AM | 28 (1.5%) | 13 (1.0%) |
| 11:00 AM to 11:59 AM | 128 (6.7%) | 0 (0.0%) |
| 12:00 PM to 3:59 PM | 187 (9.8%) | 62 (4.6%) |
| 4:00 PM to 11:59 PM | 70 (3.7%) | 129 (9.6%) |
| Total | 1,901 (100.0%) | 1,348 (100.0%) |
Housing Occupancy in Bee Cave
Occupancy by Ownership in Bee Cave
Of the total 3,964 dwellings in Bee Cave, owner-occupied units account for 2,092 (52.8%), while renter-occupied units make up 1,872 (47.2%).
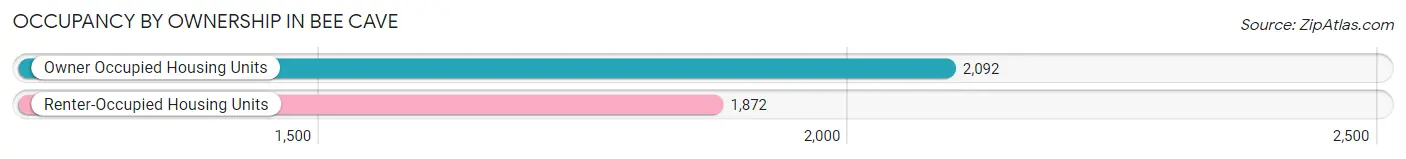
| Occupancy | # Housing Units | % Housing Units |
| Owner Occupied Housing Units | 2,092 | 52.8% |
| Renter-Occupied Housing Units | 1,872 | 47.2% |
| Total Occupied Housing Units | 3,964 | 100.0% |
Occupancy by Household Size in Bee Cave
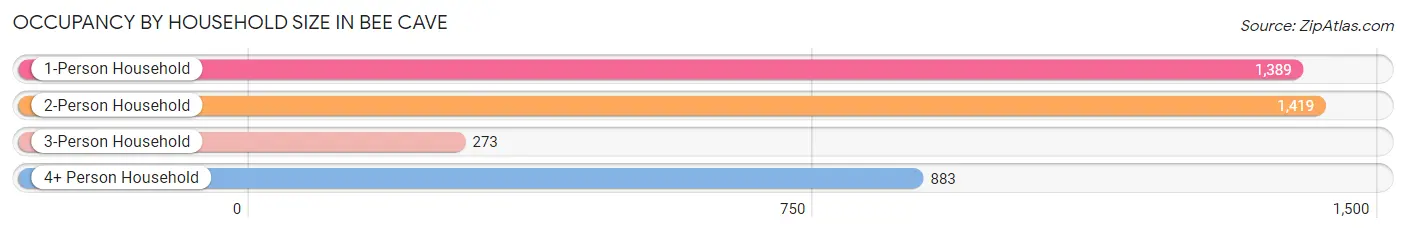
| Household Size | # Housing Units | % Housing Units |
| 1-Person Household | 1,389 | 35.0% |
| 2-Person Household | 1,419 | 35.8% |
| 3-Person Household | 273 | 6.9% |
| 4+ Person Household | 883 | 22.3% |
| Total Housing Units | 3,964 | 100.0% |
Occupancy by Ownership by Household Size in Bee Cave
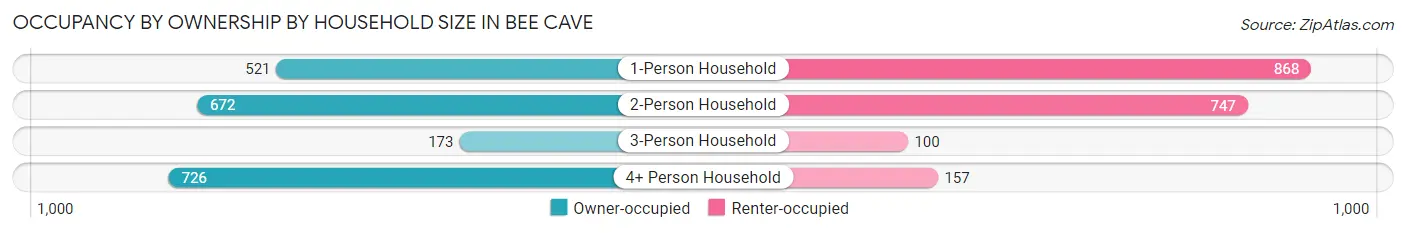
| Household Size | Owner-occupied | Renter-occupied |
| 1-Person Household | 521 (37.5%) | 868 (62.5%) |
| 2-Person Household | 672 (47.4%) | 747 (52.6%) |
| 3-Person Household | 173 (63.4%) | 100 (36.6%) |
| 4+ Person Household | 726 (82.2%) | 157 (17.8%) |
| Total Housing Units | 2,092 (52.8%) | 1,872 (47.2%) |
Occupancy by Educational Attainment in Bee Cave
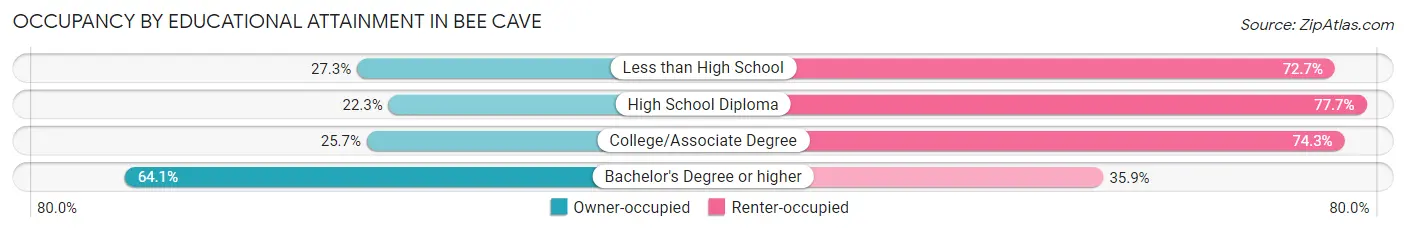
| Household Size | Owner-occupied | Renter-occupied |
| Less than High School | 12 (27.3%) | 32 (72.7%) |
| High School Diploma | 98 (22.3%) | 342 (77.7%) |
| College/Associate Degree | 167 (25.7%) | 482 (74.3%) |
| Bachelor's Degree or higher | 1,815 (64.1%) | 1,016 (35.9%) |
Occupancy by Age of Householder in Bee Cave
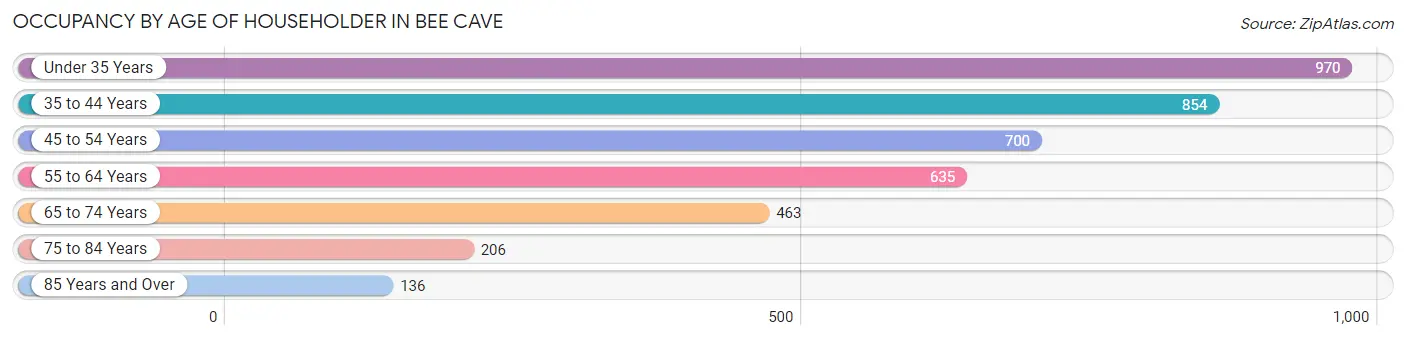
| Age Bracket | # Households | % Households |
| Under 35 Years | 970 | 24.5% |
| 35 to 44 Years | 854 | 21.5% |
| 45 to 54 Years | 700 | 17.7% |
| 55 to 64 Years | 635 | 16.0% |
| 65 to 74 Years | 463 | 11.7% |
| 75 to 84 Years | 206 | 5.2% |
| 85 Years and Over | 136 | 3.4% |
| Total | 3,964 | 100.0% |
Housing Finances in Bee Cave
Median Income by Occupancy in Bee Cave
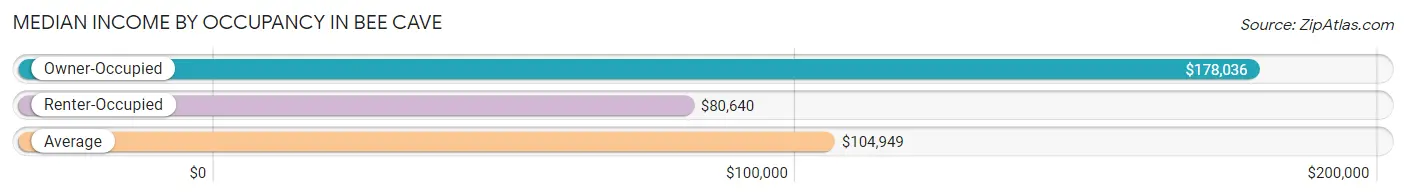
| Occupancy Type | # Households | Median Income |
| Owner-Occupied | 2,092 (52.8%) | $178,036 |
| Renter-Occupied | 1,872 (47.2%) | $80,640 |
| Average | 3,964 (100.0%) | $104,949 |
Occupancy by Householder Income Bracket in Bee Cave
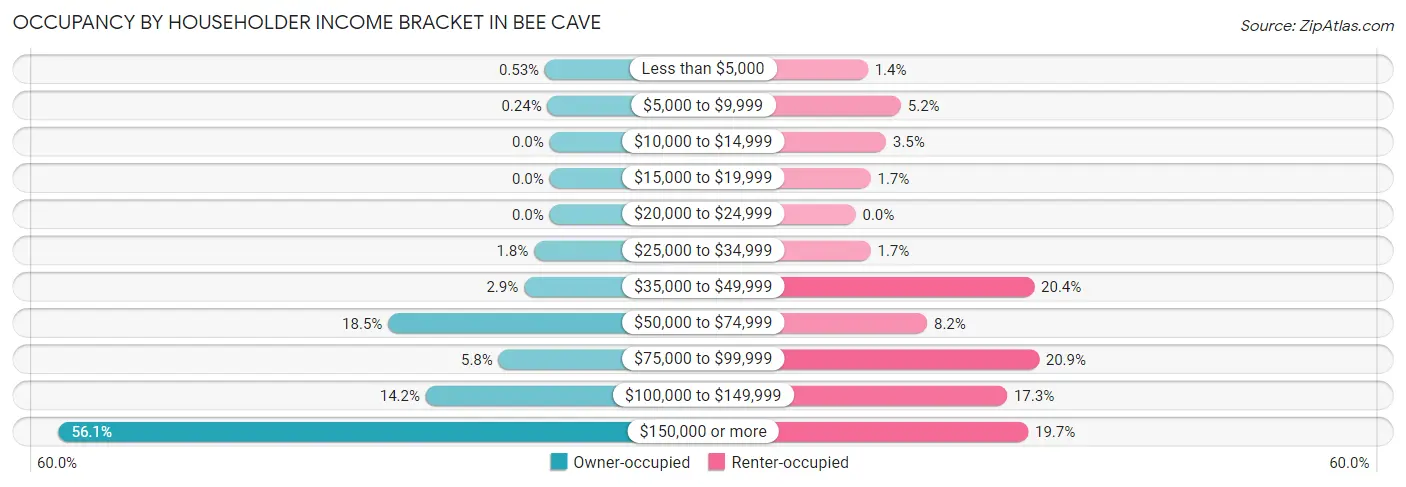
| Income Bracket | Owner-occupied | Renter-occupied |
| Less than $5,000 | 11 (0.5%) | 26 (1.4%) |
| $5,000 to $9,999 | 5 (0.2%) | 97 (5.2%) |
| $10,000 to $14,999 | 0 (0.0%) | 65 (3.5%) |
| $15,000 to $19,999 | 0 (0.0%) | 32 (1.7%) |
| $20,000 to $24,999 | 0 (0.0%) | 0 (0.0%) |
| $25,000 to $34,999 | 37 (1.8%) | 32 (1.7%) |
| $35,000 to $49,999 | 61 (2.9%) | 382 (20.4%) |
| $50,000 to $74,999 | 386 (18.4%) | 153 (8.2%) |
| $75,000 to $99,999 | 122 (5.8%) | 392 (20.9%) |
| $100,000 to $149,999 | 296 (14.1%) | 324 (17.3%) |
| $150,000 or more | 1,174 (56.1%) | 369 (19.7%) |
| Total | 2,092 (100.0%) | 1,872 (100.0%) |
Monthly Housing Cost Tiers in Bee Cave
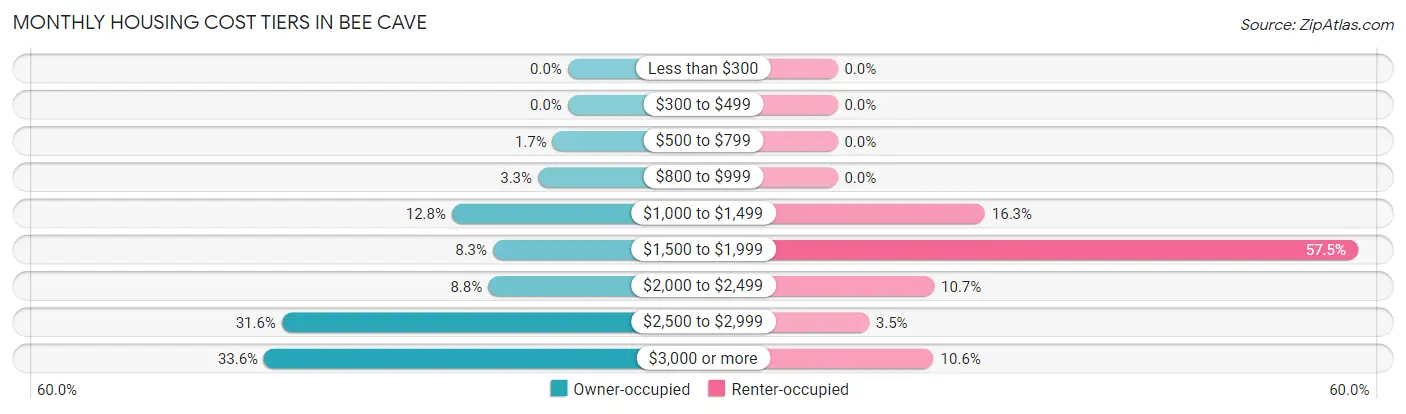
| Monthly Cost | Owner-occupied | Renter-occupied |
| Less than $300 | 0 (0.0%) | 0 (0.0%) |
| $300 to $499 | 0 (0.0%) | 0 (0.0%) |
| $500 to $799 | 35 (1.7%) | 0 (0.0%) |
| $800 to $999 | 69 (3.3%) | 0 (0.0%) |
| $1,000 to $1,499 | 268 (12.8%) | 305 (16.3%) |
| $1,500 to $1,999 | 173 (8.3%) | 1,076 (57.5%) |
| $2,000 to $2,499 | 184 (8.8%) | 200 (10.7%) |
| $2,500 to $2,999 | 661 (31.6%) | 65 (3.5%) |
| $3,000 or more | 702 (33.6%) | 199 (10.6%) |
| Total | 2,092 (100.0%) | 1,872 (100.0%) |
Physical Housing Characteristics in Bee Cave
Housing Structures in Bee Cave
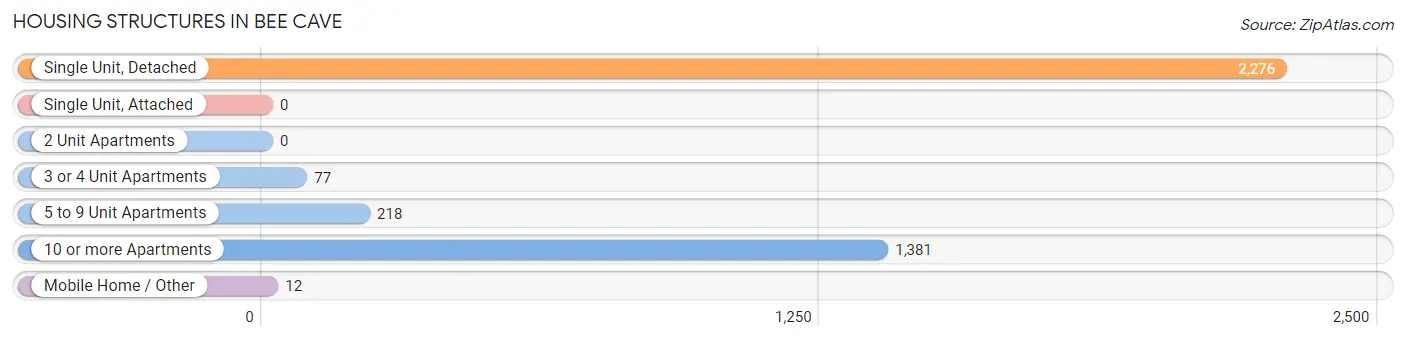
| Structure Type | # Housing Units | % Housing Units |
| Single Unit, Detached | 2,276 | 57.4% |
| Single Unit, Attached | 0 | 0.0% |
| 2 Unit Apartments | 0 | 0.0% |
| 3 or 4 Unit Apartments | 77 | 1.9% |
| 5 to 9 Unit Apartments | 218 | 5.5% |
| 10 or more Apartments | 1,381 | 34.8% |
| Mobile Home / Other | 12 | 0.3% |
| Total | 3,964 | 100.0% |
Housing Structures by Occupancy in Bee Cave
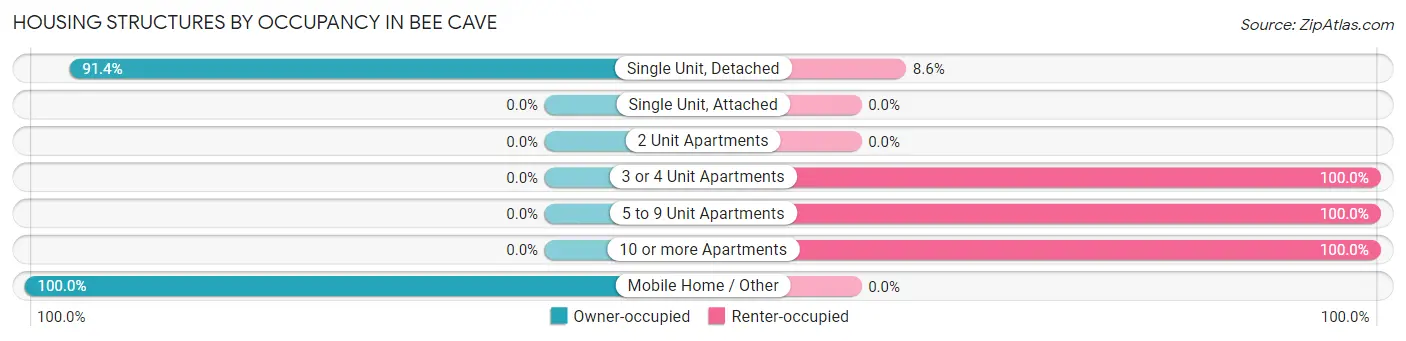
| Structure Type | Owner-occupied | Renter-occupied |
| Single Unit, Detached | 2,080 (91.4%) | 196 (8.6%) |
| Single Unit, Attached | 0 (0.0%) | 0 (0.0%) |
| 2 Unit Apartments | 0 (0.0%) | 0 (0.0%) |
| 3 or 4 Unit Apartments | 0 (0.0%) | 77 (100.0%) |
| 5 to 9 Unit Apartments | 0 (0.0%) | 218 (100.0%) |
| 10 or more Apartments | 0 (0.0%) | 1,381 (100.0%) |
| Mobile Home / Other | 12 (100.0%) | 0 (0.0%) |
| Total | 2,092 (52.8%) | 1,872 (47.2%) |
Housing Structures by Number of Rooms in Bee Cave
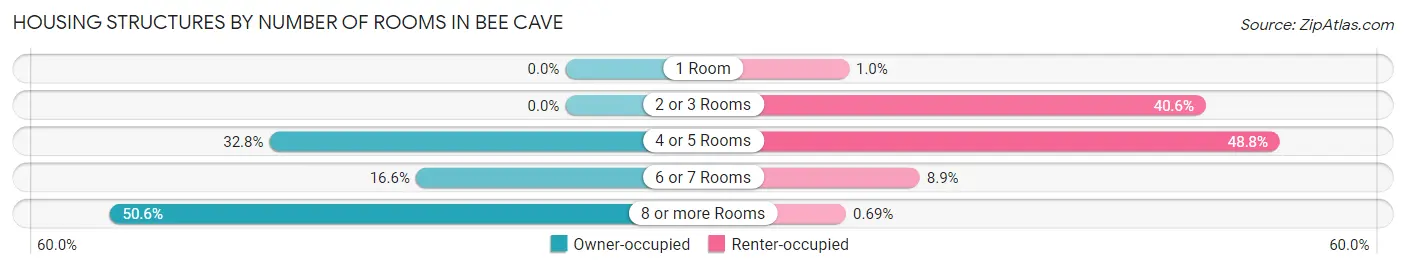
| Number of Rooms | Owner-occupied | Renter-occupied |
| 1 Room | 0 (0.0%) | 19 (1.0%) |
| 2 or 3 Rooms | 0 (0.0%) | 760 (40.6%) |
| 4 or 5 Rooms | 687 (32.8%) | 914 (48.8%) |
| 6 or 7 Rooms | 347 (16.6%) | 166 (8.9%) |
| 8 or more Rooms | 1,058 (50.6%) | 13 (0.7%) |
| Total | 2,092 (100.0%) | 1,872 (100.0%) |
Housing Structure by Heating Type in Bee Cave
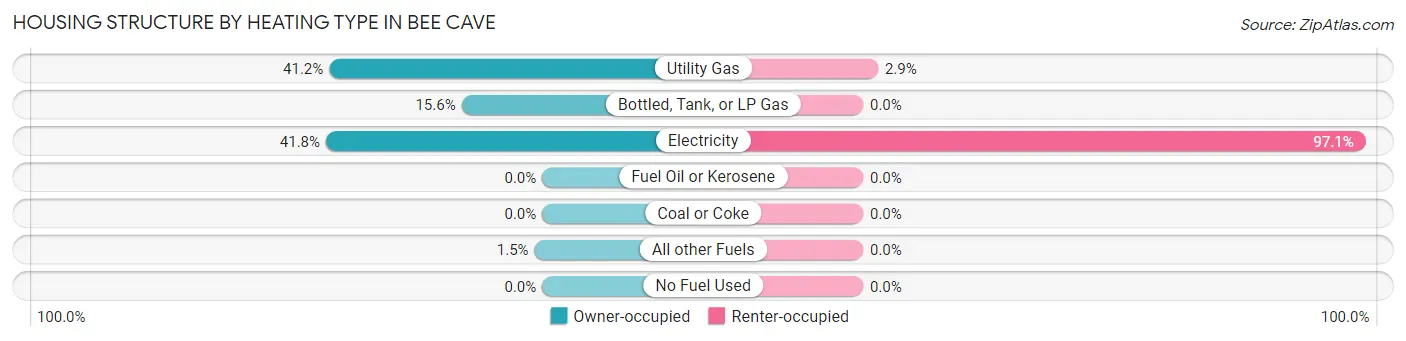
| Heating Type | Owner-occupied | Renter-occupied |
| Utility Gas | 861 (41.2%) | 54 (2.9%) |
| Bottled, Tank, or LP Gas | 326 (15.6%) | 0 (0.0%) |
| Electricity | 874 (41.8%) | 1,818 (97.1%) |
| Fuel Oil or Kerosene | 0 (0.0%) | 0 (0.0%) |
| Coal or Coke | 0 (0.0%) | 0 (0.0%) |
| All other Fuels | 31 (1.5%) | 0 (0.0%) |
| No Fuel Used | 0 (0.0%) | 0 (0.0%) |
| Total | 2,092 (100.0%) | 1,872 (100.0%) |
Household Vehicle Usage in Bee Cave
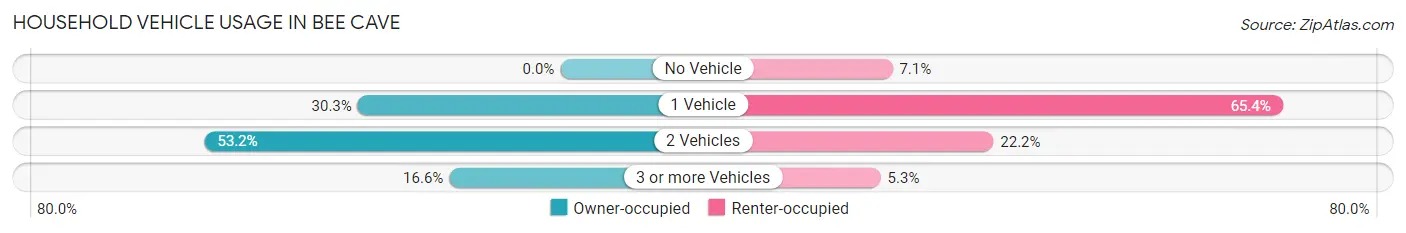
| Vehicles per Household | Owner-occupied | Renter-occupied |
| No Vehicle | 0 (0.0%) | 133 (7.1%) |
| 1 Vehicle | 633 (30.3%) | 1,224 (65.4%) |
| 2 Vehicles | 1,112 (53.1%) | 415 (22.2%) |
| 3 or more Vehicles | 347 (16.6%) | 100 (5.3%) |
| Total | 2,092 (100.0%) | 1,872 (100.0%) |
Real Estate & Mortgages in Bee Cave
Real Estate and Mortgage Overview in Bee Cave
| Characteristic | Without Mortgage | With Mortgage |
| Housing Units | 528 | 1,564 |
| Median Property Value | $614,100 | $633,500 |
| Median Household Income | $176,250 | $871 |
| Monthly Housing Costs | $1,338 | $692 |
| Real Estate Taxes | $8,259 | $0 |
Property Value by Mortgage Status in Bee Cave
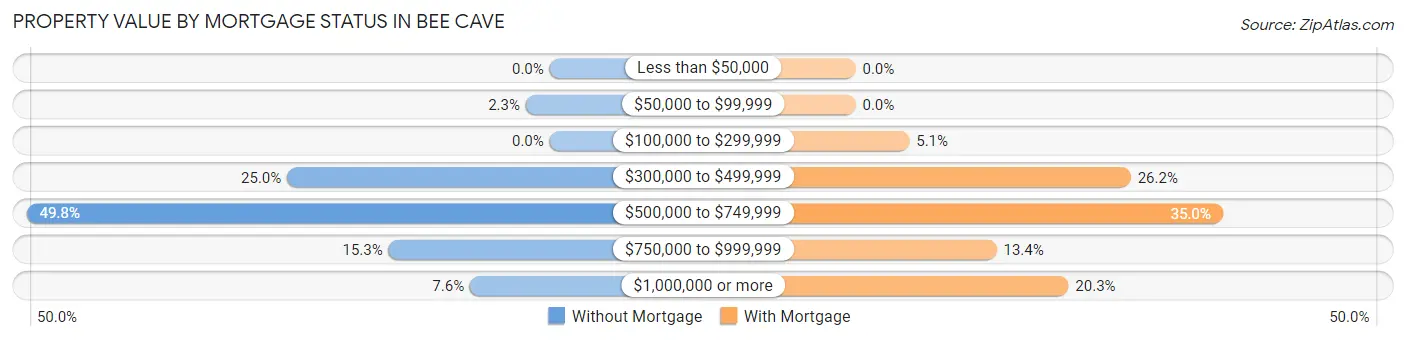
| Property Value | Without Mortgage | With Mortgage |
| Less than $50,000 | 0 (0.0%) | 0 (0.0%) |
| $50,000 to $99,999 | 12 (2.3%) | 0 (0.0%) |
| $100,000 to $299,999 | 0 (0.0%) | 80 (5.1%) |
| $300,000 to $499,999 | 132 (25.0%) | 410 (26.2%) |
| $500,000 to $749,999 | 263 (49.8%) | 547 (35.0%) |
| $750,000 to $999,999 | 81 (15.3%) | 210 (13.4%) |
| $1,000,000 or more | 40 (7.6%) | 317 (20.3%) |
| Total | 528 (100.0%) | 1,564 (100.0%) |
Household Income by Mortgage Status in Bee Cave
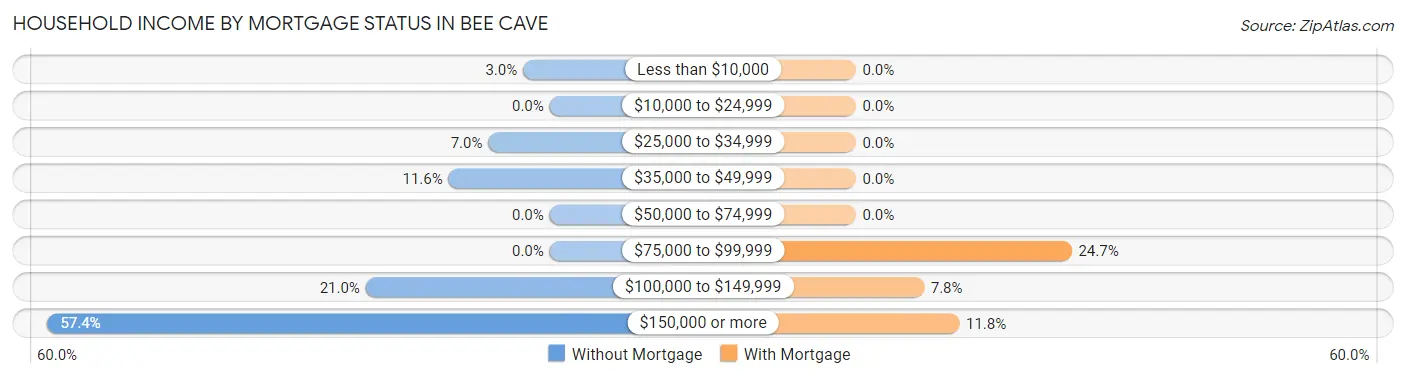
| Household Income | Without Mortgage | With Mortgage |
| Less than $10,000 | 16 (3.0%) | 0 (0.0%) |
| $10,000 to $24,999 | 0 (0.0%) | 0 (0.0%) |
| $25,000 to $34,999 | 37 (7.0%) | 0 (0.0%) |
| $35,000 to $49,999 | 61 (11.6%) | 0 (0.0%) |
| $50,000 to $74,999 | 0 (0.0%) | 0 (0.0%) |
| $75,000 to $99,999 | 0 (0.0%) | 386 (24.7%) |
| $100,000 to $149,999 | 111 (21.0%) | 122 (7.8%) |
| $150,000 or more | 303 (57.4%) | 185 (11.8%) |
| Total | 528 (100.0%) | 1,564 (100.0%) |
Property Value to Household Income Ratio in Bee Cave
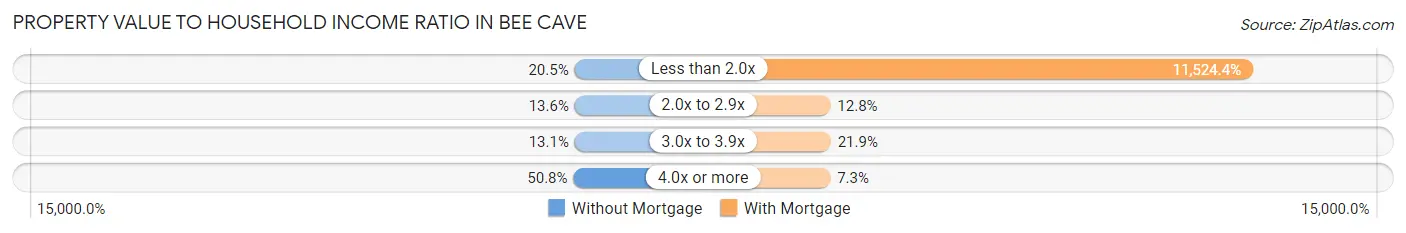
| Value-to-Income Ratio | Without Mortgage | With Mortgage |
| Less than 2.0x | 108 (20.4%) | 180,242 (11,524.4%) |
| 2.0x to 2.9x | 72 (13.6%) | 200 (12.8%) |
| 3.0x to 3.9x | 69 (13.1%) | 342 (21.9%) |
| 4.0x or more | 268 (50.8%) | 114 (7.3%) |
| Total | 528 (100.0%) | 1,564 (100.0%) |
Real Estate Taxes by Mortgage Status in Bee Cave
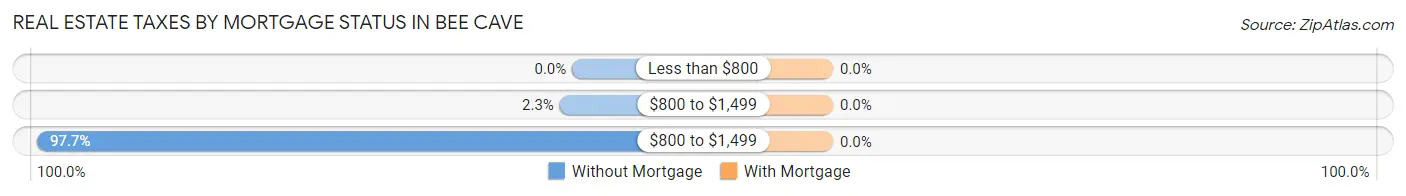
| Property Taxes | Without Mortgage | With Mortgage |
| Less than $800 | 0 (0.0%) | 0 (0.0%) |
| $800 to $1,499 | 12 (2.3%) | 0 (0.0%) |
| $800 to $1,499 | 516 (97.7%) | 0 (0.0%) |
| Total | 528 (100.0%) | 1,564 (100.0%) |
Health & Disability in Bee Cave
Health Insurance Coverage by Age in Bee Cave
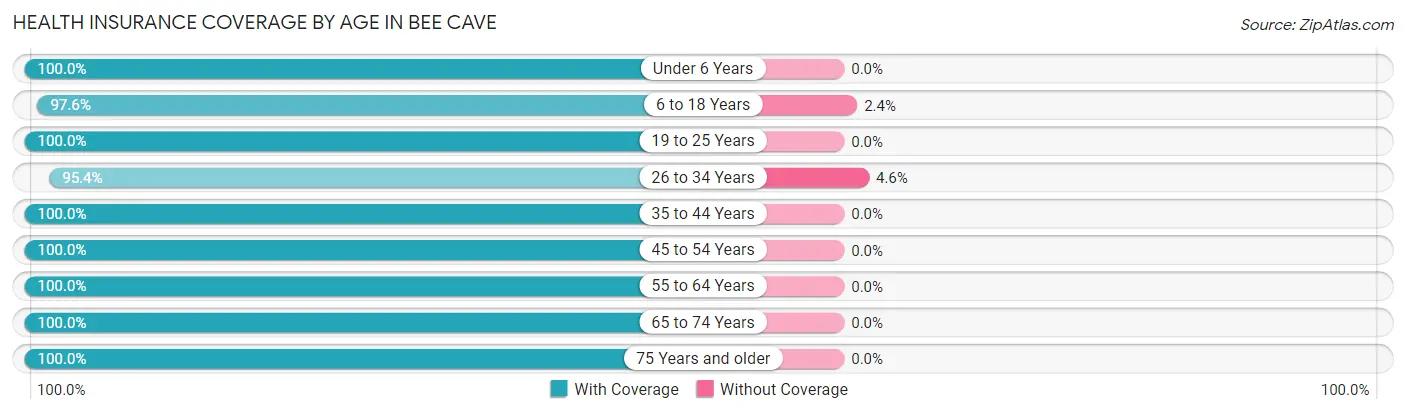
| Age Bracket | With Coverage | Without Coverage |
| Under 6 Years | 652 (100.0%) | 0 (0.0%) |
| 6 to 18 Years | 1,578 (97.6%) | 39 (2.4%) |
| 19 to 25 Years | 207 (100.0%) | 0 (0.0%) |
| 26 to 34 Years | 1,199 (95.4%) | 58 (4.6%) |
| 35 to 44 Years | 1,576 (100.0%) | 0 (0.0%) |
| 45 to 54 Years | 1,105 (100.0%) | 0 (0.0%) |
| 55 to 64 Years | 1,051 (100.0%) | 0 (0.0%) |
| 65 to 74 Years | 618 (100.0%) | 0 (0.0%) |
| 75 Years and older | 666 (100.0%) | 0 (0.0%) |
| Total | 8,652 (98.9%) | 97 (1.1%) |
Health Insurance Coverage by Citizenship Status in Bee Cave
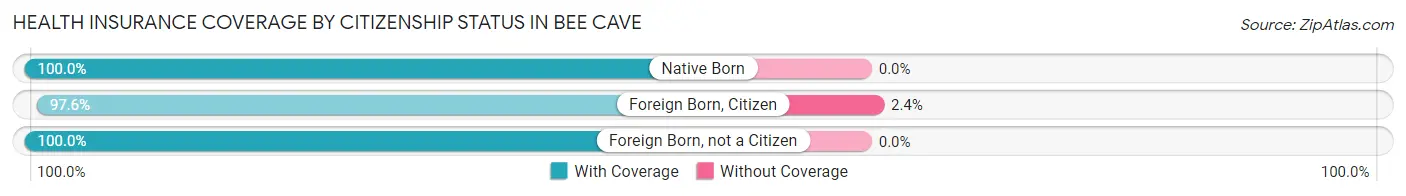
| Citizenship Status | With Coverage | Without Coverage |
| Native Born | 652 (100.0%) | 0 (0.0%) |
| Foreign Born, Citizen | 1,578 (97.6%) | 39 (2.4%) |
| Foreign Born, not a Citizen | 207 (100.0%) | 0 (0.0%) |
Health Insurance Coverage by Household Income in Bee Cave
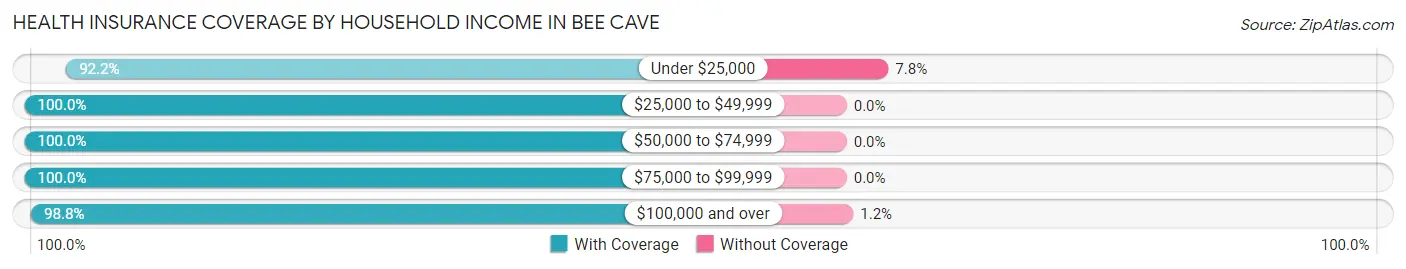
| Household Income | With Coverage | Without Coverage |
| Under $25,000 | 272 (92.2%) | 23 (7.8%) |
| $25,000 to $49,999 | 604 (100.0%) | 0 (0.0%) |
| $50,000 to $74,999 | 609 (100.0%) | 0 (0.0%) |
| $75,000 to $99,999 | 1,200 (100.0%) | 0 (0.0%) |
| $100,000 and over | 5,963 (98.8%) | 74 (1.2%) |
Public vs Private Health Insurance Coverage by Age in Bee Cave
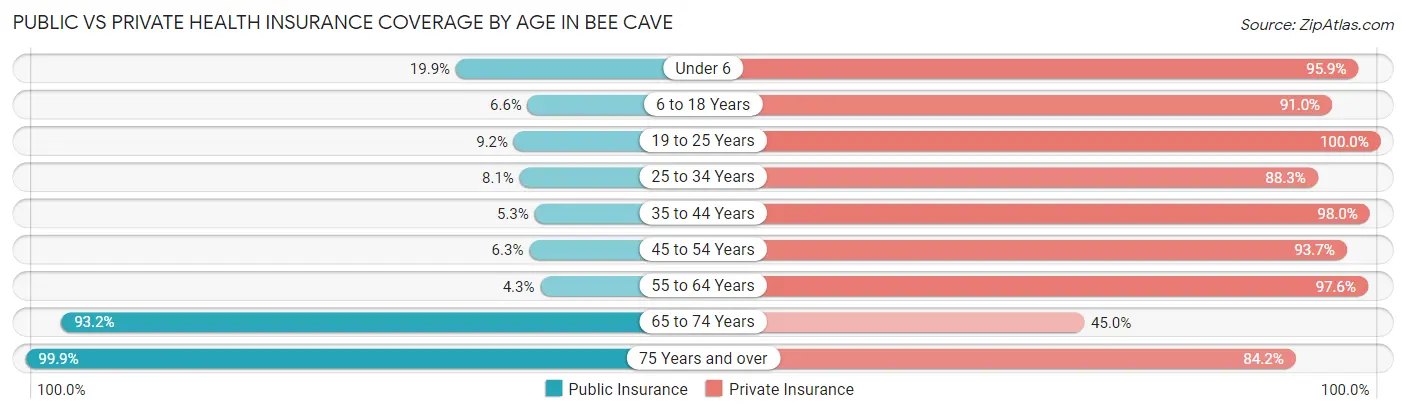
| Age Bracket | Public Insurance | Private Insurance |
| Under 6 | 130 (19.9%) | 625 (95.9%) |
| 6 to 18 Years | 107 (6.6%) | 1,471 (91.0%) |
| 19 to 25 Years | 19 (9.2%) | 207 (100.0%) |
| 25 to 34 Years | 102 (8.1%) | 1,110 (88.3%) |
| 35 to 44 Years | 84 (5.3%) | 1,544 (98.0%) |
| 45 to 54 Years | 70 (6.3%) | 1,035 (93.7%) |
| 55 to 64 Years | 45 (4.3%) | 1,026 (97.6%) |
| 65 to 74 Years | 576 (93.2%) | 278 (45.0%) |
| 75 Years and over | 665 (99.9%) | 561 (84.2%) |
| Total | 1,798 (20.5%) | 7,857 (89.8%) |
Disability Status by Sex by Age in Bee Cave
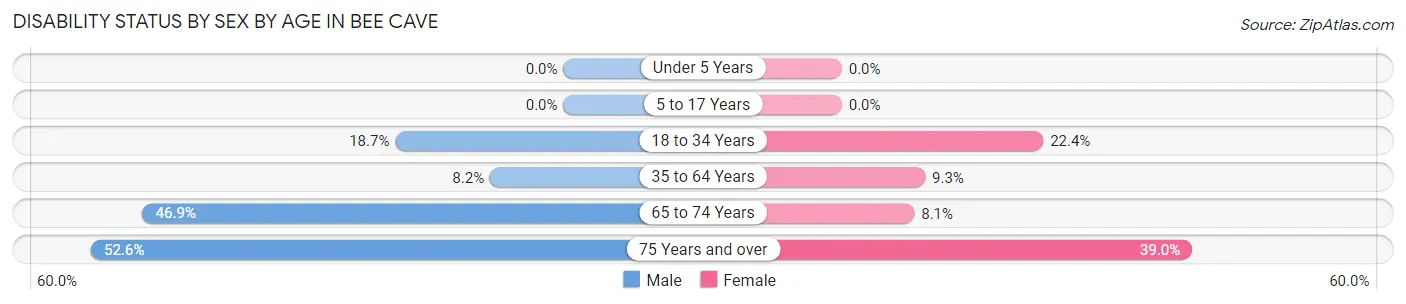
| Age Bracket | Male | Female |
| Under 5 Years | 0 (0.0%) | 0 (0.0%) |
| 5 to 17 Years | 0 (0.0%) | 0 (0.0%) |
| 18 to 34 Years | 170 (18.7%) | 129 (22.4%) |
| 35 to 64 Years | 156 (8.2%) | 169 (9.3%) |
| 65 to 74 Years | 156 (46.9%) | 23 (8.1%) |
| 75 Years and over | 202 (52.6%) | 110 (39.0%) |
Disability Class by Sex by Age in Bee Cave
Disability Class: Hearing Difficulty
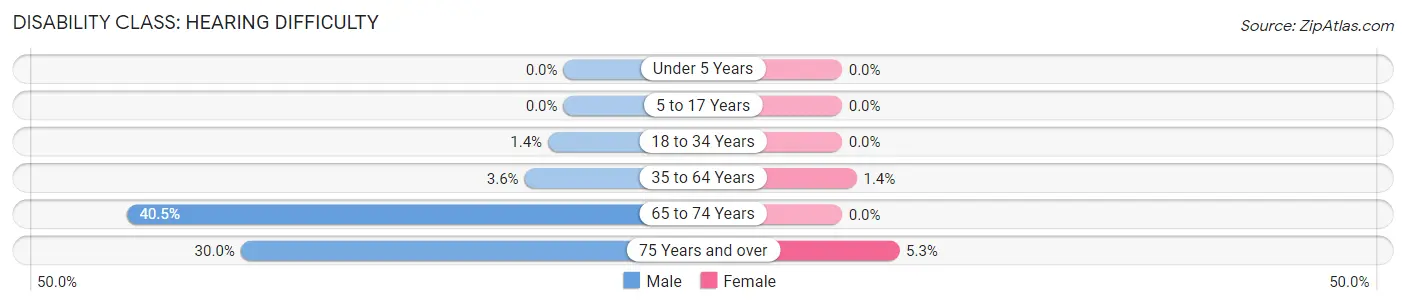
| Age Bracket | Male | Female |
| Under 5 Years | 0 (0.0%) | 0 (0.0%) |
| 5 to 17 Years | 0 (0.0%) | 0 (0.0%) |
| 18 to 34 Years | 13 (1.4%) | 0 (0.0%) |
| 35 to 64 Years | 69 (3.6%) | 25 (1.4%) |
| 65 to 74 Years | 135 (40.5%) | 0 (0.0%) |
| 75 Years and over | 115 (29.9%) | 15 (5.3%) |
Disability Class: Vision Difficulty
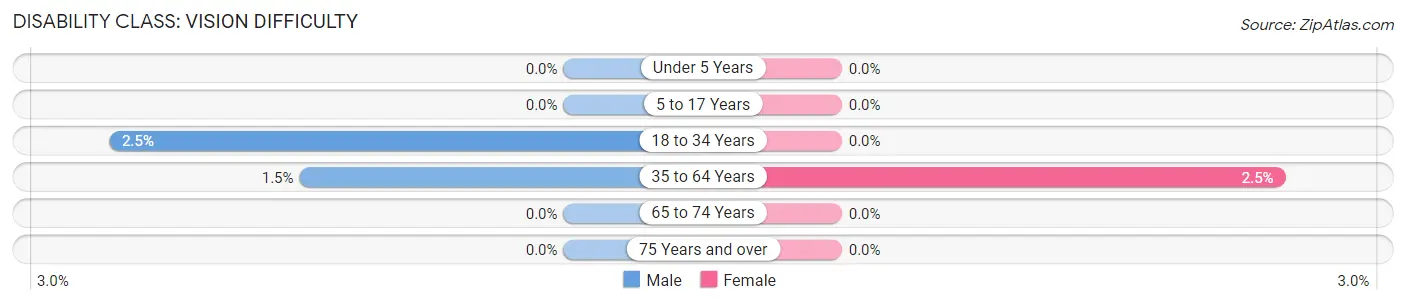
| Age Bracket | Male | Female |
| Under 5 Years | 0 (0.0%) | 0 (0.0%) |
| 5 to 17 Years | 0 (0.0%) | 0 (0.0%) |
| 18 to 34 Years | 23 (2.5%) | 0 (0.0%) |
| 35 to 64 Years | 28 (1.5%) | 45 (2.5%) |
| 65 to 74 Years | 0 (0.0%) | 0 (0.0%) |
| 75 Years and over | 0 (0.0%) | 0 (0.0%) |
Disability Class: Cognitive Difficulty
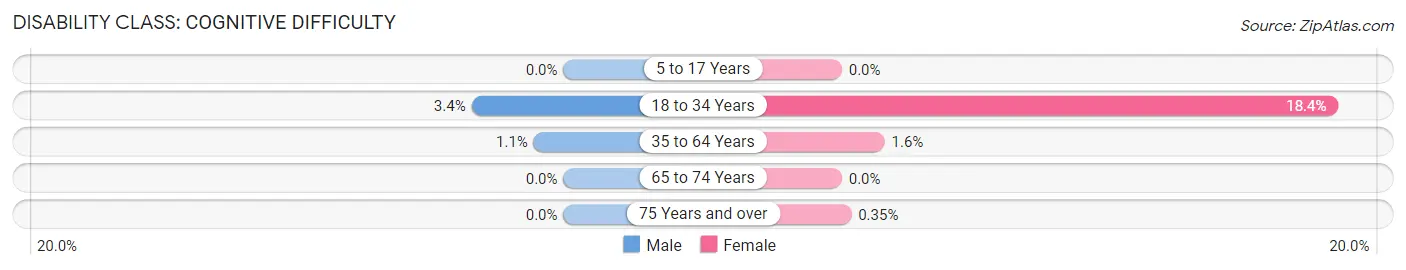
| Age Bracket | Male | Female |
| 5 to 17 Years | 0 (0.0%) | 0 (0.0%) |
| 18 to 34 Years | 31 (3.4%) | 106 (18.4%) |
| 35 to 64 Years | 21 (1.1%) | 29 (1.6%) |
| 65 to 74 Years | 0 (0.0%) | 0 (0.0%) |
| 75 Years and over | 0 (0.0%) | 1 (0.4%) |
Disability Class: Ambulatory Difficulty
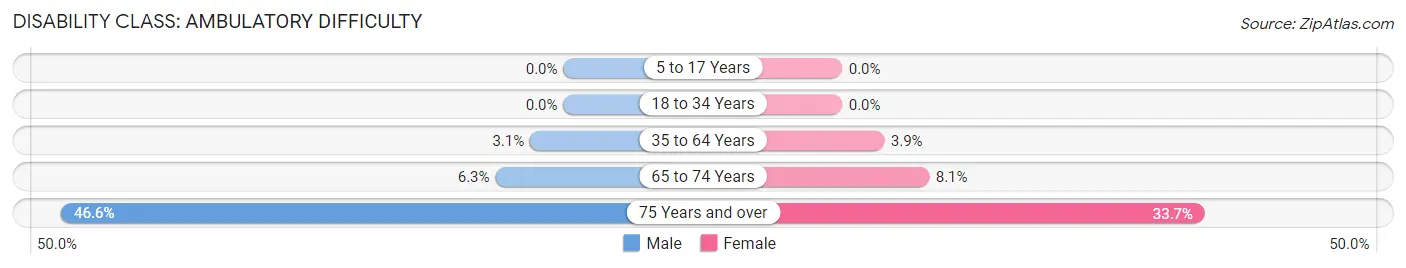
| Age Bracket | Male | Female |
| 5 to 17 Years | 0 (0.0%) | 0 (0.0%) |
| 18 to 34 Years | 0 (0.0%) | 0 (0.0%) |
| 35 to 64 Years | 59 (3.1%) | 71 (3.9%) |
| 65 to 74 Years | 21 (6.3%) | 23 (8.1%) |
| 75 Years and over | 179 (46.6%) | 95 (33.7%) |
Disability Class: Self-Care Difficulty
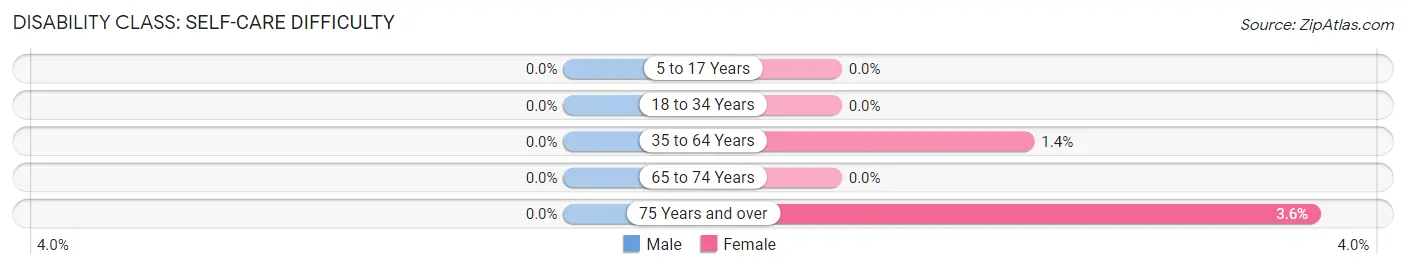
| Age Bracket | Male | Female |
| 5 to 17 Years | 0 (0.0%) | 0 (0.0%) |
| 18 to 34 Years | 0 (0.0%) | 0 (0.0%) |
| 35 to 64 Years | 0 (0.0%) | 26 (1.4%) |
| 65 to 74 Years | 0 (0.0%) | 0 (0.0%) |
| 75 Years and over | 0 (0.0%) | 10 (3.5%) |
Technology Access in Bee Cave
Computing Device Access in Bee Cave
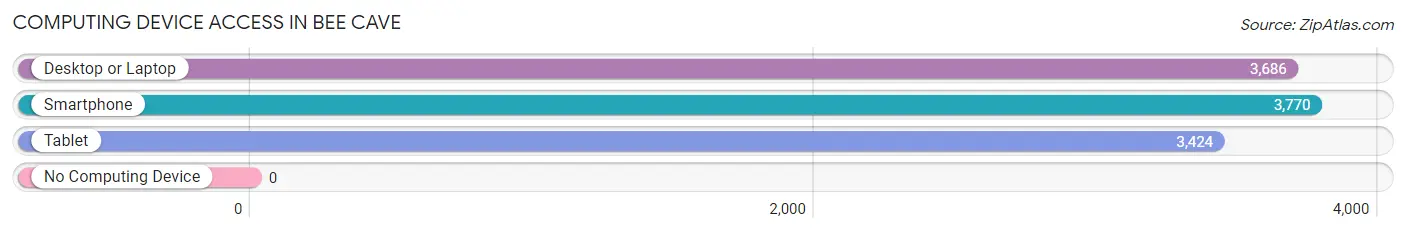
| Device Type | # Households | % Households |
| Desktop or Laptop | 3,686 | 93.0% |
| Smartphone | 3,770 | 95.1% |
| Tablet | 3,424 | 86.4% |
| No Computing Device | 0 | 0.0% |
| Total | 3,964 | 100.0% |
Internet Access in Bee Cave
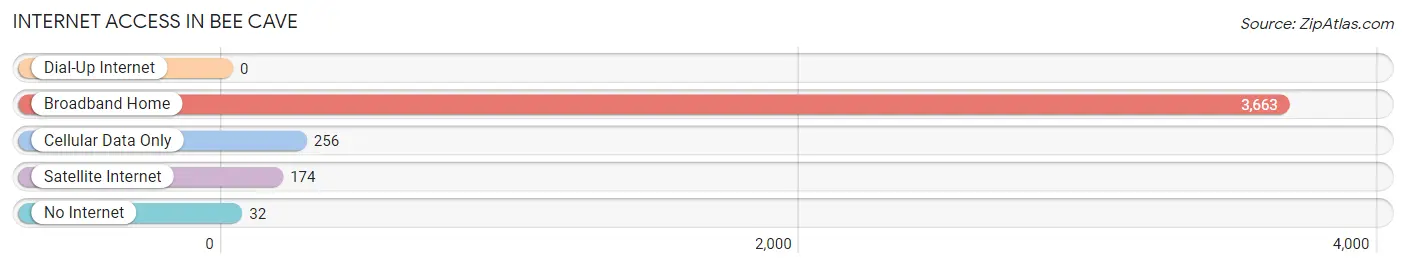
| Internet Type | # Households | % Households |
| Dial-Up Internet | 0 | 0.0% |
| Broadband Home | 3,663 | 92.4% |
| Cellular Data Only | 256 | 6.5% |
| Satellite Internet | 174 | 4.4% |
| No Internet | 32 | 0.8% |
| Total | 3,964 | 100.0% |
Bee Cave Summary
History
Bee Cave is a city located in Travis County, Texas, United States. It is situated in the Hill Country region of Central Texas, about 18 miles west of Austin. The city was founded in 1873 by a group of settlers from the nearby town of Dripping Springs. The city was named after a large cave located near the original settlement, which was home to a large number of bees.
The city of Bee Cave was officially incorporated in 1987, and has since grown to become one of the most affluent suburbs of Austin. The city is home to a number of high-end shopping centers, restaurants, and other businesses. The city is also home to the Hill Country Galleria, a large shopping center that features a variety of stores, restaurants, and entertainment venues.
Geography
Bee Cave is located in the Hill Country region of Central Texas, about 18 miles west of Austin. The city is situated on the Balcones Escarpment, a geological formation that runs through the region. The city is bordered by Lake Travis to the north, Lake Austin to the east, and the Barton Creek Greenbelt to the south.
The city has a total area of 8.3 square miles, of which 8.2 square miles is land and 0.1 square miles is water. The terrain of the city is mostly hilly, with elevations ranging from 500 to 1,000 feet above sea level.
Economy
Bee Cave is a rapidly growing city, and its economy is largely driven by the retail and service industries. The city is home to a number of high-end shopping centers, restaurants, and other businesses. The Hill Country Galleria is the largest shopping center in the city, and features a variety of stores, restaurants, and entertainment venues.
The city is also home to a number of technology companies, including Dell, IBM, and Oracle. The city is also home to a number of medical facilities, including the Seton Medical Center and the Bee Cave Medical Center.
Demographics
As of the 2010 census, the city of Bee Cave had a population of 6,305. The racial makeup of the city was 87.3% White, 5.2% African American, 0.4% Native American, 2.7% Asian, 0.1% Pacific Islander, 1.9% from other races, and 2.4% from two or more races. Hispanic or Latino of any race were 8.2% of the population.
The median income for a household in the city was $90,945, and the median income for a family was $103,945. The per capita income for the city was $45,945. About 4.2% of families and 5.3% of the population were below the poverty line, including 6.2% of those under age 18 and 4.2% of those age 65 or over.
Common Questions
What is Per Capita Income in Bee Cave?
Per Capita income in Bee Cave is $73,630.
What is the Median Family Income in Bee Cave?
Median Family Income in Bee Cave is $150,673.
What is the Median Household income in Bee Cave?
Median Household Income in Bee Cave is $104,949.
What is Income or Wage Gap in Bee Cave?
Income or Wage Gap in Bee Cave is 40.2%.
Women in Bee Cave earn 59.8 cents for every dollar earned by a man.
What is Inequality or Gini Index in Bee Cave?
Inequality or Gini Index in Bee Cave is 0.46.
What is the Total Population of Bee Cave?
Total Population of Bee Cave is 8,771.
What is the Total Male Population of Bee Cave?
Total Male Population of Bee Cave is 4,578.
What is the Total Female Population of Bee Cave?
Total Female Population of Bee Cave is 4,193.
What is the Ratio of Males per 100 Females in Bee Cave?
There are 109.18 Males per 100 Females in Bee Cave.
What is the Ratio of Females per 100 Males in Bee Cave?
There are 91.59 Females per 100 Males in Bee Cave.
What is the Median Population Age in Bee Cave?
Median Population Age in Bee Cave is 37.7 Years.
What is the Average Family Size in Bee Cave
Average Family Size in Bee Cave is 2.9 People.
What is the Average Household Size in Bee Cave
Average Household Size in Bee Cave is 2.2 People.
How Large is the Labor Force in Bee Cave?
There are 4,509 People in the Labor Forcein in Bee Cave.
What is the Percentage of People in the Labor Force in Bee Cave?
67.8% of People are in the Labor Force in Bee Cave.
What is the Unemployment Rate in Bee Cave?
Unemployment Rate in Bee Cave is 1.2%.