Lanai City, HI Map & Demographics
Lanai City Map
Lanai City Overview
$38,483
PER CAPITA INCOME
$108,250
AVG FAMILY INCOME
$80,464
AVG HOUSEHOLD INCOME
12.3%
WAGE / INCOME GAP [ % ]
87.7¢/ $1
WAGE / INCOME GAP [ $ ]
0.38
INEQUALITY / GINI INDEX
3,174
TOTAL POPULATION
1,769
MALE POPULATION
1,405
FEMALE POPULATION
125.91
MALES / 100 FEMALES
79.42
FEMALES / 100 MALES
41.9
MEDIAN AGE
3.0
AVG FAMILY SIZE
2.6
AVG HOUSEHOLD SIZE
1,733
LABOR FORCE [ PEOPLE ]
66.1%
PERCENT IN LABOR FORCE
2.4%
UNEMPLOYMENT RATE
Lanai City Zip Codes
Lanai City Area Codes
Income in Lanai City
Income Overview in Lanai City
Per Capita Income in Lanai City is $38,483, while median incomes of families and households are $108,250 and $80,464 respectively.
| Characteristic | Number | Measure |
| Per Capita Income | 3,174 | $38,483 |
| Median Family Income | 848 | $108,250 |
| Mean Family Income | 848 | $107,343 |
| Median Household Income | 1,217 | $80,464 |
| Mean Household Income | 1,217 | $94,170 |
| Income Deficit | 848 | $0 |
| Wage / Income Gap (%) | 3,174 | 12.31% |
| Wage / Income Gap ($) | 3,174 | 87.69¢ per $1 |
| Gini / Inequality Index | 3,174 | 0.38 |
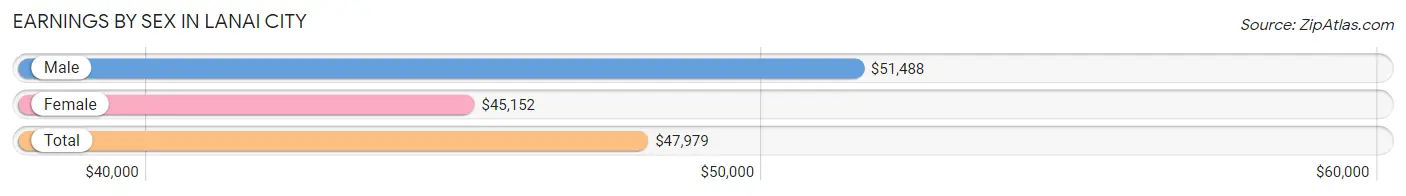
Earnings by Sex in Lanai City
Average Earnings in Lanai City are $47,979, $51,488 for men and $45,152 for women, a difference of 12.3%.
| Sex | Number | Average Earnings |
| Male | 1,074 (59.1%) | $51,488 |
| Female | 742 (40.9%) | $45,152 |
| Total | 1,816 (100.0%) | $47,979 |
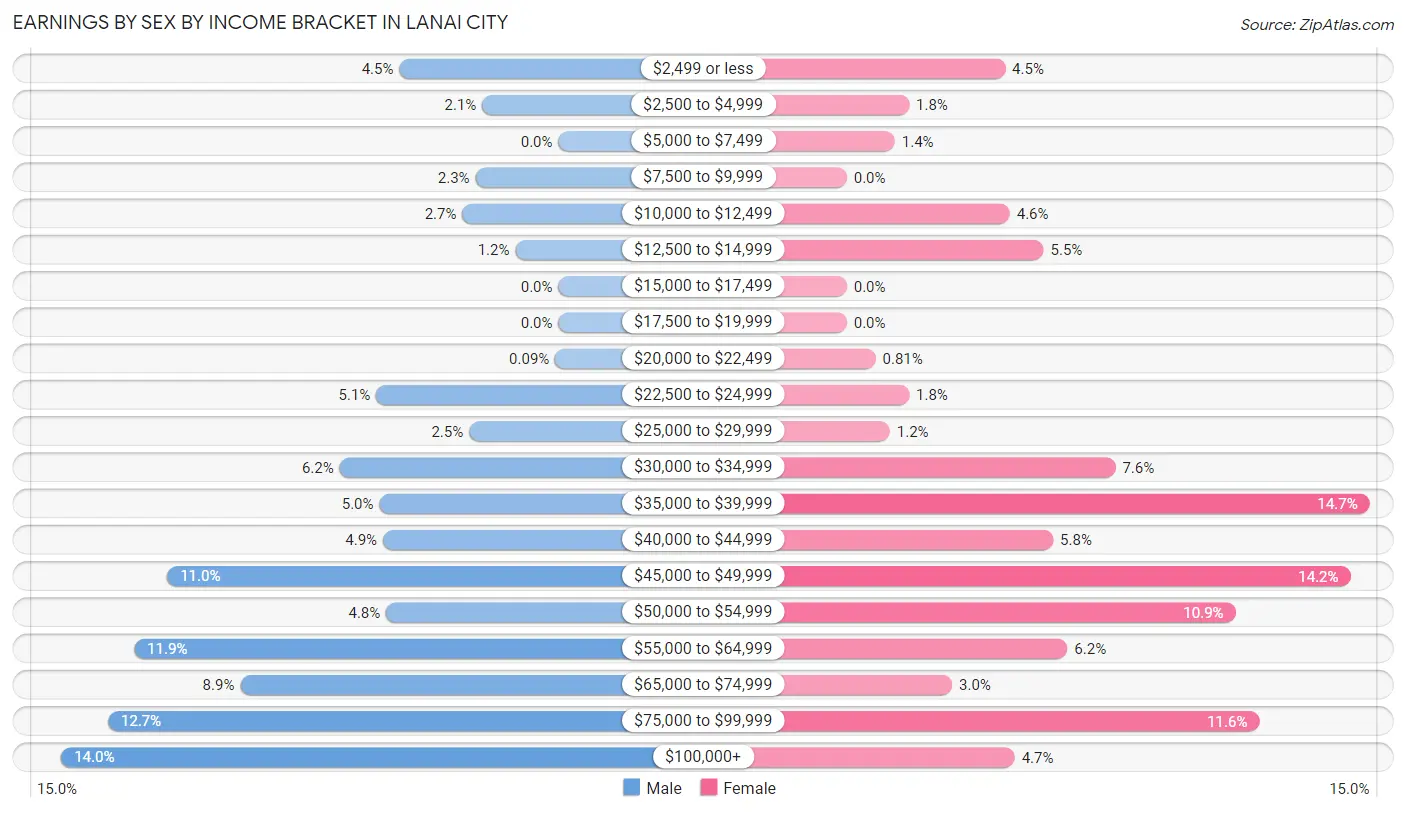
Earnings by Sex by Income Bracket in Lanai City
The most common earnings brackets in Lanai City are $100,000+ for men (150 | 14.0%) and $35,000 to $39,999 for women (109 | 14.7%).
| Income | Male | Female |
| $2,499 or less | 48 (4.5%) | 33 (4.4%) |
| $2,500 to $4,999 | 23 (2.1%) | 13 (1.8%) |
| $5,000 to $7,499 | 0 (0.0%) | 10 (1.3%) |
| $7,500 to $9,999 | 25 (2.3%) | 0 (0.0%) |
| $10,000 to $12,499 | 29 (2.7%) | 34 (4.6%) |
| $12,500 to $14,999 | 13 (1.2%) | 41 (5.5%) |
| $15,000 to $17,499 | 0 (0.0%) | 0 (0.0%) |
| $17,500 to $19,999 | 0 (0.0%) | 0 (0.0%) |
| $20,000 to $22,499 | 1 (0.1%) | 6 (0.8%) |
| $22,500 to $24,999 | 55 (5.1%) | 13 (1.8%) |
| $25,000 to $29,999 | 27 (2.5%) | 9 (1.2%) |
| $30,000 to $34,999 | 66 (6.1%) | 56 (7.5%) |
| $35,000 to $39,999 | 54 (5.0%) | 109 (14.7%) |
| $40,000 to $44,999 | 53 (4.9%) | 43 (5.8%) |
| $45,000 to $49,999 | 118 (11.0%) | 105 (14.1%) |
| $50,000 to $54,999 | 52 (4.8%) | 81 (10.9%) |
| $55,000 to $64,999 | 128 (11.9%) | 46 (6.2%) |
| $65,000 to $74,999 | 96 (8.9%) | 22 (3.0%) |
| $75,000 to $99,999 | 136 (12.7%) | 86 (11.6%) |
| $100,000+ | 150 (14.0%) | 35 (4.7%) |
| Total | 1,074 (100.0%) | 742 (100.0%) |
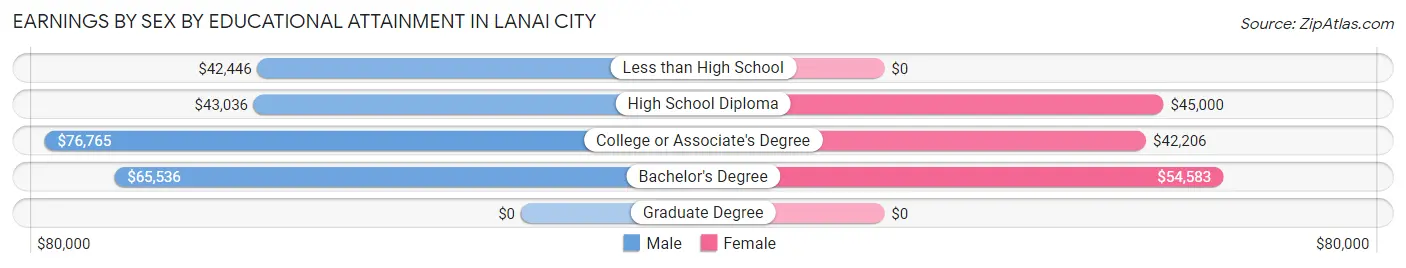
Earnings by Sex by Educational Attainment in Lanai City
Average earnings in Lanai City are $56,337 for men and $45,265 for women, a difference of 19.7%. Men with an educational attainment of college or associate's degree enjoy the highest average annual earnings of $76,765, while those with less than high school education earn the least with $42,446. Women with an educational attainment of bachelor's degree earn the most with the average annual earnings of $54,583, while those with college or associate's degree education have the smallest earnings of $42,206.
| Educational Attainment | Male Income | Female Income |
| Less than High School | $42,446 | $0 |
| High School Diploma | $43,036 | $45,000 |
| College or Associate's Degree | $76,765 | $42,206 |
| Bachelor's Degree | $65,536 | $54,583 |
| Graduate Degree | - | - |
| Total | $56,337 | $45,265 |
Family Income in Lanai City
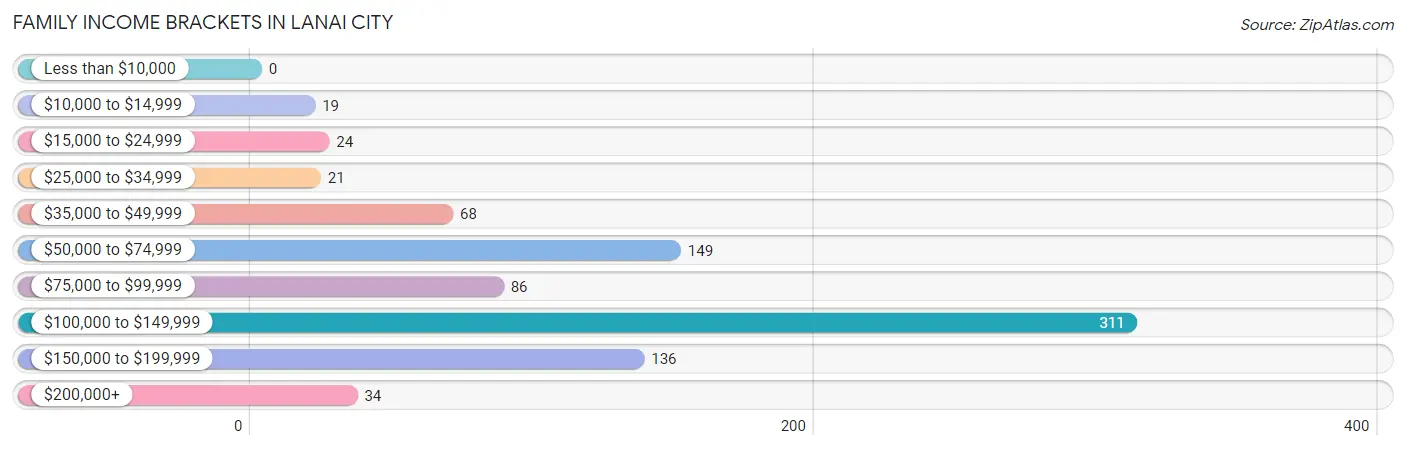
Family Income Brackets in Lanai City
According to the Lanai City family income data, there are 311 families falling into the $100,000 to $149,999 income range, which is the most common income bracket and makes up 36.7% of all families.
| Income Bracket | # Families | % Families |
| Less than $10,000 | 0 | 0.0% |
| $10,000 to $14,999 | 19 | 2.2% |
| $15,000 to $24,999 | 24 | 2.8% |
| $25,000 to $34,999 | 21 | 2.5% |
| $35,000 to $49,999 | 68 | 8.0% |
| $50,000 to $74,999 | 149 | 17.6% |
| $75,000 to $99,999 | 86 | 10.1% |
| $100,000 to $149,999 | 311 | 36.7% |
| $150,000 to $199,999 | 136 | 16.0% |
| $200,000+ | 34 | 4.0% |
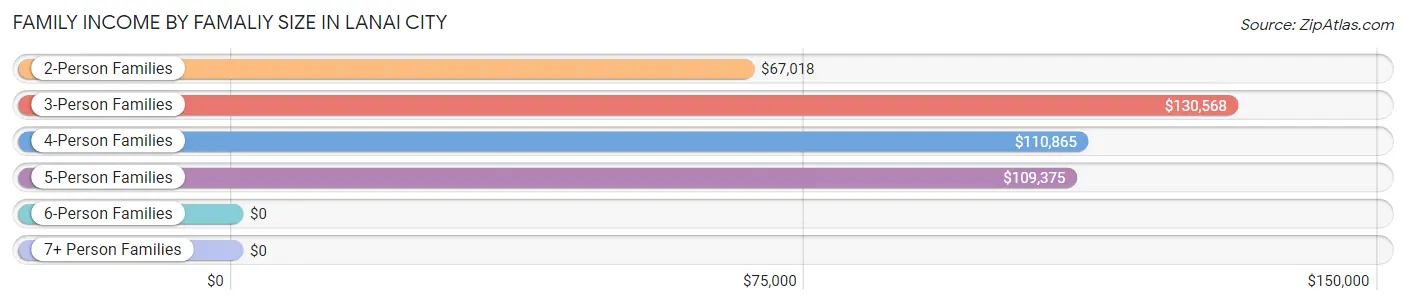
Family Income by Famaliy Size in Lanai City
3-person families (185 | 21.8%) account for the highest median family income in Lanai City with $130,568 per family, while 3-person families (185 | 21.8%) have the highest median income of $43,523 per family member.
| Income Bracket | # Families | Median Income |
| 2-Person Families | 417 (49.2%) | $67,018 |
| 3-Person Families | 185 (21.8%) | $130,568 |
| 4-Person Families | 149 (17.6%) | $110,865 |
| 5-Person Families | 69 (8.1%) | $109,375 |
| 6-Person Families | 19 (2.2%) | $0 |
| 7+ Person Families | 9 (1.1%) | $0 |
| Total | 848 (100.0%) | $108,250 |
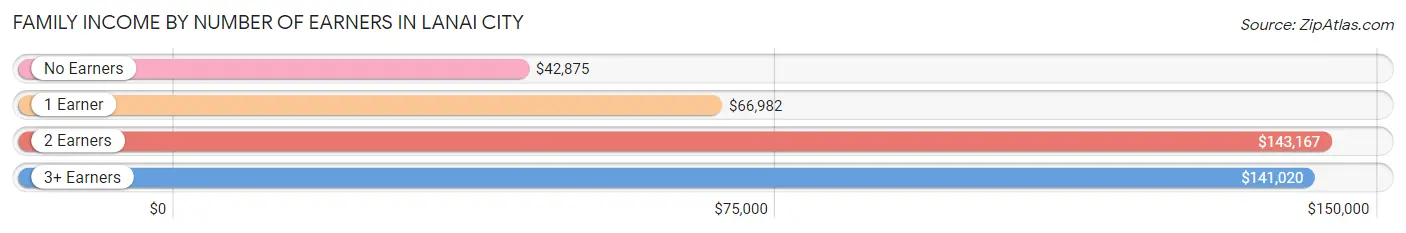
Family Income by Number of Earners in Lanai City
The median family income in Lanai City is $108,250, with families comprising 2 earners (262) having the highest median family income of $143,167, while families with no earners (119) have the lowest median family income of $42,875, accounting for 30.9% and 14.0% of families, respectively.
| Number of Earners | # Families | Median Income |
| No Earners | 119 (14.0%) | $42,875 |
| 1 Earner | 297 (35.0%) | $66,982 |
| 2 Earners | 262 (30.9%) | $143,167 |
| 3+ Earners | 170 (20.1%) | $141,020 |
| Total | 848 (100.0%) | $108,250 |
Household Income in Lanai City
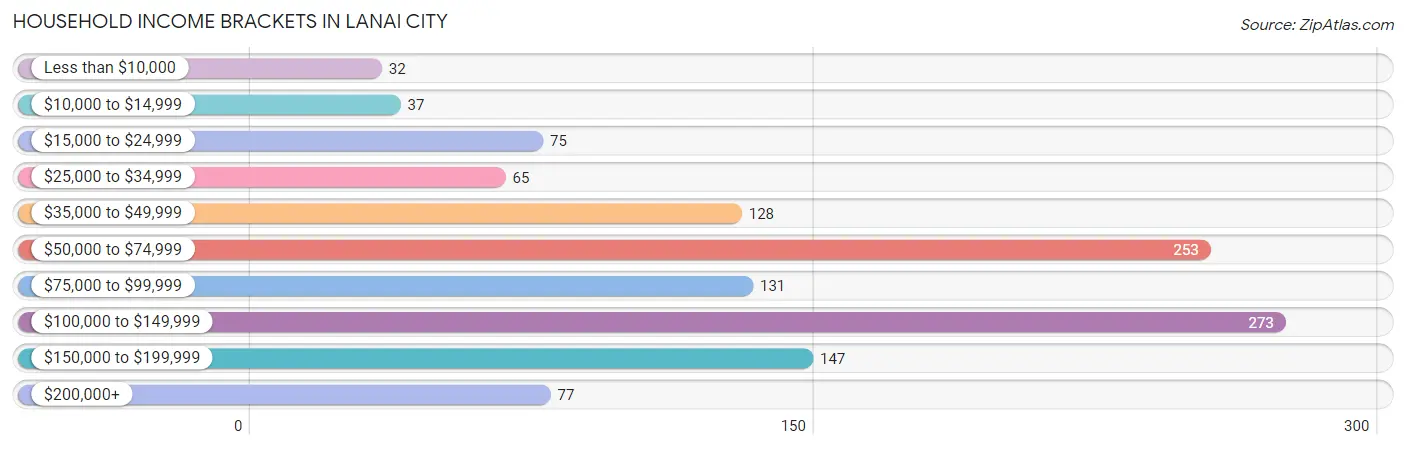
Household Income Brackets in Lanai City
With 273 households falling in the category, the $100,000 to $149,999 income range is the most frequent in Lanai City, accounting for 22.4% of all households. In contrast, only 32 households (2.6%) fall into the less than $10,000 income bracket, making it the least populous group.
| Income Bracket | # Households | % Households |
| Less than $10,000 | 32 | 2.6% |
| $10,000 to $14,999 | 37 | 3.0% |
| $15,000 to $24,999 | 75 | 6.2% |
| $25,000 to $34,999 | 65 | 5.3% |
| $35,000 to $49,999 | 128 | 10.5% |
| $50,000 to $74,999 | 253 | 20.8% |
| $75,000 to $99,999 | 131 | 10.8% |
| $100,000 to $149,999 | 273 | 22.4% |
| $150,000 to $199,999 | 147 | 12.1% |
| $200,000+ | 77 | 6.3% |
Household Income by Householder Age in Lanai City
The median household income in Lanai City is $80,464, with the highest median household income of $137,353 found in the 45 to 64 years age bracket for the primary householder. A total of 370 households (30.4%) fall into this category. Meanwhile, the 15 to 24 years age bracket for the primary householder has the lowest median household income of $0, with 29 households (2.4%) in this group.
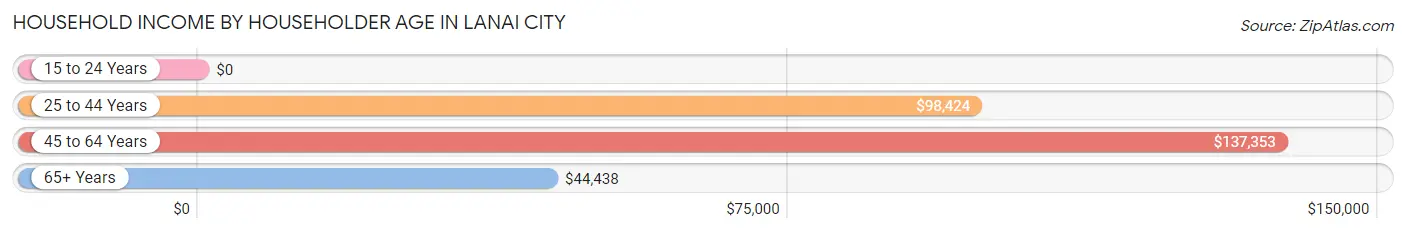
| Income Bracket | # Households | Median Income |
| 15 to 24 Years | 29 (2.4%) | $0 |
| 25 to 44 Years | 425 (34.9%) | $98,424 |
| 45 to 64 Years | 370 (30.4%) | $137,353 |
| 65+ Years | 393 (32.3%) | $44,438 |
| Total | 1,217 (100.0%) | $80,464 |
Poverty in Lanai City
Income Below Poverty by Sex and Age in Lanai City
With 5.3% poverty level for males and 11.0% for females among the residents of Lanai City, under 5 year old males and 6 to 11 year old females are the most vulnerable to poverty, with 20 males (34.5%) and 12 females (85.7%) in their respective age groups living below the poverty level.
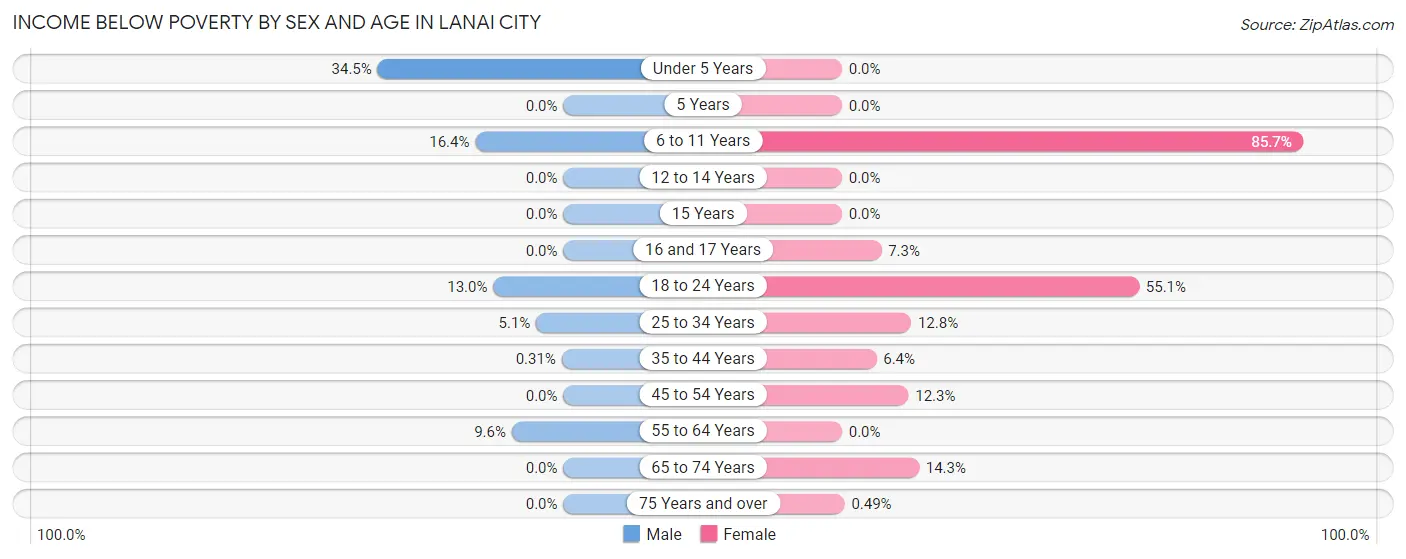
| Age Bracket | Male | Female |
| Under 5 Years | 20 (34.5%) | 0 (0.0%) |
| 5 Years | 0 (0.0%) | 0 (0.0%) |
| 6 to 11 Years | 17 (16.4%) | 12 (85.7%) |
| 12 to 14 Years | 0 (0.0%) | 0 (0.0%) |
| 15 Years | 0 (0.0%) | 0 (0.0%) |
| 16 and 17 Years | 0 (0.0%) | 3 (7.3%) |
| 18 to 24 Years | 19 (13.0%) | 59 (55.1%) |
| 25 to 34 Years | 10 (5.1%) | 19 (12.8%) |
| 35 to 44 Years | 1 (0.3%) | 11 (6.4%) |
| 45 to 54 Years | 0 (0.0%) | 19 (12.3%) |
| 55 to 64 Years | 27 (9.6%) | 0 (0.0%) |
| 65 to 74 Years | 0 (0.0%) | 30 (14.3%) |
| 75 Years and over | 0 (0.0%) | 1 (0.5%) |
| Total | 94 (5.3%) | 154 (11.0%) |
Income Above Poverty by Sex and Age in Lanai City
According to the poverty statistics in Lanai City, males aged 12 to 14 years and females aged under 5 years are the age groups that are most secure financially, with 100.0% of males and 100.0% of females in these age groups living above the poverty line.
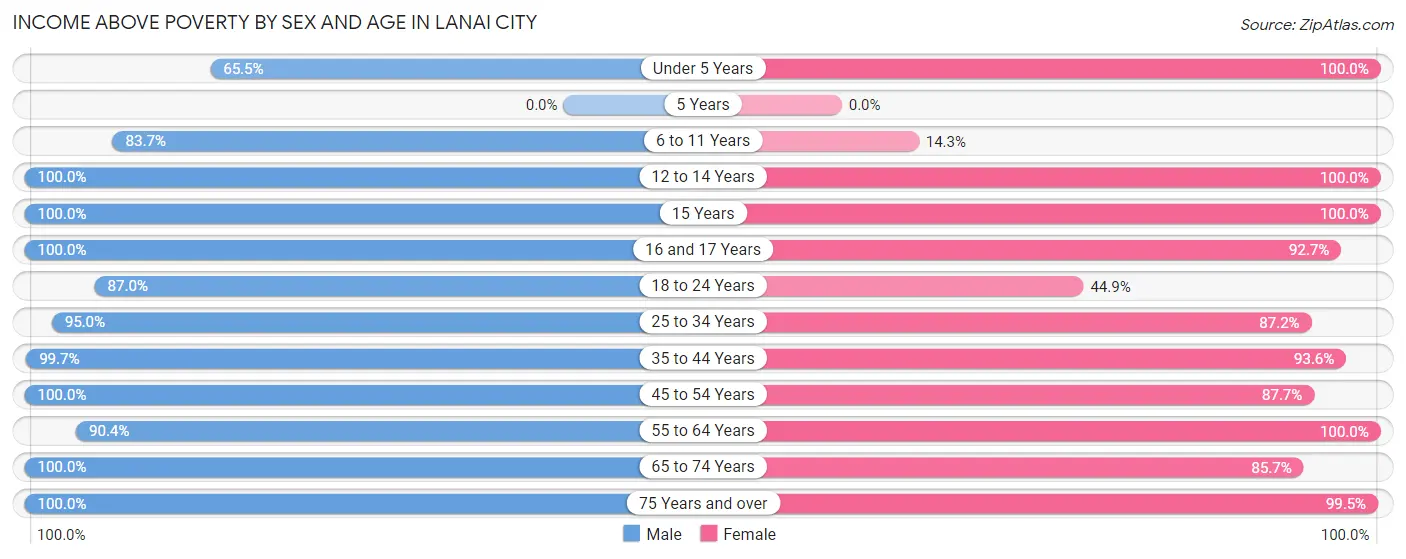
| Age Bracket | Male | Female |
| Under 5 Years | 38 (65.5%) | 72 (100.0%) |
| 5 Years | 0 (0.0%) | 0 (0.0%) |
| 6 to 11 Years | 87 (83.7%) | 2 (14.3%) |
| 12 to 14 Years | 181 (100.0%) | 41 (100.0%) |
| 15 Years | 64 (100.0%) | 15 (100.0%) |
| 16 and 17 Years | 38 (100.0%) | 38 (92.7%) |
| 18 to 24 Years | 127 (87.0%) | 48 (44.9%) |
| 25 to 34 Years | 188 (95.0%) | 129 (87.2%) |
| 35 to 44 Years | 322 (99.7%) | 161 (93.6%) |
| 45 to 54 Years | 157 (100.0%) | 135 (87.7%) |
| 55 to 64 Years | 255 (90.4%) | 224 (100.0%) |
| 65 to 74 Years | 108 (100.0%) | 180 (85.7%) |
| 75 Years and over | 107 (100.0%) | 203 (99.5%) |
| Total | 1,672 (94.7%) | 1,248 (89.0%) |
Income Below Poverty Among Married-Couple Families in Lanai City
The poverty statistics for married-couple families in Lanai City show that 2.4% or 13 of the total 545 families live below the poverty line. Families with 1 or 2 children have the highest poverty rate of 7.0%, comprising of 13 families. On the other hand, families with no children have the lowest poverty rate of 0.0%, which includes 0 families.
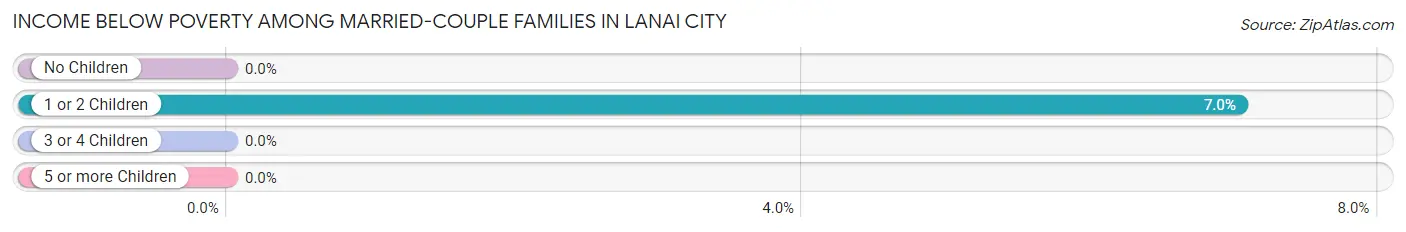
| Children | Above Poverty | Below Poverty |
| No Children | 351 (100.0%) | 0 (0.0%) |
| 1 or 2 Children | 172 (93.0%) | 13 (7.0%) |
| 3 or 4 Children | 9 (100.0%) | 0 (0.0%) |
| 5 or more Children | 0 (0.0%) | 0 (0.0%) |
| Total | 532 (97.6%) | 13 (2.4%) |
Income Below Poverty Among Single-Parent Households in Lanai City
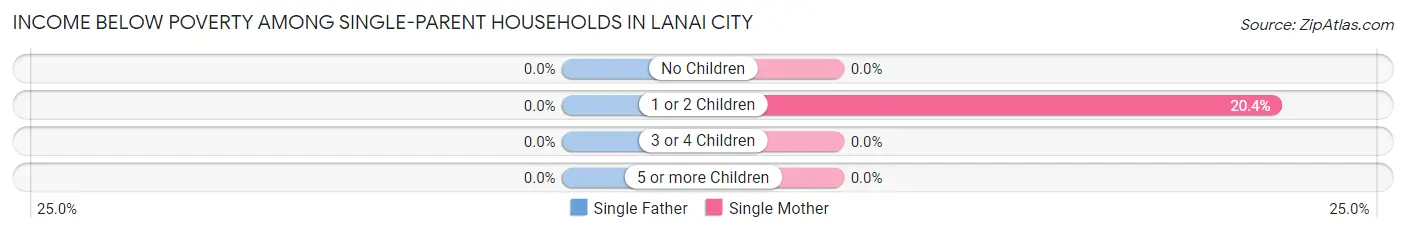
| Children | Single Father | Single Mother |
| No Children | 0 (0.0%) | 0 (0.0%) |
| 1 or 2 Children | 0 (0.0%) | 19 (20.4%) |
| 3 or 4 Children | 0 (0.0%) | 0 (0.0%) |
| 5 or more Children | 0 (0.0%) | 0 (0.0%) |
| Total | 0 (0.0%) | 19 (11.6%) |
Income Below Poverty Among Married-Couple vs Single-Parent Households in Lanai City
The poverty data for Lanai City shows that 13 of the married-couple family households (2.4%) and 19 of the single-parent households (6.3%) are living below the poverty level. Within the married-couple family households, those with 1 or 2 children have the highest poverty rate, with 13 households (7.0%) falling below the poverty line. Among the single-parent households, those with 1 or 2 children have the highest poverty rate, with 19 household (11.7%) living below poverty.
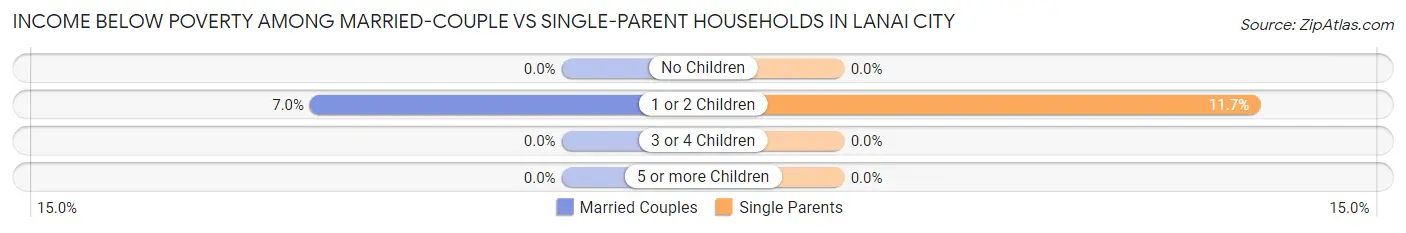
| Children | Married-Couple Families | Single-Parent Households |
| No Children | 0 (0.0%) | 0 (0.0%) |
| 1 or 2 Children | 13 (7.0%) | 19 (11.7%) |
| 3 or 4 Children | 0 (0.0%) | 0 (0.0%) |
| 5 or more Children | 0 (0.0%) | 0 (0.0%) |
| Total | 13 (2.4%) | 19 (6.3%) |
Race in Lanai City
The most populous races in Lanai City are Asian (1,620 | 51.0%), Two or more Races (745 | 23.5%), and White / Caucasian (382 | 12.0%).
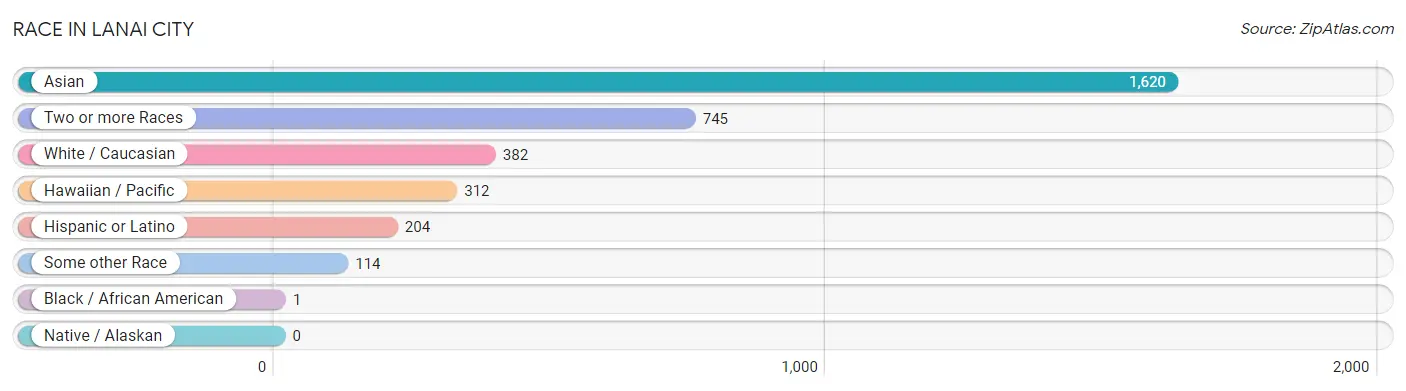
| Race | # Population | % Population |
| Asian | 1,620 | 51.0% |
| Black / African American | 1 | 0.0% |
| Hawaiian / Pacific | 312 | 9.8% |
| Hispanic or Latino | 204 | 6.4% |
| Native / Alaskan | 0 | 0.0% |
| White / Caucasian | 382 | 12.0% |
| Two or more Races | 745 | 23.5% |
| Some other Race | 114 | 3.6% |
| Total | 3,174 | 100.0% |
Ancestry in Lanai City
The most populous ancestries reported in Lanai City are Korean (1,734 | 54.6%), Native Hawaiian (770 | 24.3%), Bhutanese (493 | 15.5%), English (264 | 8.3%), and Cherokee (171 | 5.4%), together accounting for 108.1% of all Lanai City residents.
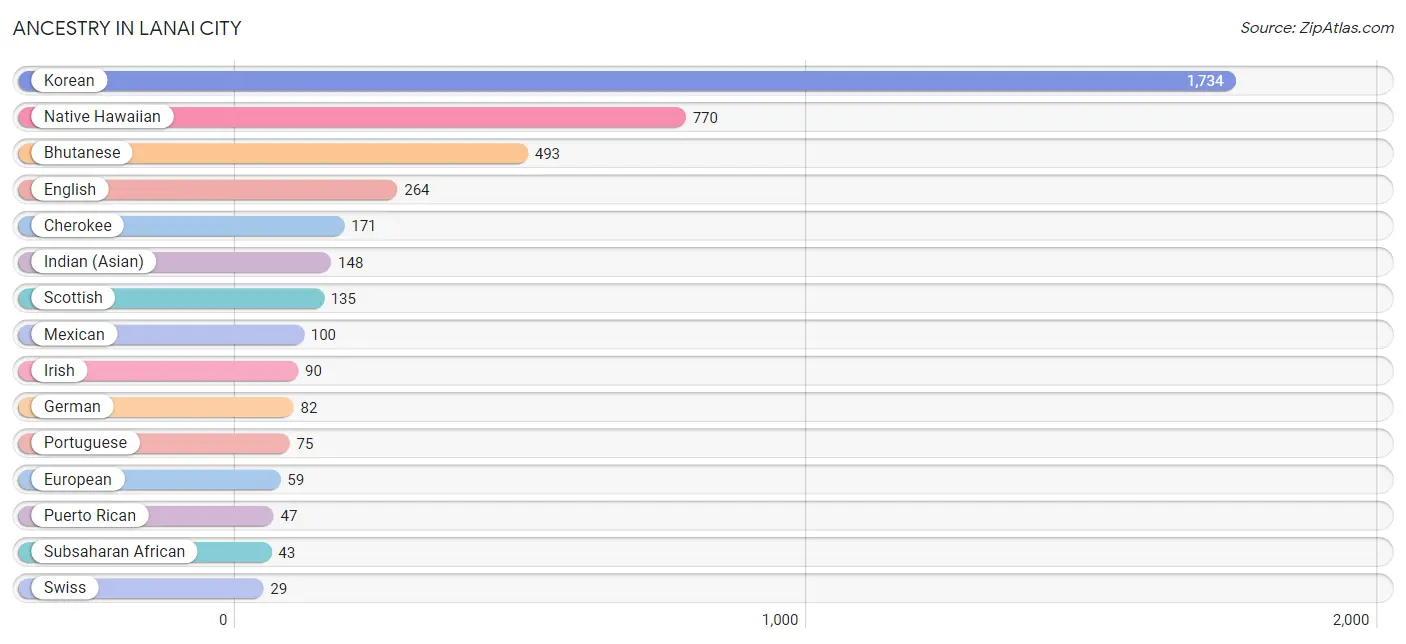
| Ancestry | # Population | % Population |
| Belgian | 17 | 0.5% |
| Bhutanese | 493 | 15.5% |
| British | 11 | 0.4% |
| Burmese | 11 | 0.4% |
| Cherokee | 171 | 5.4% |
| Cuban | 14 | 0.4% |
| Dominican | 27 | 0.9% |
| English | 264 | 8.3% |
| European | 59 | 1.9% |
| Fijian | 21 | 0.7% |
| French | 17 | 0.5% |
| German | 82 | 2.6% |
| Guamanian / Chamorro | 18 | 0.6% |
| Indian (Asian) | 148 | 4.7% |
| Irish | 90 | 2.8% |
| Italian | 27 | 0.9% |
| Korean | 1,734 | 54.6% |
| Mexican | 100 | 3.2% |
| Native Hawaiian | 770 | 24.3% |
| Norwegian | 3 | 0.1% |
| Portuguese | 75 | 2.4% |
| Potawatomi | 14 | 0.4% |
| Puerto Rican | 47 | 1.5% |
| Scandinavian | 22 | 0.7% |
| Scottish | 135 | 4.3% |
| Sierra Leonean | 1 | 0.0% |
| Spanish | 16 | 0.5% |
| Subsaharan African | 43 | 1.3% |
| Swiss | 29 | 0.9% | View All 29 Rows |
Immigrants in Lanai City
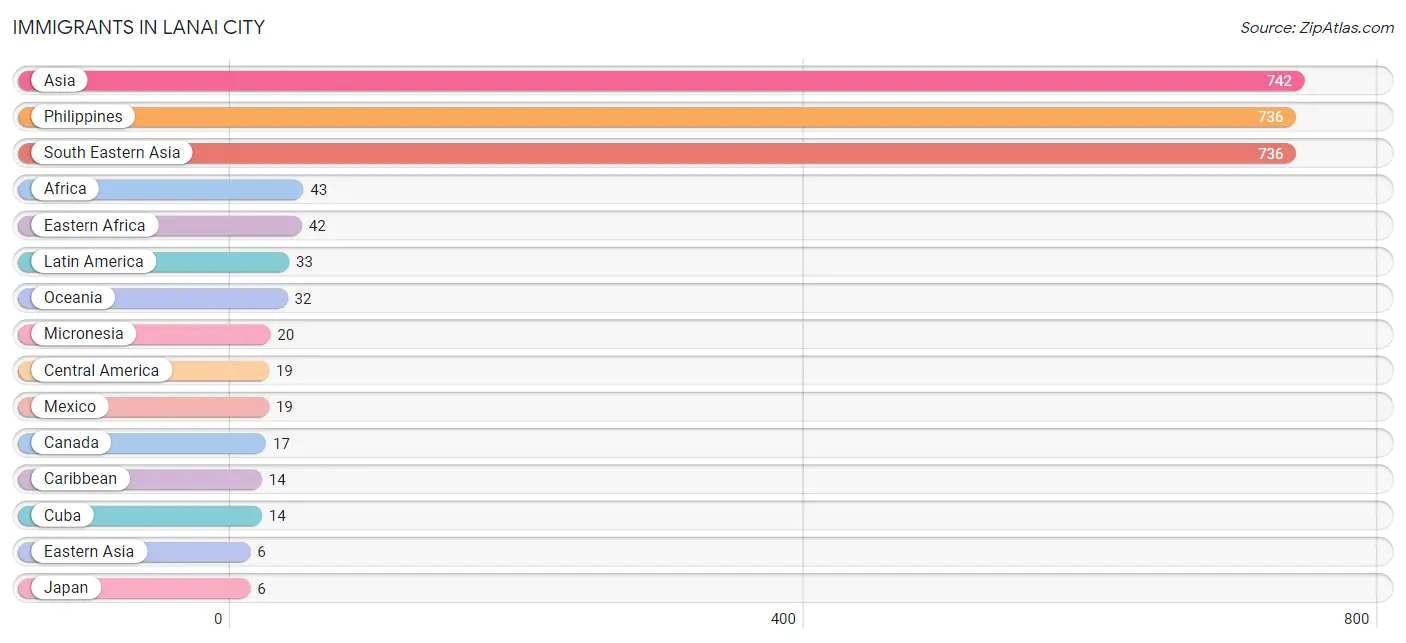
The most numerous immigrant groups reported in Lanai City came from Asia (742 | 23.4%), Philippines (736 | 23.2%), South Eastern Asia (736 | 23.2%), Africa (43 | 1.3%), and Eastern Africa (42 | 1.3%), together accounting for 72.4% of all Lanai City residents.
| Immigration Origin | # Population | % Population |
| Africa | 43 | 1.3% |
| Asia | 742 | 23.4% |
| Canada | 17 | 0.5% |
| Caribbean | 14 | 0.4% |
| Central America | 19 | 0.6% |
| Cuba | 14 | 0.4% |
| Eastern Africa | 42 | 1.3% |
| Eastern Asia | 6 | 0.2% |
| Japan | 6 | 0.2% |
| Latin America | 33 | 1.0% |
| Mexico | 19 | 0.6% |
| Micronesia | 20 | 0.6% |
| Oceania | 32 | 1.0% |
| Philippines | 736 | 23.2% |
| Sierra Leone | 1 | 0.0% |
| South Eastern Asia | 736 | 23.2% |
| Western Africa | 1 | 0.0% | View All 17 Rows |
Sex and Age in Lanai City
Sex and Age in Lanai City
The most populous age groups in Lanai City are 10 to 14 Years (193 | 10.9%) for men and 60 to 64 Years (152 | 10.8%) for women.
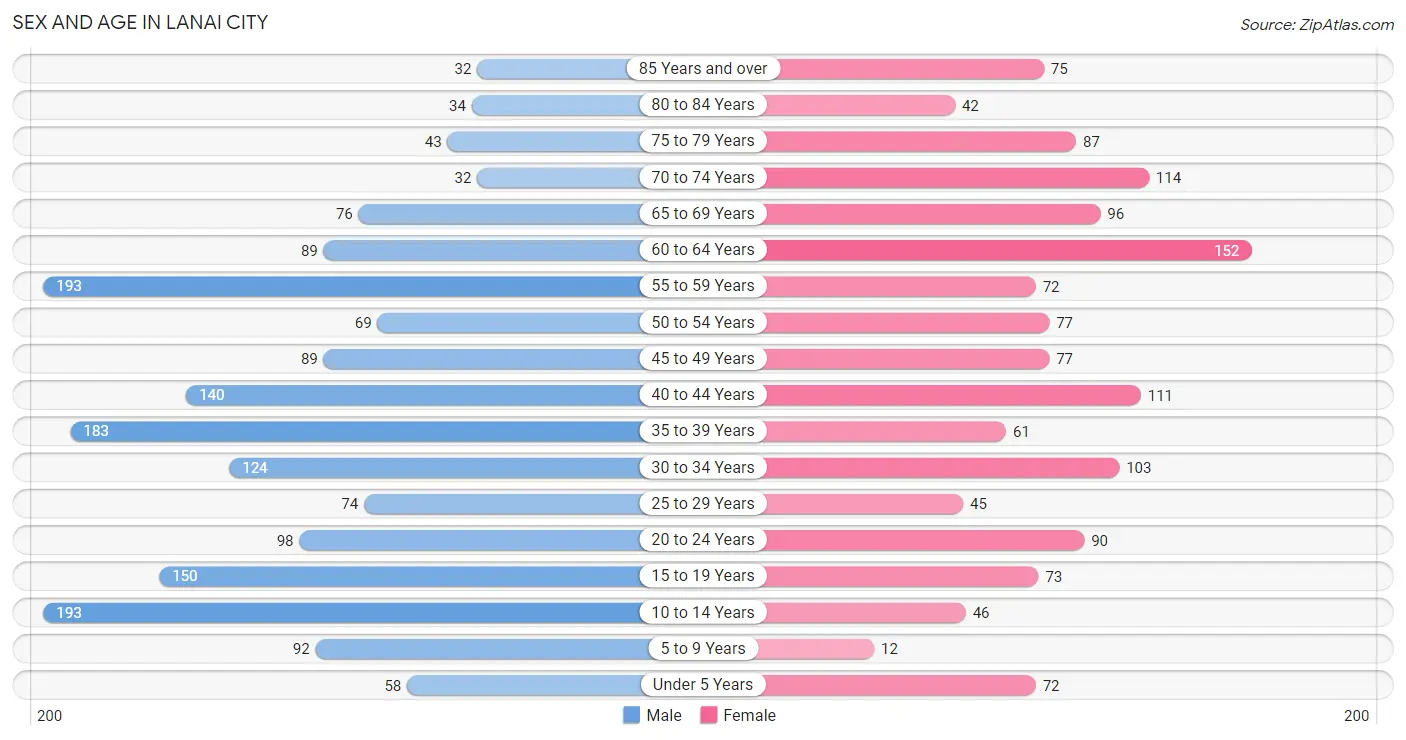
| Age Bracket | Male | Female |
| Under 5 Years | 58 (3.3%) | 72 (5.1%) |
| 5 to 9 Years | 92 (5.2%) | 12 (0.9%) |
| 10 to 14 Years | 193 (10.9%) | 46 (3.3%) |
| 15 to 19 Years | 150 (8.5%) | 73 (5.2%) |
| 20 to 24 Years | 98 (5.5%) | 90 (6.4%) |
| 25 to 29 Years | 74 (4.2%) | 45 (3.2%) |
| 30 to 34 Years | 124 (7.0%) | 103 (7.3%) |
| 35 to 39 Years | 183 (10.3%) | 61 (4.3%) |
| 40 to 44 Years | 140 (7.9%) | 111 (7.9%) |
| 45 to 49 Years | 89 (5.0%) | 77 (5.5%) |
| 50 to 54 Years | 69 (3.9%) | 77 (5.5%) |
| 55 to 59 Years | 193 (10.9%) | 72 (5.1%) |
| 60 to 64 Years | 89 (5.0%) | 152 (10.8%) |
| 65 to 69 Years | 76 (4.3%) | 96 (6.8%) |
| 70 to 74 Years | 32 (1.8%) | 114 (8.1%) |
| 75 to 79 Years | 43 (2.4%) | 87 (6.2%) |
| 80 to 84 Years | 34 (1.9%) | 42 (3.0%) |
| 85 Years and over | 32 (1.8%) | 75 (5.3%) |
| Total | 1,769 (100.0%) | 1,405 (100.0%) |
Families and Households in Lanai City
Median Family Size in Lanai City
The median family size in Lanai City is 3.04 persons per family, with married-couple families (545 | 64.3%) accounting for the largest median family size of 3.18 persons per family. On the other hand, single male/father families (139 | 16.4%) represent the smallest median family size with 2.45 persons per family.
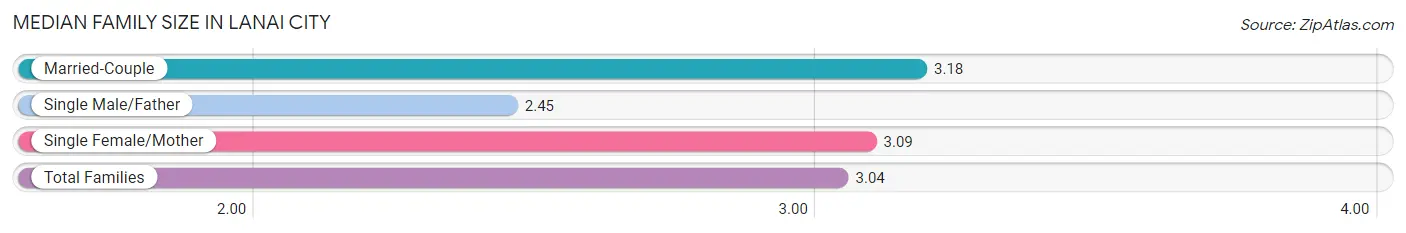
| Family Type | # Families | Family Size |
| Married-Couple | 545 (64.3%) | 3.18 |
| Single Male/Father | 139 (16.4%) | 2.45 |
| Single Female/Mother | 164 (19.3%) | 3.09 |
| Total Families | 848 (100.0%) | 3.04 |
Median Household Size in Lanai City
The median household size in Lanai City is 2.59 persons per household, with single female/mother households (164 | 13.5%) accounting for the largest median household size of 3.7 persons per household. non-family households (369 | 30.3%) represent the smallest median household size with 1.09 persons per household.
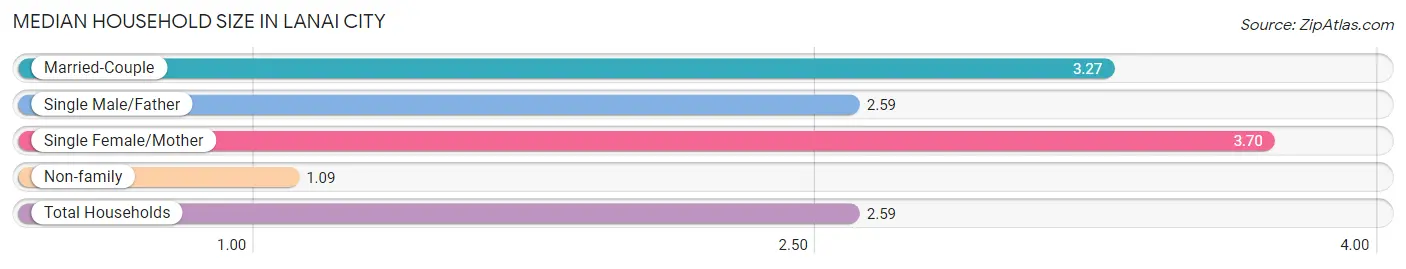
| Household Type | # Households | Household Size |
| Married-Couple | 545 (44.8%) | 3.27 |
| Single Male/Father | 139 (11.4%) | 2.59 |
| Single Female/Mother | 164 (13.5%) | 3.70 |
| Non-family | 369 (30.3%) | 1.09 |
| Total Households | 1,217 (100.0%) | 2.59 |
Household Size by Marriage Status in Lanai City
Out of a total of 1,217 households in Lanai City, 848 (69.7%) are family households, while 369 (30.3%) are nonfamily households. The most numerous type of family households are 2-person households, comprising 385, and the most common type of nonfamily households are 1-person households, comprising 331.
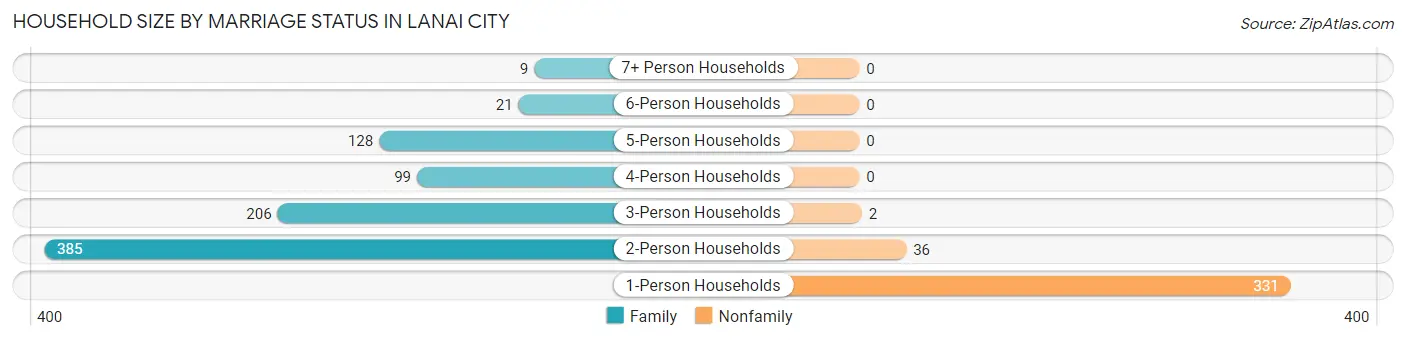
| Household Size | Family Households | Nonfamily Households |
| 1-Person Households | - | 331 (27.2%) |
| 2-Person Households | 385 (31.6%) | 36 (3.0%) |
| 3-Person Households | 206 (16.9%) | 2 (0.2%) |
| 4-Person Households | 99 (8.1%) | 0 (0.0%) |
| 5-Person Households | 128 (10.5%) | 0 (0.0%) |
| 6-Person Households | 21 (1.7%) | 0 (0.0%) |
| 7+ Person Households | 9 (0.7%) | 0 (0.0%) |
| Total | 848 (69.7%) | 369 (30.3%) |
Female Fertility in Lanai City
Fertility by Age in Lanai City
| Age Bracket | Women with Births | Births / 1,000 Women |
| 15 to 19 years | 0 (0.0%) | 0.0 |
| 20 to 34 years | 0 (0.0%) | 0.0 |
| 35 to 50 years | 0 (0.0%) | 0.0 |
| Total | 0 (0.0%) | 0.0 |
Fertility by Age by Marriage Status in Lanai City
| Age Bracket | Married | Unmarried |
| 15 to 19 years | 0 (0.0%) | 0 (0.0%) |
| 20 to 34 years | 0 (0.0%) | 0 (0.0%) |
| 35 to 50 years | 0 (0.0%) | 0 (0.0%) |
| Total | 0 (0.0%) | 0 (0.0%) |
Fertility by Education in Lanai City
| Educational Attainment | Women with Births | Births / 1,000 Women |
| Less than High School | 0 (0.0%) | 0.0 |
| High School Diploma | 0 (0.0%) | 0.0 |
| College or Associate's Degree | 0 (0.0%) | 0.0 |
| Bachelor's Degree | 0 (0.0%) | 0.0 |
| Graduate Degree | 0 (0.0%) | 0.0 |
| Total | 0 (0.0%) | 0.0 |
Fertility by Education by Marriage Status in Lanai City
| Educational Attainment | Married | Unmarried |
| Less than High School | 0 (0.0%) | 0 (0.0%) |
| High School Diploma | 0 (0.0%) | 0 (0.0%) |
| College or Associate's Degree | 0 (0.0%) | 0 (0.0%) |
| Bachelor's Degree | 0 (0.0%) | 0 (0.0%) |
| Graduate Degree | 0 (0.0%) | 0 (0.0%) |
| Total | 0 (0.0%) | 0 (0.0%) |
Employment Characteristics in Lanai City
Employment by Class of Employer in Lanai City
Among the 1,687 employed individuals in Lanai City, private company employees (1,242 | 73.6%), state government employees (262 | 15.5%), and not-for-profit organizations (87 | 5.2%) make up the most common classes of employment.
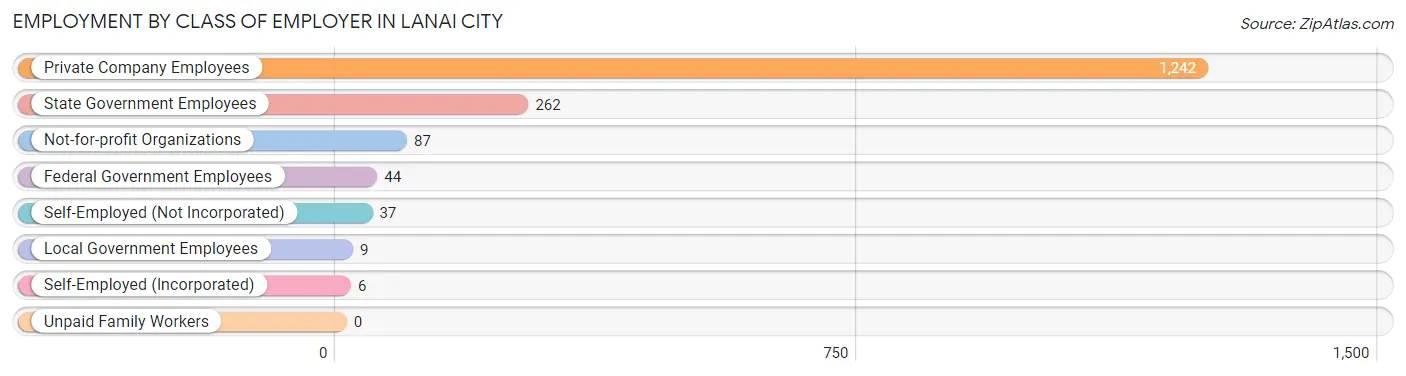
| Employer Class | # Employees | % Employees |
| Private Company Employees | 1,242 | 73.6% |
| Self-Employed (Incorporated) | 6 | 0.4% |
| Self-Employed (Not Incorporated) | 37 | 2.2% |
| Not-for-profit Organizations | 87 | 5.2% |
| Local Government Employees | 9 | 0.5% |
| State Government Employees | 262 | 15.5% |
| Federal Government Employees | 44 | 2.6% |
| Unpaid Family Workers | 0 | 0.0% |
| Total | 1,687 | 100.0% |
Employment Status by Age in Lanai City
According to the labor force statistics for Lanai City, out of the total population over 16 years of age (2,622), 66.1% or 1,733 individuals are in the labor force, with 2.4% or 42 of them unemployed. The age group with the highest labor force participation rate is 25 to 29 years, with 100.0% or 119 individuals in the labor force. Within the labor force, the 25 to 29 years age range has the highest percentage of unemployed individuals, with 24.4% or 29 of them being unemployed.
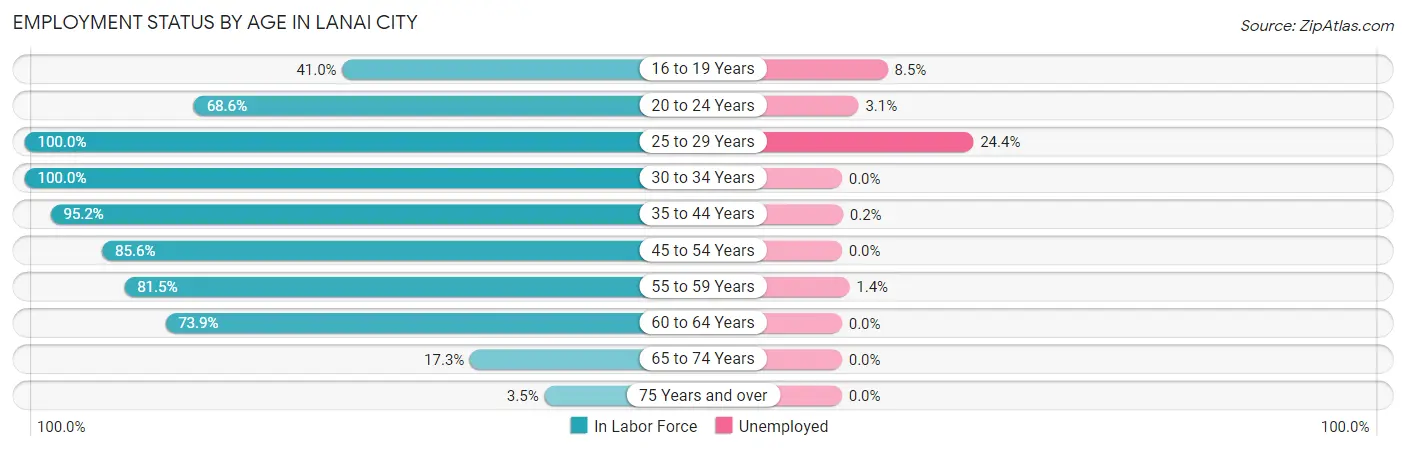
| Age Bracket | In Labor Force | Unemployed |
| 16 to 19 Years | 59 (41.0%) | 5 (8.5%) |
| 20 to 24 Years | 129 (68.6%) | 4 (3.1%) |
| 25 to 29 Years | 119 (100.0%) | 29 (24.4%) |
| 30 to 34 Years | 227 (100.0%) | 0 (0.0%) |
| 35 to 44 Years | 471 (95.2%) | 1 (0.2%) |
| 45 to 54 Years | 267 (85.6%) | 0 (0.0%) |
| 55 to 59 Years | 216 (81.5%) | 3 (1.4%) |
| 60 to 64 Years | 178 (73.9%) | 0 (0.0%) |
| 65 to 74 Years | 55 (17.3%) | 0 (0.0%) |
| 75 Years and over | 11 (3.5%) | 0 (0.0%) |
| Total | 1,733 (66.1%) | 42 (2.4%) |
Employment Status by Educational Attainment in Lanai City
According to labor force statistics for Lanai City, 89.1% of individuals (1,478) out of the total population between 25 and 64 years of age (1,659) are in the labor force, with 2.2% or 33 of them being unemployed. The group with the highest labor force participation rate are those with the educational attainment of less than high school, with 98.5% or 64 individuals in the labor force. Within the labor force, individuals with bachelor's degree or higher education have the highest percentage of unemployment, with 4.1% or 16 of them being unemployed.
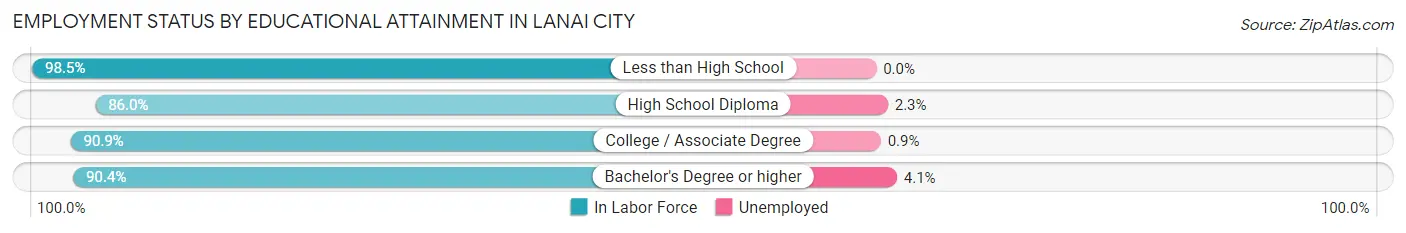
| Educational Attainment | In Labor Force | Unemployed |
| Less than High School | 64 (98.5%) | 0 (0.0%) |
| High School Diploma | 577 (86.0%) | 15 (2.3%) |
| College / Associate Degree | 451 (90.9%) | 4 (0.9%) |
| Bachelor's Degree or higher | 386 (90.4%) | 18 (4.1%) |
| Total | 1,478 (89.1%) | 36 (2.2%) |
Employment Occupations by Sex in Lanai City
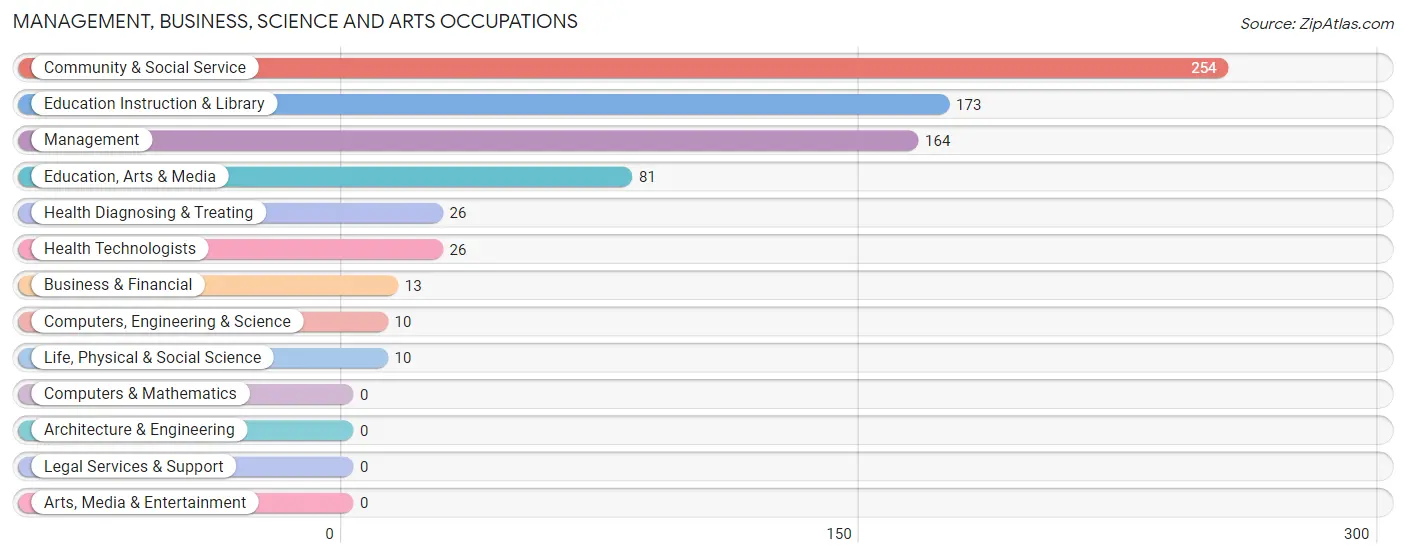
Management, Business, Science and Arts Occupations
The most common Management, Business, Science and Arts occupations in Lanai City are Community & Social Service (254 | 15.1%), Education Instruction & Library (173 | 10.3%), Management (164 | 9.8%), Education, Arts & Media (81 | 4.8%), and Health Diagnosing & Treating (26 | 1.5%).
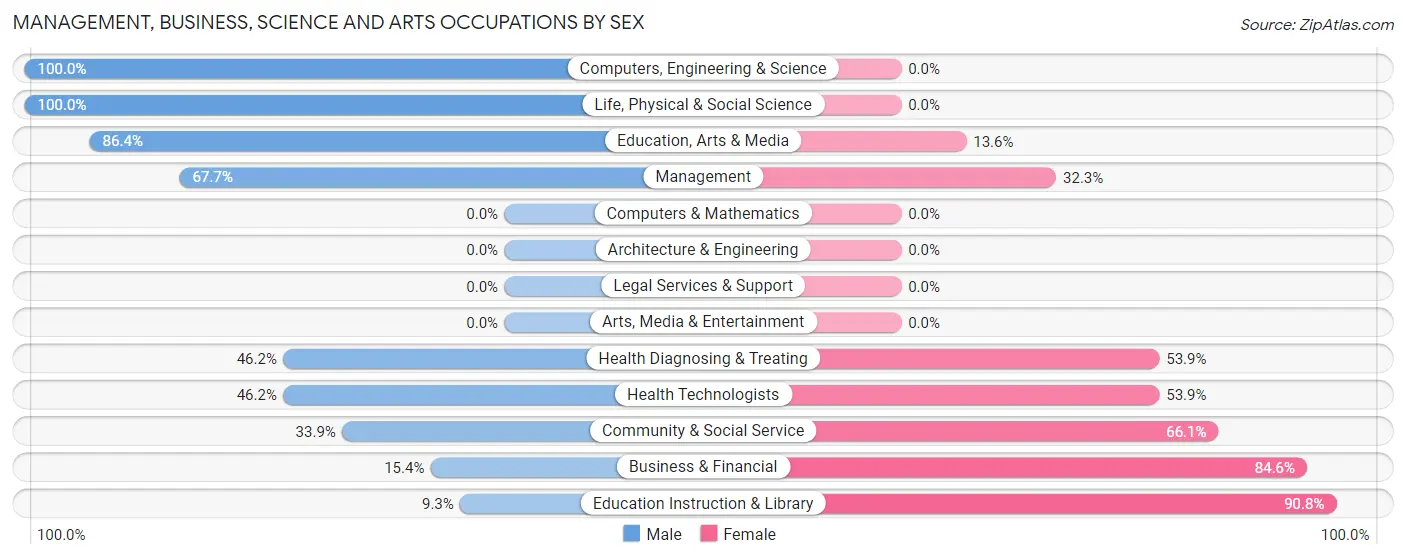
Management, Business, Science and Arts Occupations by Sex
Within the Management, Business, Science and Arts occupations in Lanai City, the most male-oriented occupations are Computers, Engineering & Science (100.0%), Life, Physical & Social Science (100.0%), and Education, Arts & Media (86.4%), while the most female-oriented occupations are Education Instruction & Library (90.7%), Business & Financial (84.6%), and Community & Social Service (66.1%).
| Occupation | Male | Female |
| Management | 111 (67.7%) | 53 (32.3%) |
| Business & Financial | 2 (15.4%) | 11 (84.6%) |
| Computers, Engineering & Science | 10 (100.0%) | 0 (0.0%) |
| Computers & Mathematics | 0 (0.0%) | 0 (0.0%) |
| Architecture & Engineering | 0 (0.0%) | 0 (0.0%) |
| Life, Physical & Social Science | 10 (100.0%) | 0 (0.0%) |
| Community & Social Service | 86 (33.9%) | 168 (66.1%) |
| Education, Arts & Media | 70 (86.4%) | 11 (13.6%) |
| Legal Services & Support | 0 (0.0%) | 0 (0.0%) |
| Education Instruction & Library | 16 (9.2%) | 157 (90.7%) |
| Arts, Media & Entertainment | 0 (0.0%) | 0 (0.0%) |
| Health Diagnosing & Treating | 12 (46.2%) | 14 (53.8%) |
| Health Technologists | 12 (46.2%) | 14 (53.8%) |
| Total (Category) | 221 (47.3%) | 246 (52.7%) |
| Total (Overall) | 1,044 (62.1%) | 636 (37.9%) |
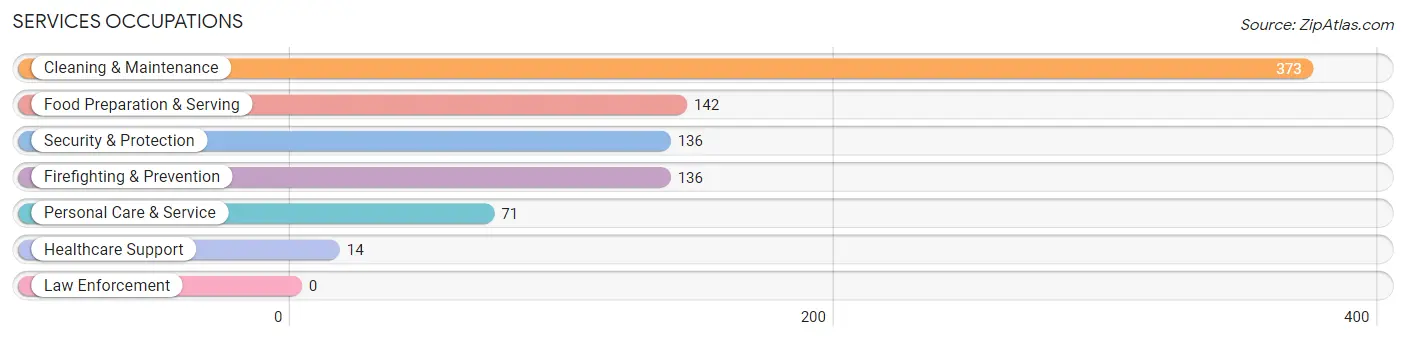
Services Occupations
The most common Services occupations in Lanai City are Cleaning & Maintenance (373 | 22.2%), Food Preparation & Serving (142 | 8.5%), Security & Protection (136 | 8.1%), Firefighting & Prevention (136 | 8.1%), and Personal Care & Service (71 | 4.2%).
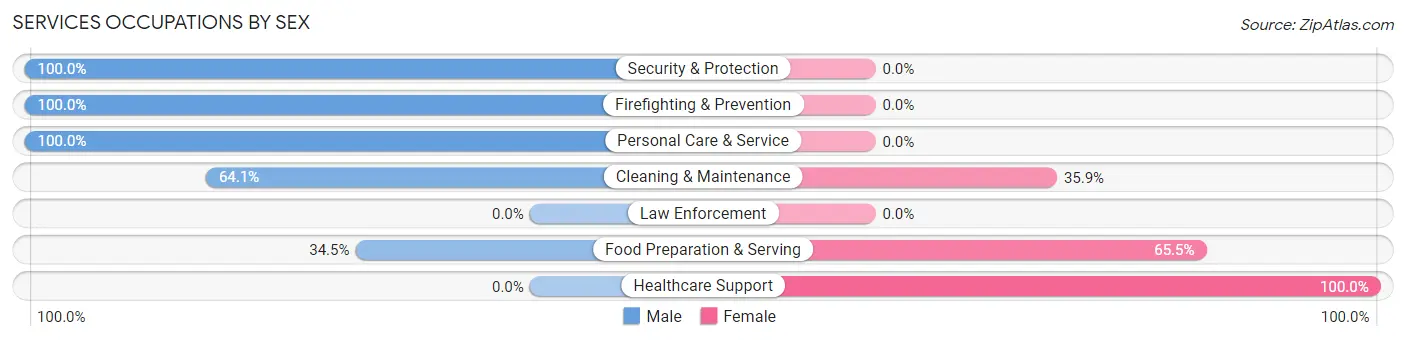
Services Occupations by Sex
Within the Services occupations in Lanai City, the most male-oriented occupations are Security & Protection (100.0%), Firefighting & Prevention (100.0%), and Personal Care & Service (100.0%), while the most female-oriented occupations are Healthcare Support (100.0%), Food Preparation & Serving (65.5%), and Cleaning & Maintenance (35.9%).
| Occupation | Male | Female |
| Healthcare Support | 0 (0.0%) | 14 (100.0%) |
| Security & Protection | 136 (100.0%) | 0 (0.0%) |
| Firefighting & Prevention | 136 (100.0%) | 0 (0.0%) |
| Law Enforcement | 0 (0.0%) | 0 (0.0%) |
| Food Preparation & Serving | 49 (34.5%) | 93 (65.5%) |
| Cleaning & Maintenance | 239 (64.1%) | 134 (35.9%) |
| Personal Care & Service | 71 (100.0%) | 0 (0.0%) |
| Total (Category) | 495 (67.3%) | 241 (32.7%) |
| Total (Overall) | 1,044 (62.1%) | 636 (37.9%) |
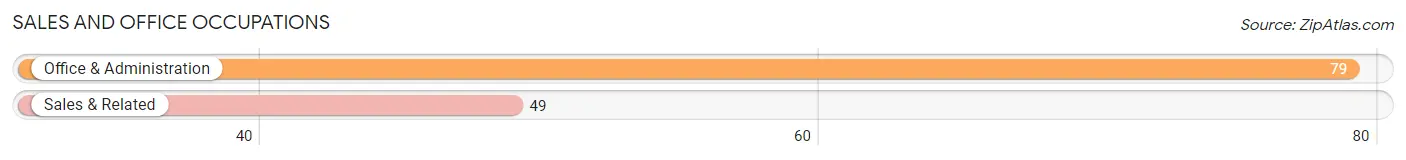
Sales and Office Occupations
The most common Sales and Office occupations in Lanai City are Office & Administration (79 | 4.7%), and Sales & Related (49 | 2.9%).
Sales and Office Occupations by Sex
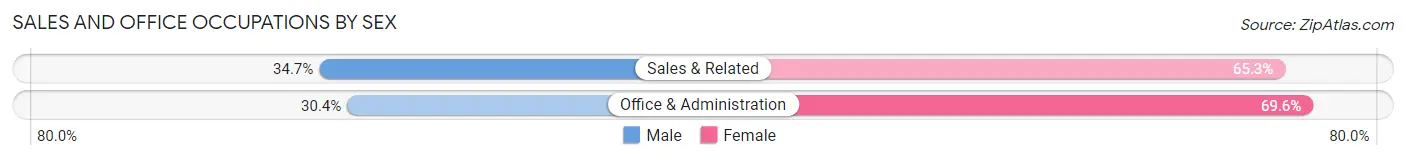
| Occupation | Male | Female |
| Sales & Related | 17 (34.7%) | 32 (65.3%) |
| Office & Administration | 24 (30.4%) | 55 (69.6%) |
| Total (Category) | 41 (32.0%) | 87 (68.0%) |
| Total (Overall) | 1,044 (62.1%) | 636 (37.9%) |
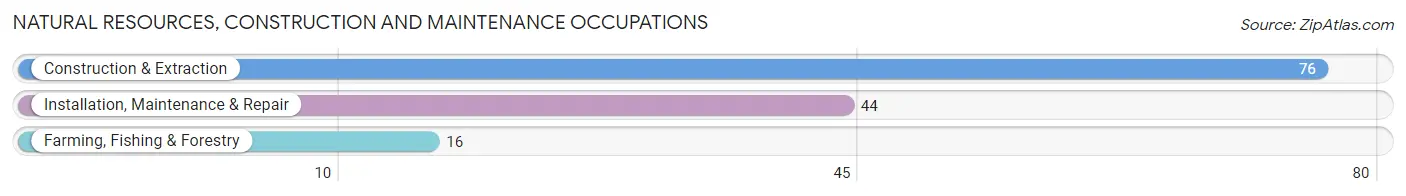
Natural Resources, Construction and Maintenance Occupations
The most common Natural Resources, Construction and Maintenance occupations in Lanai City are Construction & Extraction (76 | 4.5%), Installation, Maintenance & Repair (44 | 2.6%), and Farming, Fishing & Forestry (16 | 0.9%).
Natural Resources, Construction and Maintenance Occupations by Sex
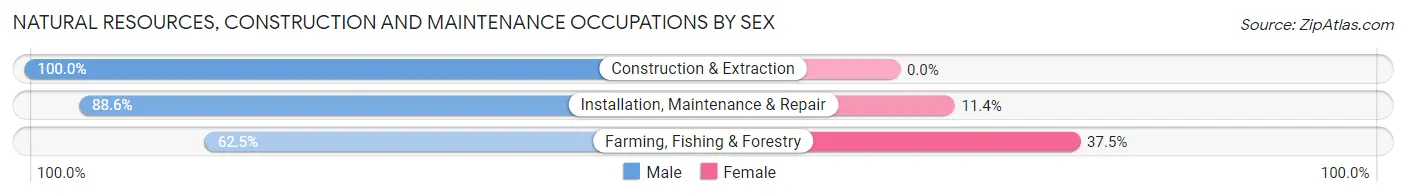
| Occupation | Male | Female |
| Farming, Fishing & Forestry | 10 (62.5%) | 6 (37.5%) |
| Construction & Extraction | 76 (100.0%) | 0 (0.0%) |
| Installation, Maintenance & Repair | 39 (88.6%) | 5 (11.4%) |
| Total (Category) | 125 (91.9%) | 11 (8.1%) |
| Total (Overall) | 1,044 (62.1%) | 636 (37.9%) |
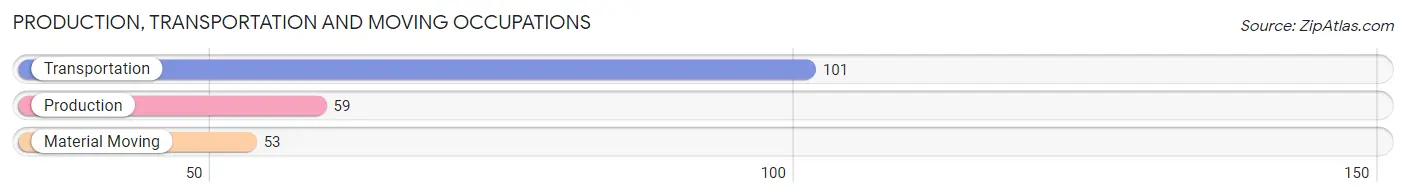
Production, Transportation and Moving Occupations
The most common Production, Transportation and Moving occupations in Lanai City are Transportation (101 | 6.0%), Production (59 | 3.5%), and Material Moving (53 | 3.2%).
Production, Transportation and Moving Occupations by Sex
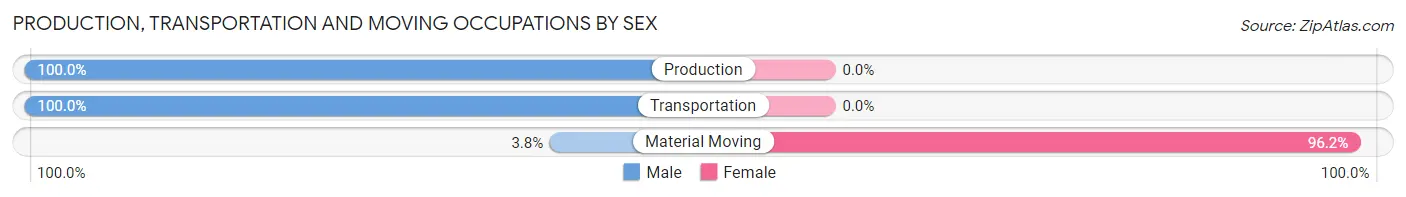
| Occupation | Male | Female |
| Production | 59 (100.0%) | 0 (0.0%) |
| Transportation | 101 (100.0%) | 0 (0.0%) |
| Material Moving | 2 (3.8%) | 51 (96.2%) |
| Total (Category) | 162 (76.1%) | 51 (23.9%) |
| Total (Overall) | 1,044 (62.1%) | 636 (37.9%) |
Employment Industries by Sex in Lanai City
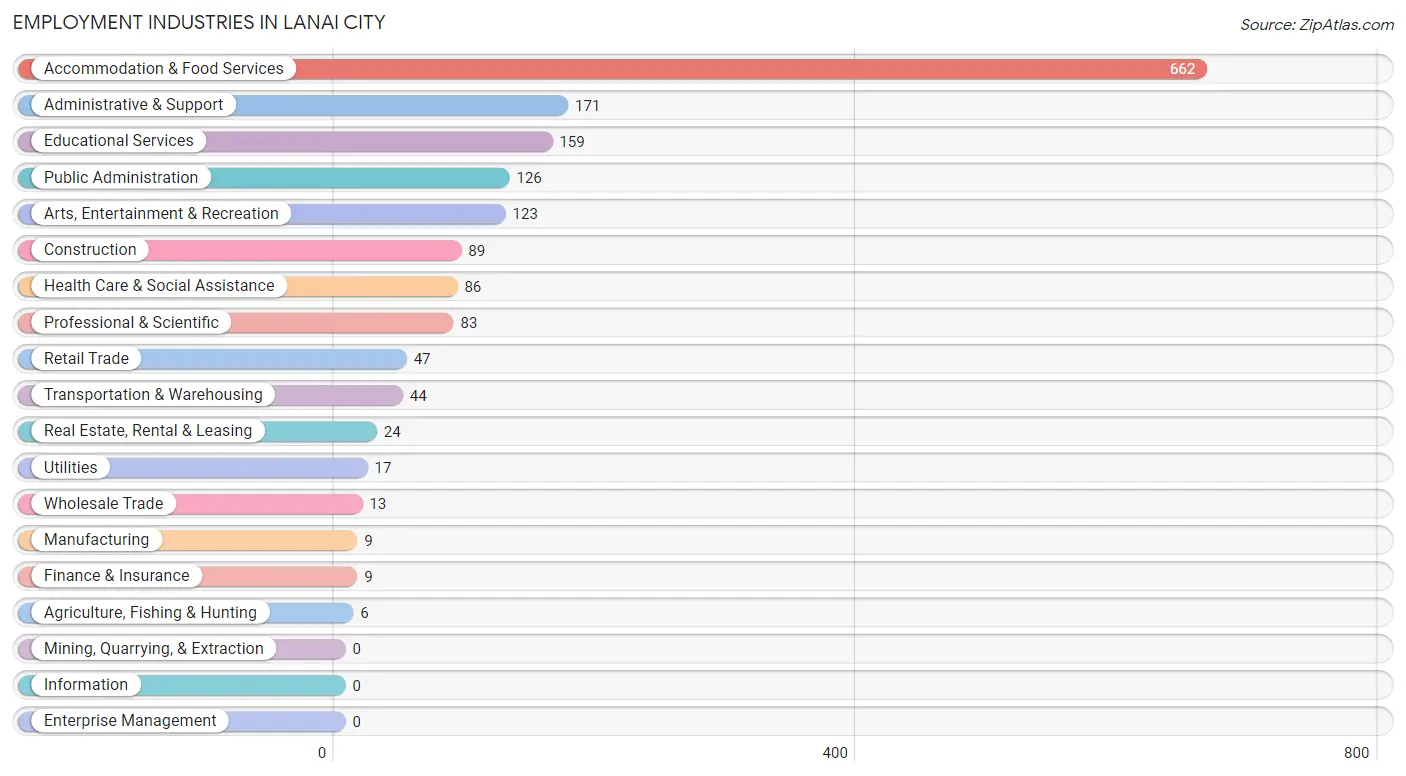
Employment Industries in Lanai City
The major employment industries in Lanai City include Accommodation & Food Services (662 | 39.4%), Administrative & Support (171 | 10.2%), Educational Services (159 | 9.5%), Public Administration (126 | 7.5%), and Arts, Entertainment & Recreation (123 | 7.3%).
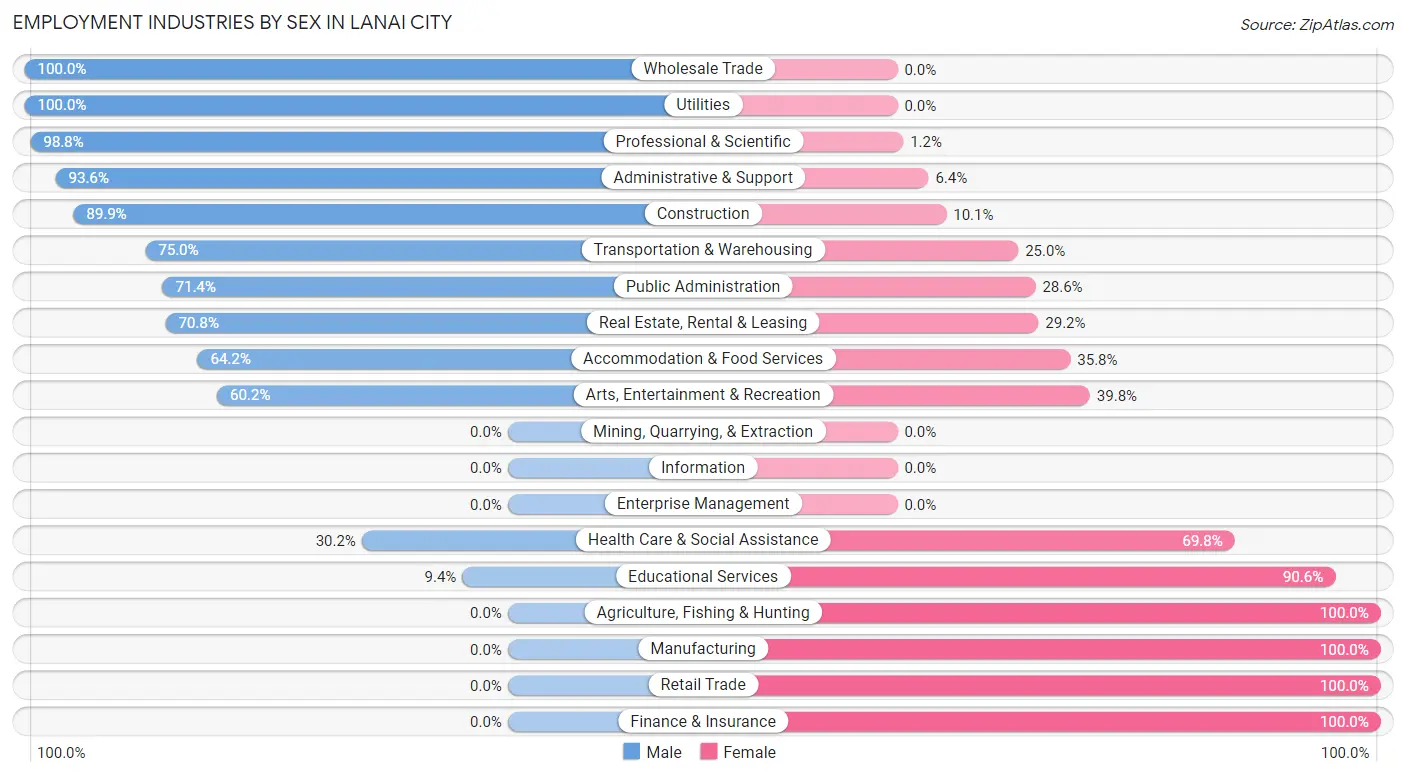
Employment Industries by Sex in Lanai City
The Lanai City industries that see more men than women are Wholesale Trade (100.0%), Utilities (100.0%), and Professional & Scientific (98.8%), whereas the industries that tend to have a higher number of women are Agriculture, Fishing & Hunting (100.0%), Manufacturing (100.0%), and Retail Trade (100.0%).
| Industry | Male | Female |
| Agriculture, Fishing & Hunting | 0 (0.0%) | 6 (100.0%) |
| Mining, Quarrying, & Extraction | 0 (0.0%) | 0 (0.0%) |
| Construction | 80 (89.9%) | 9 (10.1%) |
| Manufacturing | 0 (0.0%) | 9 (100.0%) |
| Wholesale Trade | 13 (100.0%) | 0 (0.0%) |
| Retail Trade | 0 (0.0%) | 47 (100.0%) |
| Transportation & Warehousing | 33 (75.0%) | 11 (25.0%) |
| Utilities | 17 (100.0%) | 0 (0.0%) |
| Information | 0 (0.0%) | 0 (0.0%) |
| Finance & Insurance | 0 (0.0%) | 9 (100.0%) |
| Real Estate, Rental & Leasing | 17 (70.8%) | 7 (29.2%) |
| Professional & Scientific | 82 (98.8%) | 1 (1.2%) |
| Enterprise Management | 0 (0.0%) | 0 (0.0%) |
| Administrative & Support | 160 (93.6%) | 11 (6.4%) |
| Educational Services | 15 (9.4%) | 144 (90.6%) |
| Health Care & Social Assistance | 26 (30.2%) | 60 (69.8%) |
| Arts, Entertainment & Recreation | 74 (60.2%) | 49 (39.8%) |
| Accommodation & Food Services | 425 (64.2%) | 237 (35.8%) |
| Public Administration | 90 (71.4%) | 36 (28.6%) |
| Total | 1,044 (62.1%) | 636 (37.9%) |
Education in Lanai City
School Enrollment in Lanai City
The most common levels of schooling among the 577 students in Lanai City are high school (209 | 36.2%), middle school (197 | 34.1%), and elementary school (87 | 15.1%).
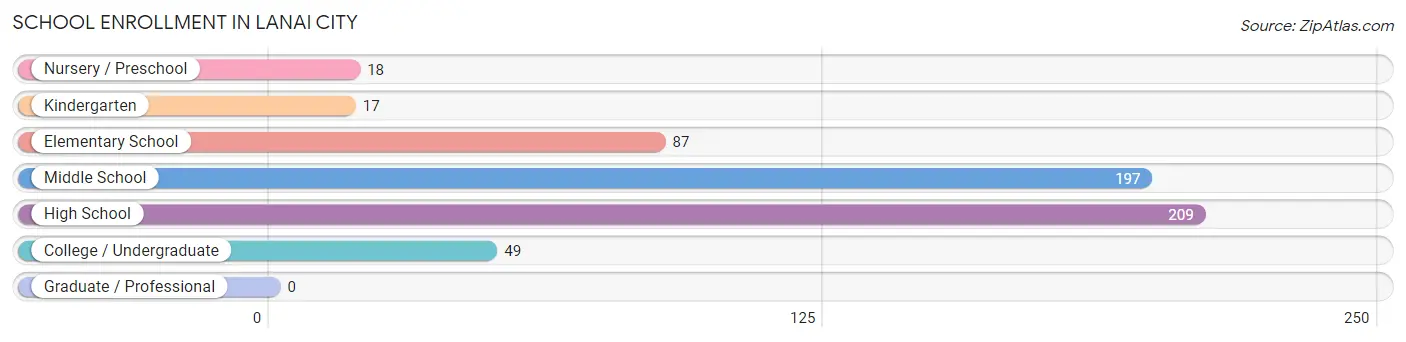
| School Level | # Students | % Students |
| Nursery / Preschool | 18 | 3.1% |
| Kindergarten | 17 | 2.9% |
| Elementary School | 87 | 15.1% |
| Middle School | 197 | 34.1% |
| High School | 209 | 36.2% |
| College / Undergraduate | 49 | 8.5% |
| Graduate / Professional | 0 | 0.0% |
| Total | 577 | 100.0% |
School Enrollment by Age by Funding Source in Lanai City
Out of a total of 577 students who are enrolled in schools in Lanai City, 32 (5.5%) attend a private institution, while the remaining 545 (94.5%) are enrolled in public schools. The age group of 25 to 34 year olds has the highest likelihood of being enrolled in private schools, with 29 (100.0% in the age bracket) enrolled. Conversely, the age group of 5 to 9 year old has the lowest likelihood of being enrolled in a private school, with 104 (100.0% in the age bracket) attending a public institution.
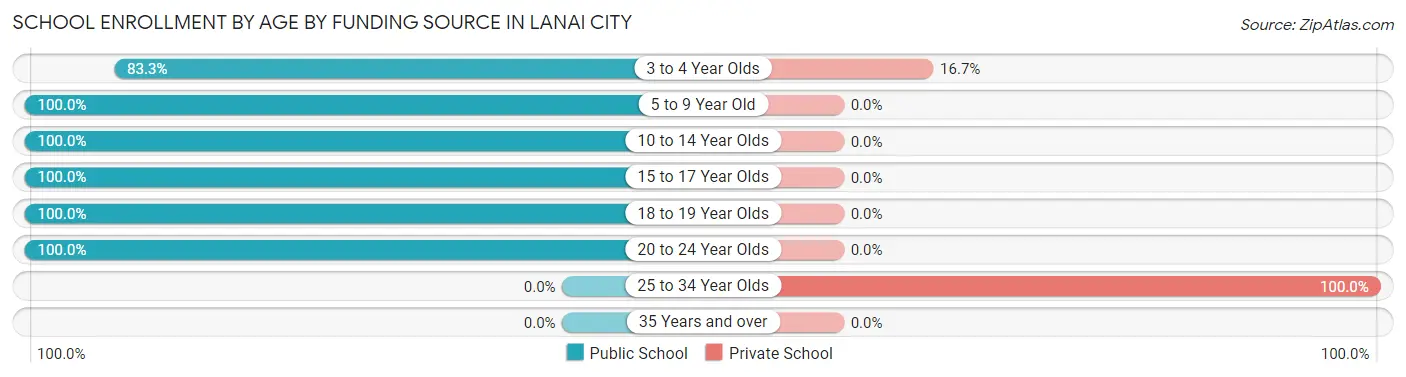
| Age Bracket | Public School | Private School |
| 3 to 4 Year Olds | 15 (83.3%) | 3 (16.7%) |
| 5 to 9 Year Old | 104 (100.0%) | 0 (0.0%) |
| 10 to 14 Year Olds | 239 (100.0%) | 0 (0.0%) |
| 15 to 17 Year Olds | 158 (100.0%) | 0 (0.0%) |
| 18 to 19 Year Olds | 12 (100.0%) | 0 (0.0%) |
| 20 to 24 Year Olds | 17 (100.0%) | 0 (0.0%) |
| 25 to 34 Year Olds | 0 (0.0%) | 29 (100.0%) |
| 35 Years and over | 0 (0.0%) | 0 (0.0%) |
| Total | 545 (94.5%) | 32 (5.5%) |
Educational Attainment by Field of Study in Lanai City
Education (140 | 23.5%), business (89 | 15.0%), multidisciplinary studies (79 | 13.3%), science & technology (51 | 8.6%), and psychology (38 | 6.4%) are the most common fields of study among 595 individuals in Lanai City who have obtained a bachelor's degree or higher.
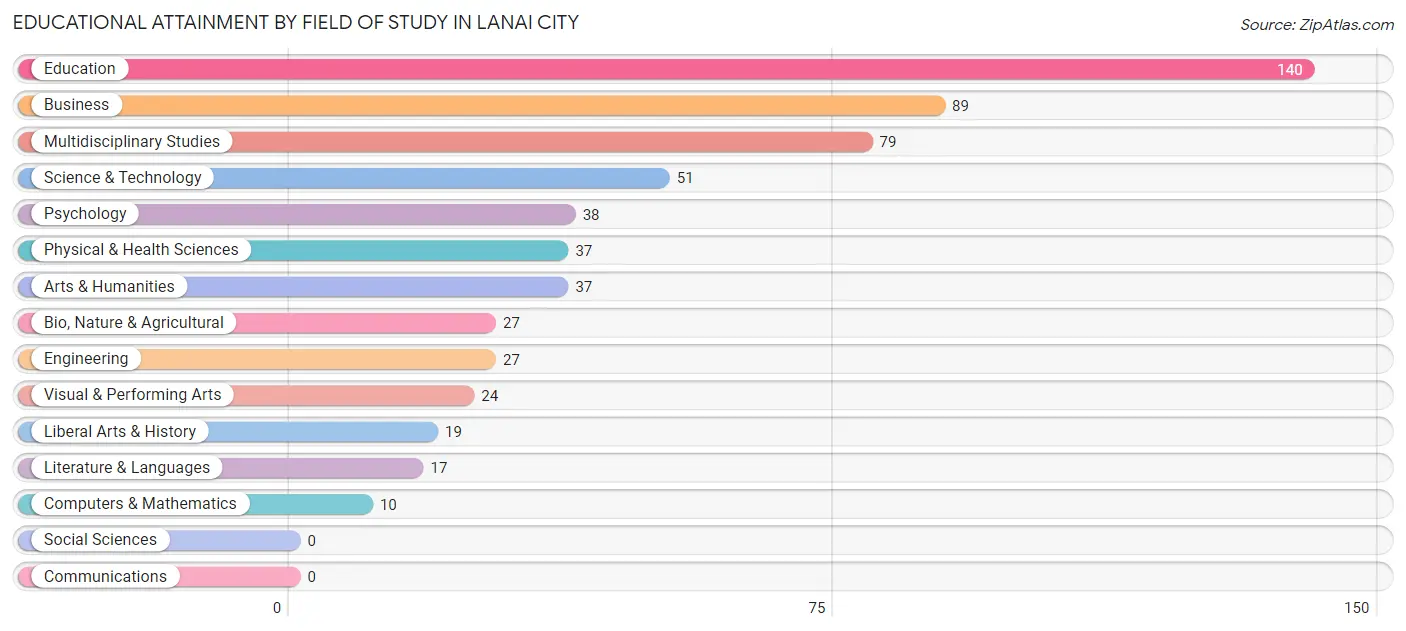
| Field of Study | # Graduates | % Graduates |
| Computers & Mathematics | 10 | 1.7% |
| Bio, Nature & Agricultural | 27 | 4.5% |
| Physical & Health Sciences | 37 | 6.2% |
| Psychology | 38 | 6.4% |
| Social Sciences | 0 | 0.0% |
| Engineering | 27 | 4.5% |
| Multidisciplinary Studies | 79 | 13.3% |
| Science & Technology | 51 | 8.6% |
| Business | 89 | 15.0% |
| Education | 140 | 23.5% |
| Literature & Languages | 17 | 2.9% |
| Liberal Arts & History | 19 | 3.2% |
| Visual & Performing Arts | 24 | 4.0% |
| Communications | 0 | 0.0% |
| Arts & Humanities | 37 | 6.2% |
| Total | 595 | 100.0% |
Transportation & Commute in Lanai City
Vehicle Availability by Sex in Lanai City
The most prevalent vehicle ownership categories in Lanai City are males with 2 vehicles (388, accounting for 37.2%) and females with 2 vehicles (295, making up 60.3%).
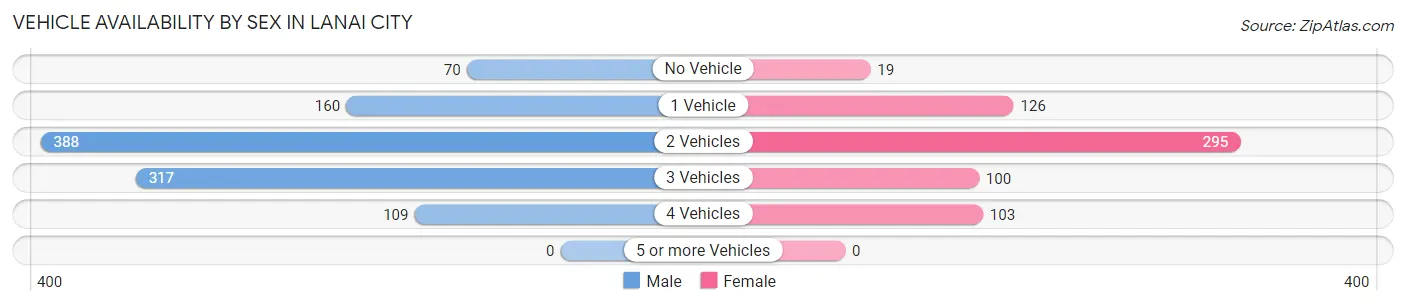
| Vehicles Available | Male | Female |
| No Vehicle | 70 (6.7%) | 19 (2.9%) |
| 1 Vehicle | 160 (15.3%) | 126 (19.6%) |
| 2 Vehicles | 388 (37.2%) | 295 (45.9%) |
| 3 Vehicles | 317 (30.4%) | 100 (15.5%) |
| 4 Vehicles | 109 (10.4%) | 103 (16.0%) |
| 5 or more Vehicles | 0 (0.0%) | 0 (0.0%) |
| Total | 1,044 (100.0%) | 643 (100.0%) |
Commute Time in Lanai City
The most frequently occuring commute durations in Lanai City are 10 to 14 minutes (471 commuters, 29.1%), 5 to 9 minutes (417 commuters, 25.8%), and 15 to 19 minutes (311 commuters, 19.2%).
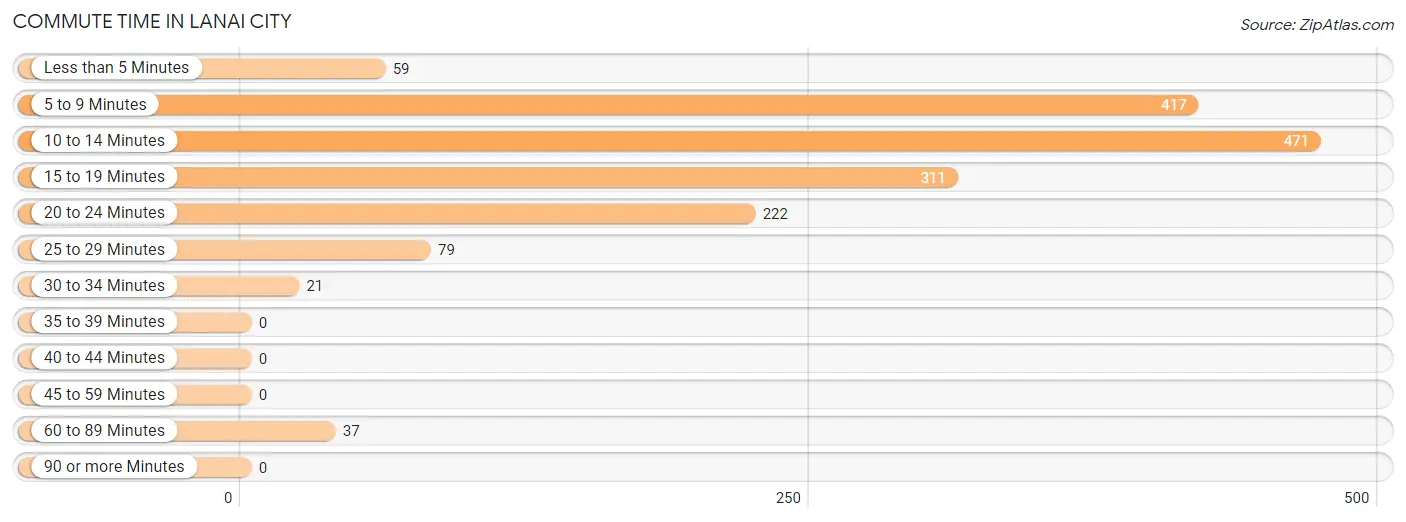
| Commute Time | # Commuters | % Commuters |
| Less than 5 Minutes | 59 | 3.6% |
| 5 to 9 Minutes | 417 | 25.8% |
| 10 to 14 Minutes | 471 | 29.1% |
| 15 to 19 Minutes | 311 | 19.2% |
| 20 to 24 Minutes | 222 | 13.7% |
| 25 to 29 Minutes | 79 | 4.9% |
| 30 to 34 Minutes | 21 | 1.3% |
| 35 to 39 Minutes | 0 | 0.0% |
| 40 to 44 Minutes | 0 | 0.0% |
| 45 to 59 Minutes | 0 | 0.0% |
| 60 to 89 Minutes | 37 | 2.3% |
| 90 or more Minutes | 0 | 0.0% |
Commute Time by Sex in Lanai City
The most common commute times in Lanai City are 10 to 14 minutes (258 commuters, 26.5%) for males and 5 to 9 minutes (216 commuters, 33.6%) for females.
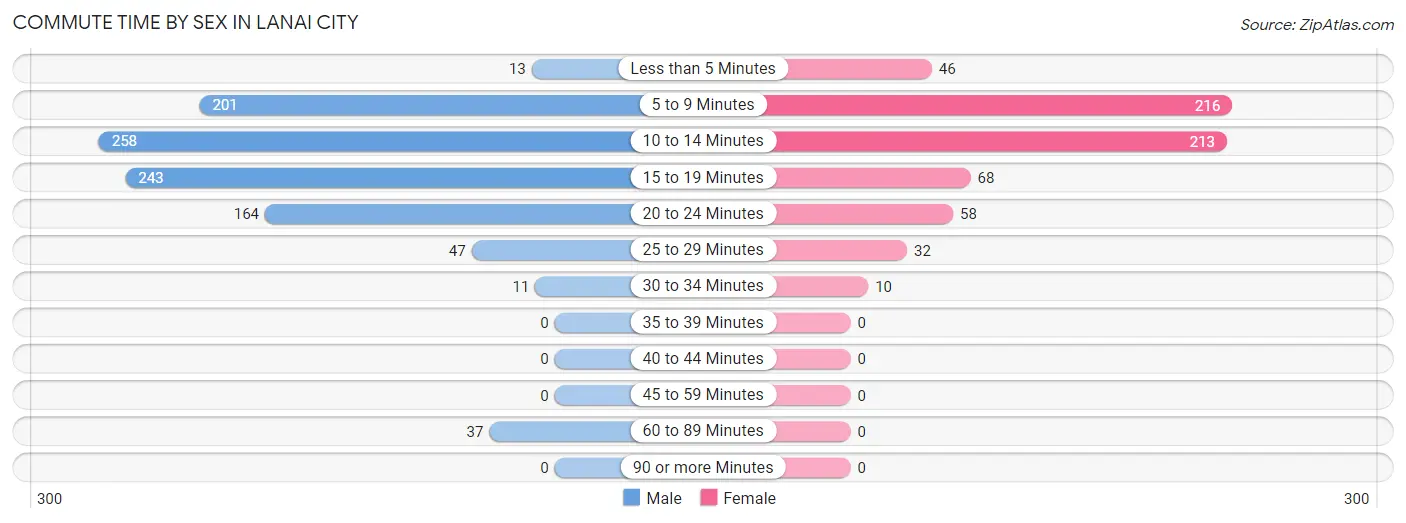
| Commute Time | Male | Female |
| Less than 5 Minutes | 13 (1.3%) | 46 (7.1%) |
| 5 to 9 Minutes | 201 (20.6%) | 216 (33.6%) |
| 10 to 14 Minutes | 258 (26.5%) | 213 (33.1%) |
| 15 to 19 Minutes | 243 (24.9%) | 68 (10.6%) |
| 20 to 24 Minutes | 164 (16.8%) | 58 (9.0%) |
| 25 to 29 Minutes | 47 (4.8%) | 32 (5.0%) |
| 30 to 34 Minutes | 11 (1.1%) | 10 (1.6%) |
| 35 to 39 Minutes | 0 (0.0%) | 0 (0.0%) |
| 40 to 44 Minutes | 0 (0.0%) | 0 (0.0%) |
| 45 to 59 Minutes | 0 (0.0%) | 0 (0.0%) |
| 60 to 89 Minutes | 37 (3.8%) | 0 (0.0%) |
| 90 or more Minutes | 0 (0.0%) | 0 (0.0%) |
Time of Departure to Work by Sex in Lanai City
The most frequent times of departure to work in Lanai City are 6:30 AM to 6:59 AM (155, 15.9%) for males and 7:30 AM to 7:59 AM (154, 23.9%) for females.
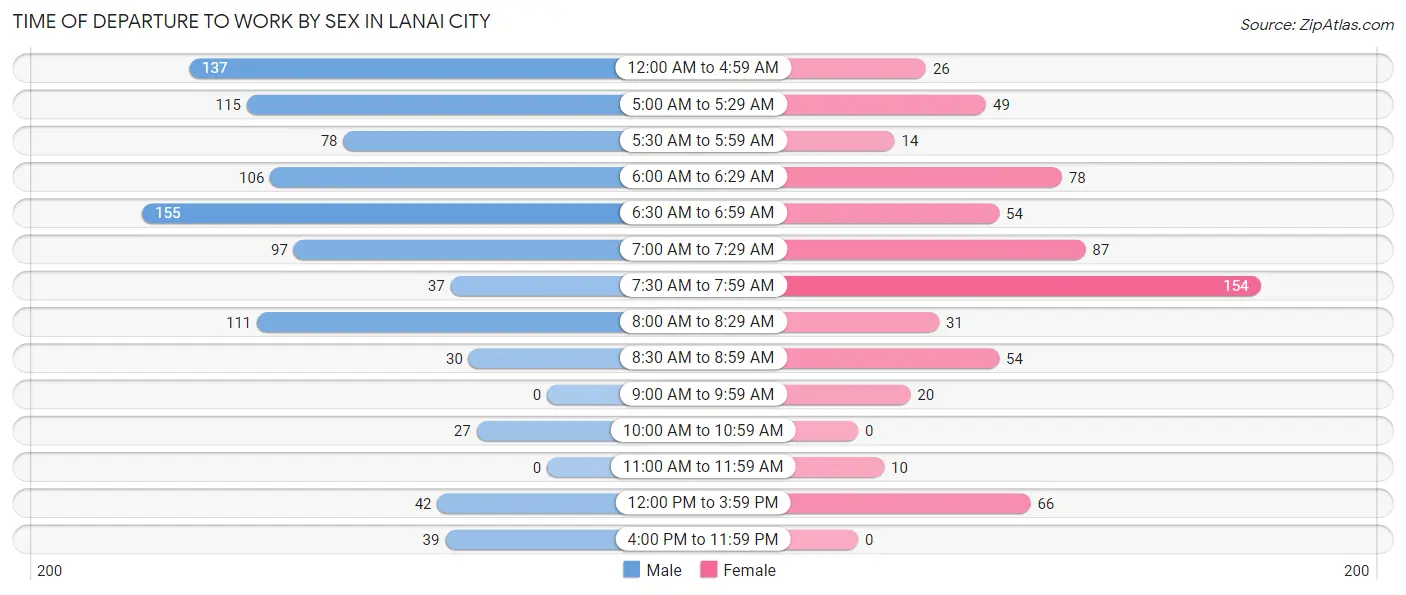
| Time of Departure | Male | Female |
| 12:00 AM to 4:59 AM | 137 (14.1%) | 26 (4.0%) |
| 5:00 AM to 5:29 AM | 115 (11.8%) | 49 (7.6%) |
| 5:30 AM to 5:59 AM | 78 (8.0%) | 14 (2.2%) |
| 6:00 AM to 6:29 AM | 106 (10.9%) | 78 (12.1%) |
| 6:30 AM to 6:59 AM | 155 (15.9%) | 54 (8.4%) |
| 7:00 AM to 7:29 AM | 97 (10.0%) | 87 (13.5%) |
| 7:30 AM to 7:59 AM | 37 (3.8%) | 154 (23.9%) |
| 8:00 AM to 8:29 AM | 111 (11.4%) | 31 (4.8%) |
| 8:30 AM to 8:59 AM | 30 (3.1%) | 54 (8.4%) |
| 9:00 AM to 9:59 AM | 0 (0.0%) | 20 (3.1%) |
| 10:00 AM to 10:59 AM | 27 (2.8%) | 0 (0.0%) |
| 11:00 AM to 11:59 AM | 0 (0.0%) | 10 (1.6%) |
| 12:00 PM to 3:59 PM | 42 (4.3%) | 66 (10.3%) |
| 4:00 PM to 11:59 PM | 39 (4.0%) | 0 (0.0%) |
| Total | 974 (100.0%) | 643 (100.0%) |
Housing Occupancy in Lanai City
Occupancy by Ownership in Lanai City
Of the total 1,217 dwellings in Lanai City, owner-occupied units account for 637 (52.3%), while renter-occupied units make up 580 (47.7%).
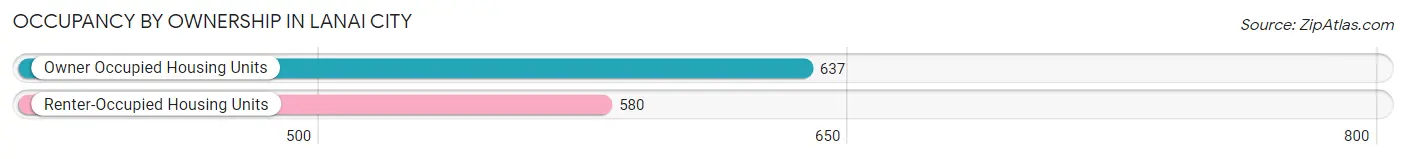
| Occupancy | # Housing Units | % Housing Units |
| Owner Occupied Housing Units | 637 | 52.3% |
| Renter-Occupied Housing Units | 580 | 47.7% |
| Total Occupied Housing Units | 1,217 | 100.0% |
Occupancy by Household Size in Lanai City
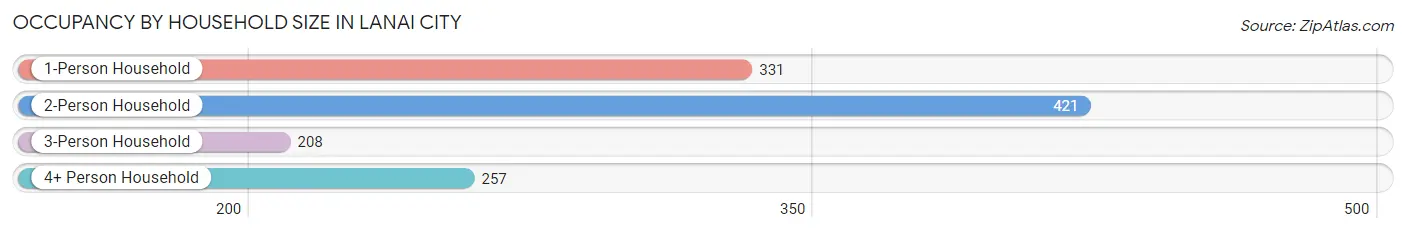
| Household Size | # Housing Units | % Housing Units |
| 1-Person Household | 331 | 27.2% |
| 2-Person Household | 421 | 34.6% |
| 3-Person Household | 208 | 17.1% |
| 4+ Person Household | 257 | 21.1% |
| Total Housing Units | 1,217 | 100.0% |
Occupancy by Ownership by Household Size in Lanai City
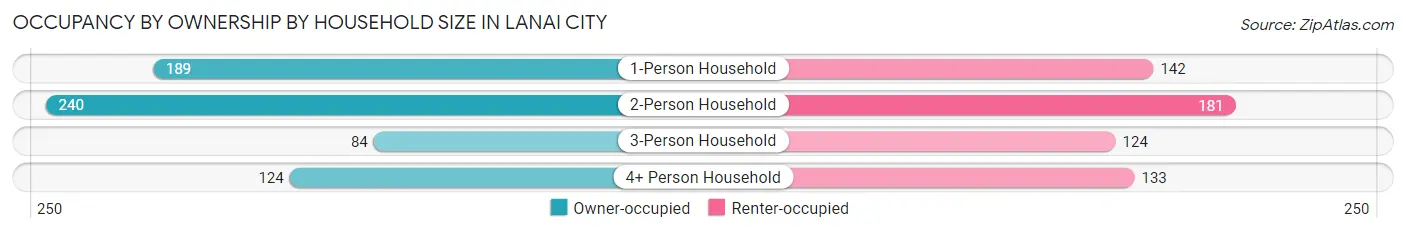
| Household Size | Owner-occupied | Renter-occupied |
| 1-Person Household | 189 (57.1%) | 142 (42.9%) |
| 2-Person Household | 240 (57.0%) | 181 (43.0%) |
| 3-Person Household | 84 (40.4%) | 124 (59.6%) |
| 4+ Person Household | 124 (48.2%) | 133 (51.7%) |
| Total Housing Units | 637 (52.3%) | 580 (47.7%) |
Occupancy by Educational Attainment in Lanai City
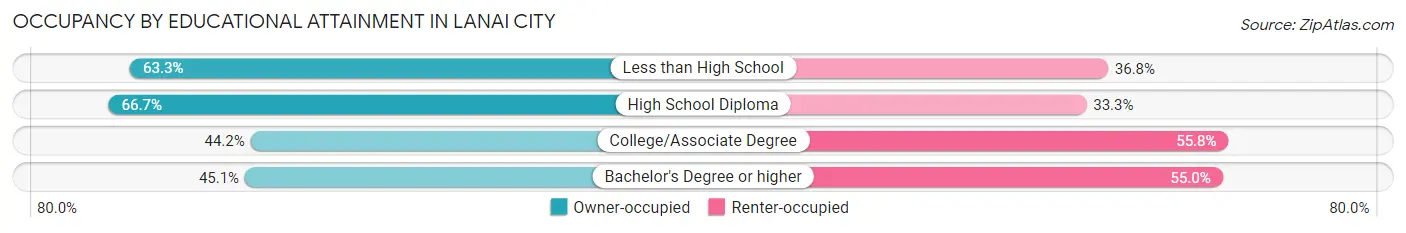
| Household Size | Owner-occupied | Renter-occupied |
| Less than High School | 74 (63.2%) | 43 (36.7%) |
| High School Diploma | 220 (66.7%) | 110 (33.3%) |
| College/Associate Degree | 193 (44.2%) | 244 (55.8%) |
| Bachelor's Degree or higher | 150 (45.1%) | 183 (54.9%) |
Occupancy by Age of Householder in Lanai City
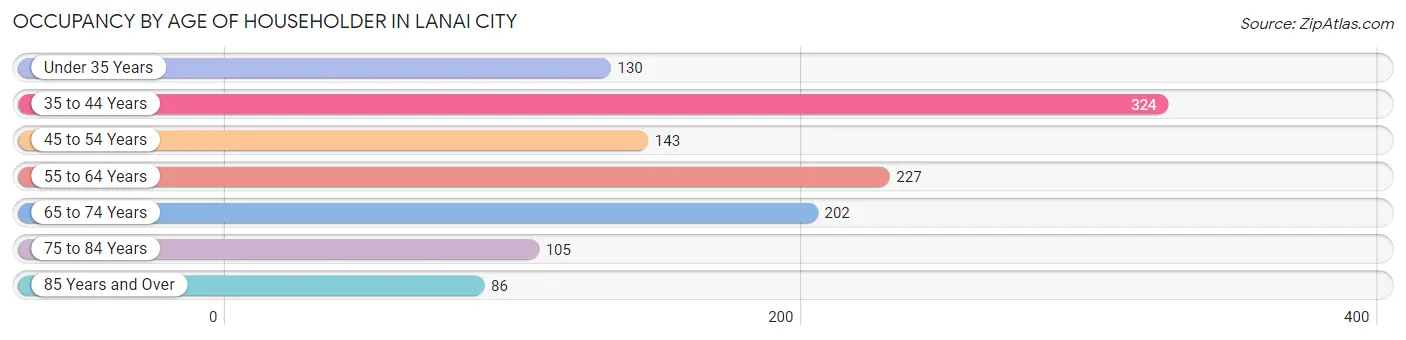
| Age Bracket | # Households | % Households |
| Under 35 Years | 130 | 10.7% |
| 35 to 44 Years | 324 | 26.6% |
| 45 to 54 Years | 143 | 11.7% |
| 55 to 64 Years | 227 | 18.6% |
| 65 to 74 Years | 202 | 16.6% |
| 75 to 84 Years | 105 | 8.6% |
| 85 Years and Over | 86 | 7.1% |
| Total | 1,217 | 100.0% |
Housing Finances in Lanai City
Median Income by Occupancy in Lanai City
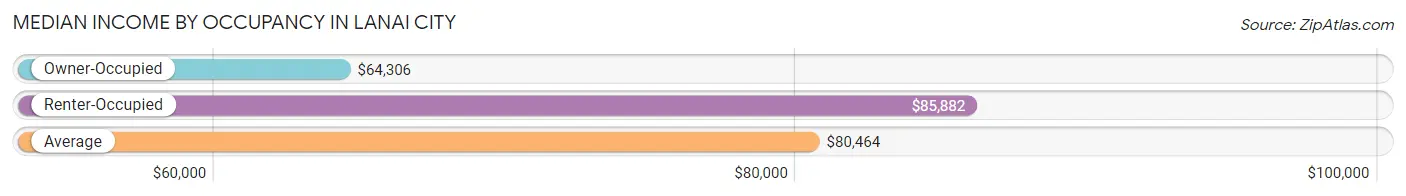
| Occupancy Type | # Households | Median Income |
| Owner-Occupied | 637 (52.3%) | $64,306 |
| Renter-Occupied | 580 (47.7%) | $85,882 |
| Average | 1,217 (100.0%) | $80,464 |
Occupancy by Householder Income Bracket in Lanai City
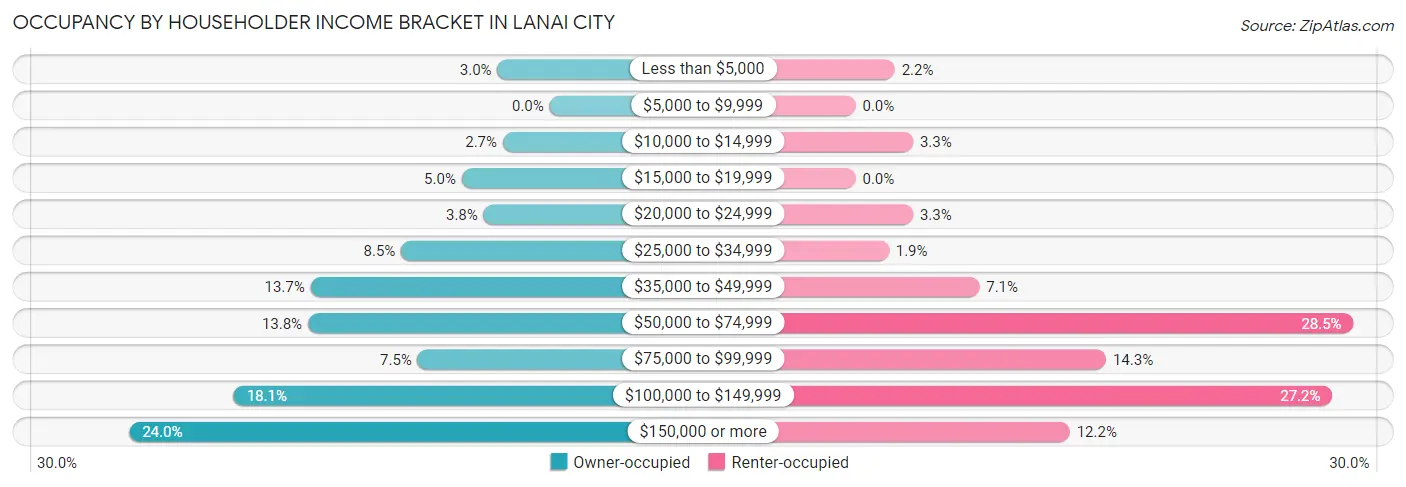
| Income Bracket | Owner-occupied | Renter-occupied |
| Less than $5,000 | 19 (3.0%) | 13 (2.2%) |
| $5,000 to $9,999 | 0 (0.0%) | 0 (0.0%) |
| $10,000 to $14,999 | 17 (2.7%) | 19 (3.3%) |
| $15,000 to $19,999 | 32 (5.0%) | 0 (0.0%) |
| $20,000 to $24,999 | 24 (3.8%) | 19 (3.3%) |
| $25,000 to $34,999 | 54 (8.5%) | 11 (1.9%) |
| $35,000 to $49,999 | 87 (13.7%) | 41 (7.1%) |
| $50,000 to $74,999 | 88 (13.8%) | 165 (28.4%) |
| $75,000 to $99,999 | 48 (7.5%) | 83 (14.3%) |
| $100,000 to $149,999 | 115 (18.0%) | 158 (27.2%) |
| $150,000 or more | 153 (24.0%) | 71 (12.2%) |
| Total | 637 (100.0%) | 580 (100.0%) |
Monthly Housing Cost Tiers in Lanai City
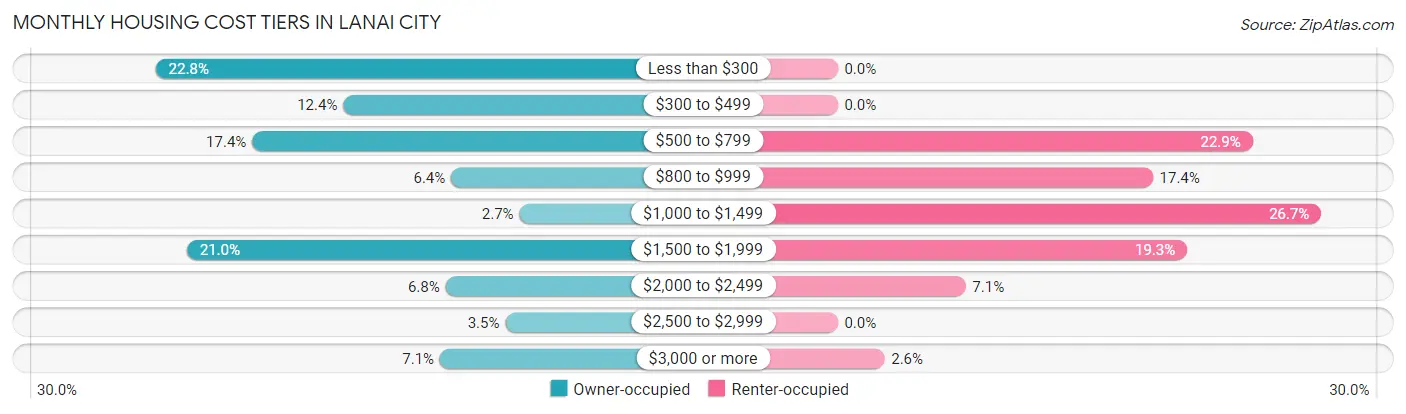
| Monthly Cost | Owner-occupied | Renter-occupied |
| Less than $300 | 145 (22.8%) | 0 (0.0%) |
| $300 to $499 | 79 (12.4%) | 0 (0.0%) |
| $500 to $799 | 111 (17.4%) | 133 (22.9%) |
| $800 to $999 | 41 (6.4%) | 101 (17.4%) |
| $1,000 to $1,499 | 17 (2.7%) | 155 (26.7%) |
| $1,500 to $1,999 | 134 (21.0%) | 112 (19.3%) |
| $2,000 to $2,499 | 43 (6.8%) | 41 (7.1%) |
| $2,500 to $2,999 | 22 (3.5%) | 0 (0.0%) |
| $3,000 or more | 45 (7.1%) | 15 (2.6%) |
| Total | 637 (100.0%) | 580 (100.0%) |
Physical Housing Characteristics in Lanai City
Housing Structures in Lanai City
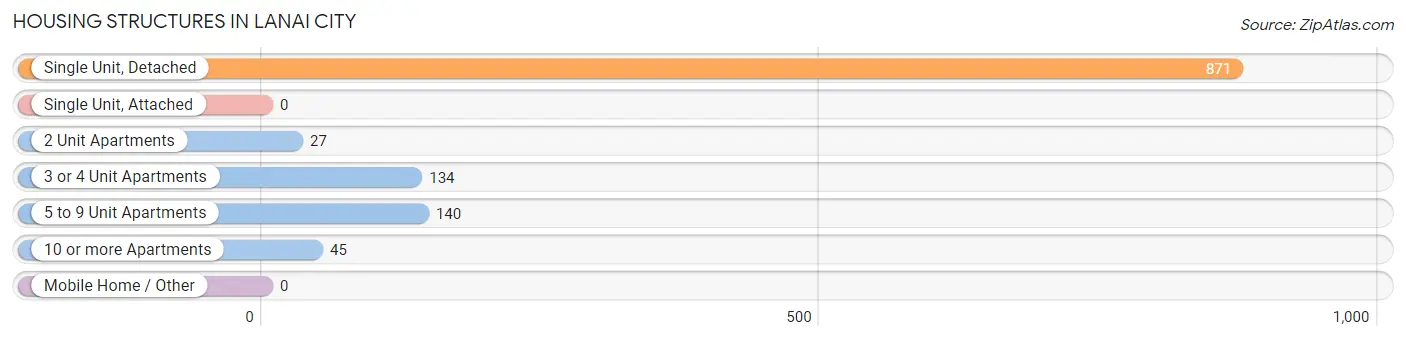
| Structure Type | # Housing Units | % Housing Units |
| Single Unit, Detached | 871 | 71.6% |
| Single Unit, Attached | 0 | 0.0% |
| 2 Unit Apartments | 27 | 2.2% |
| 3 or 4 Unit Apartments | 134 | 11.0% |
| 5 to 9 Unit Apartments | 140 | 11.5% |
| 10 or more Apartments | 45 | 3.7% |
| Mobile Home / Other | 0 | 0.0% |
| Total | 1,217 | 100.0% |
Housing Structures by Occupancy in Lanai City
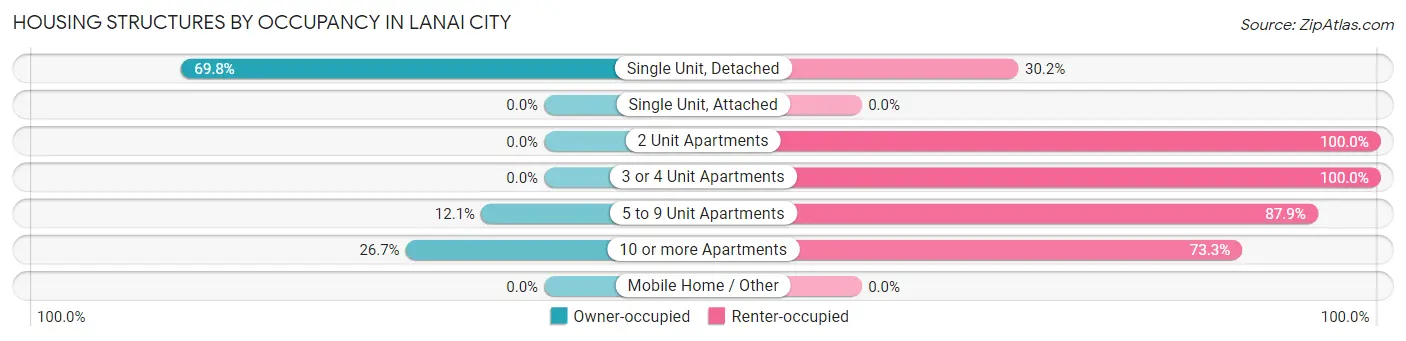
| Structure Type | Owner-occupied | Renter-occupied |
| Single Unit, Detached | 608 (69.8%) | 263 (30.2%) |
| Single Unit, Attached | 0 (0.0%) | 0 (0.0%) |
| 2 Unit Apartments | 0 (0.0%) | 27 (100.0%) |
| 3 or 4 Unit Apartments | 0 (0.0%) | 134 (100.0%) |
| 5 to 9 Unit Apartments | 17 (12.1%) | 123 (87.9%) |
| 10 or more Apartments | 12 (26.7%) | 33 (73.3%) |
| Mobile Home / Other | 0 (0.0%) | 0 (0.0%) |
| Total | 637 (52.3%) | 580 (47.7%) |
Housing Structures by Number of Rooms in Lanai City
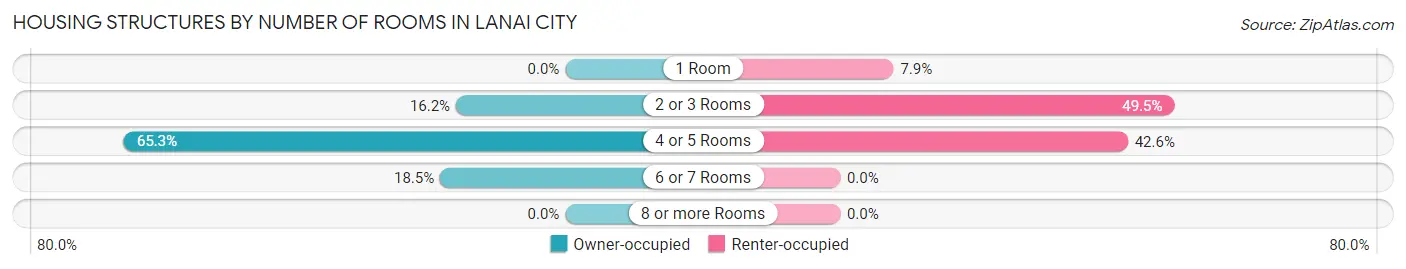
| Number of Rooms | Owner-occupied | Renter-occupied |
| 1 Room | 0 (0.0%) | 46 (7.9%) |
| 2 or 3 Rooms | 103 (16.2%) | 287 (49.5%) |
| 4 or 5 Rooms | 416 (65.3%) | 247 (42.6%) |
| 6 or 7 Rooms | 118 (18.5%) | 0 (0.0%) |
| 8 or more Rooms | 0 (0.0%) | 0 (0.0%) |
| Total | 637 (100.0%) | 580 (100.0%) |
Housing Structure by Heating Type in Lanai City
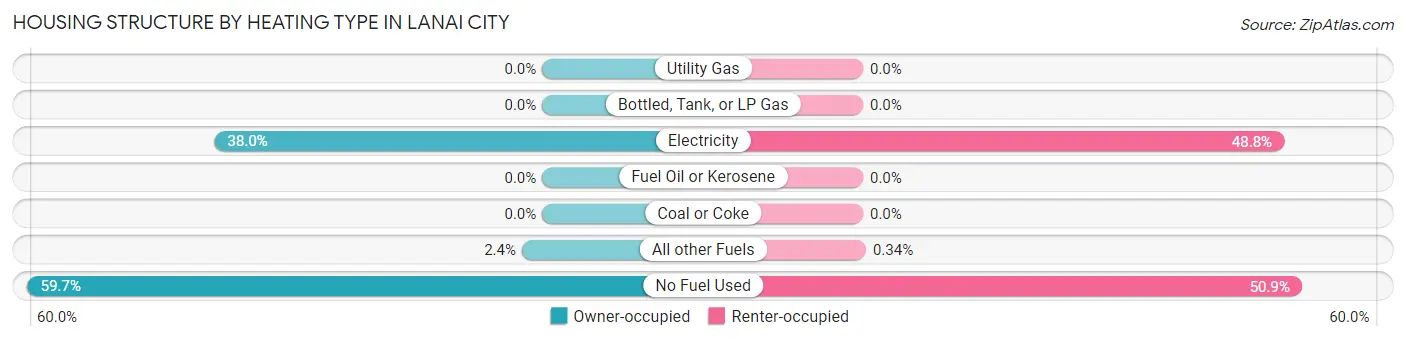
| Heating Type | Owner-occupied | Renter-occupied |
| Utility Gas | 0 (0.0%) | 0 (0.0%) |
| Bottled, Tank, or LP Gas | 0 (0.0%) | 0 (0.0%) |
| Electricity | 242 (38.0%) | 283 (48.8%) |
| Fuel Oil or Kerosene | 0 (0.0%) | 0 (0.0%) |
| Coal or Coke | 0 (0.0%) | 0 (0.0%) |
| All other Fuels | 15 (2.4%) | 2 (0.3%) |
| No Fuel Used | 380 (59.7%) | 295 (50.9%) |
| Total | 637 (100.0%) | 580 (100.0%) |
Household Vehicle Usage in Lanai City
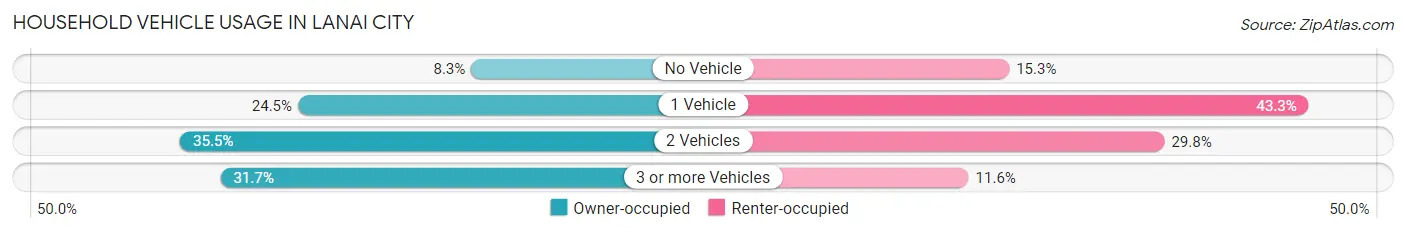
| Vehicles per Household | Owner-occupied | Renter-occupied |
| No Vehicle | 53 (8.3%) | 89 (15.3%) |
| 1 Vehicle | 156 (24.5%) | 251 (43.3%) |
| 2 Vehicles | 226 (35.5%) | 173 (29.8%) |
| 3 or more Vehicles | 202 (31.7%) | 67 (11.6%) |
| Total | 637 (100.0%) | 580 (100.0%) |
Real Estate & Mortgages in Lanai City
Real Estate and Mortgage Overview in Lanai City
| Characteristic | Without Mortgage | With Mortgage |
| Housing Units | 357 | 280 |
| Median Property Value | $476,800 | $482,400 |
| Median Household Income | $55,417 | $112 |
| Monthly Housing Costs | $344 | $45 |
| Real Estate Taxes | $748 | $4 |
Property Value by Mortgage Status in Lanai City
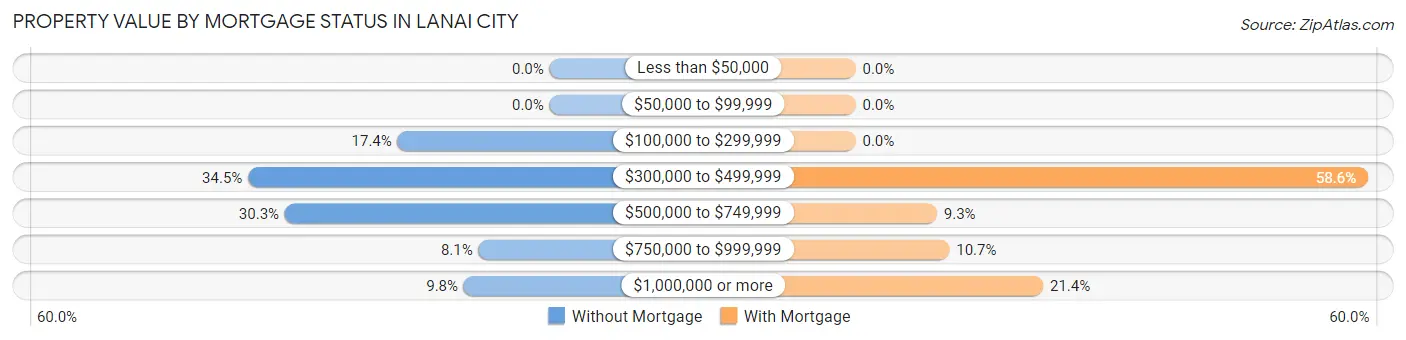
| Property Value | Without Mortgage | With Mortgage |
| Less than $50,000 | 0 (0.0%) | 0 (0.0%) |
| $50,000 to $99,999 | 0 (0.0%) | 0 (0.0%) |
| $100,000 to $299,999 | 62 (17.4%) | 0 (0.0%) |
| $300,000 to $499,999 | 123 (34.4%) | 164 (58.6%) |
| $500,000 to $749,999 | 108 (30.2%) | 26 (9.3%) |
| $750,000 to $999,999 | 29 (8.1%) | 30 (10.7%) |
| $1,000,000 or more | 35 (9.8%) | 60 (21.4%) |
| Total | 357 (100.0%) | 280 (100.0%) |
Household Income by Mortgage Status in Lanai City
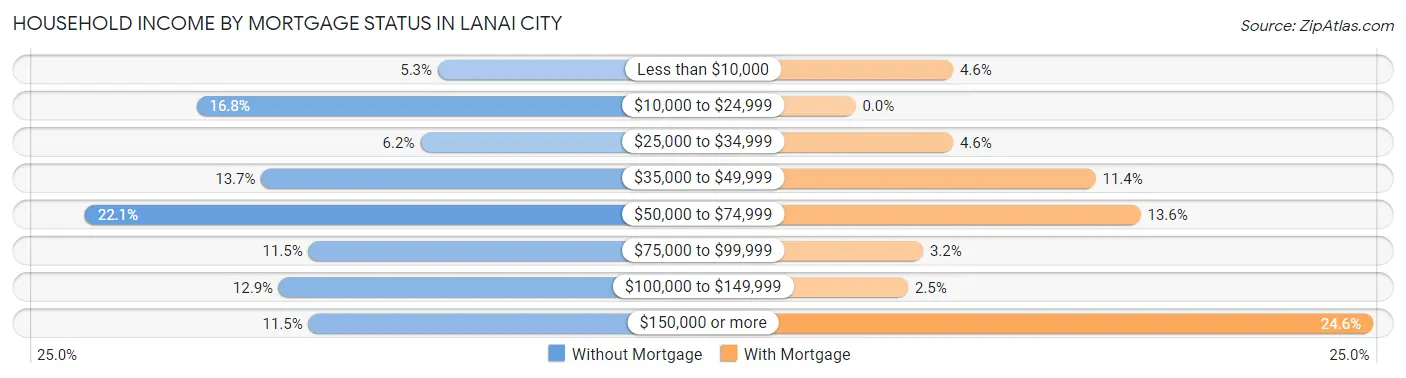
| Household Income | Without Mortgage | With Mortgage |
| Less than $10,000 | 19 (5.3%) | 13 (4.6%) |
| $10,000 to $24,999 | 60 (16.8%) | 0 (0.0%) |
| $25,000 to $34,999 | 22 (6.2%) | 13 (4.6%) |
| $35,000 to $49,999 | 49 (13.7%) | 32 (11.4%) |
| $50,000 to $74,999 | 79 (22.1%) | 38 (13.6%) |
| $75,000 to $99,999 | 41 (11.5%) | 9 (3.2%) |
| $100,000 to $149,999 | 46 (12.9%) | 7 (2.5%) |
| $150,000 or more | 41 (11.5%) | 69 (24.6%) |
| Total | 357 (100.0%) | 280 (100.0%) |
Property Value to Household Income Ratio in Lanai City
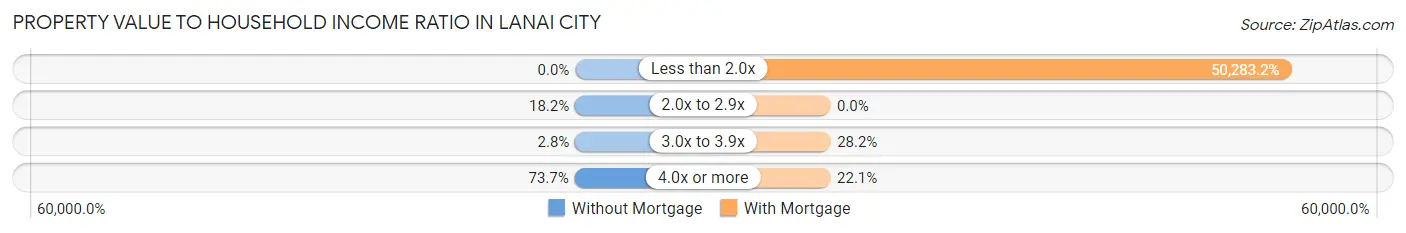
| Value-to-Income Ratio | Without Mortgage | With Mortgage |
| Less than 2.0x | 0 (0.0%) | 140,793 (50,283.2%) |
| 2.0x to 2.9x | 65 (18.2%) | 0 (0.0%) |
| 3.0x to 3.9x | 10 (2.8%) | 79 (28.2%) |
| 4.0x or more | 263 (73.7%) | 62 (22.1%) |
| Total | 357 (100.0%) | 280 (100.0%) |
Real Estate Taxes by Mortgage Status in Lanai City
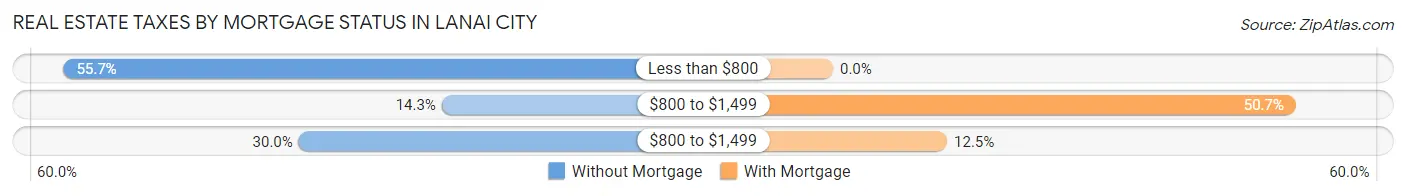
| Property Taxes | Without Mortgage | With Mortgage |
| Less than $800 | 199 (55.7%) | 0 (0.0%) |
| $800 to $1,499 | 51 (14.3%) | 142 (50.7%) |
| $800 to $1,499 | 107 (30.0%) | 35 (12.5%) |
| Total | 357 (100.0%) | 280 (100.0%) |
Health & Disability in Lanai City
Health Insurance Coverage by Age in Lanai City
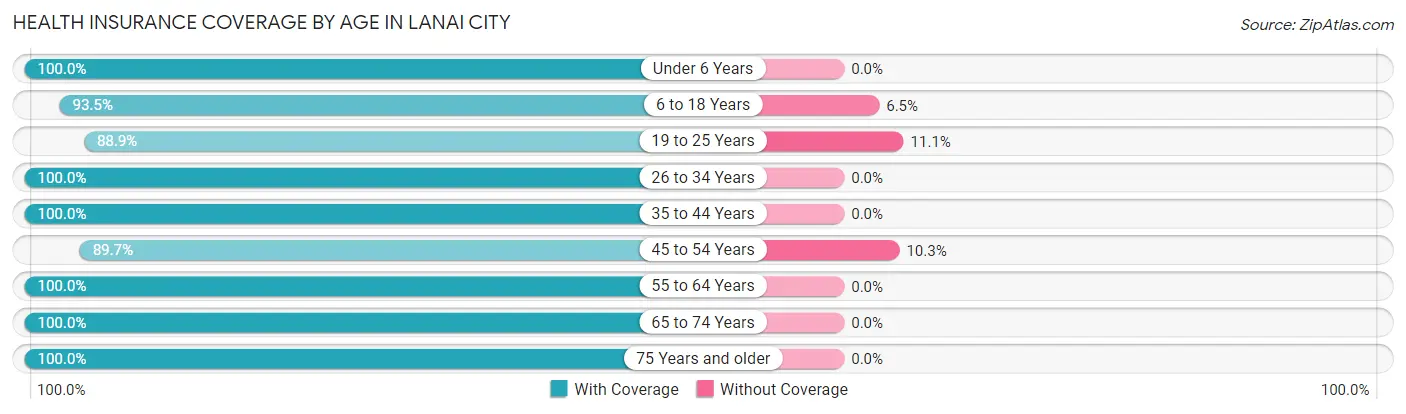
| Age Bracket | With Coverage | Without Coverage |
| Under 6 Years | 130 (100.0%) | 0 (0.0%) |
| 6 to 18 Years | 502 (93.5%) | 35 (6.5%) |
| 19 to 25 Years | 217 (88.9%) | 27 (11.1%) |
| 26 to 34 Years | 309 (100.0%) | 0 (0.0%) |
| 35 to 44 Years | 495 (100.0%) | 0 (0.0%) |
| 45 to 54 Years | 279 (89.7%) | 32 (10.3%) |
| 55 to 64 Years | 506 (100.0%) | 0 (0.0%) |
| 65 to 74 Years | 318 (100.0%) | 0 (0.0%) |
| 75 Years and older | 311 (100.0%) | 0 (0.0%) |
| Total | 3,067 (97.0%) | 94 (3.0%) |
Health Insurance Coverage by Citizenship Status in Lanai City
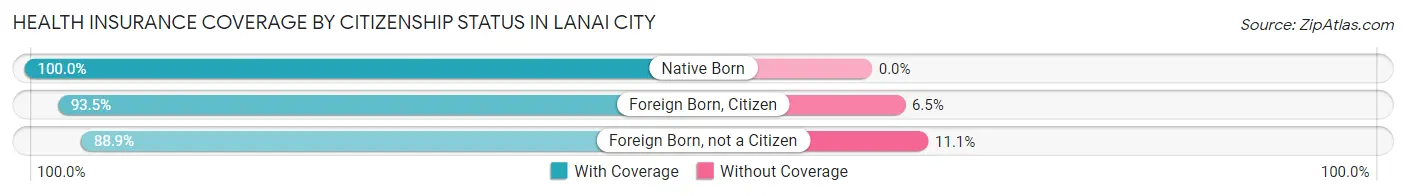
| Citizenship Status | With Coverage | Without Coverage |
| Native Born | 130 (100.0%) | 0 (0.0%) |
| Foreign Born, Citizen | 502 (93.5%) | 35 (6.5%) |
| Foreign Born, not a Citizen | 217 (88.9%) | 27 (11.1%) |
Health Insurance Coverage by Household Income in Lanai City
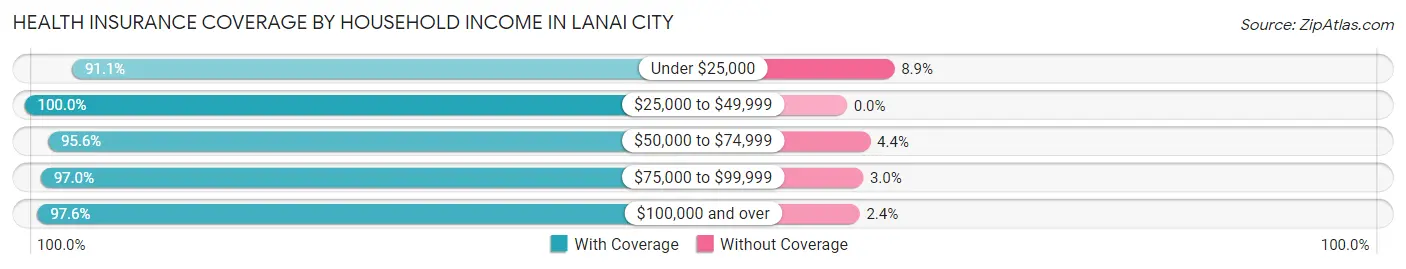
| Household Income | With Coverage | Without Coverage |
| Under $25,000 | 195 (91.1%) | 19 (8.9%) |
| $25,000 to $49,999 | 247 (100.0%) | 0 (0.0%) |
| $50,000 to $74,999 | 415 (95.6%) | 19 (4.4%) |
| $75,000 to $99,999 | 416 (97.0%) | 13 (3.0%) |
| $100,000 and over | 1,775 (97.6%) | 43 (2.4%) |
Public vs Private Health Insurance Coverage by Age in Lanai City
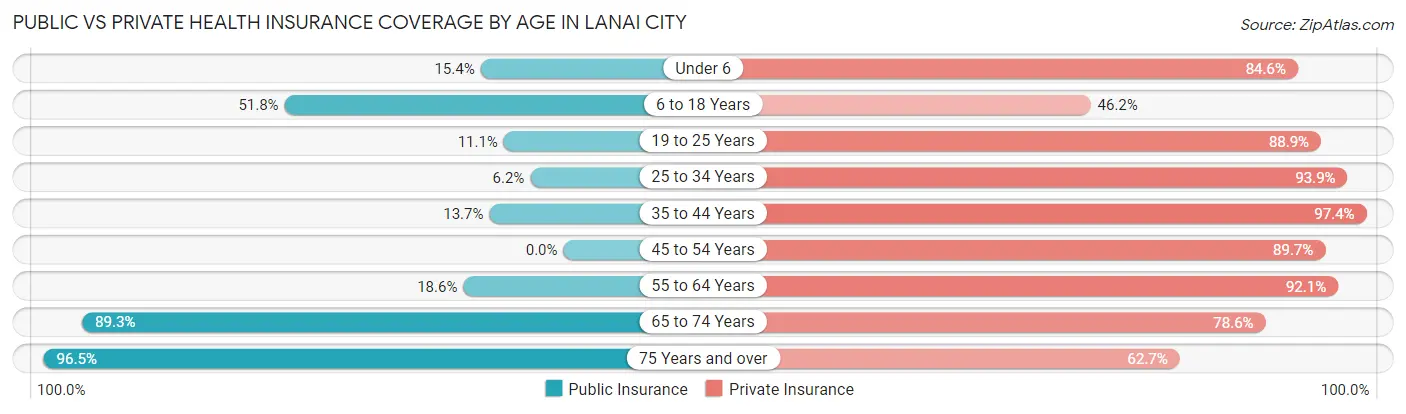
| Age Bracket | Public Insurance | Private Insurance |
| Under 6 | 20 (15.4%) | 110 (84.6%) |
| 6 to 18 Years | 278 (51.8%) | 248 (46.2%) |
| 19 to 25 Years | 27 (11.1%) | 217 (88.9%) |
| 25 to 34 Years | 19 (6.1%) | 290 (93.9%) |
| 35 to 44 Years | 68 (13.7%) | 482 (97.4%) |
| 45 to 54 Years | 0 (0.0%) | 279 (89.7%) |
| 55 to 64 Years | 94 (18.6%) | 466 (92.1%) |
| 65 to 74 Years | 284 (89.3%) | 250 (78.6%) |
| 75 Years and over | 300 (96.5%) | 195 (62.7%) |
| Total | 1,090 (34.5%) | 2,537 (80.3%) |
Disability Status by Sex by Age in Lanai City
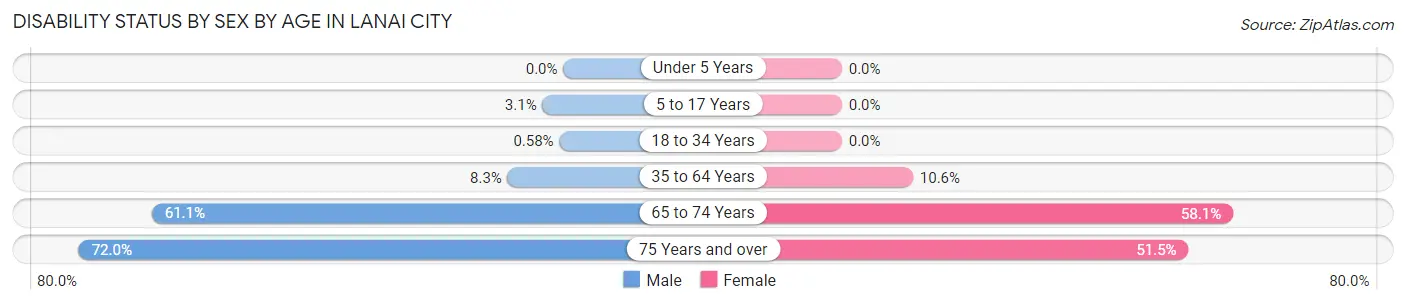
| Age Bracket | Male | Female |
| Under 5 Years | 0 (0.0%) | 0 (0.0%) |
| 5 to 17 Years | 12 (3.1%) | 0 (0.0%) |
| 18 to 34 Years | 2 (0.6%) | 0 (0.0%) |
| 35 to 64 Years | 63 (8.3%) | 58 (10.5%) |
| 65 to 74 Years | 66 (61.1%) | 122 (58.1%) |
| 75 Years and over | 77 (72.0%) | 105 (51.5%) |
Disability Class by Sex by Age in Lanai City
Disability Class: Hearing Difficulty
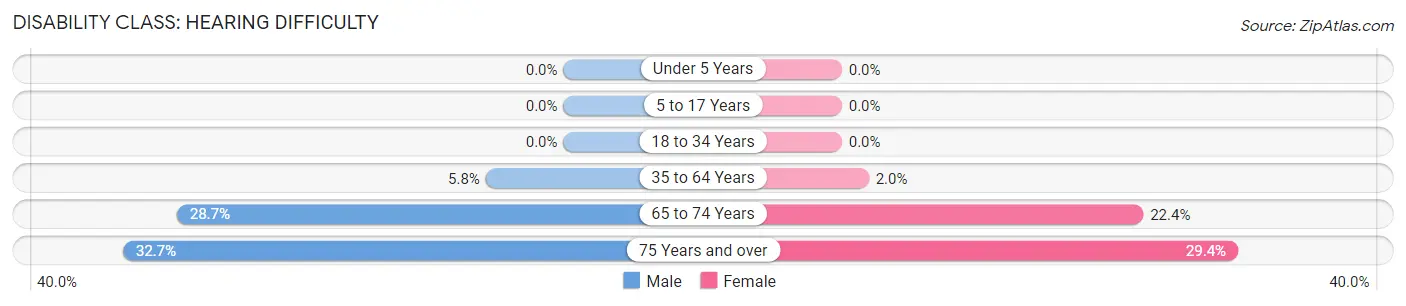
| Age Bracket | Male | Female |
| Under 5 Years | 0 (0.0%) | 0 (0.0%) |
| 5 to 17 Years | 0 (0.0%) | 0 (0.0%) |
| 18 to 34 Years | 0 (0.0%) | 0 (0.0%) |
| 35 to 64 Years | 44 (5.8%) | 11 (2.0%) |
| 65 to 74 Years | 31 (28.7%) | 47 (22.4%) |
| 75 Years and over | 35 (32.7%) | 60 (29.4%) |
Disability Class: Vision Difficulty
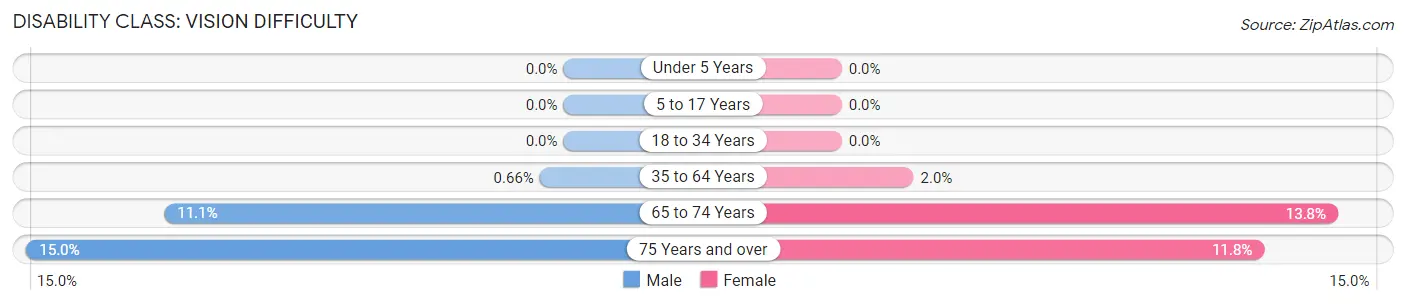
| Age Bracket | Male | Female |
| Under 5 Years | 0 (0.0%) | 0 (0.0%) |
| 5 to 17 Years | 0 (0.0%) | 0 (0.0%) |
| 18 to 34 Years | 0 (0.0%) | 0 (0.0%) |
| 35 to 64 Years | 5 (0.7%) | 11 (2.0%) |
| 65 to 74 Years | 12 (11.1%) | 29 (13.8%) |
| 75 Years and over | 16 (14.9%) | 24 (11.8%) |
Disability Class: Cognitive Difficulty
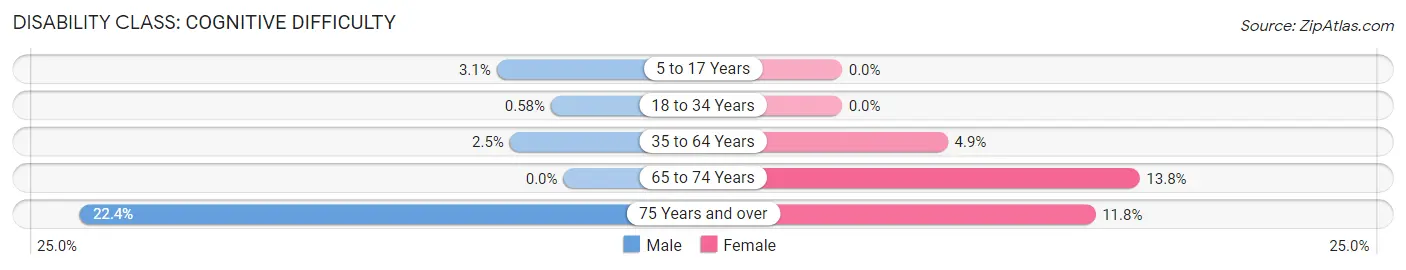
| Age Bracket | Male | Female |
| 5 to 17 Years | 12 (3.1%) | 0 (0.0%) |
| 18 to 34 Years | 2 (0.6%) | 0 (0.0%) |
| 35 to 64 Years | 19 (2.5%) | 27 (4.9%) |
| 65 to 74 Years | 0 (0.0%) | 29 (13.8%) |
| 75 Years and over | 24 (22.4%) | 24 (11.8%) |
Disability Class: Ambulatory Difficulty
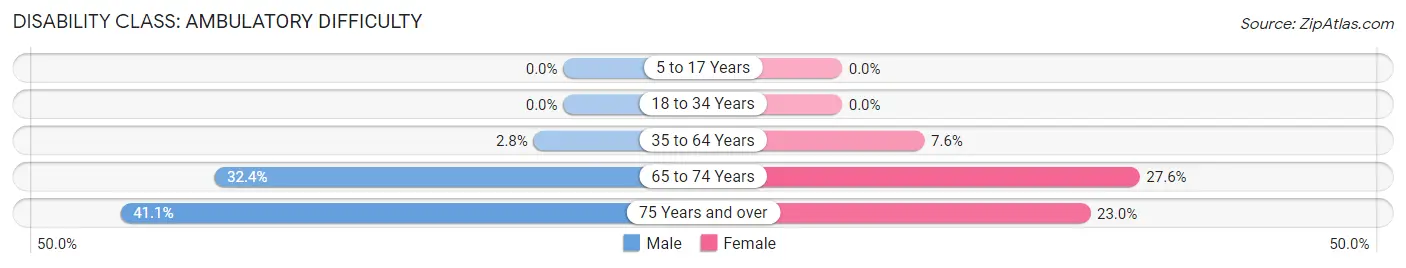
| Age Bracket | Male | Female |
| 5 to 17 Years | 0 (0.0%) | 0 (0.0%) |
| 18 to 34 Years | 0 (0.0%) | 0 (0.0%) |
| 35 to 64 Years | 21 (2.8%) | 42 (7.6%) |
| 65 to 74 Years | 35 (32.4%) | 58 (27.6%) |
| 75 Years and over | 44 (41.1%) | 47 (23.0%) |
Disability Class: Self-Care Difficulty
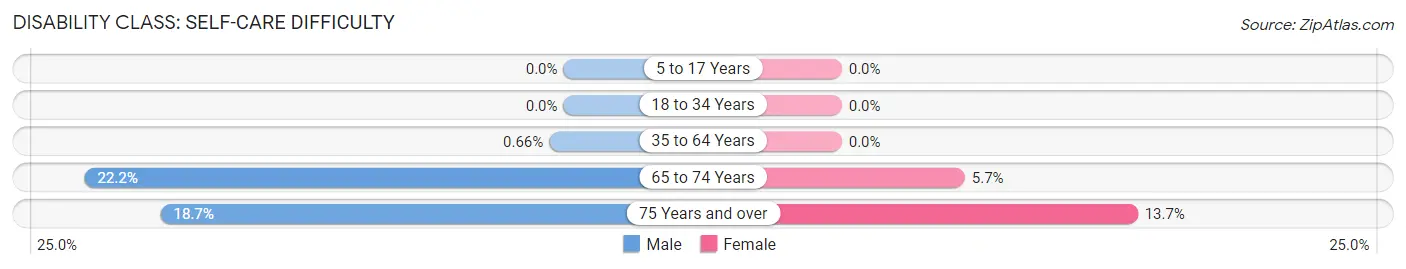
| Age Bracket | Male | Female |
| 5 to 17 Years | 0 (0.0%) | 0 (0.0%) |
| 18 to 34 Years | 0 (0.0%) | 0 (0.0%) |
| 35 to 64 Years | 5 (0.7%) | 0 (0.0%) |
| 65 to 74 Years | 24 (22.2%) | 12 (5.7%) |
| 75 Years and over | 20 (18.7%) | 28 (13.7%) |
Technology Access in Lanai City
Computing Device Access in Lanai City
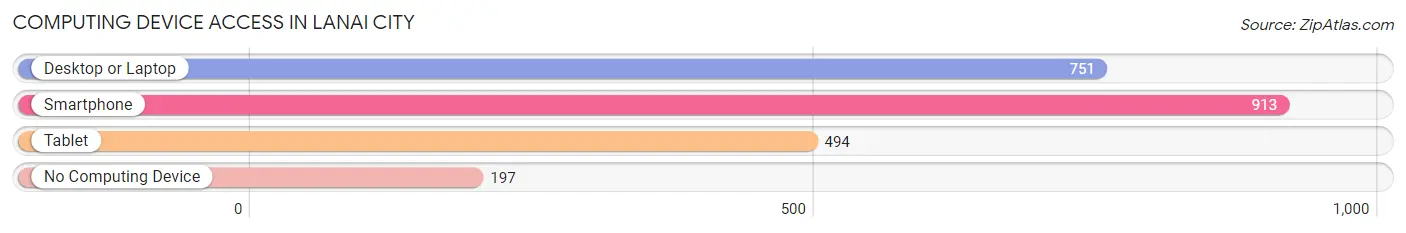
| Device Type | # Households | % Households |
| Desktop or Laptop | 751 | 61.7% |
| Smartphone | 913 | 75.0% |
| Tablet | 494 | 40.6% |
| No Computing Device | 197 | 16.2% |
| Total | 1,217 | 100.0% |
Internet Access in Lanai City
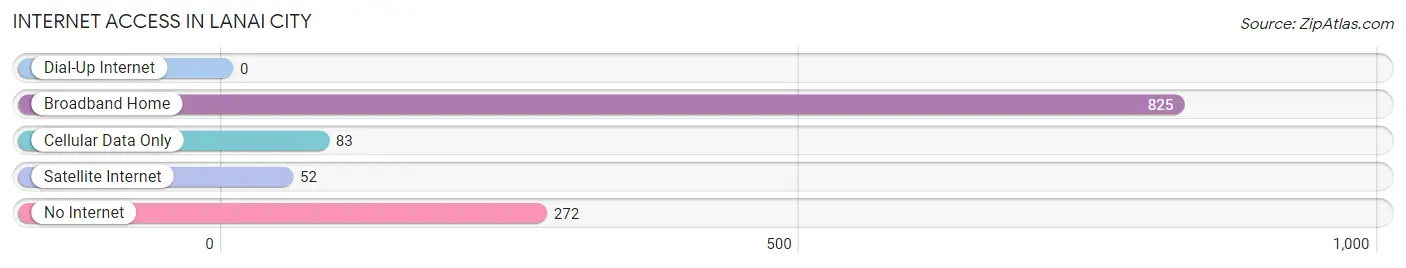
| Internet Type | # Households | % Households |
| Dial-Up Internet | 0 | 0.0% |
| Broadband Home | 825 | 67.8% |
| Cellular Data Only | 83 | 6.8% |
| Satellite Internet | 52 | 4.3% |
| No Internet | 272 | 22.4% |
| Total | 1,217 | 100.0% |
Lanai City Summary
Lanai City is a small town located on the Hawaiian island of Lanai. It is the only town on the island and is home to about 3,000 people. The town is located in the center of the island and is surrounded by lush green hills and valleys. It is a popular tourist destination due to its unique culture and natural beauty.
History
Lanai City was founded in 1922 by James Dole, the founder of the Dole Pineapple Company. He purchased the entire island of Lanai and built the town to serve as a center for his pineapple plantation. The town was originally called Dole Town, but was later changed to Lanai City.
The town grew rapidly in the 1920s and 1930s, and by the 1940s it had become the largest town on the island. During World War II, the town was used as a base for the US Navy. After the war, the pineapple industry declined and the town’s population decreased.
In the late 1980s, the island was purchased by billionaire David Murdock, who invested heavily in the town. He built a new hotel, golf course, and other amenities, and the town’s population began to grow again.
Geography
Lanai City is located in the center of the island of Lanai. It is surrounded by lush green hills and valleys, and is located near the coast. The town is located at an elevation of 1,600 feet, and the climate is tropical and humid.
The town is located near several beaches, including Hulopoe Beach, Manele Bay, and Kaiolohia Beach. There are also several hiking trails in the area, including the Munro Trail and the Lanai Cathedrals Trail.
Economy
The economy of Lanai City is largely based on tourism. The town is home to several resorts, including the Four Seasons Resort Lanai and the Manele Bay Hotel. The town also has several restaurants, shops, and other businesses.
The town is also home to the Lanai Culture and Heritage Center, which is dedicated to preserving the island’s culture and history. The center offers educational programs and cultural events.
Demographics
As of the 2010 census, the population of Lanai City was 3,102. The population is mostly Native Hawaiian, with a small percentage of other ethnicities. The median age is 44.7 years, and the median household income is $63,944.
The town is served by the Lanai Airport, which offers flights to Honolulu and other Hawaiian islands. The town is also served by the Lanai Ferry, which offers ferry service to Maui and Molokai.
Conclusion
Lanai City is a small town located on the Hawaiian island of Lanai. It is the only town on the island and is home to about 3,000 people. The town is surrounded by lush green hills and valleys, and is a popular tourist destination due to its unique culture and natural beauty. The economy of Lanai City is largely based on tourism, and the population is mostly Native Hawaiian. The town is served by the Lanai Airport and the Lanai Ferry, and is home to several resorts, restaurants, shops, and other businesses.
Common Questions
What is Per Capita Income in Lanai City?
Per Capita income in Lanai City is $38,483.
What is the Median Family Income in Lanai City?
Median Family Income in Lanai City is $108,250.
What is the Median Household income in Lanai City?
Median Household Income in Lanai City is $80,464.
What is Income or Wage Gap in Lanai City?
Income or Wage Gap in Lanai City is 12.3%.
Women in Lanai City earn 87.7 cents for every dollar earned by a man.
What is Inequality or Gini Index in Lanai City?
Inequality or Gini Index in Lanai City is 0.38.
What is the Total Population of Lanai City?
Total Population of Lanai City is 3,174.
What is the Total Male Population of Lanai City?
Total Male Population of Lanai City is 1,769.
What is the Total Female Population of Lanai City?
Total Female Population of Lanai City is 1,405.
What is the Ratio of Males per 100 Females in Lanai City?
There are 125.91 Males per 100 Females in Lanai City.
What is the Ratio of Females per 100 Males in Lanai City?
There are 79.42 Females per 100 Males in Lanai City.
What is the Median Population Age in Lanai City?
Median Population Age in Lanai City is 41.9 Years.
What is the Average Family Size in Lanai City
Average Family Size in Lanai City is 3.0 People.
What is the Average Household Size in Lanai City
Average Household Size in Lanai City is 2.6 People.
How Large is the Labor Force in Lanai City?
There are 1,733 People in the Labor Forcein in Lanai City.
What is the Percentage of People in the Labor Force in Lanai City?
66.1% of People are in the Labor Force in Lanai City.
What is the Unemployment Rate in Lanai City?
Unemployment Rate in Lanai City is 2.4%.