Lamar, TX Map & Demographics
Lamar Map
Lamar Overview
$31,613
PER CAPITA INCOME
$60,245
AVG HOUSEHOLD INCOME
0.39
INEQUALITY / GINI INDEX
1,559
TOTAL POPULATION
661
MALE POPULATION
898
FEMALE POPULATION
73.61
MALES / 100 FEMALES
135.85
FEMALES / 100 MALES
51.1
MEDIAN AGE
2.4
AVG FAMILY SIZE
2.2
AVG HOUSEHOLD SIZE
565
LABOR FORCE [ PEOPLE ]
45.2%
PERCENT IN LABOR FORCE
1.2%
UNEMPLOYMENT RATE
Income in Lamar
Income Overview in Lamar
| Characteristic | Number | Measure |
| Per Capita Income | 1,559 | $31,613 |
| Median Family Income | 520 | $0 |
| Mean Family Income | 520 | $61,470 |
| Median Household Income | 701 | $60,245 |
| Mean Household Income | 701 | $70,077 |
| Income Deficit | 520 | $0 |
| Wage / Income Gap (%) | 1,559 | 0.00% |
| Wage / Income Gap ($) | 1,559 | 100.00¢ per $1 |
| Gini / Inequality Index | 1,559 | 0.39 |
Earnings by Sex in Lamar
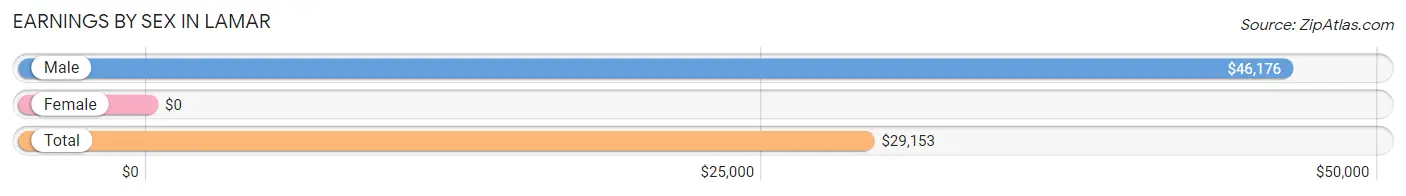
| Sex | Number | Average Earnings |
| Male | 282 (45.9%) | $46,176 |
| Female | 333 (54.1%) | $0 |
| Total | 615 (100.0%) | $29,153 |
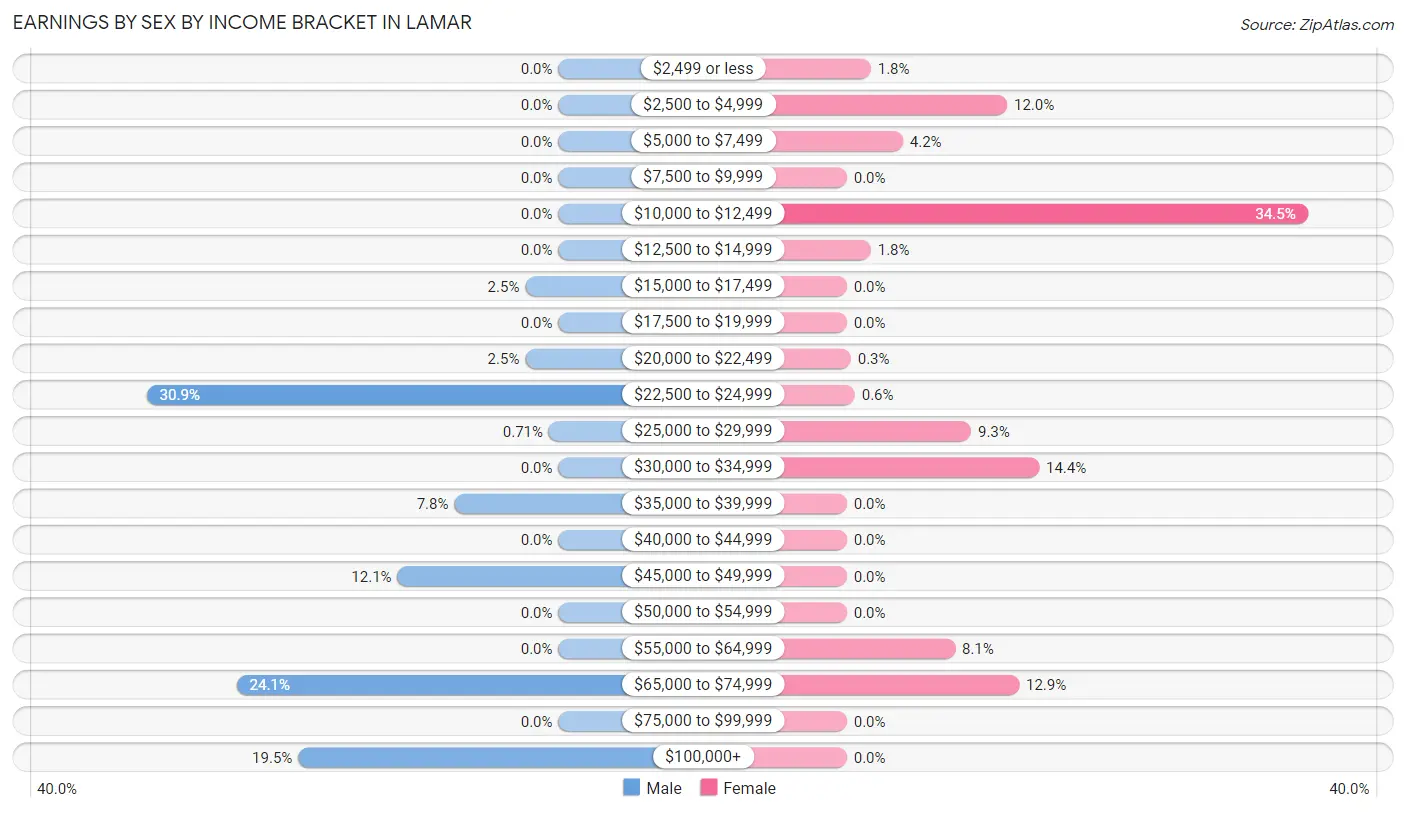
Earnings by Sex by Income Bracket in Lamar
The most common earnings brackets in Lamar are $22,500 to $24,999 for men (87 | 30.8%) and $10,000 to $12,499 for women (115 | 34.5%).
| Income | Male | Female |
| $2,499 or less | 0 (0.0%) | 6 (1.8%) |
| $2,500 to $4,999 | 0 (0.0%) | 40 (12.0%) |
| $5,000 to $7,499 | 0 (0.0%) | 14 (4.2%) |
| $7,500 to $9,999 | 0 (0.0%) | 0 (0.0%) |
| $10,000 to $12,499 | 0 (0.0%) | 115 (34.5%) |
| $12,500 to $14,999 | 0 (0.0%) | 6 (1.8%) |
| $15,000 to $17,499 | 7 (2.5%) | 0 (0.0%) |
| $17,500 to $19,999 | 0 (0.0%) | 0 (0.0%) |
| $20,000 to $22,499 | 7 (2.5%) | 1 (0.3%) |
| $22,500 to $24,999 | 87 (30.8%) | 2 (0.6%) |
| $25,000 to $29,999 | 2 (0.7%) | 31 (9.3%) |
| $30,000 to $34,999 | 0 (0.0%) | 48 (14.4%) |
| $35,000 to $39,999 | 22 (7.8%) | 0 (0.0%) |
| $40,000 to $44,999 | 0 (0.0%) | 0 (0.0%) |
| $45,000 to $49,999 | 34 (12.1%) | 0 (0.0%) |
| $50,000 to $54,999 | 0 (0.0%) | 0 (0.0%) |
| $55,000 to $64,999 | 0 (0.0%) | 27 (8.1%) |
| $65,000 to $74,999 | 68 (24.1%) | 43 (12.9%) |
| $75,000 to $99,999 | 0 (0.0%) | 0 (0.0%) |
| $100,000+ | 55 (19.5%) | 0 (0.0%) |
| Total | 282 (100.0%) | 333 (100.0%) |
Earnings by Sex by Educational Attainment in Lamar
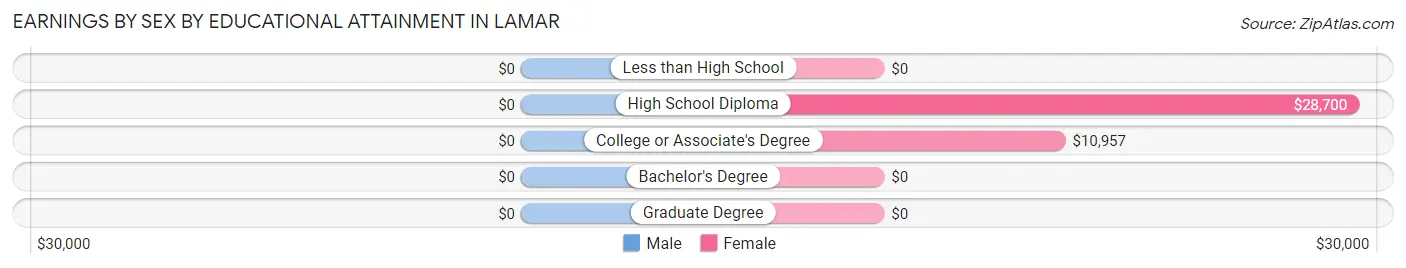
| Educational Attainment | Male Income | Female Income |
| Less than High School | - | - |
| High School Diploma | - | - |
| College or Associate's Degree | - | - |
| Bachelor's Degree | - | - |
| Graduate Degree | - | - |
| Total | $46,176 | $0 |
Family Income in Lamar
Family Income Brackets in Lamar
According to the Lamar family income data, there are 115 families falling into the $10,000 to $14,999 income range, which is the most common income bracket and makes up 22.1% of all families. Conversely, the $35,000 to $49,999 income bracket is the least frequent group with only 6 families (1.1%) belonging to this category.
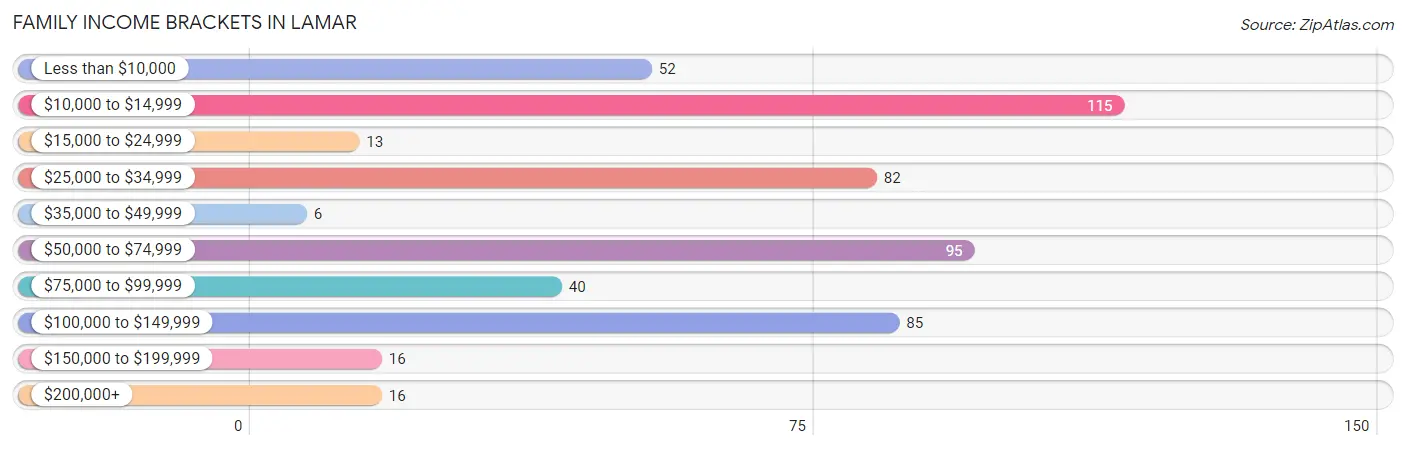
| Income Bracket | # Families | % Families |
| Less than $10,000 | 52 | 10.0% |
| $10,000 to $14,999 | 115 | 22.1% |
| $15,000 to $24,999 | 13 | 2.5% |
| $25,000 to $34,999 | 82 | 15.8% |
| $35,000 to $49,999 | 6 | 1.2% |
| $50,000 to $74,999 | 95 | 18.3% |
| $75,000 to $99,999 | 40 | 7.7% |
| $100,000 to $149,999 | 85 | 16.3% |
| $150,000 to $199,999 | 16 | 3.1% |
| $200,000+ | 16 | 3.1% |
Family Income by Famaliy Size in Lamar
2-person families (359 | 69.0%) account for the highest median family income in Lamar with $59,340 per family, while 2-person families (359 | 69.0%) have the highest median income of $29,670 per family member.
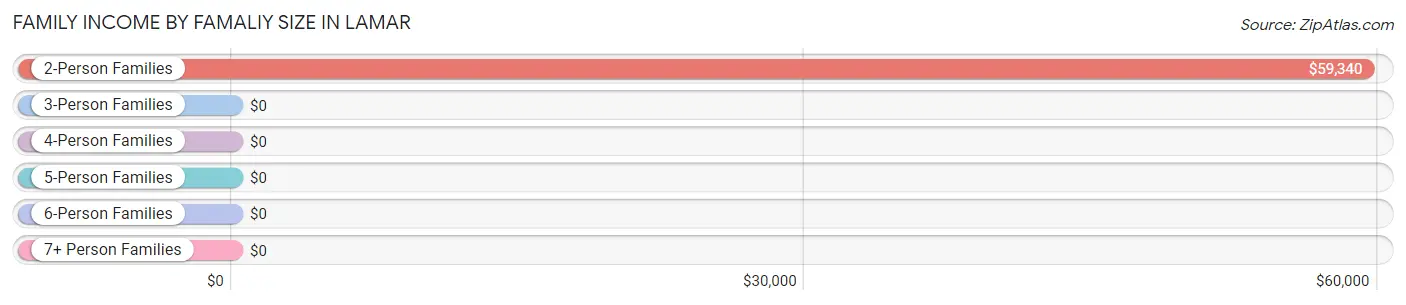
| Income Bracket | # Families | Median Income |
| 2-Person Families | 359 (69.0%) | $59,340 |
| 3-Person Families | 0 (0.0%) | $0 |
| 4-Person Families | 152 (29.2%) | $0 |
| 5-Person Families | 9 (1.7%) | $0 |
| 6-Person Families | 0 (0.0%) | $0 |
| 7+ Person Families | 0 (0.0%) | $0 |
| Total | 520 (100.0%) | $0 |
Family Income by Number of Earners in Lamar
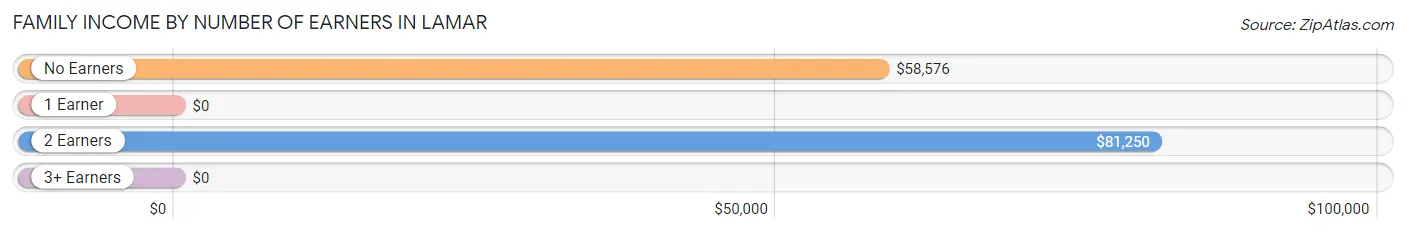
| Number of Earners | # Families | Median Income |
| No Earners | 203 (39.0%) | $58,576 |
| 1 Earner | 273 (52.5%) | $0 |
| 2 Earners | 44 (8.5%) | $81,250 |
| 3+ Earners | 0 (0.0%) | $0 |
| Total | 520 (100.0%) | $0 |
Household Income in Lamar
Household Income Brackets in Lamar
With 150 households falling in the category, the $35,000 to $49,999 income range is the most frequent in Lamar, accounting for 21.4% of all households.
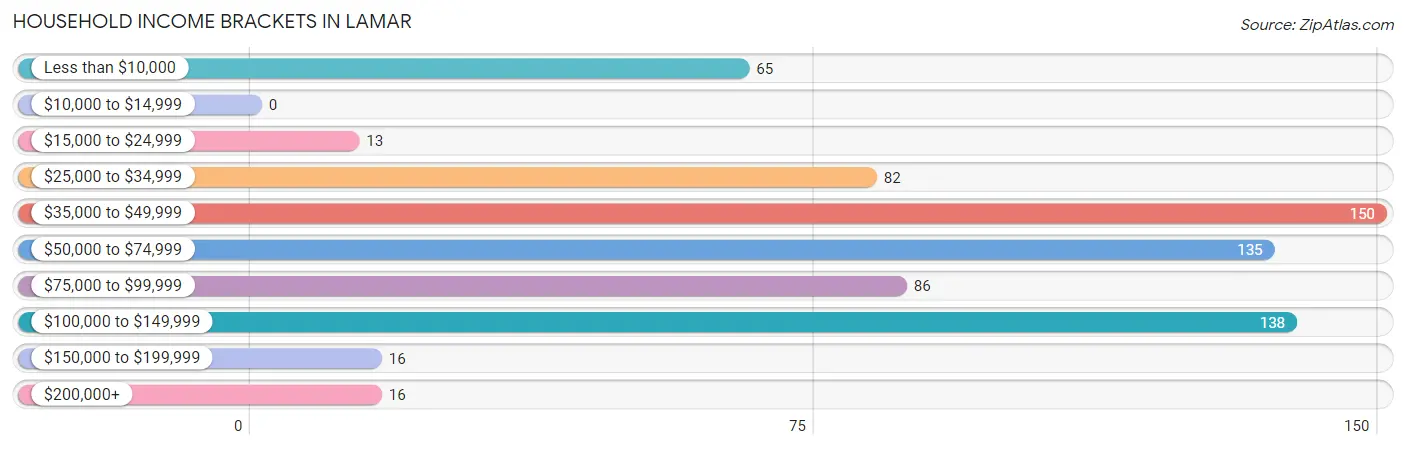
| Income Bracket | # Households | % Households |
| Less than $10,000 | 65 | 9.3% |
| $10,000 to $14,999 | 0 | 0.0% |
| $15,000 to $24,999 | 13 | 1.9% |
| $25,000 to $34,999 | 82 | 11.7% |
| $35,000 to $49,999 | 150 | 21.4% |
| $50,000 to $74,999 | 135 | 19.3% |
| $75,000 to $99,999 | 86 | 12.3% |
| $100,000 to $149,999 | 138 | 19.7% |
| $150,000 to $199,999 | 16 | 2.3% |
| $200,000+ | 16 | 2.3% |
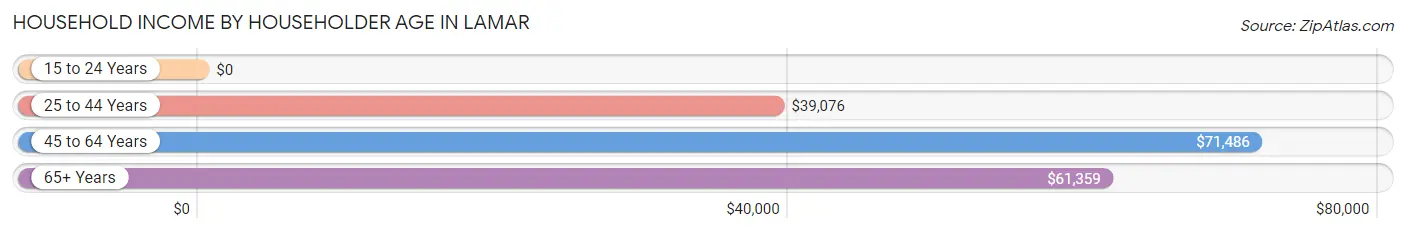
Household Income by Householder Age in Lamar
The median household income in Lamar is $60,245, with the highest median household income of $71,486 found in the 45 to 64 years age bracket for the primary householder. A total of 224 households (32.0%) fall into this category.
| Income Bracket | # Households | Median Income |
| 15 to 24 Years | 0 (0.0%) | $0 |
| 25 to 44 Years | 195 (27.8%) | $39,076 |
| 45 to 64 Years | 224 (32.0%) | $71,486 |
| 65+ Years | 282 (40.2%) | $61,359 |
| Total | 701 (100.0%) | $60,245 |
Poverty in Lamar
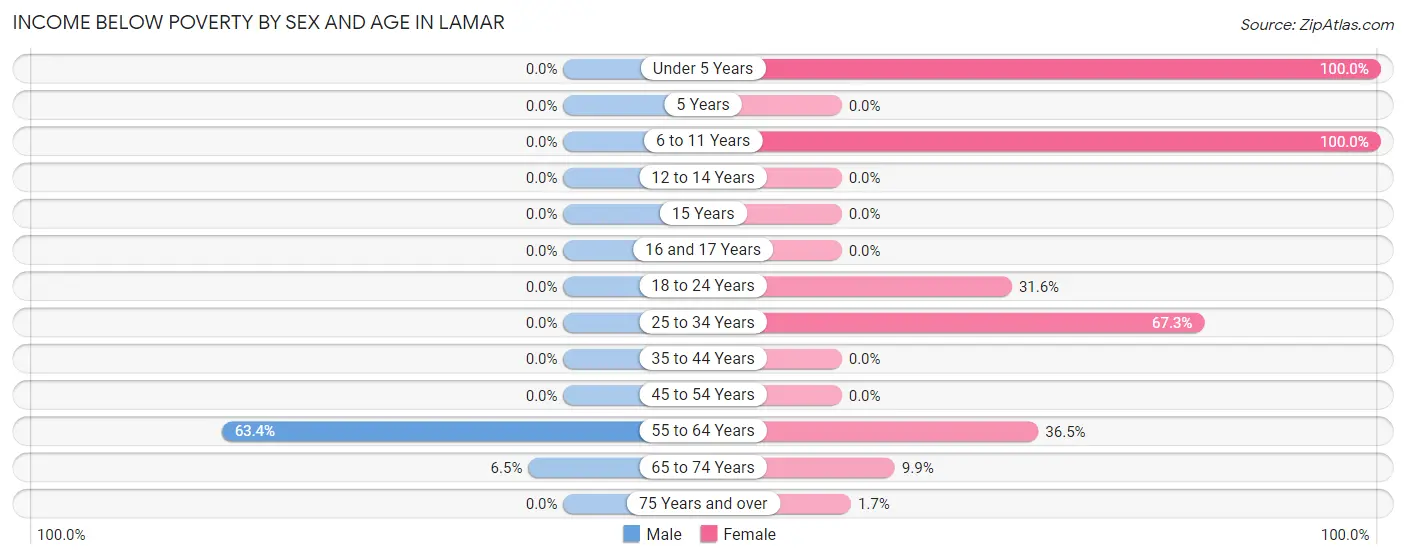
Income Below Poverty by Sex and Age in Lamar
With 8.8% poverty level for males and 44.3% for females among the residents of Lamar, 55 to 64 year old males and under 5 year old females are the most vulnerable to poverty, with 52 males (63.4%) and 130 females (100.0%) in their respective age groups living below the poverty level.
| Age Bracket | Male | Female |
| Under 5 Years | 0 (0.0%) | 130 (100.0%) |
| 5 Years | 0 (0.0%) | 0 (0.0%) |
| 6 to 11 Years | 0 (0.0%) | 83 (100.0%) |
| 12 to 14 Years | 0 (0.0%) | 0 (0.0%) |
| 15 Years | 0 (0.0%) | 0 (0.0%) |
| 16 and 17 Years | 0 (0.0%) | 0 (0.0%) |
| 18 to 24 Years | 0 (0.0%) | 6 (31.6%) |
| 25 to 34 Years | 0 (0.0%) | 115 (67.2%) |
| 35 to 44 Years | 0 (0.0%) | 0 (0.0%) |
| 45 to 54 Years | 0 (0.0%) | 0 (0.0%) |
| 55 to 64 Years | 52 (63.4%) | 54 (36.5%) |
| 65 to 74 Years | 6 (6.5%) | 7 (9.9%) |
| 75 Years and over | 0 (0.0%) | 2 (1.7%) |
| Total | 58 (8.8%) | 397 (44.3%) |
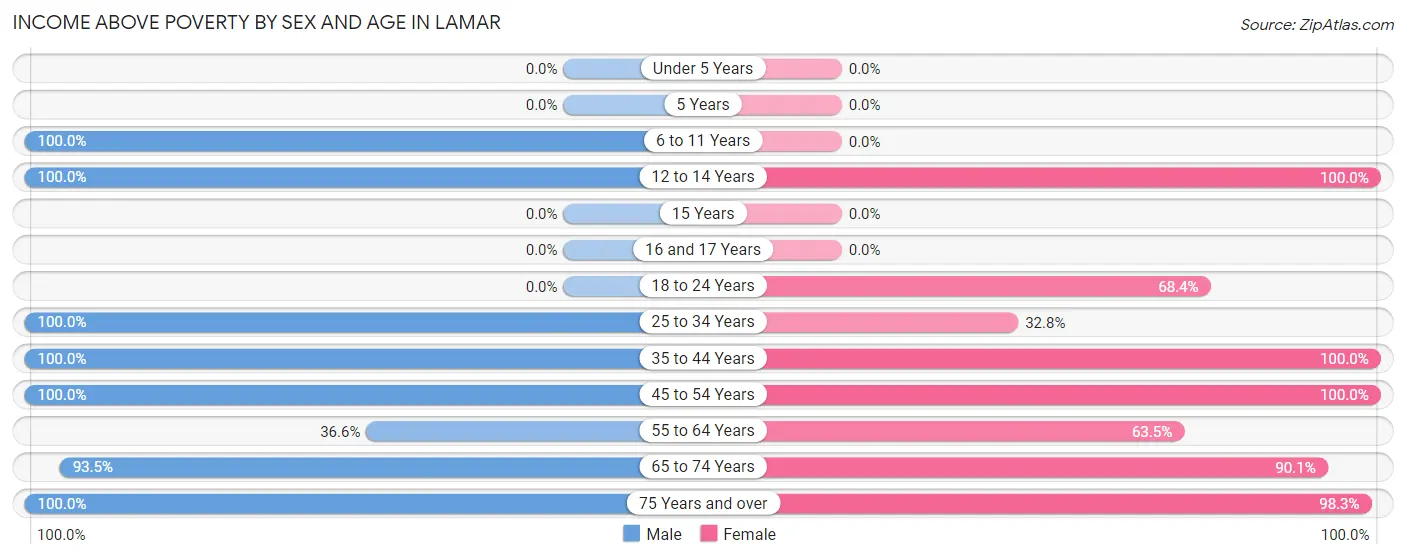
Income Above Poverty by Sex and Age in Lamar
According to the poverty statistics in Lamar, males aged 6 to 11 years and females aged 12 to 14 years are the age groups that are most secure financially, with 100.0% of males and 100.0% of females in these age groups living above the poverty line.
| Age Bracket | Male | Female |
| Under 5 Years | 0 (0.0%) | 0 (0.0%) |
| 5 Years | 0 (0.0%) | 0 (0.0%) |
| 6 to 11 Years | 29 (100.0%) | 0 (0.0%) |
| 12 to 14 Years | 10 (100.0%) | 55 (100.0%) |
| 15 Years | 0 (0.0%) | 0 (0.0%) |
| 16 and 17 Years | 0 (0.0%) | 0 (0.0%) |
| 18 to 24 Years | 0 (0.0%) | 13 (68.4%) |
| 25 to 34 Years | 130 (100.0%) | 56 (32.8%) |
| 35 to 44 Years | 1 (100.0%) | 26 (100.0%) |
| 45 to 54 Years | 143 (100.0%) | 77 (100.0%) |
| 55 to 64 Years | 30 (36.6%) | 94 (63.5%) |
| 65 to 74 Years | 86 (93.5%) | 64 (90.1%) |
| 75 Years and over | 174 (100.0%) | 115 (98.3%) |
| Total | 603 (91.2%) | 500 (55.7%) |
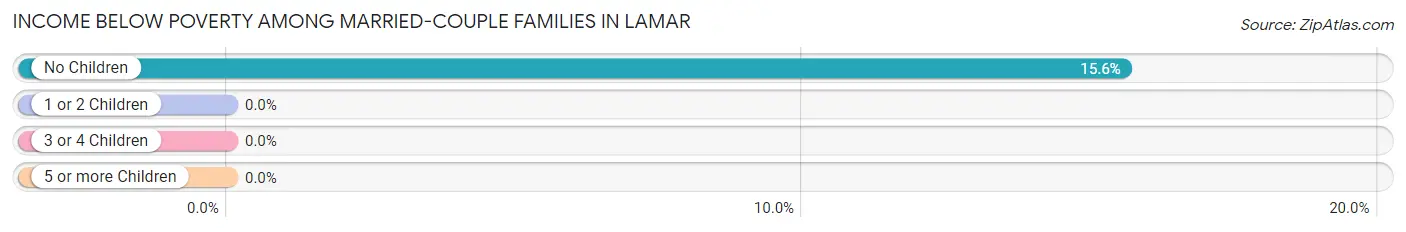
Income Below Poverty Among Married-Couple Families in Lamar
The poverty statistics for married-couple families in Lamar show that 13.7% or 52 of the total 380 families live below the poverty line. Families with no children have the highest poverty rate of 15.6%, comprising of 52 families. On the other hand, families with 1 or 2 children have the lowest poverty rate of 0.0%, which includes 0 families.
| Children | Above Poverty | Below Poverty |
| No Children | 282 (84.4%) | 52 (15.6%) |
| 1 or 2 Children | 46 (100.0%) | 0 (0.0%) |
| 3 or 4 Children | 0 (0.0%) | 0 (0.0%) |
| 5 or more Children | 0 (0.0%) | 0 (0.0%) |
| Total | 328 (86.3%) | 52 (13.7%) |
Income Below Poverty Among Single-Parent Households in Lamar
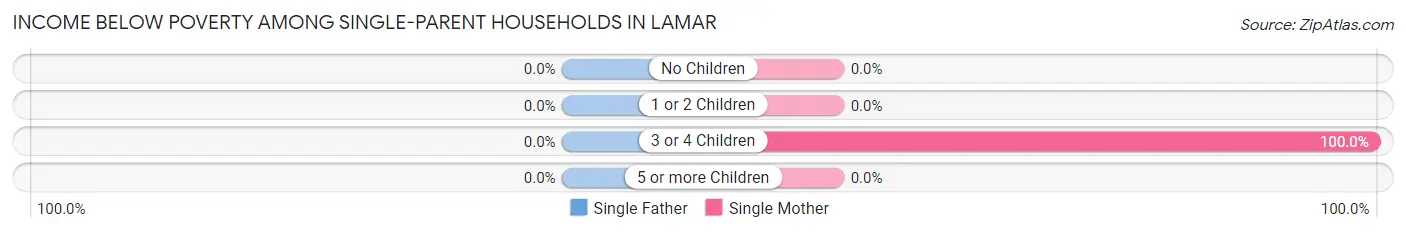
| Children | Single Father | Single Mother |
| No Children | 0 (0.0%) | 0 (0.0%) |
| 1 or 2 Children | 0 (0.0%) | 0 (0.0%) |
| 3 or 4 Children | 0 (0.0%) | 115 (100.0%) |
| 5 or more Children | 0 (0.0%) | 0 (0.0%) |
| Total | 0 (0.0%) | 115 (82.1%) |
Income Below Poverty Among Married-Couple vs Single-Parent Households in Lamar
The poverty data for Lamar shows that 52 of the married-couple family households (13.7%) and 115 of the single-parent households (82.1%) are living below the poverty level. Within the married-couple family households, those with no children have the highest poverty rate, with 52 households (15.6%) falling below the poverty line. Among the single-parent households, those with 3 or 4 children have the highest poverty rate, with 115 household (100.0%) living below poverty.
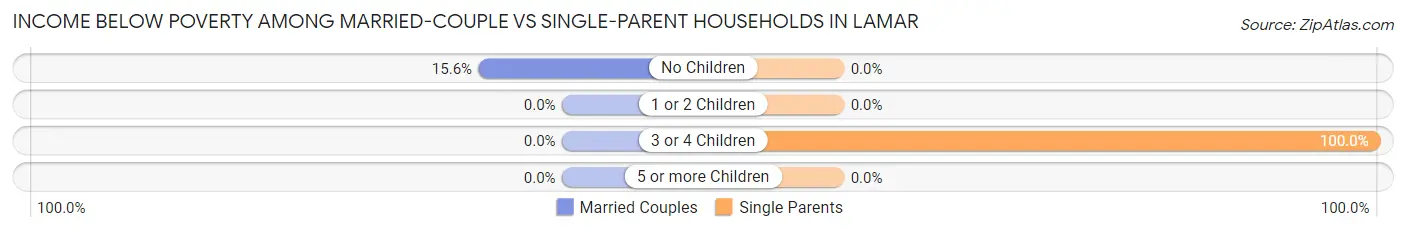
| Children | Married-Couple Families | Single-Parent Households |
| No Children | 52 (15.6%) | 0 (0.0%) |
| 1 or 2 Children | 0 (0.0%) | 0 (0.0%) |
| 3 or 4 Children | 0 (0.0%) | 115 (100.0%) |
| 5 or more Children | 0 (0.0%) | 0 (0.0%) |
| Total | 52 (13.7%) | 115 (82.1%) |
Race in Lamar
The most populous races in Lamar are White / Caucasian (1,451 | 93.1%), Hispanic or Latino (57 | 3.7%), and Some other Race (38 | 2.4%).
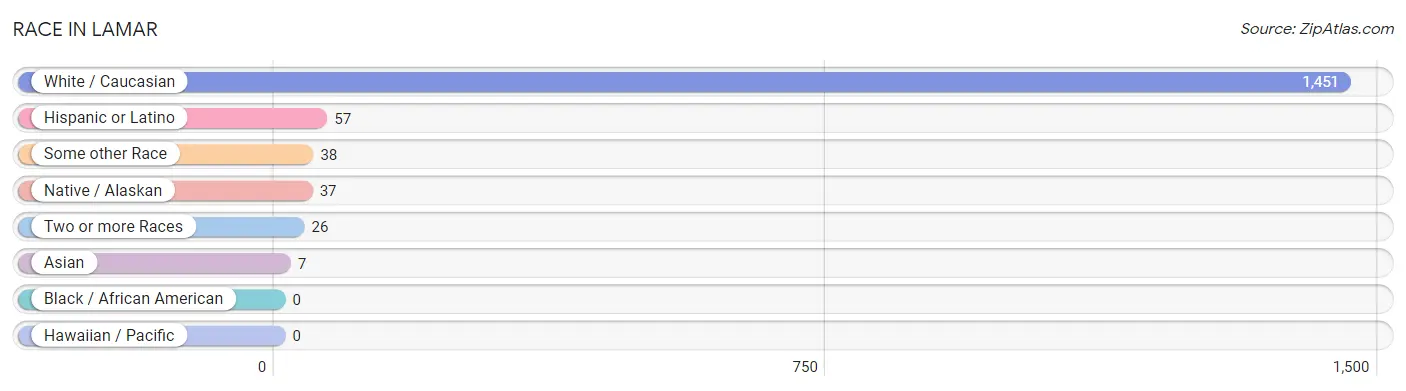
| Race | # Population | % Population |
| Asian | 7 | 0.4% |
| Black / African American | 0 | 0.0% |
| Hawaiian / Pacific | 0 | 0.0% |
| Hispanic or Latino | 57 | 3.7% |
| Native / Alaskan | 37 | 2.4% |
| White / Caucasian | 1,451 | 93.1% |
| Two or more Races | 26 | 1.7% |
| Some other Race | 38 | 2.4% |
| Total | 1,559 | 100.0% |
Ancestry in Lamar
The most populous ancestries reported in Lamar are German (495 | 31.8%), Irish (471 | 30.2%), Polish (275 | 17.6%), English (248 | 15.9%), and Scottish (63 | 4.0%), together accounting for 99.5% of all Lamar residents.
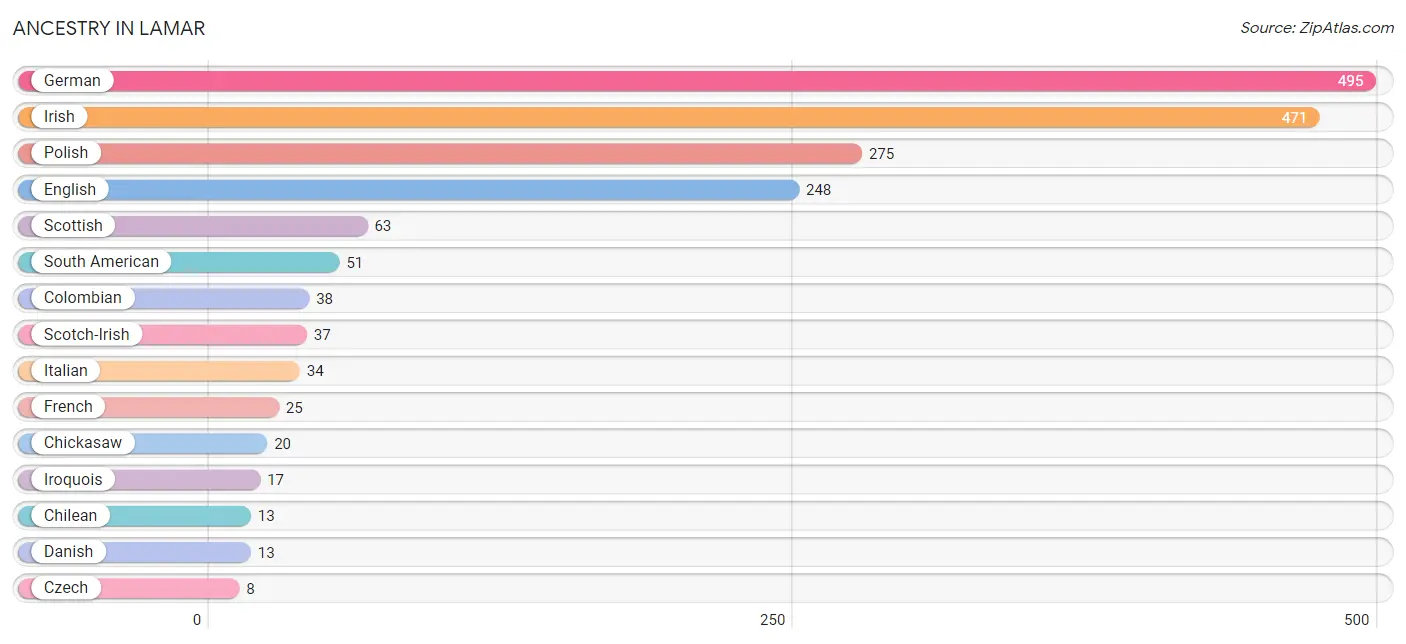
| Ancestry | # Population | % Population |
| Chickasaw | 20 | 1.3% |
| Chilean | 13 | 0.8% |
| Colombian | 38 | 2.4% |
| Czech | 8 | 0.5% |
| Danish | 13 | 0.8% |
| English | 248 | 15.9% |
| Filipino | 6 | 0.4% |
| French | 25 | 1.6% |
| German | 495 | 31.8% |
| Irish | 471 | 30.2% |
| Iroquois | 17 | 1.1% |
| Italian | 34 | 2.2% |
| Korean | 1 | 0.1% |
| Mexican | 6 | 0.4% |
| Norwegian | 7 | 0.4% |
| Polish | 275 | 17.6% |
| Scotch-Irish | 37 | 2.4% |
| Scottish | 63 | 4.0% |
| South American | 51 | 3.3% |
| Welsh | 7 | 0.4% | View All 20 Rows |
Immigrants in Lamar
The most numerous immigrant groups reported in Lamar came from Latin America (44 | 2.8%), Colombia (38 | 2.4%), South America (38 | 2.4%), Asia (7 | 0.4%), and Central America (6 | 0.4%), together accounting for 8.5% of all Lamar residents.
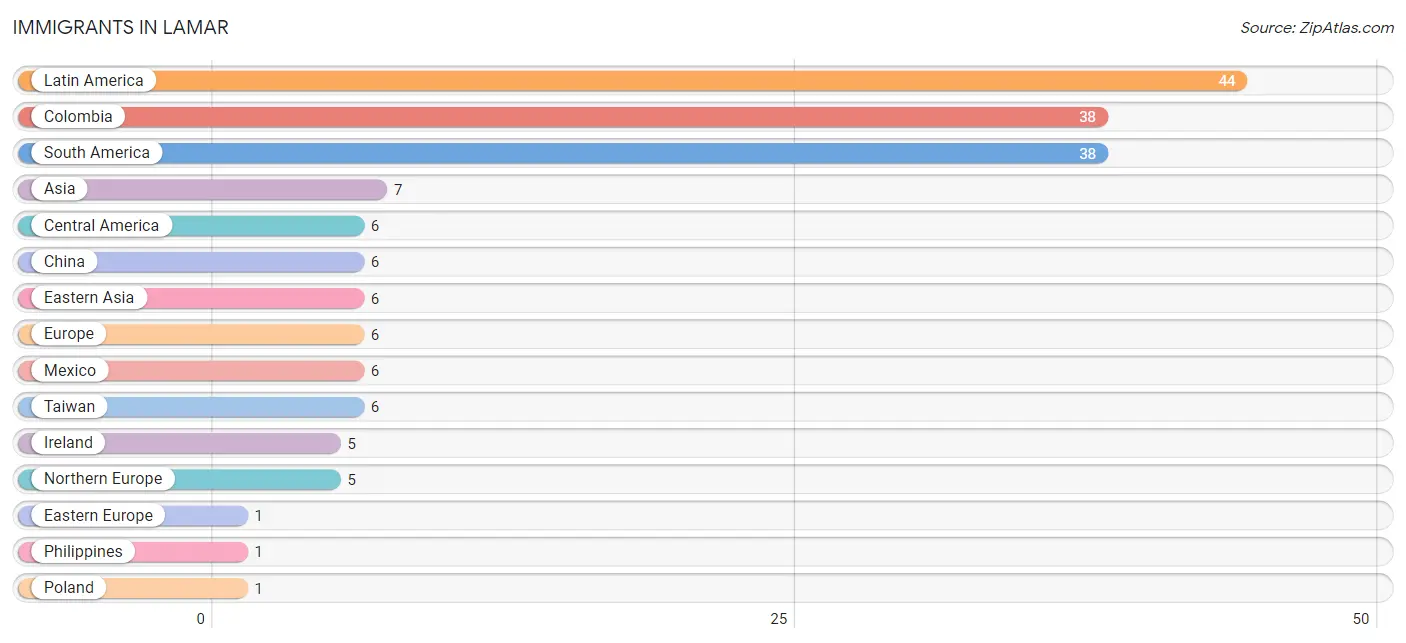
| Immigration Origin | # Population | % Population |
| Asia | 7 | 0.4% |
| Central America | 6 | 0.4% |
| China | 6 | 0.4% |
| Colombia | 38 | 2.4% |
| Eastern Asia | 6 | 0.4% |
| Eastern Europe | 1 | 0.1% |
| Europe | 6 | 0.4% |
| Ireland | 5 | 0.3% |
| Latin America | 44 | 2.8% |
| Mexico | 6 | 0.4% |
| Northern Europe | 5 | 0.3% |
| Philippines | 1 | 0.1% |
| Poland | 1 | 0.1% |
| South America | 38 | 2.4% |
| South Eastern Asia | 1 | 0.1% |
| Taiwan | 6 | 0.4% | View All 16 Rows |
Sex and Age in Lamar
Sex and Age in Lamar
The most populous age groups in Lamar are 25 to 29 Years (121 | 18.3%) for men and 25 to 29 Years (161 | 17.9%) for women.
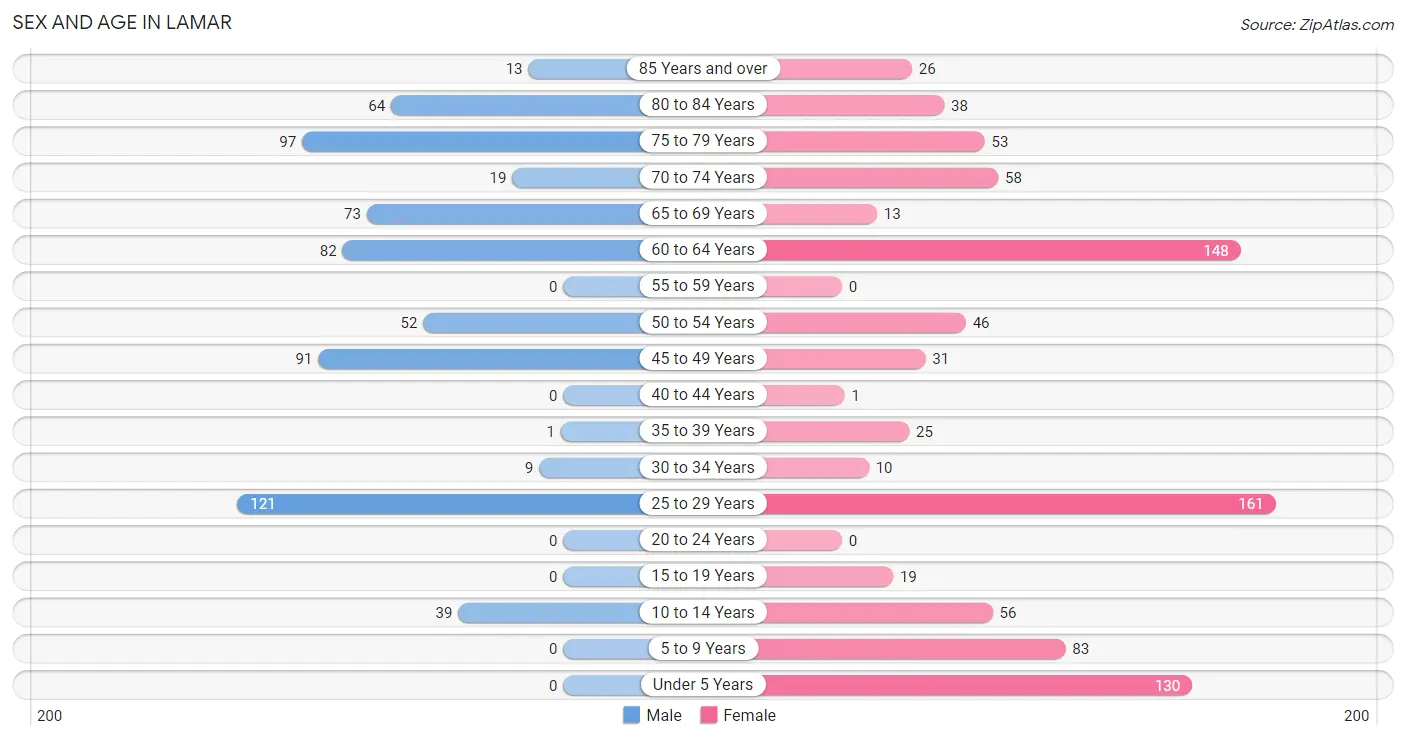
| Age Bracket | Male | Female |
| Under 5 Years | 0 (0.0%) | 130 (14.5%) |
| 5 to 9 Years | 0 (0.0%) | 83 (9.2%) |
| 10 to 14 Years | 39 (5.9%) | 56 (6.2%) |
| 15 to 19 Years | 0 (0.0%) | 19 (2.1%) |
| 20 to 24 Years | 0 (0.0%) | 0 (0.0%) |
| 25 to 29 Years | 121 (18.3%) | 161 (17.9%) |
| 30 to 34 Years | 9 (1.4%) | 10 (1.1%) |
| 35 to 39 Years | 1 (0.2%) | 25 (2.8%) |
| 40 to 44 Years | 0 (0.0%) | 1 (0.1%) |
| 45 to 49 Years | 91 (13.8%) | 31 (3.5%) |
| 50 to 54 Years | 52 (7.9%) | 46 (5.1%) |
| 55 to 59 Years | 0 (0.0%) | 0 (0.0%) |
| 60 to 64 Years | 82 (12.4%) | 148 (16.5%) |
| 65 to 69 Years | 73 (11.0%) | 13 (1.5%) |
| 70 to 74 Years | 19 (2.9%) | 58 (6.5%) |
| 75 to 79 Years | 97 (14.7%) | 53 (5.9%) |
| 80 to 84 Years | 64 (9.7%) | 38 (4.2%) |
| 85 Years and over | 13 (2.0%) | 26 (2.9%) |
| Total | 661 (100.0%) | 898 (100.0%) |
Families and Households in Lamar
Median Family Size in Lamar
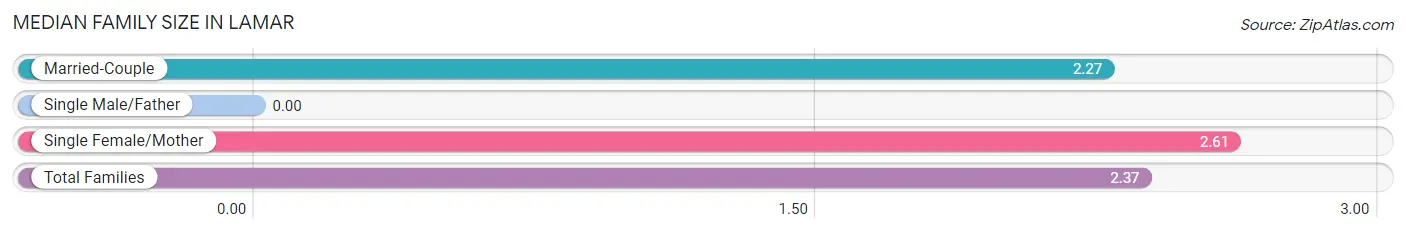
| Family Type | # Families | Family Size |
| Married-Couple | 380 (73.1%) | 2.27 |
| Single Male/Father | 0 (0.0%) | - |
| Single Female/Mother | 140 (26.9%) | 2.61 |
| Total Families | 520 (100.0%) | 2.37 |
Median Household Size in Lamar
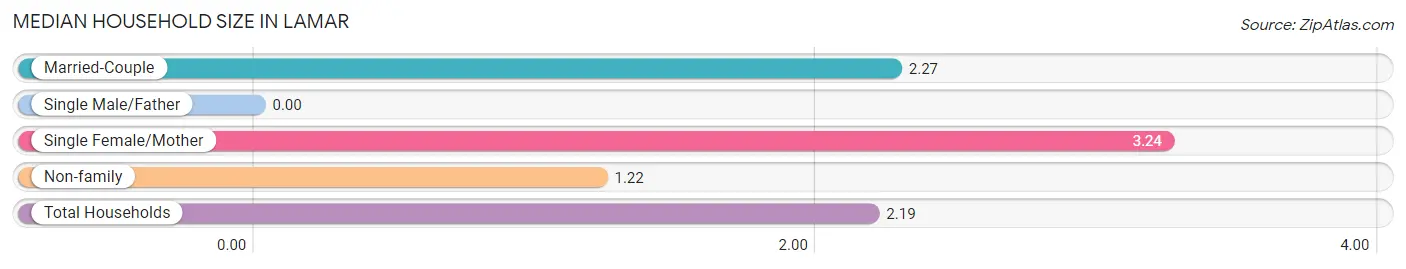
| Household Type | # Households | Household Size |
| Married-Couple | 380 (54.2%) | 2.27 |
| Single Male/Father | 0 (0.0%) | - |
| Single Female/Mother | 140 (20.0%) | 3.24 |
| Non-family | 181 (25.8%) | 1.22 |
| Total Households | 701 (100.0%) | 2.19 |
Household Size by Marriage Status in Lamar
Out of a total of 701 households in Lamar, 520 (74.2%) are family households, while 181 (25.8%) are nonfamily households. The most numerous type of family households are 2-person households, comprising 359, and the most common type of nonfamily households are 1-person households, comprising 129.
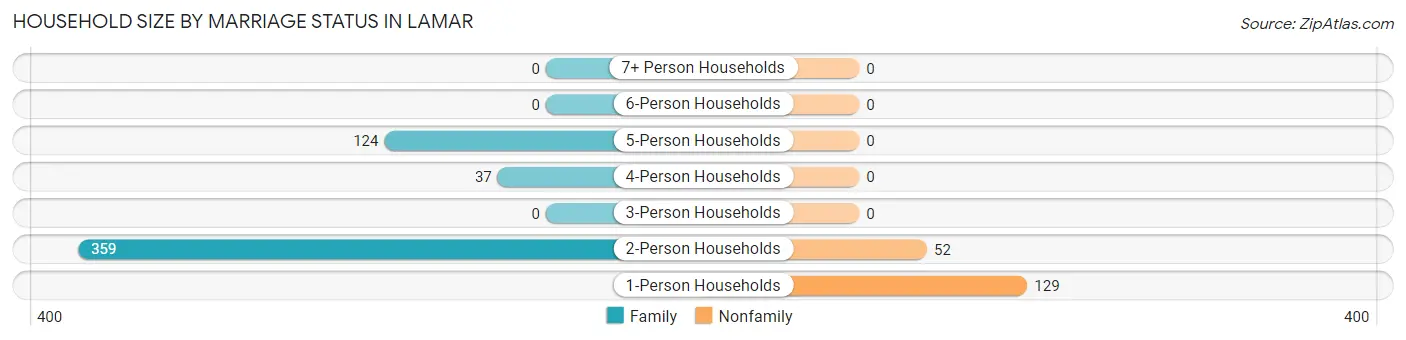
| Household Size | Family Households | Nonfamily Households |
| 1-Person Households | - | 129 (18.4%) |
| 2-Person Households | 359 (51.2%) | 52 (7.4%) |
| 3-Person Households | 0 (0.0%) | 0 (0.0%) |
| 4-Person Households | 37 (5.3%) | 0 (0.0%) |
| 5-Person Households | 124 (17.7%) | 0 (0.0%) |
| 6-Person Households | 0 (0.0%) | 0 (0.0%) |
| 7+ Person Households | 0 (0.0%) | 0 (0.0%) |
| Total | 520 (74.2%) | 181 (25.8%) |
Female Fertility in Lamar
Fertility by Age in Lamar
Average fertility rate in Lamar is 466.0 births per 1,000 women. Women in the age bracket of 20 to 34 years have the highest fertility rate with 673.0 births per 1,000 women. Women in the age bracket of 20 to 34 years acount for 100.0% of all women with births.
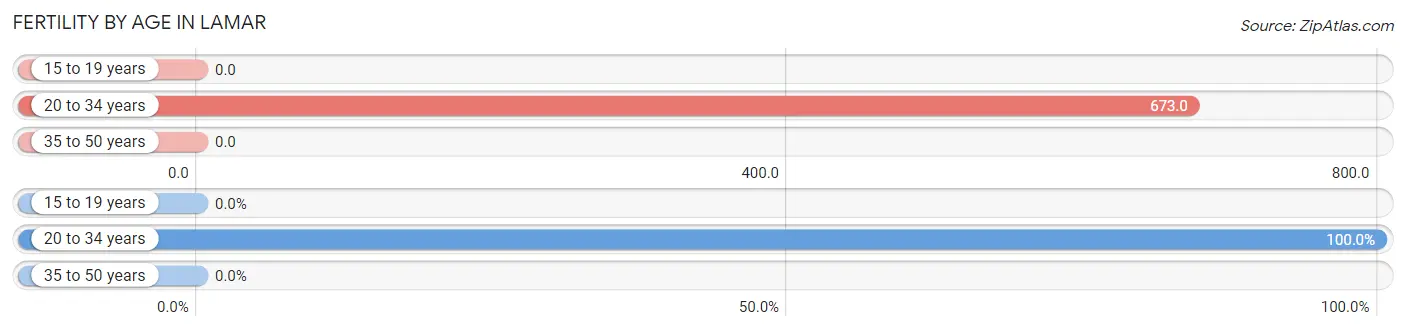
| Age Bracket | Women with Births | Births / 1,000 Women |
| 15 to 19 years | 0 (0.0%) | 0.0 |
| 20 to 34 years | 115 (100.0%) | 673.0 |
| 35 to 50 years | 0 (0.0%) | 0.0 |
| Total | 115 (100.0%) | 466.0 |
Fertility by Age by Marriage Status in Lamar
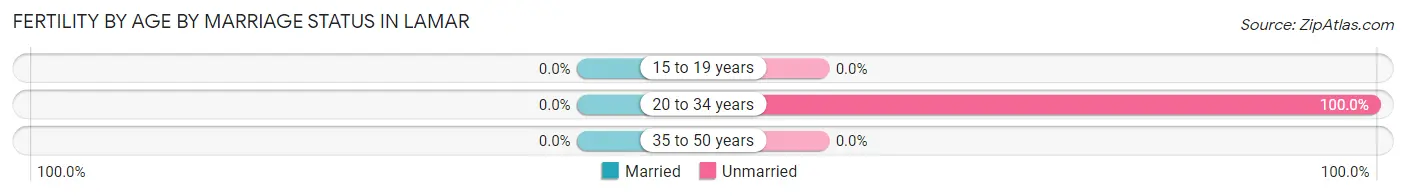
| Age Bracket | Married | Unmarried |
| 15 to 19 years | 0 (0.0%) | 0 (0.0%) |
| 20 to 34 years | 0 (0.0%) | 115 (100.0%) |
| 35 to 50 years | 0 (0.0%) | 0 (0.0%) |
| Total | 0 (0.0%) | 115 (100.0%) |
Fertility by Education in Lamar
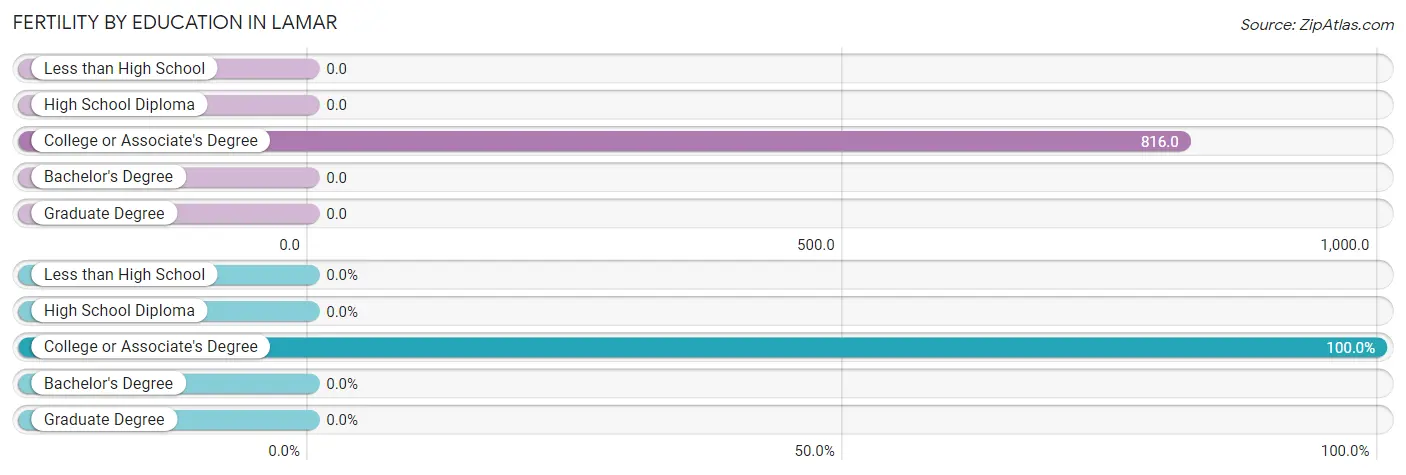
| Educational Attainment | Women with Births | Births / 1,000 Women |
| Less than High School | 0 (0.0%) | 0.0 |
| High School Diploma | 0 (0.0%) | 0.0 |
| College or Associate's Degree | 115 (100.0%) | 816.0 |
| Bachelor's Degree | 0 (0.0%) | 0.0 |
| Graduate Degree | 0 (0.0%) | 0.0 |
| Total | 115 (100.0%) | 466.0 |
Fertility by Education by Marriage Status in Lamar
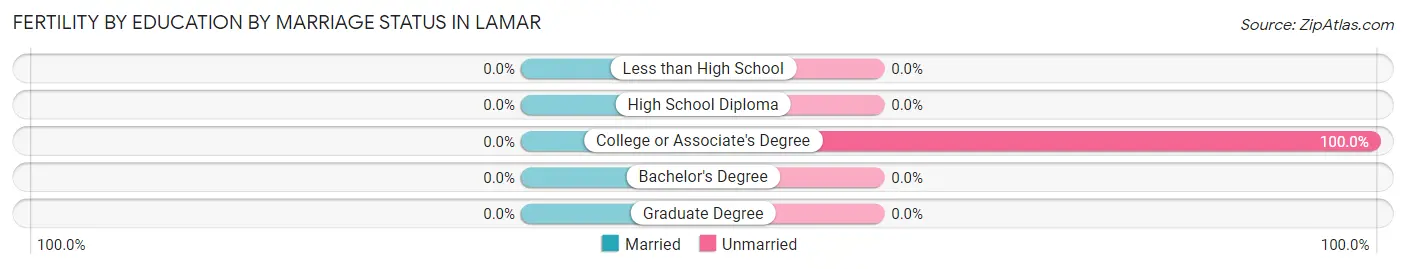
| Educational Attainment | Married | Unmarried |
| Less than High School | 0 (0.0%) | 0 (0.0%) |
| High School Diploma | 0 (0.0%) | 0 (0.0%) |
| College or Associate's Degree | 0 (0.0%) | 115 (100.0%) |
| Bachelor's Degree | 0 (0.0%) | 0 (0.0%) |
| Graduate Degree | 0 (0.0%) | 0 (0.0%) |
| Total | 0 (0.0%) | 115 (100.0%) |
Employment Characteristics in Lamar
Employment by Class of Employer in Lamar
Among the 443 employed individuals in Lamar, private company employees (261 | 58.9%), self-employed (not incorporated) (61 | 13.8%), and state government employees (46 | 10.4%) make up the most common classes of employment.
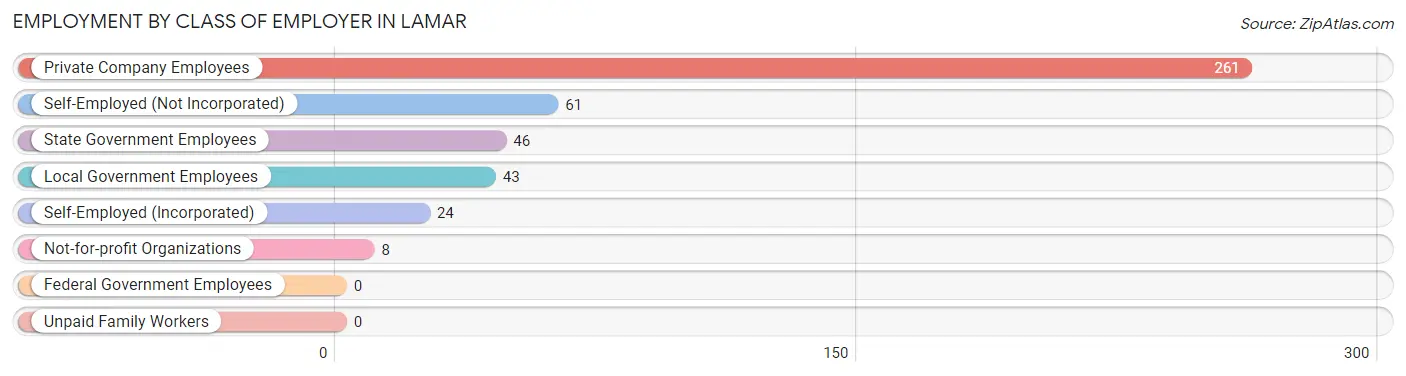
| Employer Class | # Employees | % Employees |
| Private Company Employees | 261 | 58.9% |
| Self-Employed (Incorporated) | 24 | 5.4% |
| Self-Employed (Not Incorporated) | 61 | 13.8% |
| Not-for-profit Organizations | 8 | 1.8% |
| Local Government Employees | 43 | 9.7% |
| State Government Employees | 46 | 10.4% |
| Federal Government Employees | 0 | 0.0% |
| Unpaid Family Workers | 0 | 0.0% |
| Total | 443 | 100.0% |
Employment Status by Age in Lamar
According to the labor force statistics for Lamar, out of the total population over 16 years of age (1,251), 45.2% or 565 individuals are in the labor force, with 1.2% or 7 of them unemployed. The age group with the highest labor force participation rate is 25 to 29 years, with 100.0% or 282 individuals in the labor force. Within the labor force, the 45 to 54 years age range has the highest percentage of unemployed individuals, with 4.2% or 7 of them being unemployed.
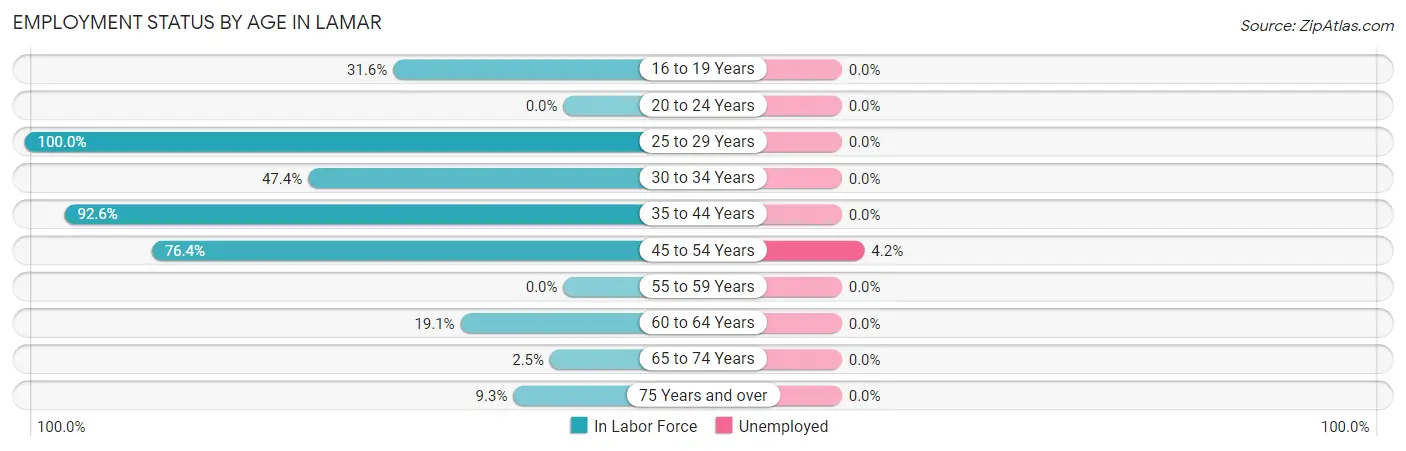
| Age Bracket | In Labor Force | Unemployed |
| 16 to 19 Years | 6 (31.6%) | 0 (0.0%) |
| 20 to 24 Years | 0 (0.0%) | 0 (0.0%) |
| 25 to 29 Years | 282 (100.0%) | 0 (0.0%) |
| 30 to 34 Years | 9 (47.4%) | 0 (0.0%) |
| 35 to 44 Years | 25 (92.6%) | 0 (0.0%) |
| 45 to 54 Years | 168 (76.4%) | 7 (4.2%) |
| 55 to 59 Years | 0 (0.0%) | 0 (0.0%) |
| 60 to 64 Years | 44 (19.1%) | 0 (0.0%) |
| 65 to 74 Years | 4 (2.5%) | 0 (0.0%) |
| 75 Years and over | 27 (9.3%) | 0 (0.0%) |
| Total | 565 (45.2%) | 7 (1.2%) |
Employment Status by Educational Attainment in Lamar
According to labor force statistics for Lamar, 67.9% of individuals (528) out of the total population between 25 and 64 years of age (778) are in the labor force, with 1.3% or 7 of them being unemployed. The group with the highest labor force participation rate are those with the educational attainment of less than high school, with 100.0% or 87 individuals in the labor force. Within the labor force, individuals with high school diploma education have the highest percentage of unemployment, with 16.3% or 7 of them being unemployed.
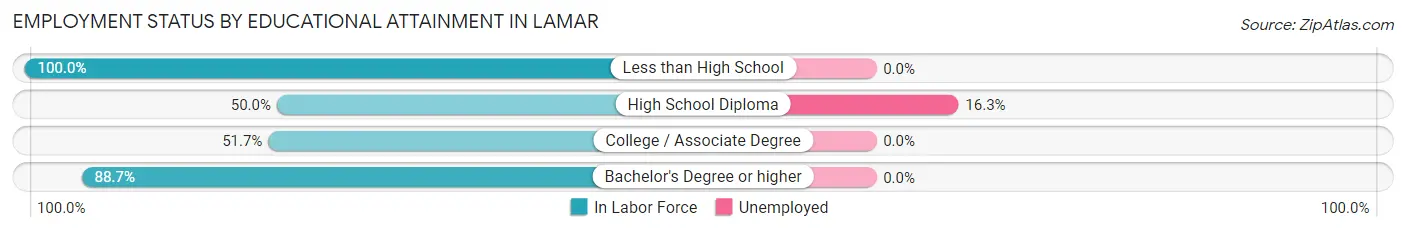
| Educational Attainment | In Labor Force | Unemployed |
| Less than High School | 87 (100.0%) | 0 (0.0%) |
| High School Diploma | 43 (50.0%) | 14 (16.3%) |
| College / Associate Degree | 194 (51.7%) | 0 (0.0%) |
| Bachelor's Degree or higher | 204 (88.7%) | 0 (0.0%) |
| Total | 528 (67.9%) | 10 (1.3%) |
Employment Occupations by Sex in Lamar
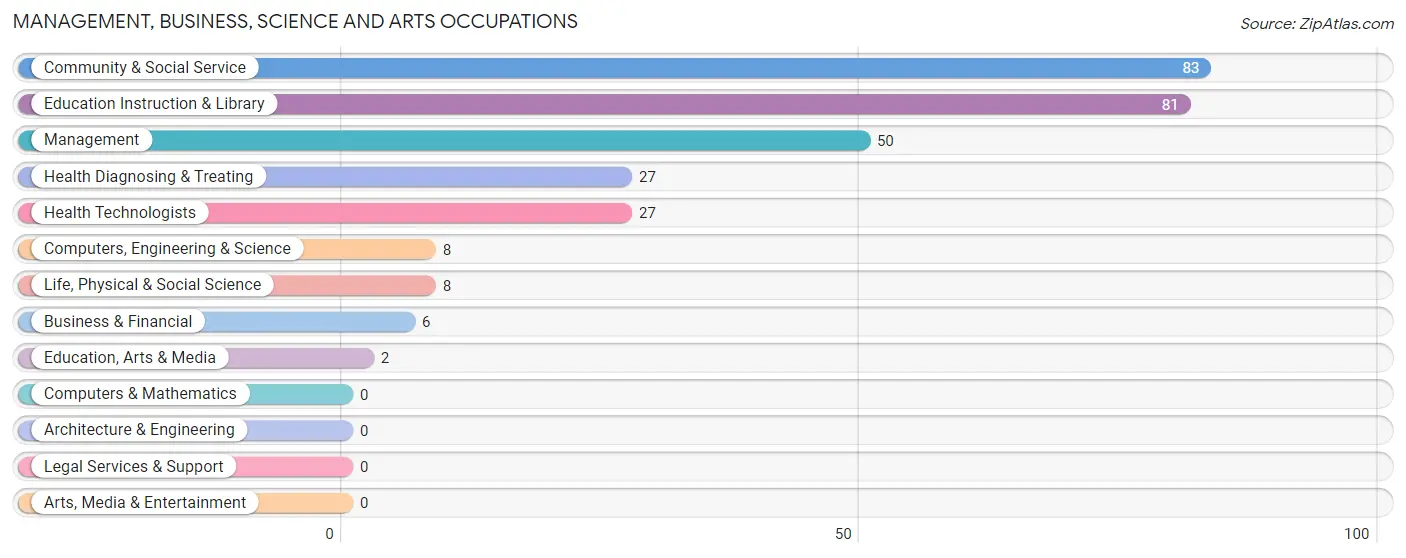
Management, Business, Science and Arts Occupations
The most common Management, Business, Science and Arts occupations in Lamar are Community & Social Service (83 | 14.9%), Education Instruction & Library (81 | 14.5%), Management (50 | 9.0%), Health Diagnosing & Treating (27 | 4.8%), and Health Technologists (27 | 4.8%).
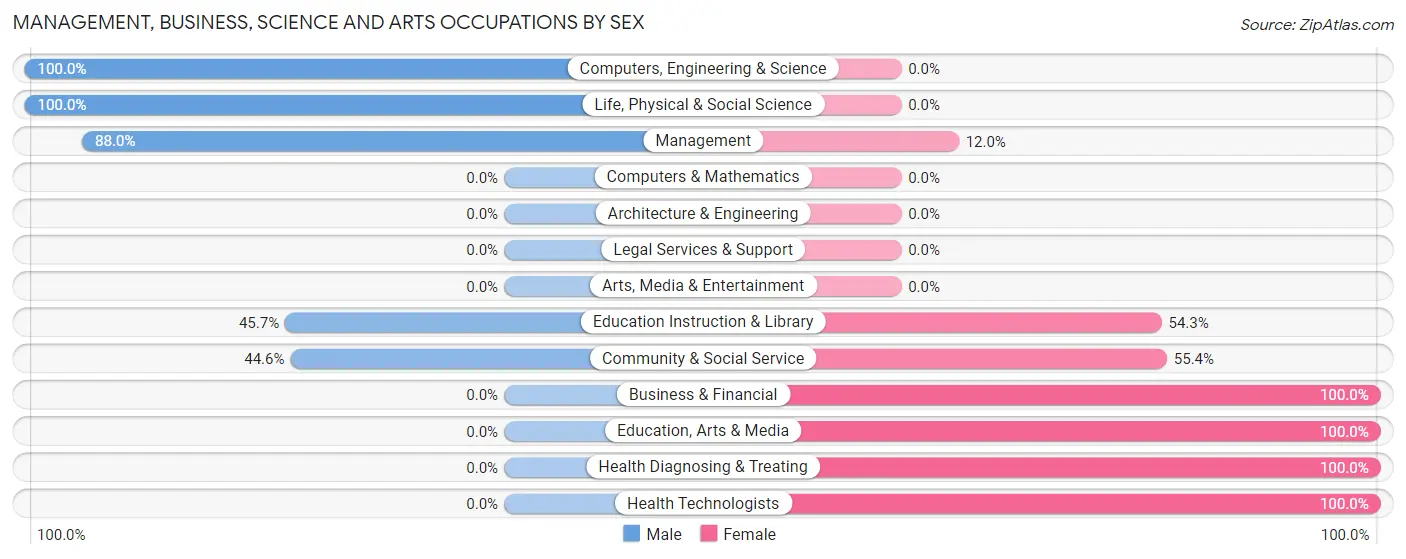
Management, Business, Science and Arts Occupations by Sex
Within the Management, Business, Science and Arts occupations in Lamar, the most male-oriented occupations are Computers, Engineering & Science (100.0%), Life, Physical & Social Science (100.0%), and Management (88.0%), while the most female-oriented occupations are Business & Financial (100.0%), Education, Arts & Media (100.0%), and Health Diagnosing & Treating (100.0%).
| Occupation | Male | Female |
| Management | 44 (88.0%) | 6 (12.0%) |
| Business & Financial | 0 (0.0%) | 6 (100.0%) |
| Computers, Engineering & Science | 8 (100.0%) | 0 (0.0%) |
| Computers & Mathematics | 0 (0.0%) | 0 (0.0%) |
| Architecture & Engineering | 0 (0.0%) | 0 (0.0%) |
| Life, Physical & Social Science | 8 (100.0%) | 0 (0.0%) |
| Community & Social Service | 37 (44.6%) | 46 (55.4%) |
| Education, Arts & Media | 0 (0.0%) | 2 (100.0%) |
| Legal Services & Support | 0 (0.0%) | 0 (0.0%) |
| Education Instruction & Library | 37 (45.7%) | 44 (54.3%) |
| Arts, Media & Entertainment | 0 (0.0%) | 0 (0.0%) |
| Health Diagnosing & Treating | 0 (0.0%) | 27 (100.0%) |
| Health Technologists | 0 (0.0%) | 27 (100.0%) |
| Total (Category) | 89 (51.1%) | 85 (48.8%) |
| Total (Overall) | 268 (48.0%) | 290 (52.0%) |
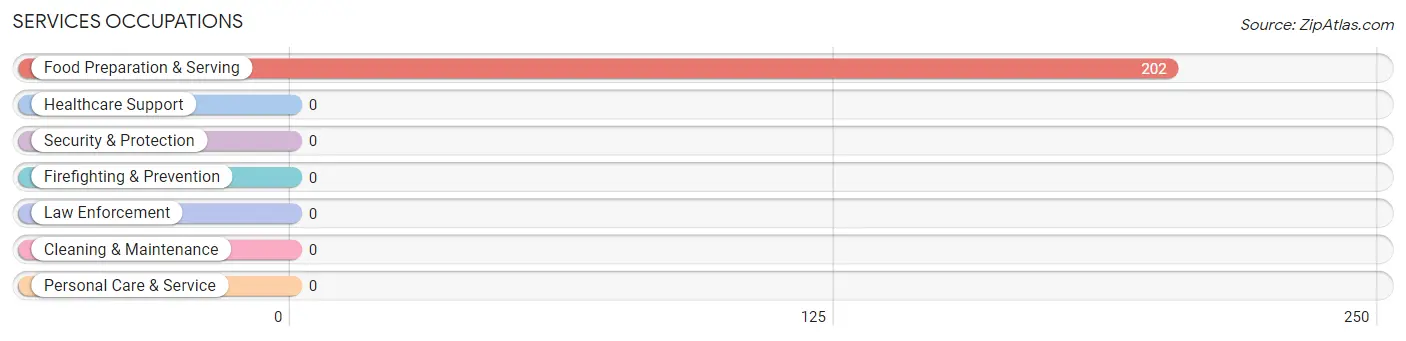
Services Occupations
The most common Services occupations in Lamar are , and Food Preparation & Serving (202 | 36.2%).
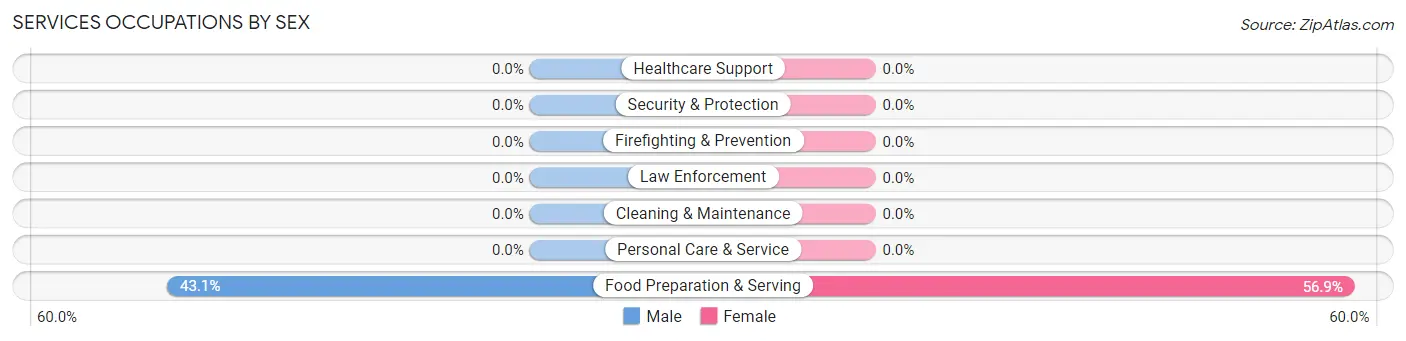
Services Occupations by Sex
| Occupation | Male | Female |
| Healthcare Support | 0 (0.0%) | 0 (0.0%) |
| Security & Protection | 0 (0.0%) | 0 (0.0%) |
| Firefighting & Prevention | 0 (0.0%) | 0 (0.0%) |
| Law Enforcement | 0 (0.0%) | 0 (0.0%) |
| Food Preparation & Serving | 87 (43.1%) | 115 (56.9%) |
| Cleaning & Maintenance | 0 (0.0%) | 0 (0.0%) |
| Personal Care & Service | 0 (0.0%) | 0 (0.0%) |
| Total (Category) | 87 (43.1%) | 115 (56.9%) |
| Total (Overall) | 268 (48.0%) | 290 (52.0%) |
Sales and Office Occupations
The most common Sales and Office occupations in Lamar are Sales & Related (86 | 15.4%), and Office & Administration (51 | 9.1%).

Sales and Office Occupations by Sex

| Occupation | Male | Female |
| Sales & Related | 47 (54.6%) | 39 (45.4%) |
| Office & Administration | 0 (0.0%) | 51 (100.0%) |
| Total (Category) | 47 (34.3%) | 90 (65.7%) |
| Total (Overall) | 268 (48.0%) | 290 (52.0%) |
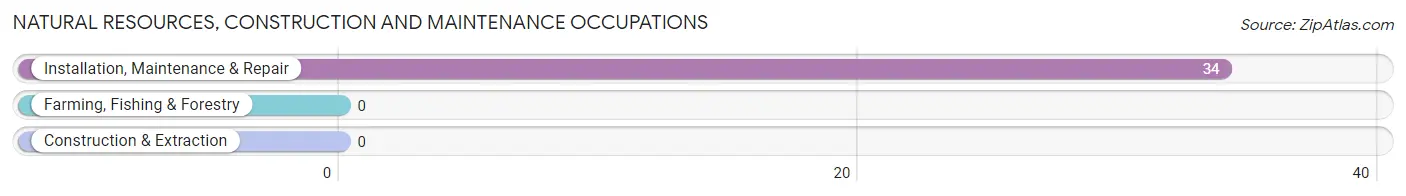
Natural Resources, Construction and Maintenance Occupations
The most common Natural Resources, Construction and Maintenance occupations in Lamar are , and Installation, Maintenance & Repair (34 | 6.1%).
Natural Resources, Construction and Maintenance Occupations by Sex
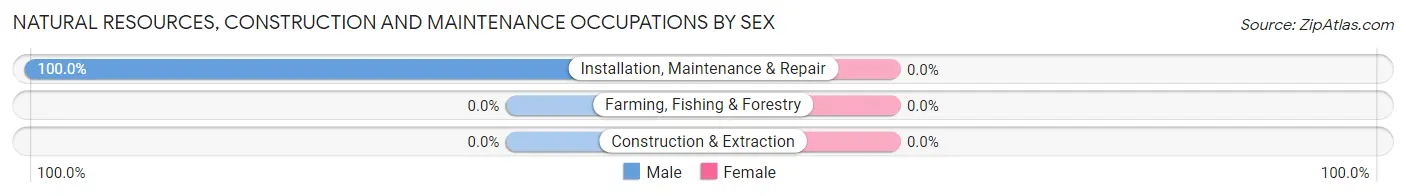
| Occupation | Male | Female |
| Farming, Fishing & Forestry | 0 (0.0%) | 0 (0.0%) |
| Construction & Extraction | 0 (0.0%) | 0 (0.0%) |
| Installation, Maintenance & Repair | 34 (100.0%) | 0 (0.0%) |
| Total (Category) | 34 (100.0%) | 0 (0.0%) |
| Total (Overall) | 268 (48.0%) | 290 (52.0%) |
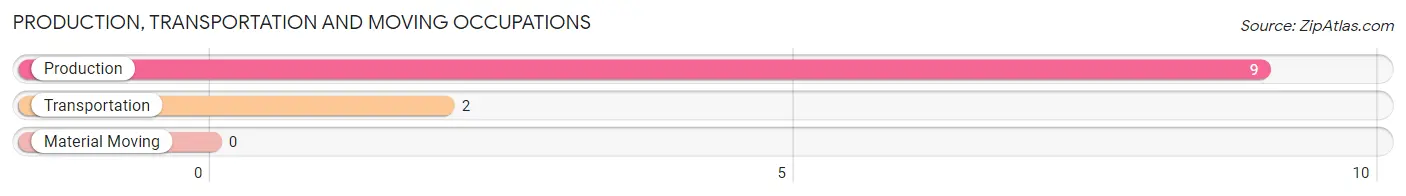
Production, Transportation and Moving Occupations
The most common Production, Transportation and Moving occupations in Lamar are Production (9 | 1.6%), and Transportation (2 | 0.4%).
Production, Transportation and Moving Occupations by Sex
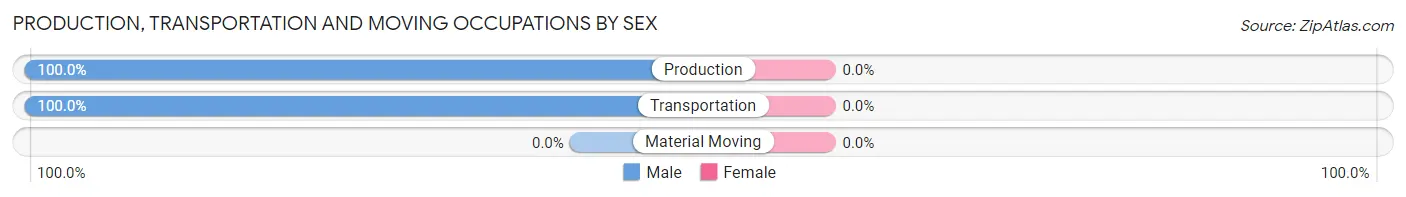
| Occupation | Male | Female |
| Production | 9 (100.0%) | 0 (0.0%) |
| Transportation | 2 (100.0%) | 0 (0.0%) |
| Material Moving | 0 (0.0%) | 0 (0.0%) |
| Total (Category) | 11 (100.0%) | 0 (0.0%) |
| Total (Overall) | 268 (48.0%) | 290 (52.0%) |
Employment Industries by Sex in Lamar
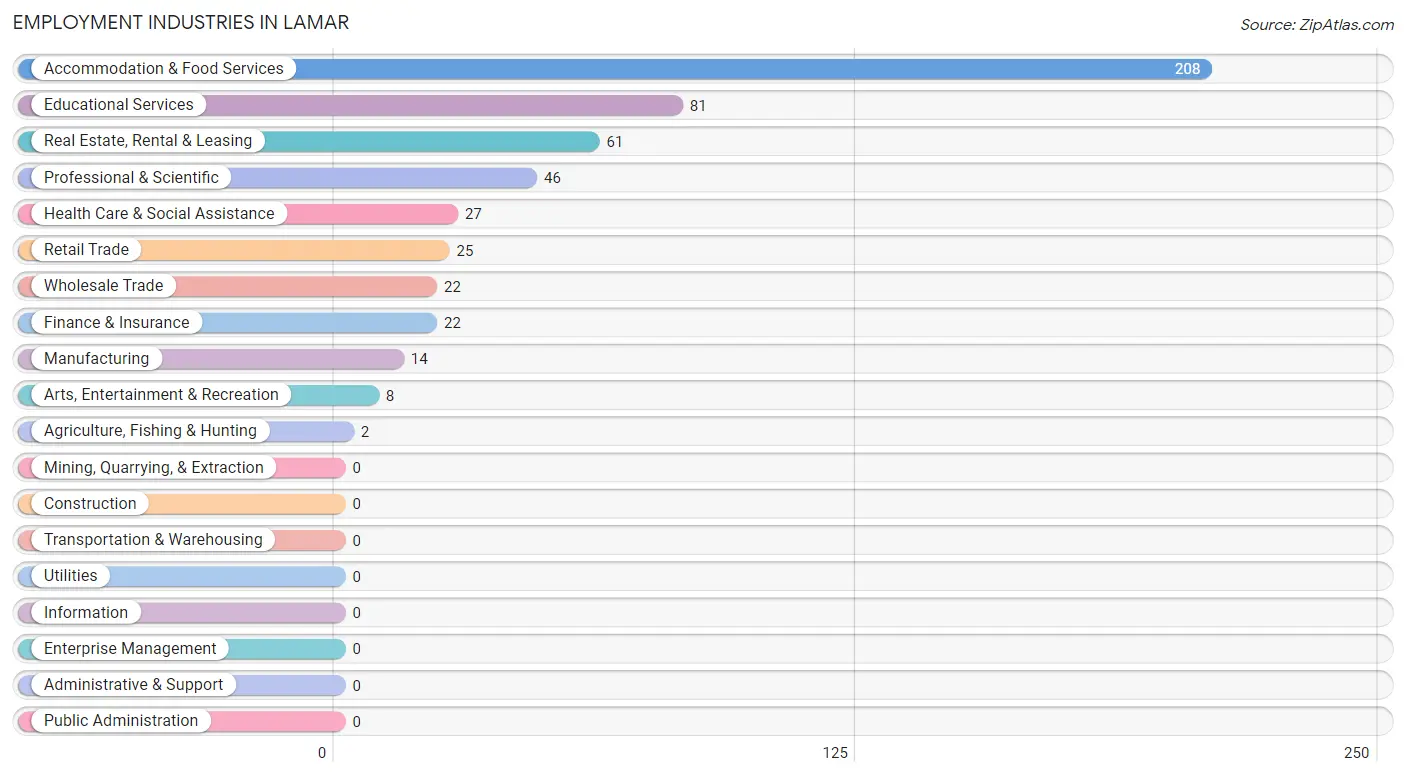
Employment Industries in Lamar
The major employment industries in Lamar include Accommodation & Food Services (208 | 37.3%), Educational Services (81 | 14.5%), Real Estate, Rental & Leasing (61 | 10.9%), Professional & Scientific (46 | 8.2%), and Health Care & Social Assistance (27 | 4.8%).
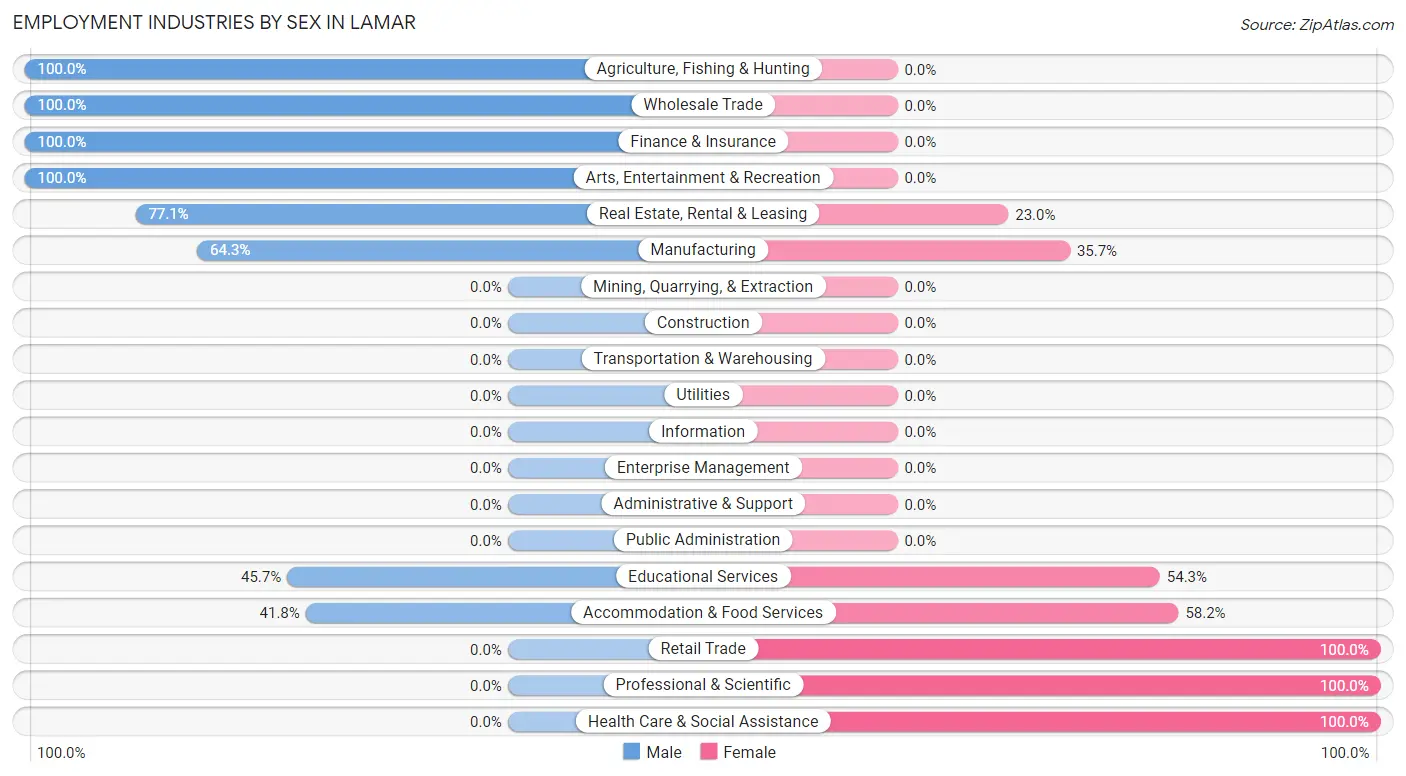
Employment Industries by Sex in Lamar
The Lamar industries that see more men than women are Agriculture, Fishing & Hunting (100.0%), Wholesale Trade (100.0%), and Finance & Insurance (100.0%), whereas the industries that tend to have a higher number of women are Retail Trade (100.0%), Professional & Scientific (100.0%), and Health Care & Social Assistance (100.0%).
| Industry | Male | Female |
| Agriculture, Fishing & Hunting | 2 (100.0%) | 0 (0.0%) |
| Mining, Quarrying, & Extraction | 0 (0.0%) | 0 (0.0%) |
| Construction | 0 (0.0%) | 0 (0.0%) |
| Manufacturing | 9 (64.3%) | 5 (35.7%) |
| Wholesale Trade | 22 (100.0%) | 0 (0.0%) |
| Retail Trade | 0 (0.0%) | 25 (100.0%) |
| Transportation & Warehousing | 0 (0.0%) | 0 (0.0%) |
| Utilities | 0 (0.0%) | 0 (0.0%) |
| Information | 0 (0.0%) | 0 (0.0%) |
| Finance & Insurance | 22 (100.0%) | 0 (0.0%) |
| Real Estate, Rental & Leasing | 47 (77.0%) | 14 (23.0%) |
| Professional & Scientific | 0 (0.0%) | 46 (100.0%) |
| Enterprise Management | 0 (0.0%) | 0 (0.0%) |
| Administrative & Support | 0 (0.0%) | 0 (0.0%) |
| Educational Services | 37 (45.7%) | 44 (54.3%) |
| Health Care & Social Assistance | 0 (0.0%) | 27 (100.0%) |
| Arts, Entertainment & Recreation | 8 (100.0%) | 0 (0.0%) |
| Accommodation & Food Services | 87 (41.8%) | 121 (58.2%) |
| Public Administration | 0 (0.0%) | 0 (0.0%) |
| Total | 268 (48.0%) | 290 (52.0%) |
Education in Lamar
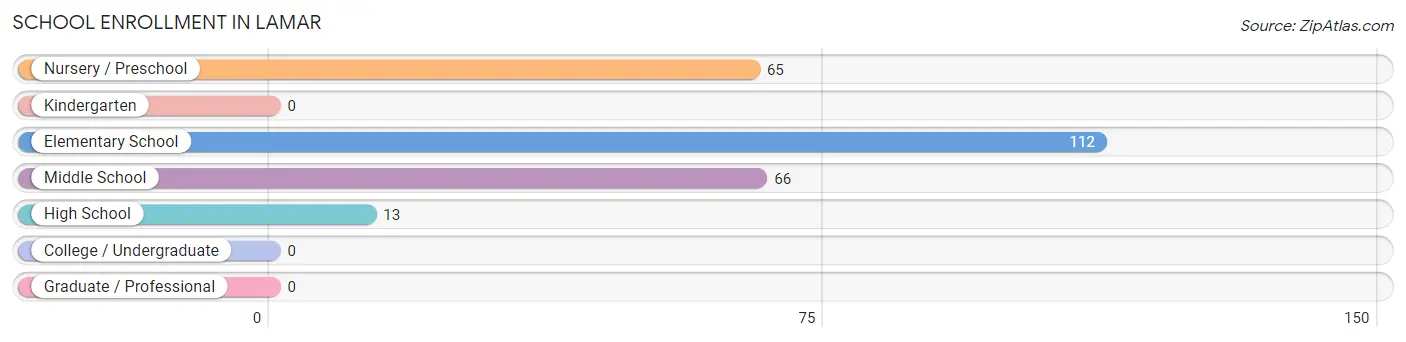
School Enrollment in Lamar
The most common levels of schooling among the 256 students in Lamar are elementary school (112 | 43.8%), middle school (66 | 25.8%), and nursery / preschool (65 | 25.4%).
| School Level | # Students | % Students |
| Nursery / Preschool | 65 | 25.4% |
| Kindergarten | 0 | 0.0% |
| Elementary School | 112 | 43.8% |
| Middle School | 66 | 25.8% |
| High School | 13 | 5.1% |
| College / Undergraduate | 0 | 0.0% |
| Graduate / Professional | 0 | 0.0% |
| Total | 256 | 100.0% |
School Enrollment by Age by Funding Source in Lamar
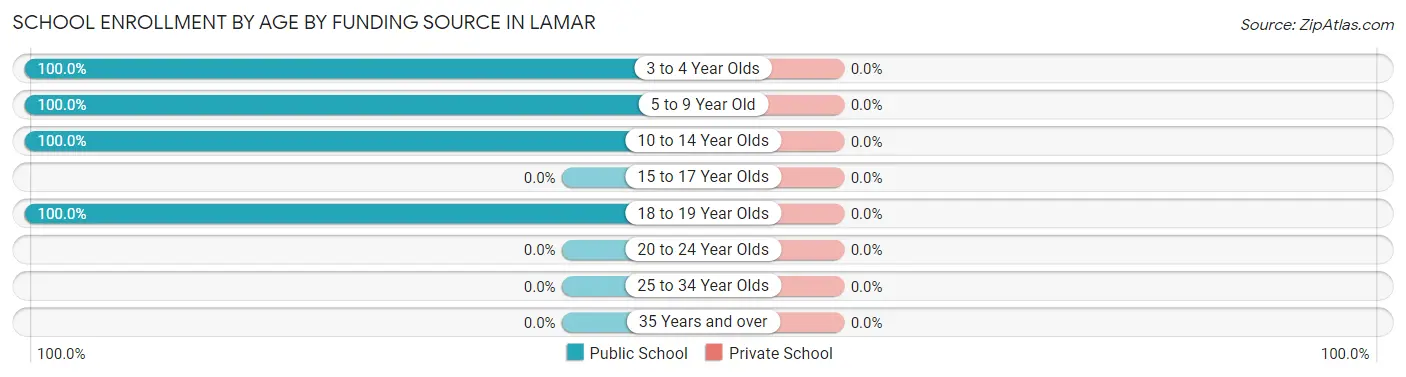
| Age Bracket | Public School | Private School |
| 3 to 4 Year Olds | 65 (100.0%) | 0 (0.0%) |
| 5 to 9 Year Old | 83 (100.0%) | 0 (0.0%) |
| 10 to 14 Year Olds | 95 (100.0%) | 0 (0.0%) |
| 15 to 17 Year Olds | 0 (0.0%) | 0 (0.0%) |
| 18 to 19 Year Olds | 13 (100.0%) | 0 (0.0%) |
| 20 to 24 Year Olds | 0 (0.0%) | 0 (0.0%) |
| 25 to 34 Year Olds | 0 (0.0%) | 0 (0.0%) |
| 35 Years and over | 0 (0.0%) | 0 (0.0%) |
| Total | 256 (100.0%) | 0 (0.0%) |
Educational Attainment by Field of Study in Lamar
Liberal arts & history (100 | 25.8%), business (78 | 20.1%), bio, nature & agricultural (71 | 18.3%), education (71 | 18.3%), and science & technology (25 | 6.4%) are the most common fields of study among 388 individuals in Lamar who have obtained a bachelor's degree or higher.
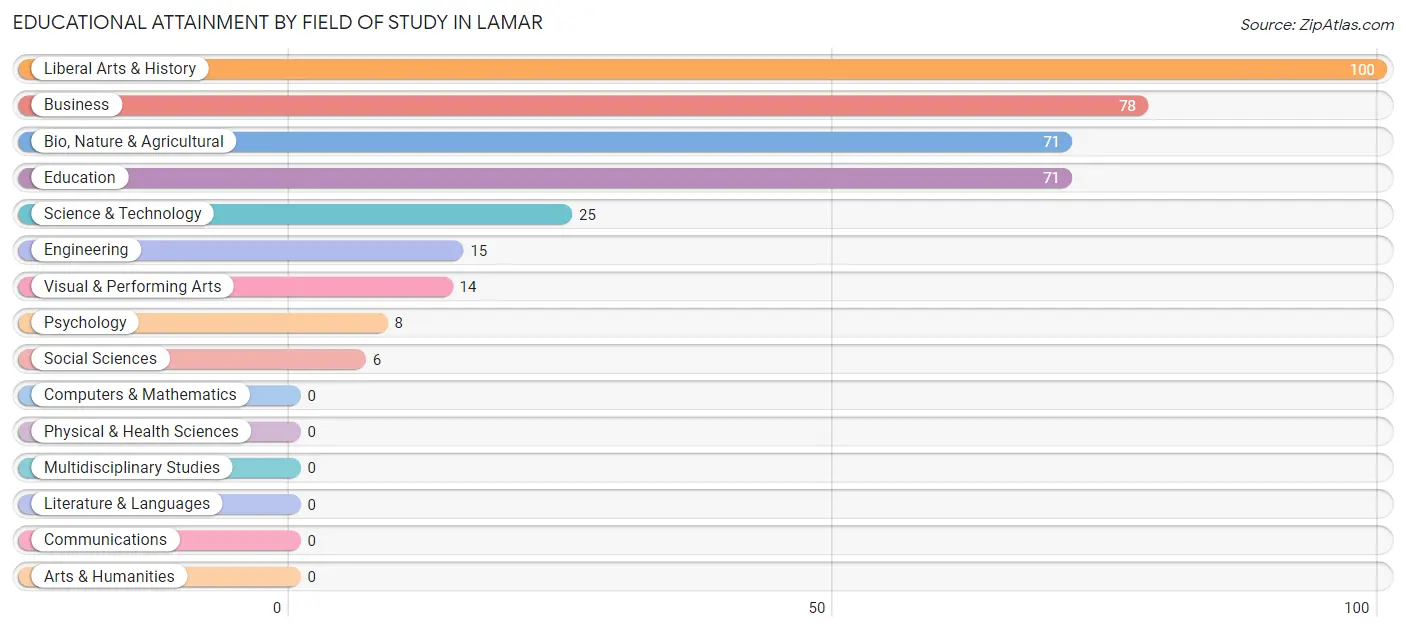
| Field of Study | # Graduates | % Graduates |
| Computers & Mathematics | 0 | 0.0% |
| Bio, Nature & Agricultural | 71 | 18.3% |
| Physical & Health Sciences | 0 | 0.0% |
| Psychology | 8 | 2.1% |
| Social Sciences | 6 | 1.5% |
| Engineering | 15 | 3.9% |
| Multidisciplinary Studies | 0 | 0.0% |
| Science & Technology | 25 | 6.4% |
| Business | 78 | 20.1% |
| Education | 71 | 18.3% |
| Literature & Languages | 0 | 0.0% |
| Liberal Arts & History | 100 | 25.8% |
| Visual & Performing Arts | 14 | 3.6% |
| Communications | 0 | 0.0% |
| Arts & Humanities | 0 | 0.0% |
| Total | 388 | 100.0% |
Transportation & Commute in Lamar
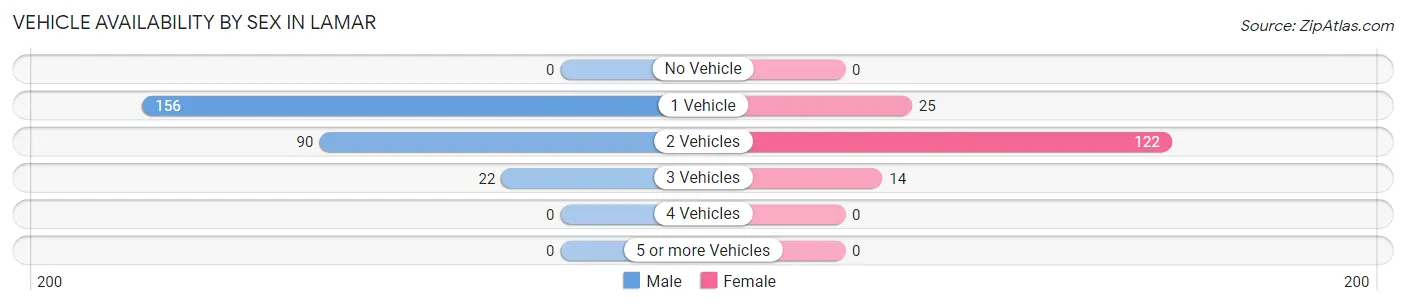
Vehicle Availability by Sex in Lamar
The most prevalent vehicle ownership categories in Lamar are males with 1 vehicle (156, accounting for 58.2%) and females with 1 vehicle (25, making up 96.9%).
| Vehicles Available | Male | Female |
| No Vehicle | 0 (0.0%) | 0 (0.0%) |
| 1 Vehicle | 156 (58.2%) | 25 (15.5%) |
| 2 Vehicles | 90 (33.6%) | 122 (75.8%) |
| 3 Vehicles | 22 (8.2%) | 14 (8.7%) |
| 4 Vehicles | 0 (0.0%) | 0 (0.0%) |
| 5 or more Vehicles | 0 (0.0%) | 0 (0.0%) |
| Total | 268 (100.0%) | 161 (100.0%) |
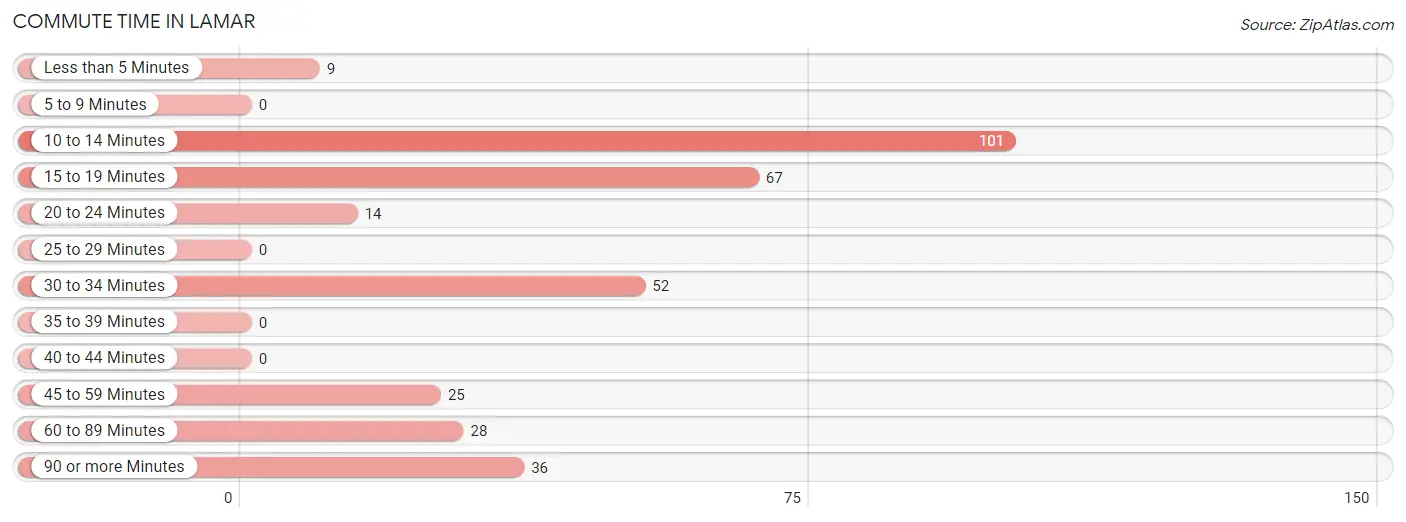
Commute Time in Lamar
The most frequently occuring commute durations in Lamar are 10 to 14 minutes (101 commuters, 30.4%), 15 to 19 minutes (67 commuters, 20.2%), and 30 to 34 minutes (52 commuters, 15.7%).
| Commute Time | # Commuters | % Commuters |
| Less than 5 Minutes | 9 | 2.7% |
| 5 to 9 Minutes | 0 | 0.0% |
| 10 to 14 Minutes | 101 | 30.4% |
| 15 to 19 Minutes | 67 | 20.2% |
| 20 to 24 Minutes | 14 | 4.2% |
| 25 to 29 Minutes | 0 | 0.0% |
| 30 to 34 Minutes | 52 | 15.7% |
| 35 to 39 Minutes | 0 | 0.0% |
| 40 to 44 Minutes | 0 | 0.0% |
| 45 to 59 Minutes | 25 | 7.5% |
| 60 to 89 Minutes | 28 | 8.4% |
| 90 or more Minutes | 36 | 10.8% |
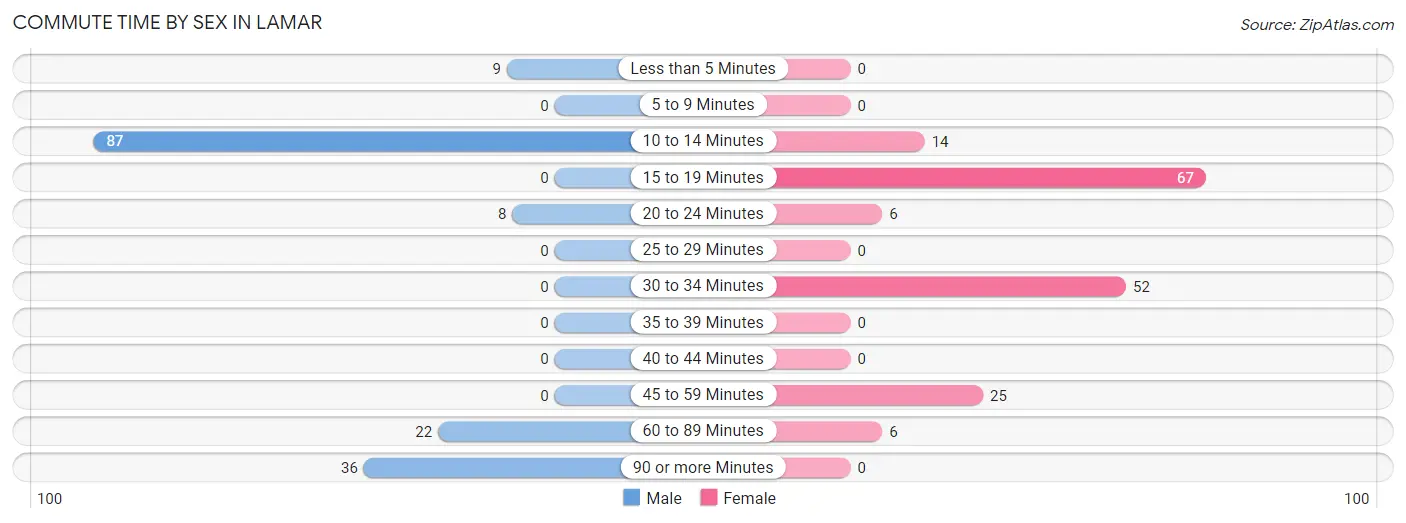
Commute Time by Sex in Lamar
The most common commute times in Lamar are 10 to 14 minutes (87 commuters, 53.7%) for males and 15 to 19 minutes (67 commuters, 39.4%) for females.
| Commute Time | Male | Female |
| Less than 5 Minutes | 9 (5.6%) | 0 (0.0%) |
| 5 to 9 Minutes | 0 (0.0%) | 0 (0.0%) |
| 10 to 14 Minutes | 87 (53.7%) | 14 (8.2%) |
| 15 to 19 Minutes | 0 (0.0%) | 67 (39.4%) |
| 20 to 24 Minutes | 8 (4.9%) | 6 (3.5%) |
| 25 to 29 Minutes | 0 (0.0%) | 0 (0.0%) |
| 30 to 34 Minutes | 0 (0.0%) | 52 (30.6%) |
| 35 to 39 Minutes | 0 (0.0%) | 0 (0.0%) |
| 40 to 44 Minutes | 0 (0.0%) | 0 (0.0%) |
| 45 to 59 Minutes | 0 (0.0%) | 25 (14.7%) |
| 60 to 89 Minutes | 22 (13.6%) | 6 (3.5%) |
| 90 or more Minutes | 36 (22.2%) | 0 (0.0%) |
Time of Departure to Work by Sex in Lamar
The most frequent times of departure to work in Lamar are 9:00 AM to 9:59 AM (87, 53.7%) for males and 4:00 PM to 11:59 PM (111, 65.3%) for females.
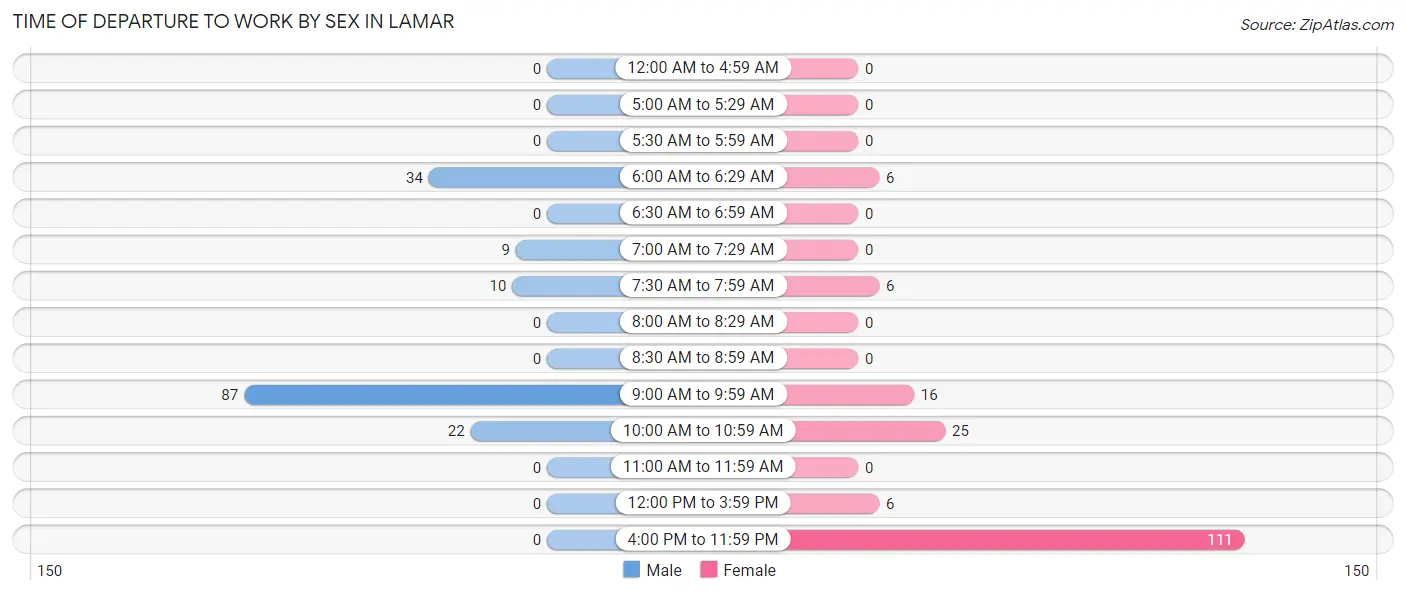
| Time of Departure | Male | Female |
| 12:00 AM to 4:59 AM | 0 (0.0%) | 0 (0.0%) |
| 5:00 AM to 5:29 AM | 0 (0.0%) | 0 (0.0%) |
| 5:30 AM to 5:59 AM | 0 (0.0%) | 0 (0.0%) |
| 6:00 AM to 6:29 AM | 34 (21.0%) | 6 (3.5%) |
| 6:30 AM to 6:59 AM | 0 (0.0%) | 0 (0.0%) |
| 7:00 AM to 7:29 AM | 9 (5.6%) | 0 (0.0%) |
| 7:30 AM to 7:59 AM | 10 (6.2%) | 6 (3.5%) |
| 8:00 AM to 8:29 AM | 0 (0.0%) | 0 (0.0%) |
| 8:30 AM to 8:59 AM | 0 (0.0%) | 0 (0.0%) |
| 9:00 AM to 9:59 AM | 87 (53.7%) | 16 (9.4%) |
| 10:00 AM to 10:59 AM | 22 (13.6%) | 25 (14.7%) |
| 11:00 AM to 11:59 AM | 0 (0.0%) | 0 (0.0%) |
| 12:00 PM to 3:59 PM | 0 (0.0%) | 6 (3.5%) |
| 4:00 PM to 11:59 PM | 0 (0.0%) | 111 (65.3%) |
| Total | 162 (100.0%) | 170 (100.0%) |
Housing Occupancy in Lamar
Occupancy by Ownership in Lamar
Of the total 701 dwellings in Lamar, owner-occupied units account for 555 (79.2%), while renter-occupied units make up 146 (20.8%).
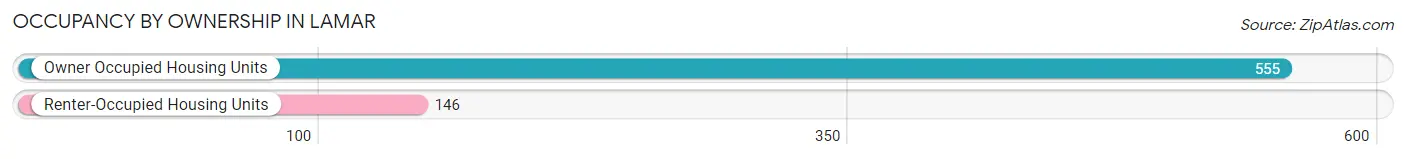
| Occupancy | # Housing Units | % Housing Units |
| Owner Occupied Housing Units | 555 | 79.2% |
| Renter-Occupied Housing Units | 146 | 20.8% |
| Total Occupied Housing Units | 701 | 100.0% |
Occupancy by Household Size in Lamar
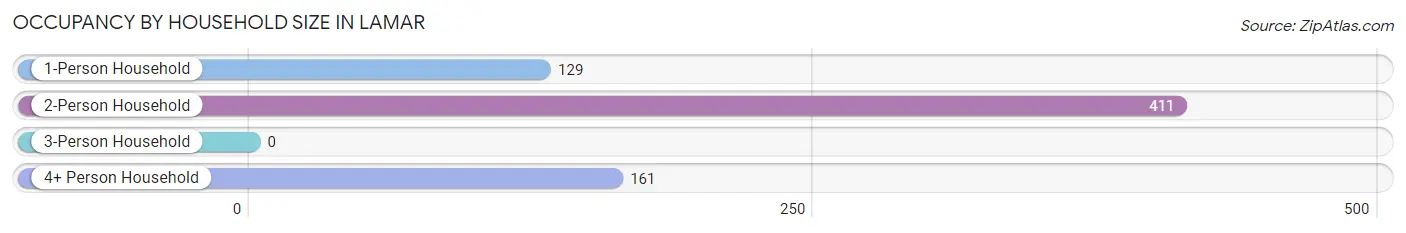
| Household Size | # Housing Units | % Housing Units |
| 1-Person Household | 129 | 18.4% |
| 2-Person Household | 411 | 58.6% |
| 3-Person Household | 0 | 0.0% |
| 4+ Person Household | 161 | 23.0% |
| Total Housing Units | 701 | 100.0% |
Occupancy by Ownership by Household Size in Lamar
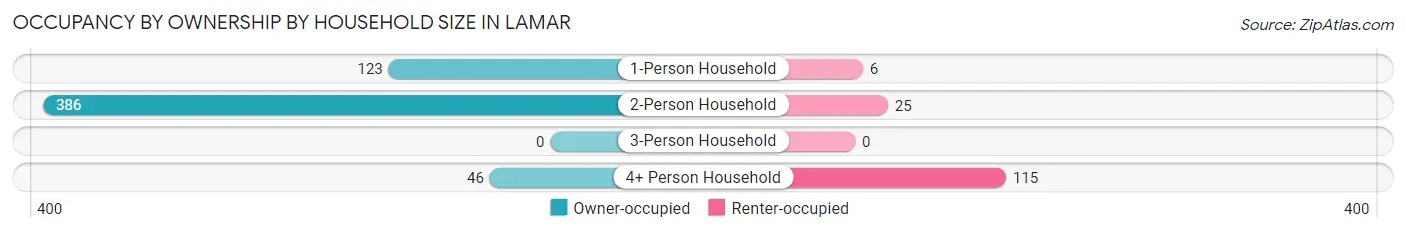
| Household Size | Owner-occupied | Renter-occupied |
| 1-Person Household | 123 (95.4%) | 6 (4.6%) |
| 2-Person Household | 386 (93.9%) | 25 (6.1%) |
| 3-Person Household | 0 (0.0%) | 0 (0.0%) |
| 4+ Person Household | 46 (28.6%) | 115 (71.4%) |
| Total Housing Units | 555 (79.2%) | 146 (20.8%) |
Occupancy by Educational Attainment in Lamar
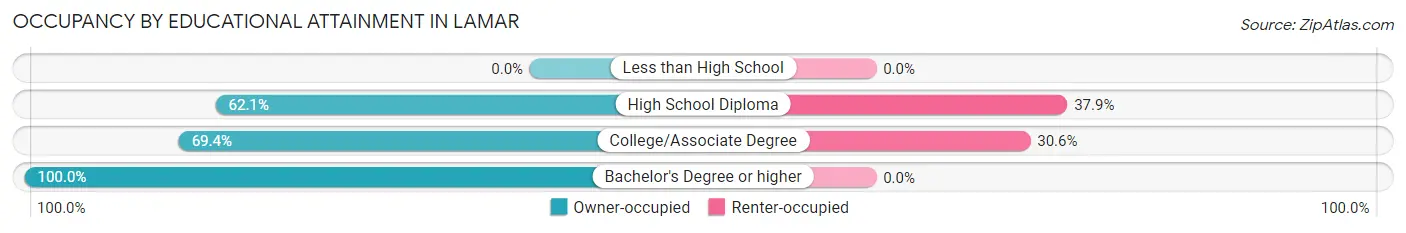
| Household Size | Owner-occupied | Renter-occupied |
| Less than High School | 0 (0.0%) | 0 (0.0%) |
| High School Diploma | 41 (62.1%) | 25 (37.9%) |
| College/Associate Degree | 275 (69.4%) | 121 (30.6%) |
| Bachelor's Degree or higher | 239 (100.0%) | 0 (0.0%) |
Occupancy by Age of Householder in Lamar
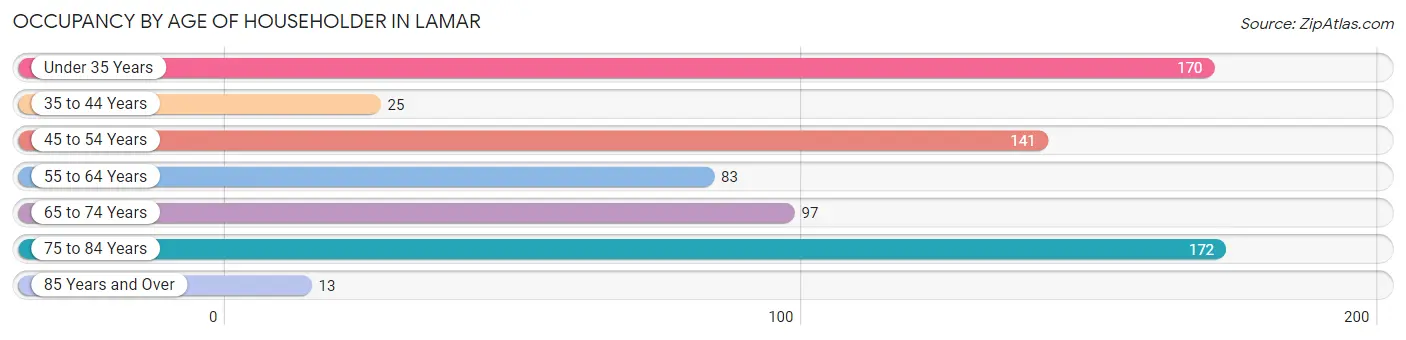
| Age Bracket | # Households | % Households |
| Under 35 Years | 170 | 24.2% |
| 35 to 44 Years | 25 | 3.6% |
| 45 to 54 Years | 141 | 20.1% |
| 55 to 64 Years | 83 | 11.8% |
| 65 to 74 Years | 97 | 13.8% |
| 75 to 84 Years | 172 | 24.5% |
| 85 Years and Over | 13 | 1.8% |
| Total | 701 | 100.0% |
Housing Finances in Lamar
Median Income by Occupancy in Lamar
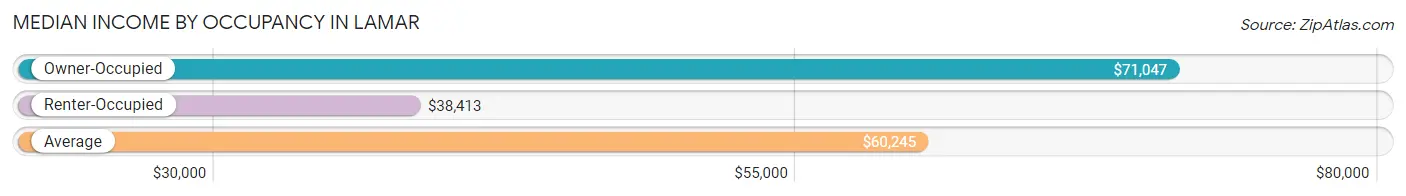
| Occupancy Type | # Households | Median Income |
| Owner-Occupied | 555 (79.2%) | $71,047 |
| Renter-Occupied | 146 (20.8%) | $38,413 |
| Average | 701 (100.0%) | $60,245 |
Occupancy by Householder Income Bracket in Lamar
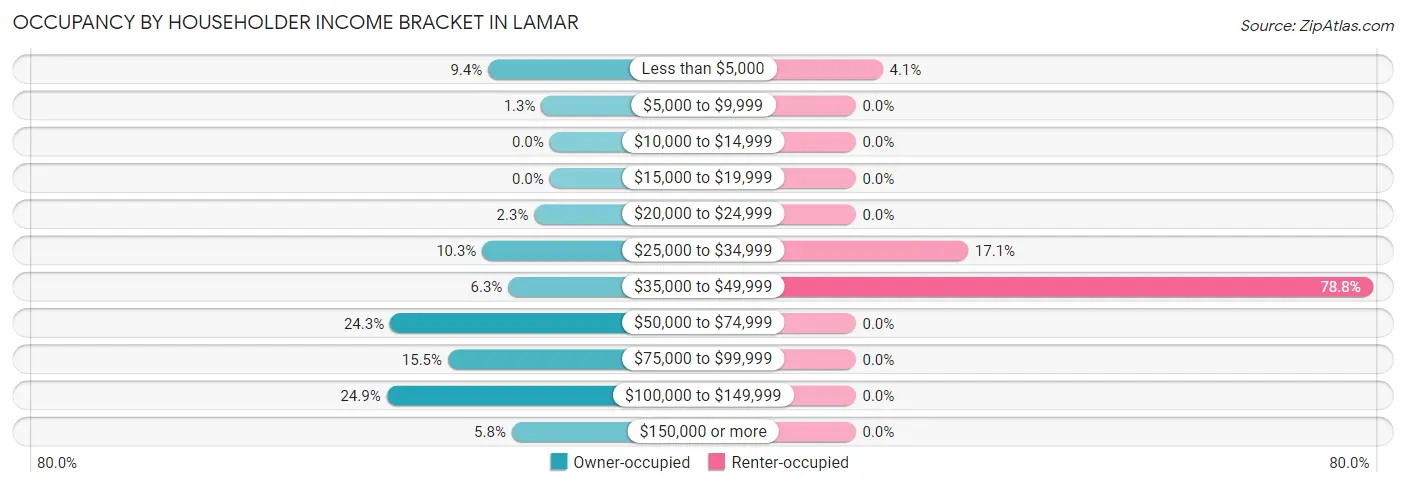
| Income Bracket | Owner-occupied | Renter-occupied |
| Less than $5,000 | 52 (9.4%) | 6 (4.1%) |
| $5,000 to $9,999 | 7 (1.3%) | 0 (0.0%) |
| $10,000 to $14,999 | 0 (0.0%) | 0 (0.0%) |
| $15,000 to $19,999 | 0 (0.0%) | 0 (0.0%) |
| $20,000 to $24,999 | 13 (2.3%) | 0 (0.0%) |
| $25,000 to $34,999 | 57 (10.3%) | 25 (17.1%) |
| $35,000 to $49,999 | 35 (6.3%) | 115 (78.8%) |
| $50,000 to $74,999 | 135 (24.3%) | 0 (0.0%) |
| $75,000 to $99,999 | 86 (15.5%) | 0 (0.0%) |
| $100,000 to $149,999 | 138 (24.9%) | 0 (0.0%) |
| $150,000 or more | 32 (5.8%) | 0 (0.0%) |
| Total | 555 (100.0%) | 146 (100.0%) |
Monthly Housing Cost Tiers in Lamar
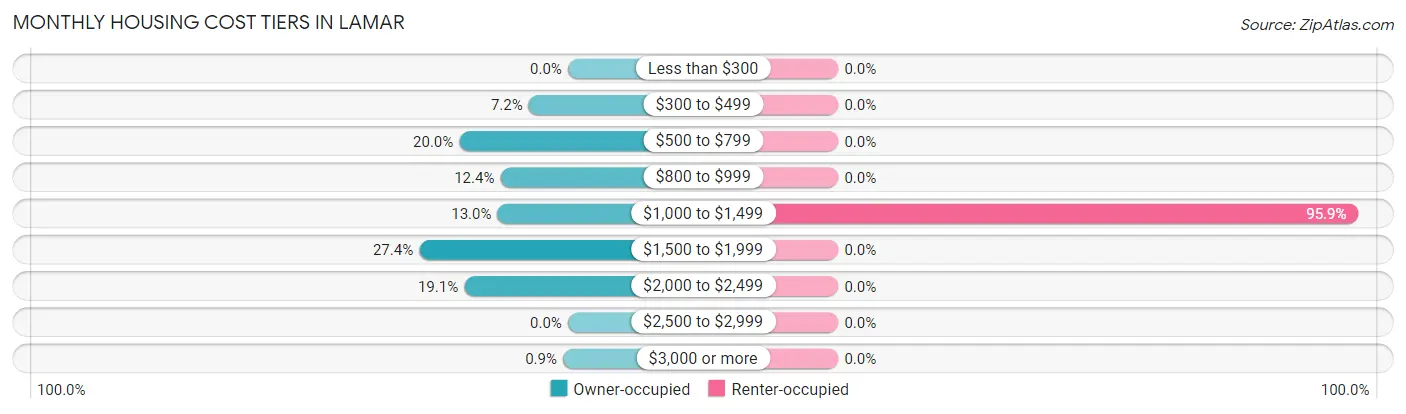
| Monthly Cost | Owner-occupied | Renter-occupied |
| Less than $300 | 0 (0.0%) | 0 (0.0%) |
| $300 to $499 | 40 (7.2%) | 0 (0.0%) |
| $500 to $799 | 111 (20.0%) | 0 (0.0%) |
| $800 to $999 | 69 (12.4%) | 0 (0.0%) |
| $1,000 to $1,499 | 72 (13.0%) | 140 (95.9%) |
| $1,500 to $1,999 | 152 (27.4%) | 0 (0.0%) |
| $2,000 to $2,499 | 106 (19.1%) | 0 (0.0%) |
| $2,500 to $2,999 | 0 (0.0%) | 0 (0.0%) |
| $3,000 or more | 5 (0.9%) | 0 (0.0%) |
| Total | 555 (100.0%) | 146 (100.0%) |
Physical Housing Characteristics in Lamar
Housing Structures in Lamar
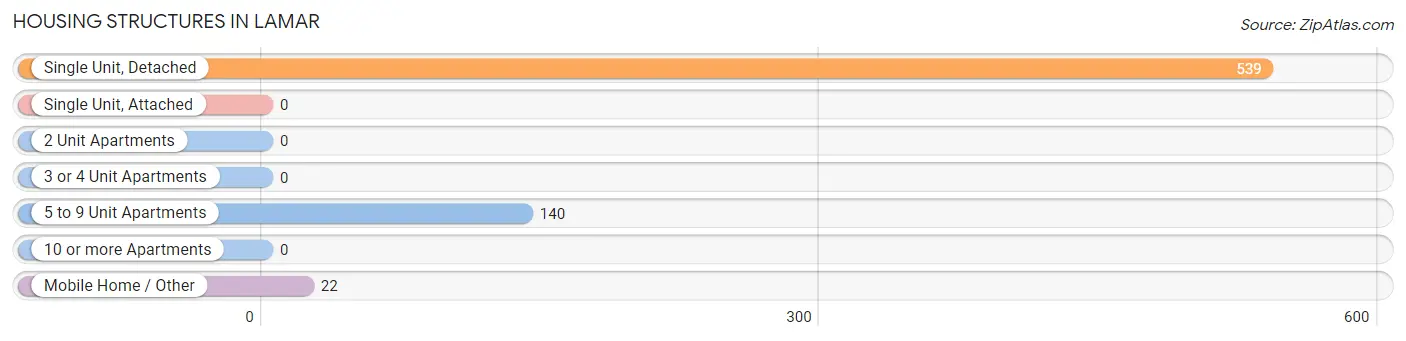
| Structure Type | # Housing Units | % Housing Units |
| Single Unit, Detached | 539 | 76.9% |
| Single Unit, Attached | 0 | 0.0% |
| 2 Unit Apartments | 0 | 0.0% |
| 3 or 4 Unit Apartments | 0 | 0.0% |
| 5 to 9 Unit Apartments | 140 | 20.0% |
| 10 or more Apartments | 0 | 0.0% |
| Mobile Home / Other | 22 | 3.1% |
| Total | 701 | 100.0% |
Housing Structures by Occupancy in Lamar
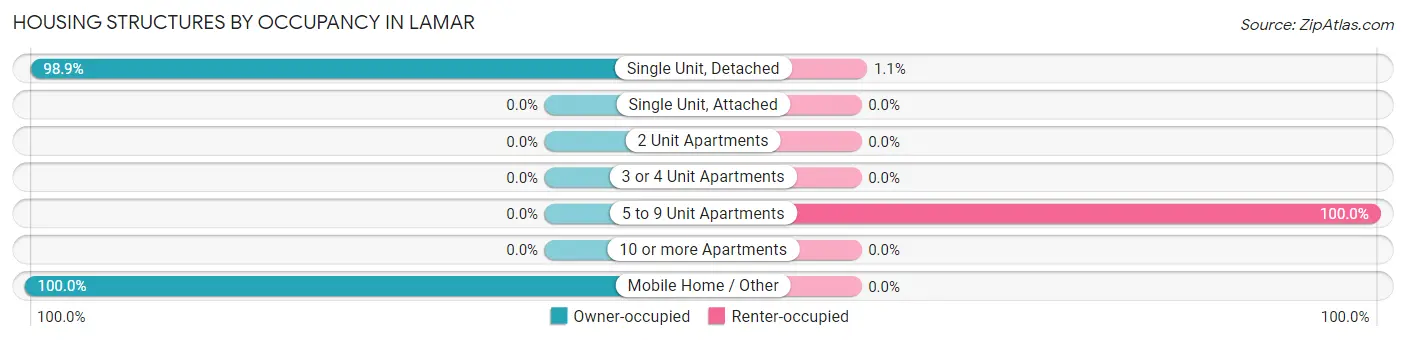
| Structure Type | Owner-occupied | Renter-occupied |
| Single Unit, Detached | 533 (98.9%) | 6 (1.1%) |
| Single Unit, Attached | 0 (0.0%) | 0 (0.0%) |
| 2 Unit Apartments | 0 (0.0%) | 0 (0.0%) |
| 3 or 4 Unit Apartments | 0 (0.0%) | 0 (0.0%) |
| 5 to 9 Unit Apartments | 0 (0.0%) | 140 (100.0%) |
| 10 or more Apartments | 0 (0.0%) | 0 (0.0%) |
| Mobile Home / Other | 22 (100.0%) | 0 (0.0%) |
| Total | 555 (79.2%) | 146 (20.8%) |
Housing Structures by Number of Rooms in Lamar
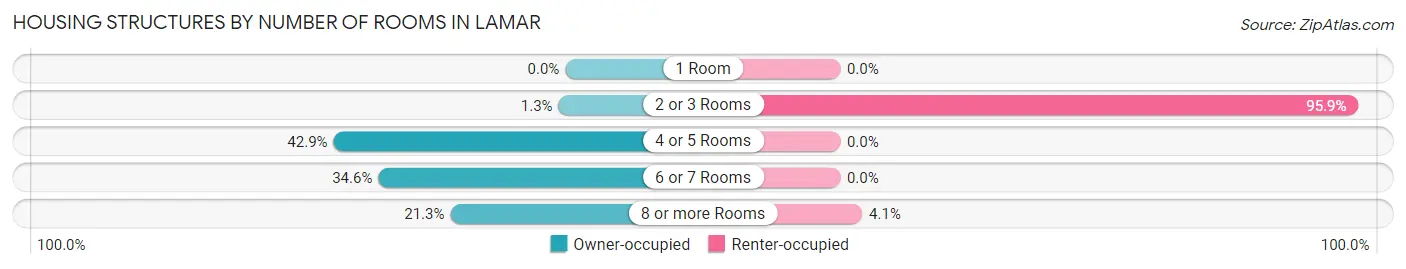
| Number of Rooms | Owner-occupied | Renter-occupied |
| 1 Room | 0 (0.0%) | 0 (0.0%) |
| 2 or 3 Rooms | 7 (1.3%) | 140 (95.9%) |
| 4 or 5 Rooms | 238 (42.9%) | 0 (0.0%) |
| 6 or 7 Rooms | 192 (34.6%) | 0 (0.0%) |
| 8 or more Rooms | 118 (21.3%) | 6 (4.1%) |
| Total | 555 (100.0%) | 146 (100.0%) |
Housing Structure by Heating Type in Lamar
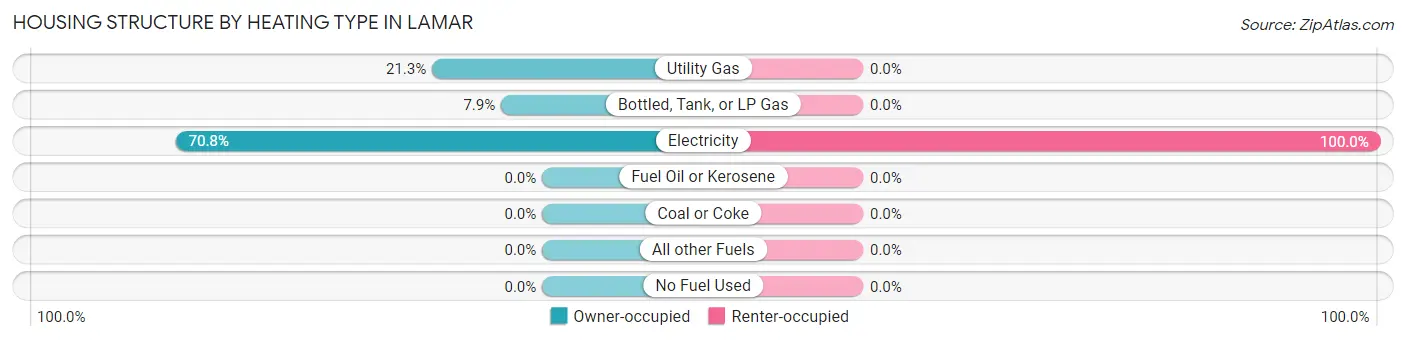
| Heating Type | Owner-occupied | Renter-occupied |
| Utility Gas | 118 (21.3%) | 0 (0.0%) |
| Bottled, Tank, or LP Gas | 44 (7.9%) | 0 (0.0%) |
| Electricity | 393 (70.8%) | 146 (100.0%) |
| Fuel Oil or Kerosene | 0 (0.0%) | 0 (0.0%) |
| Coal or Coke | 0 (0.0%) | 0 (0.0%) |
| All other Fuels | 0 (0.0%) | 0 (0.0%) |
| No Fuel Used | 0 (0.0%) | 0 (0.0%) |
| Total | 555 (100.0%) | 146 (100.0%) |
Household Vehicle Usage in Lamar
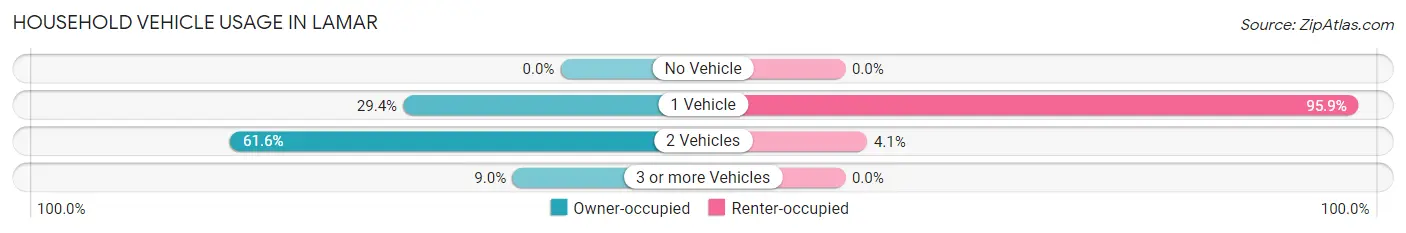
| Vehicles per Household | Owner-occupied | Renter-occupied |
| No Vehicle | 0 (0.0%) | 0 (0.0%) |
| 1 Vehicle | 163 (29.4%) | 140 (95.9%) |
| 2 Vehicles | 342 (61.6%) | 6 (4.1%) |
| 3 or more Vehicles | 50 (9.0%) | 0 (0.0%) |
| Total | 555 (100.0%) | 146 (100.0%) |
Real Estate & Mortgages in Lamar
Real Estate and Mortgage Overview in Lamar
| Characteristic | Without Mortgage | With Mortgage |
| Housing Units | 249 | 306 |
| Median Property Value | $423,800 | $263,800 |
| Median Household Income | $61,031 | $8 |
| Monthly Housing Costs | $792 | $5 |
| Real Estate Taxes | $5,193 | $0 |
Property Value by Mortgage Status in Lamar
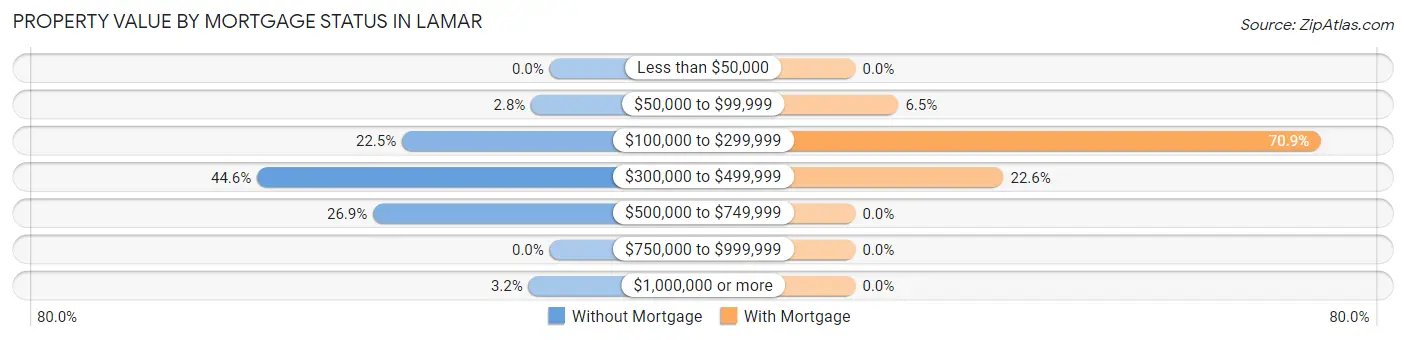
| Property Value | Without Mortgage | With Mortgage |
| Less than $50,000 | 0 (0.0%) | 0 (0.0%) |
| $50,000 to $99,999 | 7 (2.8%) | 20 (6.5%) |
| $100,000 to $299,999 | 56 (22.5%) | 217 (70.9%) |
| $300,000 to $499,999 | 111 (44.6%) | 69 (22.6%) |
| $500,000 to $749,999 | 67 (26.9%) | 0 (0.0%) |
| $750,000 to $999,999 | 0 (0.0%) | 0 (0.0%) |
| $1,000,000 or more | 8 (3.2%) | 0 (0.0%) |
| Total | 249 (100.0%) | 306 (100.0%) |
Household Income by Mortgage Status in Lamar
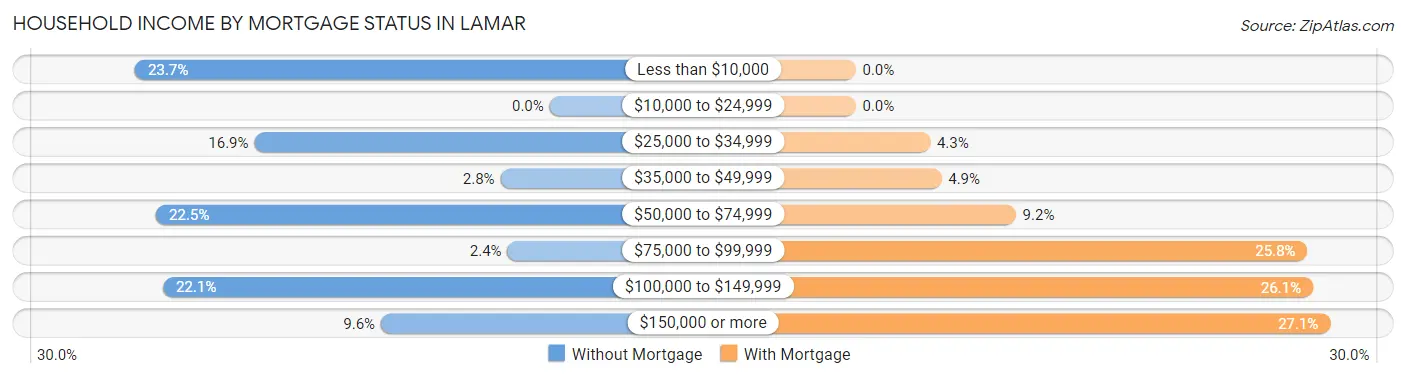
| Household Income | Without Mortgage | With Mortgage |
| Less than $10,000 | 59 (23.7%) | 0 (0.0%) |
| $10,000 to $24,999 | 0 (0.0%) | 0 (0.0%) |
| $25,000 to $34,999 | 42 (16.9%) | 13 (4.3%) |
| $35,000 to $49,999 | 7 (2.8%) | 15 (4.9%) |
| $50,000 to $74,999 | 56 (22.5%) | 28 (9.1%) |
| $75,000 to $99,999 | 6 (2.4%) | 79 (25.8%) |
| $100,000 to $149,999 | 55 (22.1%) | 80 (26.1%) |
| $150,000 or more | 24 (9.6%) | 83 (27.1%) |
| Total | 249 (100.0%) | 306 (100.0%) |
Property Value to Household Income Ratio in Lamar
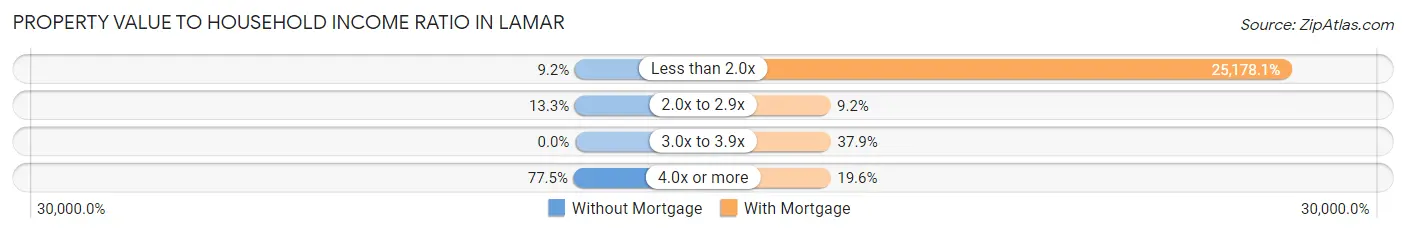
| Value-to-Income Ratio | Without Mortgage | With Mortgage |
| Less than 2.0x | 23 (9.2%) | 77,045 (25,178.1%) |
| 2.0x to 2.9x | 33 (13.3%) | 28 (9.1%) |
| 3.0x to 3.9x | 0 (0.0%) | 116 (37.9%) |
| 4.0x or more | 193 (77.5%) | 60 (19.6%) |
| Total | 249 (100.0%) | 306 (100.0%) |
Real Estate Taxes by Mortgage Status in Lamar
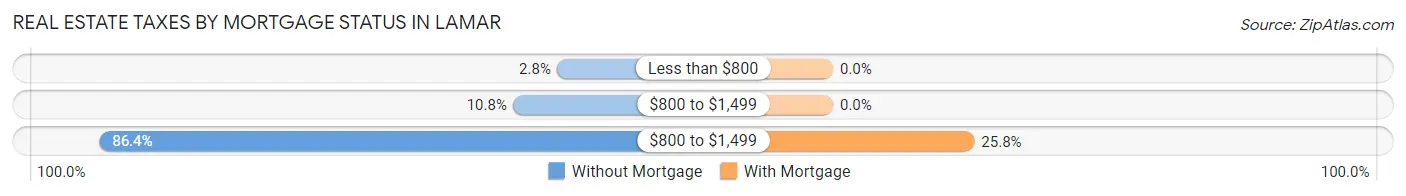
| Property Taxes | Without Mortgage | With Mortgage |
| Less than $800 | 7 (2.8%) | 0 (0.0%) |
| $800 to $1,499 | 27 (10.8%) | 0 (0.0%) |
| $800 to $1,499 | 215 (86.4%) | 79 (25.8%) |
| Total | 249 (100.0%) | 306 (100.0%) |
Health & Disability in Lamar
Health Insurance Coverage by Age in Lamar
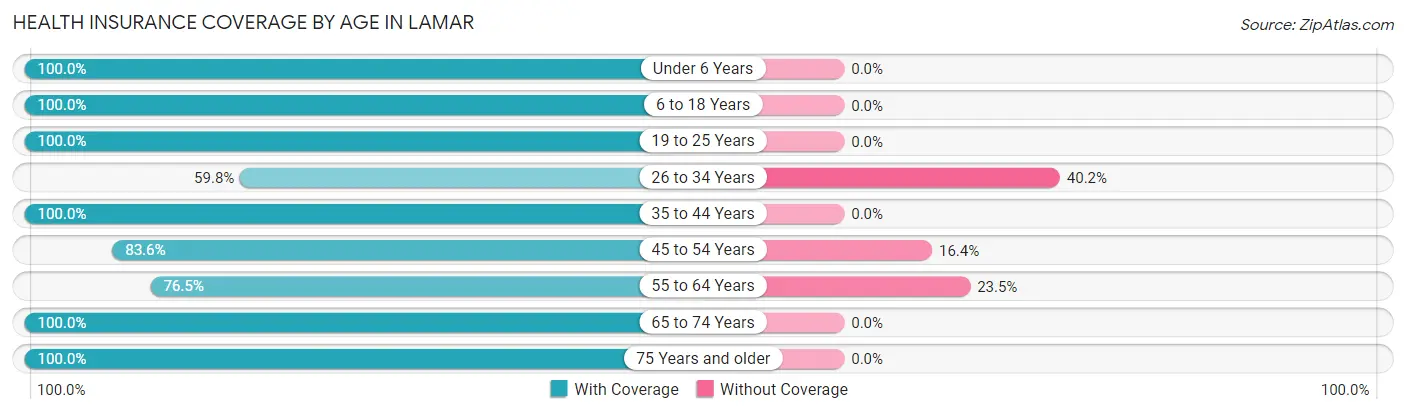
| Age Bracket | With Coverage | Without Coverage |
| Under 6 Years | 130 (100.0%) | 0 (0.0%) |
| 6 to 18 Years | 191 (100.0%) | 0 (0.0%) |
| 19 to 25 Years | 6 (100.0%) | 0 (0.0%) |
| 26 to 34 Years | 180 (59.8%) | 121 (40.2%) |
| 35 to 44 Years | 27 (100.0%) | 0 (0.0%) |
| 45 to 54 Years | 184 (83.6%) | 36 (16.4%) |
| 55 to 64 Years | 176 (76.5%) | 54 (23.5%) |
| 65 to 74 Years | 163 (100.0%) | 0 (0.0%) |
| 75 Years and older | 291 (100.0%) | 0 (0.0%) |
| Total | 1,348 (86.5%) | 211 (13.5%) |
Health Insurance Coverage by Citizenship Status in Lamar
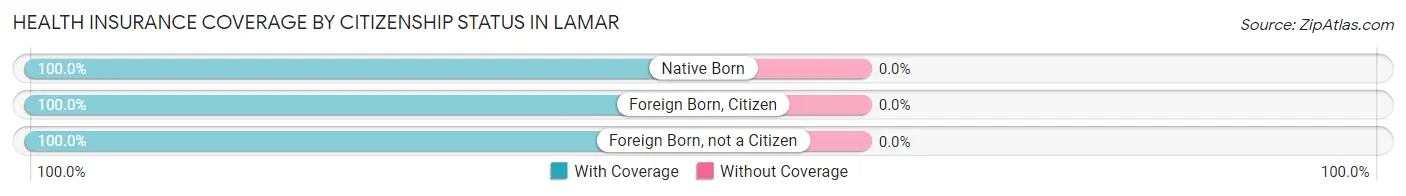
| Citizenship Status | With Coverage | Without Coverage |
| Native Born | 130 (100.0%) | 0 (0.0%) |
| Foreign Born, Citizen | 191 (100.0%) | 0 (0.0%) |
| Foreign Born, not a Citizen | 6 (100.0%) | 0 (0.0%) |
Health Insurance Coverage by Household Income in Lamar
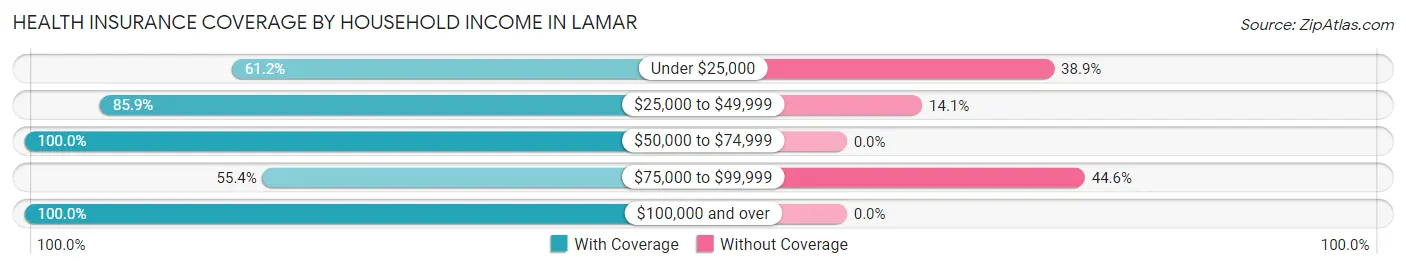
| Household Income | With Coverage | Without Coverage |
| Under $25,000 | 85 (61.2%) | 54 (38.9%) |
| $25,000 to $49,999 | 529 (85.9%) | 87 (14.1%) |
| $50,000 to $74,999 | 294 (100.0%) | 0 (0.0%) |
| $75,000 to $99,999 | 87 (55.4%) | 70 (44.6%) |
| $100,000 and over | 332 (100.0%) | 0 (0.0%) |
Public vs Private Health Insurance Coverage by Age in Lamar
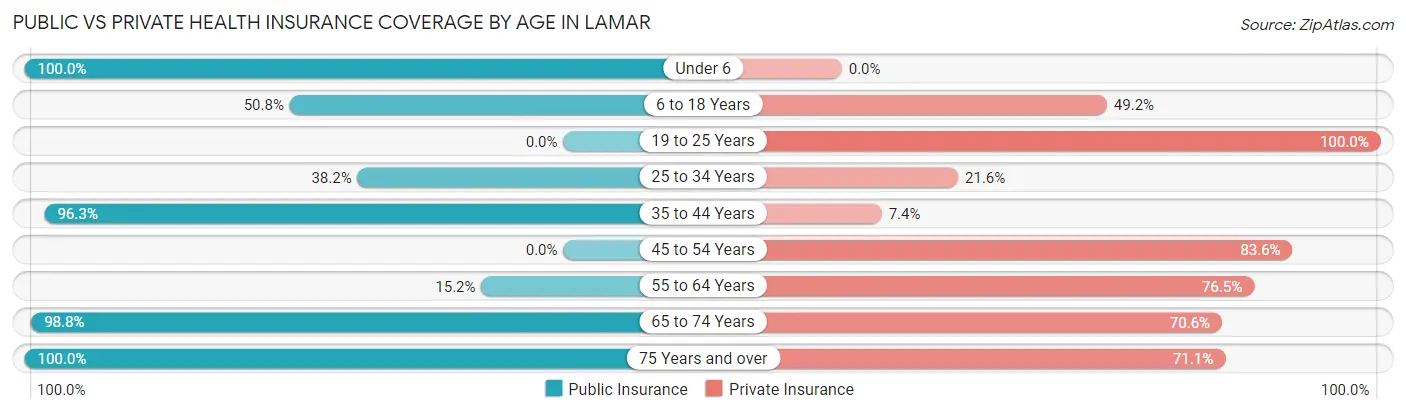
| Age Bracket | Public Insurance | Private Insurance |
| Under 6 | 130 (100.0%) | 0 (0.0%) |
| 6 to 18 Years | 97 (50.8%) | 94 (49.2%) |
| 19 to 25 Years | 0 (0.0%) | 6 (100.0%) |
| 25 to 34 Years | 115 (38.2%) | 65 (21.6%) |
| 35 to 44 Years | 26 (96.3%) | 2 (7.4%) |
| 45 to 54 Years | 0 (0.0%) | 184 (83.6%) |
| 55 to 64 Years | 35 (15.2%) | 176 (76.5%) |
| 65 to 74 Years | 161 (98.8%) | 115 (70.6%) |
| 75 Years and over | 291 (100.0%) | 207 (71.1%) |
| Total | 855 (54.8%) | 849 (54.5%) |
Disability Status by Sex by Age in Lamar
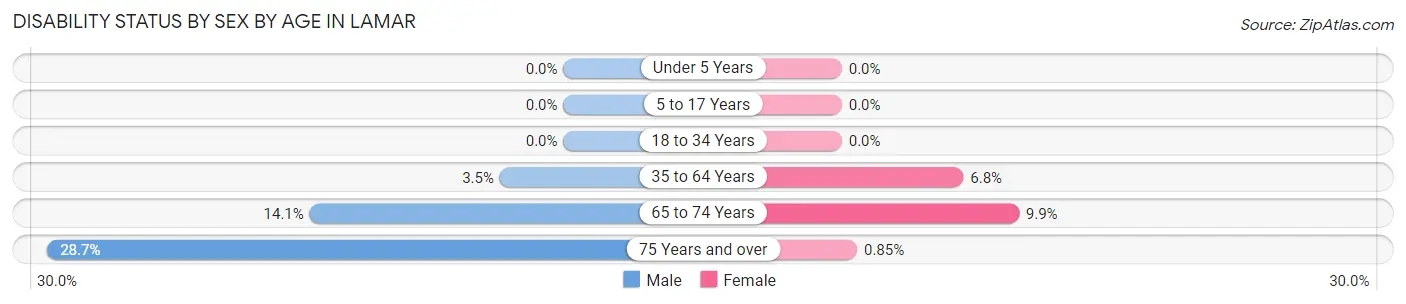
| Age Bracket | Male | Female |
| Under 5 Years | 0 (0.0%) | 0 (0.0%) |
| 5 to 17 Years | 0 (0.0%) | 0 (0.0%) |
| 18 to 34 Years | 0 (0.0%) | 0 (0.0%) |
| 35 to 64 Years | 8 (3.5%) | 17 (6.8%) |
| 65 to 74 Years | 13 (14.1%) | 7 (9.9%) |
| 75 Years and over | 50 (28.7%) | 1 (0.9%) |
Disability Class by Sex by Age in Lamar
Disability Class: Hearing Difficulty
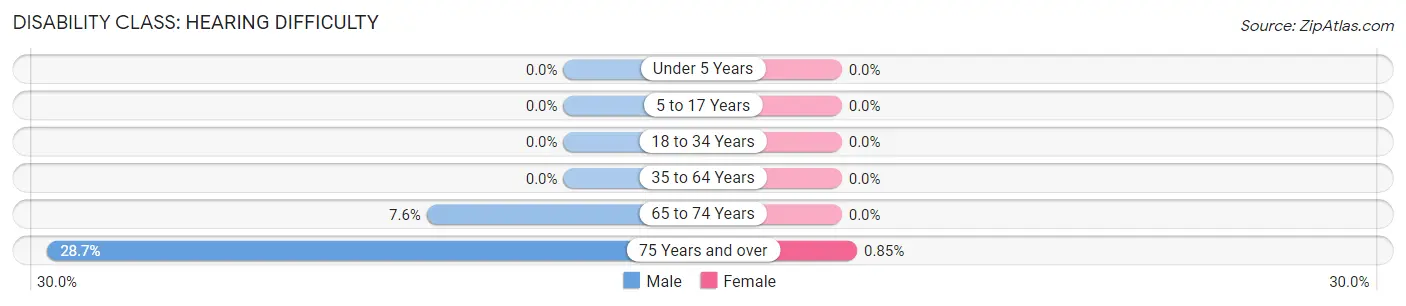
| Age Bracket | Male | Female |
| Under 5 Years | 0 (0.0%) | 0 (0.0%) |
| 5 to 17 Years | 0 (0.0%) | 0 (0.0%) |
| 18 to 34 Years | 0 (0.0%) | 0 (0.0%) |
| 35 to 64 Years | 0 (0.0%) | 0 (0.0%) |
| 65 to 74 Years | 7 (7.6%) | 0 (0.0%) |
| 75 Years and over | 50 (28.7%) | 1 (0.9%) |
Disability Class: Vision Difficulty
| Age Bracket | Male | Female |
| Under 5 Years | 0 (0.0%) | 0 (0.0%) |
| 5 to 17 Years | 0 (0.0%) | 0 (0.0%) |
| 18 to 34 Years | 0 (0.0%) | 0 (0.0%) |
| 35 to 64 Years | 0 (0.0%) | 0 (0.0%) |
| 65 to 74 Years | 0 (0.0%) | 0 (0.0%) |
| 75 Years and over | 0 (0.0%) | 0 (0.0%) |
Disability Class: Cognitive Difficulty
| Age Bracket | Male | Female |
| 5 to 17 Years | 0 (0.0%) | 0 (0.0%) |
| 18 to 34 Years | 0 (0.0%) | 0 (0.0%) |
| 35 to 64 Years | 1 (0.4%) | 0 (0.0%) |
| 65 to 74 Years | 0 (0.0%) | 0 (0.0%) |
| 75 Years and over | 0 (0.0%) | 0 (0.0%) |
Disability Class: Ambulatory Difficulty
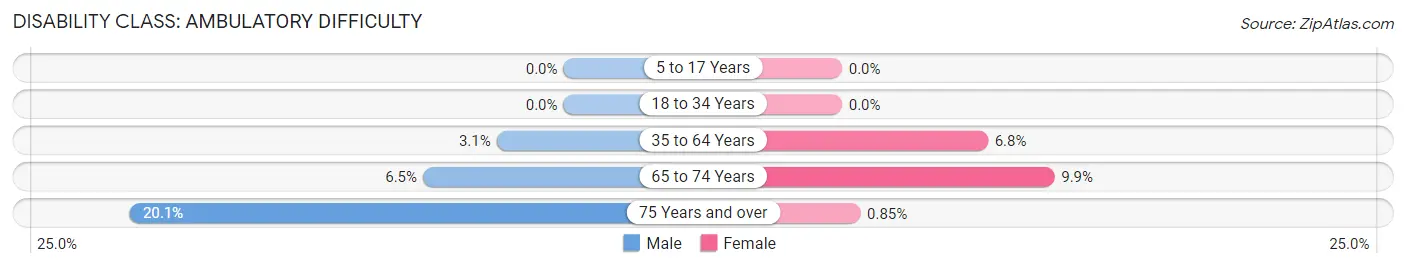
| Age Bracket | Male | Female |
| 5 to 17 Years | 0 (0.0%) | 0 (0.0%) |
| 18 to 34 Years | 0 (0.0%) | 0 (0.0%) |
| 35 to 64 Years | 7 (3.1%) | 17 (6.8%) |
| 65 to 74 Years | 6 (6.5%) | 7 (9.9%) |
| 75 Years and over | 35 (20.1%) | 1 (0.9%) |
Disability Class: Self-Care Difficulty
| Age Bracket | Male | Female |
| 5 to 17 Years | 0 (0.0%) | 0 (0.0%) |
| 18 to 34 Years | 0 (0.0%) | 0 (0.0%) |
| 35 to 64 Years | 0 (0.0%) | 17 (6.8%) |
| 65 to 74 Years | 0 (0.0%) | 0 (0.0%) |
| 75 Years and over | 0 (0.0%) | 0 (0.0%) |
Technology Access in Lamar
Computing Device Access in Lamar
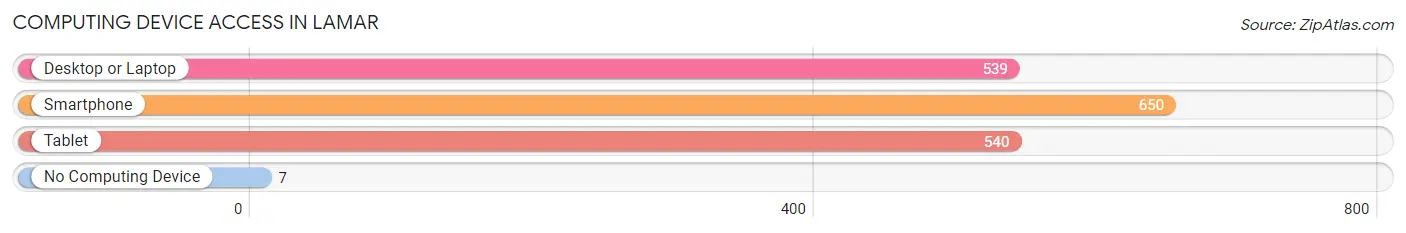
| Device Type | # Households | % Households |
| Desktop or Laptop | 539 | 76.9% |
| Smartphone | 650 | 92.7% |
| Tablet | 540 | 77.0% |
| No Computing Device | 7 | 1.0% |
| Total | 701 | 100.0% |
Internet Access in Lamar
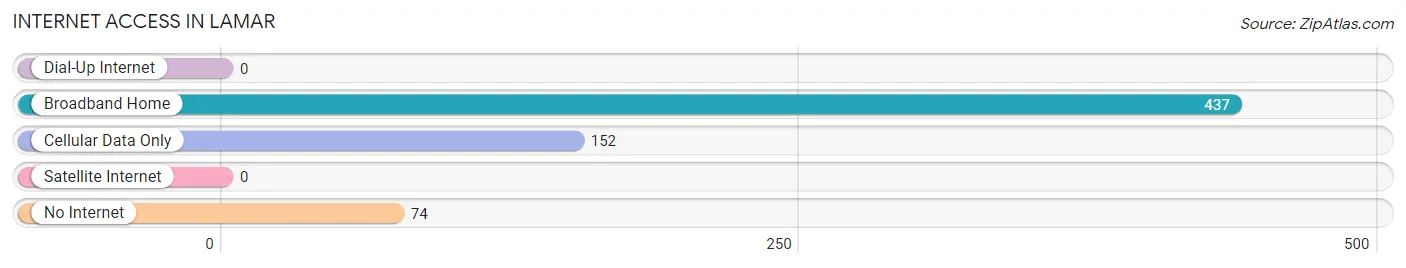
| Internet Type | # Households | % Households |
| Dial-Up Internet | 0 | 0.0% |
| Broadband Home | 437 | 62.3% |
| Cellular Data Only | 152 | 21.7% |
| Satellite Internet | 0 | 0.0% |
| No Internet | 74 | 10.6% |
| Total | 701 | 100.0% |
Lamar Summary
Lamar, Texas is a small town located in the northeast corner of Texas, near the Oklahoma border. It is the county seat of Lamar County and is part of the Paris, Texas Metropolitan Statistical Area. The town was founded in 1841 and has a population of approximately 8,000 people.
History
Lamar was founded in 1841 by a group of settlers from Kentucky and Tennessee. The town was named after Mirabeau B. Lamar, the second president of the Republic of Texas. The town was originally located on the Red River, but was moved to its current location in 1843.
In 1845, Lamar County was created and Lamar was named the county seat. The town was incorporated in 1846 and the first courthouse was built in 1848.
The town grew slowly until the arrival of the railroad in 1876. The railroad brought new businesses and industries to the area, and the population began to grow.
In the early 1900s, Lamar was a thriving agricultural center. Cotton, corn, and wheat were the main crops grown in the area. The town also had several sawmills and a brick factory.
In the 1950s, the town began to decline as the railroad industry declined. The population decreased and many businesses closed.
In the late 1970s, the town began to experience a resurgence. The economy began to diversify and new businesses opened. The population began to grow again and the town began to experience a period of growth.
Geography
Lamar is located in the northeast corner of Texas, near the Oklahoma border. It is situated on the Red River, which forms the border between Texas and Oklahoma. The town is located in Lamar County and is part of the Paris, Texas Metropolitan Statistical Area.
The town has a total area of 4.2 square miles, all of which is land. The terrain is mostly flat with some rolling hills. The climate is humid subtropical, with hot summers and mild winters.
Economy
The economy of Lamar is largely based on agriculture and manufacturing. The town is home to several large agricultural operations, including cotton, corn, and wheat farms. The town also has several manufacturing plants, including a paper mill and a plastics factory.
The town also has a thriving retail sector, with several stores and restaurants. The town is also home to several banks and financial institutions.
Demographics
As of the 2010 census, the population of Lamar was 8,004. The racial makeup of the town was 79.3% White, 15.3% African American, 0.7% Native American, 0.4% Asian, 0.1% Pacific Islander, and 3.2% from other races. Hispanic or Latino of any race were 6.3% of the population.
The median household income in Lamar was $35,945, and the median family income was $41,944. The per capita income was $17,845. About 17.3% of the population was below the poverty line.
Common Questions
What is Per Capita Income in Lamar?
Per Capita income in Lamar is $31,613.
What is the Median Household income in Lamar?
Median Household Income in Lamar is $60,245.
What is Inequality or Gini Index in Lamar?
Inequality or Gini Index in Lamar is 0.39.
What is the Total Population of Lamar?
Total Population of Lamar is 1,559.
What is the Total Male Population of Lamar?
Total Male Population of Lamar is 661.
What is the Total Female Population of Lamar?
Total Female Population of Lamar is 898.
What is the Ratio of Males per 100 Females in Lamar?
There are 73.61 Males per 100 Females in Lamar.
What is the Ratio of Females per 100 Males in Lamar?
There are 135.85 Females per 100 Males in Lamar.
What is the Median Population Age in Lamar?
Median Population Age in Lamar is 51.1 Years.
What is the Average Family Size in Lamar
Average Family Size in Lamar is 2.4 People.
What is the Average Household Size in Lamar
Average Household Size in Lamar is 2.2 People.
How Large is the Labor Force in Lamar?
There are 565 People in the Labor Forcein in Lamar.
What is the Percentage of People in the Labor Force in Lamar?
45.2% of People are in the Labor Force in Lamar.
What is the Unemployment Rate in Lamar?
Unemployment Rate in Lamar is 1.2%.