Cities with the Highest Percentage of Immigrants from Italy in the United States
RELATED REPORTS & OPTIONS
Italy
United States
Compare Cities
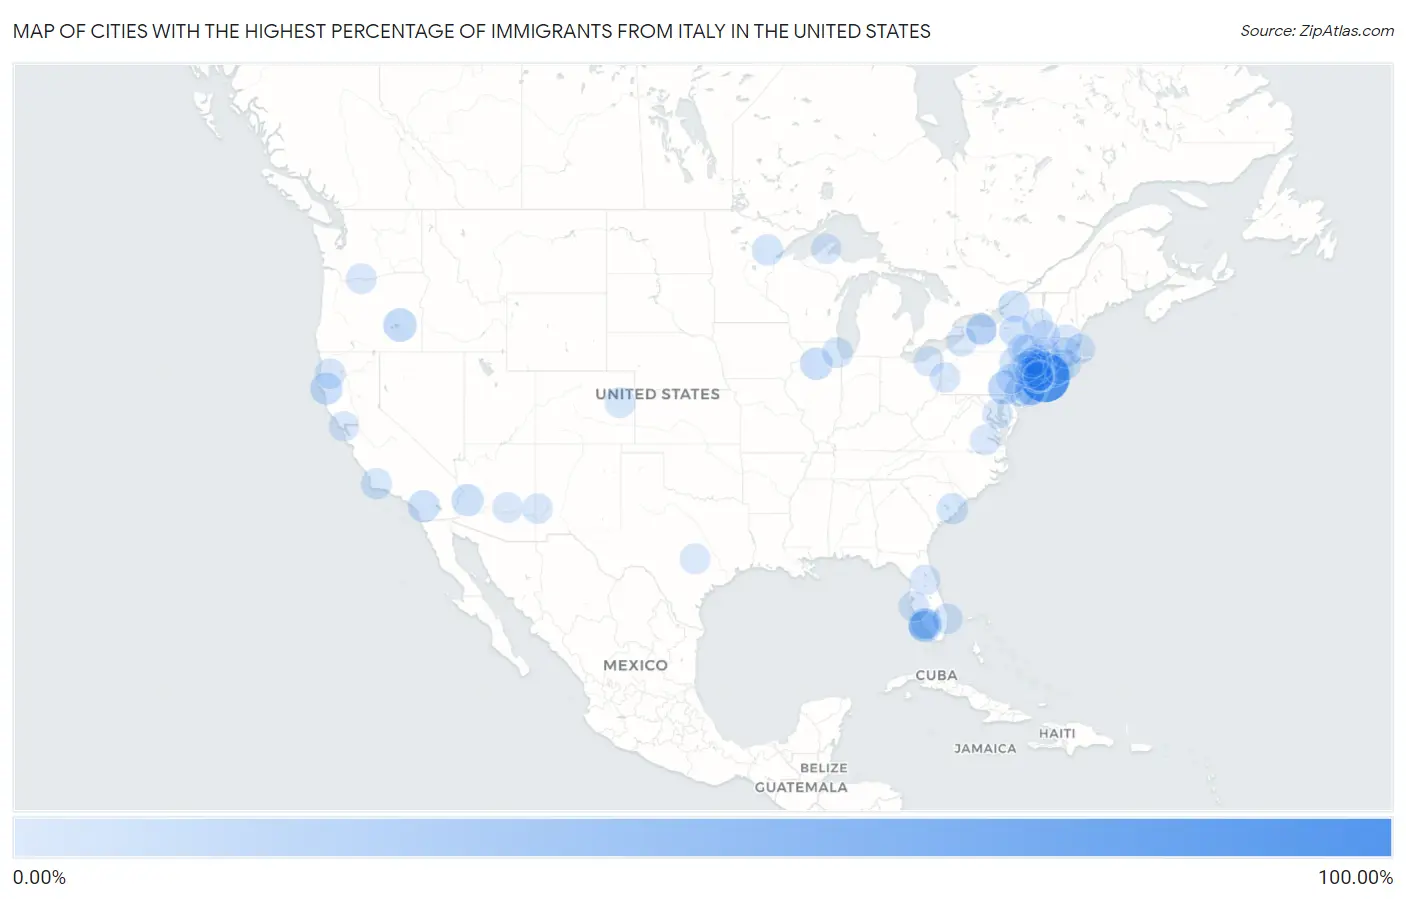
Map of Cities with the Highest Percentage of Immigrants from Italy in the United States
0.00%
100.00%
Cities with the Highest Percentage of Immigrants from Italy in the United States
| City | Italy | vs State | vs National | |
| 1. | Saltaire | 100.00% | 0.41%(+99.6)#1 | 0.095%(+99.9)#1 |
| 2. | Chimney Hill | 44.74% | 0.048%(+44.7)#1 | 0.095%(+44.6)#2 |
| 3. | East Earl | 19.58% | 0.13%(+19.5)#1 | 0.095%(+19.5)#3 |
| 4. | Crane | 16.88% | 0.035%(+16.8)#1 | 0.095%(+16.8)#4 |
| 5. | Le Raysville Borough | 13.84% | 0.13%(+13.7)#2 | 0.095%(+13.7)#5 |
| 6. | Verona Walk | 13.18% | 0.14%(+13.0)#1 | 0.095%(+13.1)#6 |
| 7. | Hollowayville | 12.20% | 0.12%(+12.1)#1 | 0.095%(+12.1)#7 |
| 8. | Seeley | 11.25% | 0.36%(+10.9)#1 | 0.095%(+11.2)#8 |
| 9. | Benbow | 11.11% | 0.080%(+11.0)#1 | 0.095%(+11.0)#9 |
| 10. | Cream Ridge | 10.21% | 0.36%(+9.85)#2 | 0.095%(+10.1)#10 |
| 11. | Vicksburg | 10.13% | 0.058%(+10.1)#1 | 0.095%(+10.0)#11 |
| 12. | Aguanga | 9.95% | 0.080%(+9.87)#2 | 0.095%(+9.86)#12 |
| 13. | Renaissance At Monroe | 9.84% | 0.36%(+9.48)#3 | 0.095%(+9.75)#13 |
| 14. | Mountain Dale | 9.23% | 0.41%(+8.82)#2 | 0.095%(+9.14)#14 |
| 15. | Greenvale | 8.93% | 0.41%(+8.53)#3 | 0.095%(+8.84)#15 |
| 16. | Hailesboro | 8.29% | 0.41%(+7.89)#4 | 0.095%(+8.20)#16 |
| 17. | Washington Mills | 7.91% | 0.41%(+7.50)#5 | 0.095%(+7.81)#17 |
| 18. | Island Walk | 7.39% | 0.14%(+7.25)#2 | 0.095%(+7.30)#18 |
| 19. | North Lynbrook | 7.23% | 0.41%(+6.83)#6 | 0.095%(+7.14)#19 |
| 20. | The Hideout | 6.86% | 0.13%(+6.73)#3 | 0.095%(+6.77)#20 |
| 21. | Meadowlands | 6.67% | 0.017%(+6.65)#1 | 0.095%(+6.57)#21 |
| 22. | Ontario | 6.54% | 0.017%(+6.52)#1 | 0.095%(+6.45)#22 |
| 23. | Watch Hill | 6.43% | 0.20%(+6.23)#1 | 0.095%(+6.34)#23 |
| 24. | Jamestown | 6.41% | 0.028%(+6.38)#1 | 0.095%(+6.32)#24 |
| 25. | Los Alamos | 5.64% | 0.080%(+5.56)#3 | 0.095%(+5.54)#25 |
| 26. | Holiday Heights | 5.37% | 0.36%(+5.01)#4 | 0.095%(+5.27)#26 |
| 27. | Flagler | 5.34% | 0.036%(+5.30)#1 | 0.095%(+5.24)#27 |
| 28. | East Vineland | 5.27% | 0.36%(+4.92)#5 | 0.095%(+5.18)#28 |
| 29. | Laurel | 4.90% | 0.41%(+4.49)#7 | 0.095%(+4.80)#29 |
| 30. | Eldred | 4.71% | 0.41%(+4.31)#8 | 0.095%(+4.62)#30 |
| 31. | Cedar Knolls | 4.59% | 0.36%(+4.23)#6 | 0.095%(+4.50)#31 |
| 32. | Ramblewood | 4.53% | 0.36%(+4.17)#7 | 0.095%(+4.43)#32 |
| 33. | Orangetree | 4.38% | 0.14%(+4.24)#3 | 0.095%(+4.29)#33 |
| 34. | Glen Cove | 4.24% | 0.41%(+3.83)#9 | 0.095%(+4.14)#34 |
| 35. | Norridge | 4.23% | 0.12%(+4.11)#2 | 0.095%(+4.14)#35 |
| 36. | Lunenburg | 3.91% | 0.24%(+3.67)#1 | 0.095%(+3.81)#36 |
| 37. | Oakville | 3.87% | 0.42%(+3.45)#1 | 0.095%(+3.77)#37 |
| 38. | Clearbrook | 3.65% | 0.36%(+3.29)#8 | 0.095%(+3.55)#38 |
| 39. | Mamaroneck | 3.59% | 0.41%(+3.18)#10 | 0.095%(+3.49)#39 |
| 40. | Yorktown Heights | 3.59% | 0.41%(+3.18)#11 | 0.095%(+3.49)#40 |
| 41. | Lyle | 3.54% | 0.033%(+3.51)#1 | 0.095%(+3.45)#41 |
| 42. | Top Of The World | 3.52% | 0.058%(+3.47)#2 | 0.095%(+3.43)#42 |
| 43. | Shenorock | 3.51% | 0.41%(+3.10)#12 | 0.095%(+3.41)#43 |
| 44. | South Palm Beach | 3.40% | 0.14%(+3.26)#4 | 0.095%(+3.30)#44 |
| 45. | Norfolk | 3.37% | 0.42%(+2.95)#2 | 0.095%(+3.28)#45 |
| 46. | North Gates | 3.32% | 0.41%(+2.92)#13 | 0.095%(+3.23)#46 |
| 47. | Lake George | 3.29% | 0.41%(+2.88)#14 | 0.095%(+3.19)#47 |
| 48. | Mount Kisco | 3.28% | 0.41%(+2.87)#15 | 0.095%(+3.18)#48 |
| 49. | Pittman | 3.27% | 0.14%(+3.13)#5 | 0.095%(+3.18)#49 |
| 50. | Yermo | 3.16% | 0.080%(+3.08)#4 | 0.095%(+3.07)#50 |
| 51. | Hopewell Junction | 3.16% | 0.41%(+2.75)#16 | 0.095%(+3.06)#51 |
| 52. | Trinity Village | 3.10% | 0.080%(+3.02)#5 | 0.095%(+3.01)#52 |
| 53. | Lely | 3.10% | 0.14%(+2.96)#6 | 0.095%(+3.01)#53 |
| 54. | North Haledon Borough | 3.06% | 0.36%(+2.70)#9 | 0.095%(+2.96)#54 |
| 55. | Pine Hill | 3.06% | 0.41%(+2.65)#17 | 0.095%(+2.96)#55 |
| 56. | Totowa Borough | 3.03% | 0.36%(+2.67)#10 | 0.095%(+2.93)#56 |
| 57. | Dover Beaches North | 3.01% | 0.36%(+2.65)#11 | 0.095%(+2.91)#57 |
| 58. | Franklin Square | 2.99% | 0.41%(+2.58)#18 | 0.095%(+2.90)#58 |
| 59. | North Massapequa | 2.97% | 0.41%(+2.56)#19 | 0.095%(+2.87)#59 |
| 60. | Silver Ridge | 2.92% | 0.36%(+2.56)#12 | 0.095%(+2.82)#60 |
| 61. | Crandon Lakes | 2.89% | 0.36%(+2.53)#13 | 0.095%(+2.80)#61 |
| 62. | The Meadows | 2.85% | 0.14%(+2.71)#7 | 0.095%(+2.76)#62 |
| 63. | Pleasanton | 2.82% | 0.028%(+2.80)#1 | 0.095%(+2.73)#63 |
| 64. | Carmel | 2.71% | 0.41%(+2.31)#20 | 0.095%(+2.62)#64 |
| 65. | Hawthorne | 2.71% | 0.41%(+2.30)#21 | 0.095%(+2.61)#65 |
| 66. | Ridgebury | 2.70% | 0.42%(+2.28)#3 | 0.095%(+2.60)#66 |
| 67. | Saugatuck | 2.67% | 0.42%(+2.25)#4 | 0.095%(+2.57)#67 |
| 68. | Andes | 2.61% | 0.41%(+2.20)#22 | 0.095%(+2.51)#68 |
| 69. | Peach Lake | 2.59% | 0.41%(+2.19)#23 | 0.095%(+2.50)#69 |
| 70. | Ettrick | 2.52% | 0.060%(+2.46)#1 | 0.095%(+2.43)#70 |
| 71. | Harrisville | 2.51% | 0.20%(+2.31)#2 | 0.095%(+2.41)#71 |
| 72. | North Beach | 2.49% | 0.075%(+2.42)#1 | 0.095%(+2.40)#72 |
| 73. | Winding Cypress | 2.49% | 0.14%(+2.35)#8 | 0.095%(+2.39)#73 |
| 74. | Old Bennington | 2.48% | 0.048%(+2.44)#2 | 0.095%(+2.39)#74 |
| 75. | Sunset Bay | 2.46% | 0.41%(+2.05)#24 | 0.095%(+2.36)#75 |
| 76. | Moonachie Borough | 2.46% | 0.36%(+2.10)#14 | 0.095%(+2.36)#76 |
| 77. | Albertson | 2.45% | 0.41%(+2.05)#25 | 0.095%(+2.36)#77 |
| 78. | Hancock | 2.45% | 0.077%(+2.38)#1 | 0.095%(+2.36)#78 |
| 79. | Chesterland | 2.45% | 0.057%(+2.39)#1 | 0.095%(+2.35)#79 |
| 80. | Hawthorne Borough | 2.44% | 0.36%(+2.08)#15 | 0.095%(+2.34)#80 |
| 81. | Inwood | 2.42% | 0.41%(+2.01)#26 | 0.095%(+2.33)#81 |
| 82. | North Arlington Borough | 2.42% | 0.36%(+2.06)#16 | 0.095%(+2.32)#82 |
| 83. | New Ringgold Borough | 2.39% | 0.13%(+2.26)#4 | 0.095%(+2.30)#83 |
| 84. | Orient | 2.38% | 0.41%(+1.97)#27 | 0.095%(+2.28)#84 |
| 85. | Wescosville | 2.37% | 0.13%(+2.24)#5 | 0.095%(+2.27)#85 |
| 86. | Fairview Borough | 2.36% | 0.36%(+2.00)#17 | 0.095%(+2.27)#86 |
| 87. | Aliquippa | 2.36% | 0.13%(+2.23)#6 | 0.095%(+2.26)#87 |
| 88. | Gates | 2.33% | 0.41%(+1.93)#28 | 0.095%(+2.24)#88 |
| 89. | Wood Ridge Borough | 2.33% | 0.36%(+1.97)#18 | 0.095%(+2.23)#89 |
| 90. | Marshfield Hills | 2.32% | 0.24%(+2.08)#2 | 0.095%(+2.22)#90 |
| 91. | Vernon Valley | 2.31% | 0.36%(+1.95)#19 | 0.095%(+2.21)#91 |
| 92. | Singac | 2.30% | 0.36%(+1.95)#20 | 0.095%(+2.21)#92 |
| 93. | Rockleigh Borough | 2.29% | 0.36%(+1.93)#21 | 0.095%(+2.20)#93 |
| 94. | West Lake Hills | 2.29% | 0.026%(+2.27)#1 | 0.095%(+2.20)#94 |
| 95. | Northford | 2.28% | 0.42%(+1.86)#5 | 0.095%(+2.18)#95 |
| 96. | Stewart Manor | 2.27% | 0.41%(+1.87)#29 | 0.095%(+2.18)#96 |
| 97. | Greens Farms | 2.26% | 0.42%(+1.84)#6 | 0.095%(+2.17)#97 |
| 98. | Santa Venetia | 2.25% | 0.080%(+2.17)#6 | 0.095%(+2.15)#98 |
| 99. | Beaver Dam Lake | 2.25% | 0.41%(+1.84)#30 | 0.095%(+2.15)#99 |
| 100. | Tionesta Borough | 2.23% | 0.13%(+2.10)#7 | 0.095%(+2.14)#100 |
Common Questions
What are the Top 10 Cities with the Highest Percentage of Immigrants from Italy in the United States?
Top 10 Cities with the Highest Percentage of Immigrants from Italy in the United States are:
What city has the Highest Percentage of Immigrants from Italy in the United States?
Saltaire has the Highest Percentage of Immigrants from Italy in the United States with 100.00%.
What is the Percentage of Immigrants from Italy in the United States?
Percentage of Immigrants from Italy in the United States is 0.095%.