Cities with the Largest Slovak Community in the United States
RELATED REPORTS & OPTIONS
Slovak
United States
Compare Cities
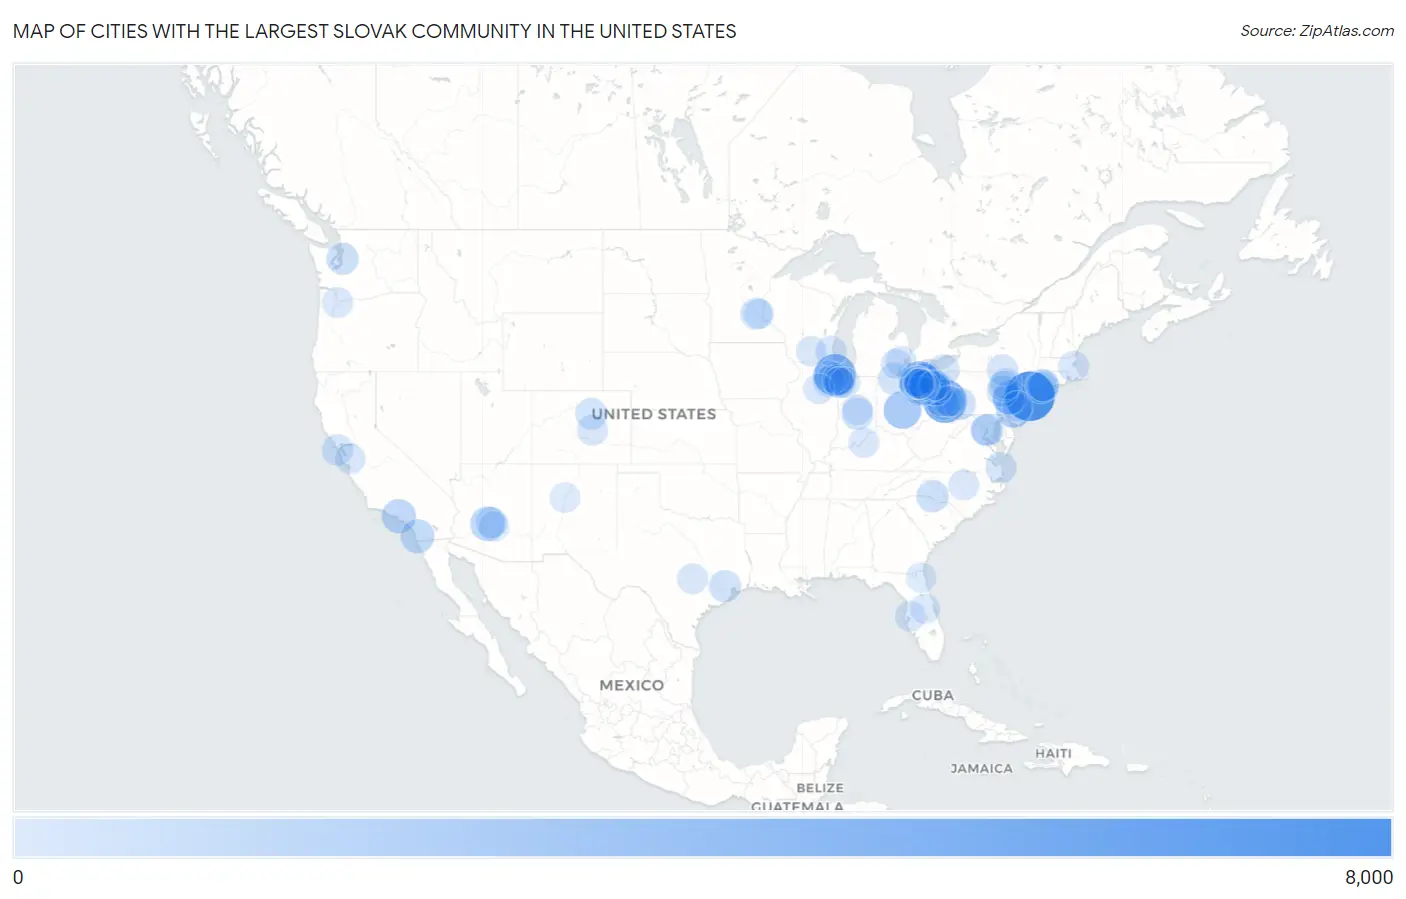
Map of Cities with the Largest Slovak Community in the United States
0
8,000
Cities with the Largest Slovak Community in the United States
| City | Slovak | vs State | vs National | |
| 1. | New York | 7,571 | 29,667(25.52%)#1 | 633,591(1.19%)#1 |
| 2. | Pittsburgh | 5,253 | 167,879(3.13%)#1 | 633,591(0.83%)#2 |
| 3. | Chicago | 4,679 | 31,271(14.96%)#1 | 633,591(0.74%)#3 |
| 4. | Parma | 4,114 | 104,647(3.93%)#1 | 633,591(0.65%)#4 |
| 5. | Cleveland | 4,081 | 104,647(3.90%)#2 | 633,591(0.64%)#5 |
| 6. | Columbus | 3,172 | 104,647(3.03%)#3 | 633,591(0.50%)#6 |
| 7. | Philadelphia | 2,426 | 167,879(1.45%)#2 | 633,591(0.38%)#7 |
| 8. | West Mifflin Borough | 2,225 | 167,879(1.33%)#3 | 633,591(0.35%)#8 |
| 9. | Phoenix | 2,017 | 8,902(22.66%)#1 | 633,591(0.32%)#9 |
| 10. | Bethlehem | 1,972 | 167,879(1.17%)#4 | 633,591(0.31%)#10 |
| 11. | Los Angeles | 1,915 | 23,894(8.01%)#1 | 633,591(0.30%)#11 |
| 12. | San Diego | 1,825 | 23,894(7.64%)#2 | 633,591(0.29%)#12 |
| 13. | Austintown | 1,799 | 104,647(1.72%)#4 | 633,591(0.28%)#13 |
| 14. | Youngstown | 1,782 | 104,647(1.70%)#5 | 633,591(0.28%)#14 |
| 15. | Strongsville | 1,522 | 104,647(1.45%)#6 | 633,591(0.24%)#15 |
| 16. | Bethel Park | 1,374 | 167,879(0.82%)#5 | 633,591(0.22%)#16 |
| 17. | North Ridgeville | 1,330 | 104,647(1.27%)#7 | 633,591(0.21%)#17 |
| 18. | Carnot Moon | 1,302 | 167,879(0.78%)#6 | 633,591(0.21%)#18 |
| 19. | North Royalton | 1,300 | 104,647(1.24%)#8 | 633,591(0.21%)#19 |
| 20. | Washington | 1,273 | 1,273(100.00%)#1 | 633,591(0.20%)#20 |
| 21. | Brunswick | 1,264 | 104,647(1.21%)#9 | 633,591(0.20%)#21 |
| 22. | Charlotte | 1,253 | 12,416(10.09%)#1 | 633,591(0.20%)#22 |
| 23. | Shelton | 1,252 | 16,347(7.66%)#1 | 633,591(0.20%)#23 |
| 24. | North Olmsted | 1,238 | 104,647(1.18%)#10 | 633,591(0.20%)#24 |
| 25. | Seattle | 1,236 | 6,531(18.93%)#1 | 633,591(0.20%)#25 |
| 26. | Hammond | 1,224 | 17,775(6.89%)#1 | 633,591(0.19%)#26 |
| 27. | Akron | 1,189 | 104,647(1.14%)#11 | 633,591(0.19%)#27 |
| 28. | Houston | 1,171 | 12,004(9.76%)#1 | 633,591(0.18%)#28 |
| 29. | Westlake | 1,145 | 104,647(1.09%)#12 | 633,591(0.18%)#29 |
| 30. | Indianapolis | 1,137 | 17,775(6.40%)#2 | 633,591(0.18%)#30 |
| 31. | Johnstown | 1,100 | 167,879(0.66%)#7 | 633,591(0.17%)#31 |
| 32. | Munhall Borough | 1,061 | 167,879(0.63%)#8 | 633,591(0.17%)#32 |
| 33. | Avon | 1,055 | 104,647(1.01%)#13 | 633,591(0.17%)#33 |
| 34. | Denver | 1,046 | 8,275(12.64%)#1 | 633,591(0.17%)#34 |
| 35. | Minneapolis | 1,038 | 7,532(13.78%)#1 | 633,591(0.16%)#35 |
| 36. | Naperville | 1,013 | 31,271(3.24%)#2 | 633,591(0.16%)#36 |
| 37. | Allentown | 995 | 167,879(0.59%)#9 | 633,591(0.16%)#37 |
| 38. | Mentor | 995 | 104,647(0.95%)#14 | 633,591(0.16%)#38 |
| 39. | Lakewood | 994 | 104,647(0.95%)#15 | 633,591(0.16%)#39 |
| 40. | Toledo | 979 | 104,647(0.94%)#16 | 633,591(0.15%)#40 |
| 41. | Jefferson Hills Borough | 973 | 167,879(0.58%)#10 | 633,591(0.15%)#41 |
| 42. | Broadview Heights | 946 | 104,647(0.90%)#17 | 633,591(0.15%)#42 |
| 43. | Bridgeport | 936 | 16,347(5.73%)#2 | 633,591(0.15%)#43 |
| 44. | San Francisco | 933 | 23,894(3.90%)#3 | 633,591(0.15%)#44 |
| 45. | Erie | 931 | 167,879(0.55%)#11 | 633,591(0.15%)#45 |
| 46. | Hazleton | 911 | 167,879(0.54%)#12 | 633,591(0.14%)#46 |
| 47. | Scranton | 888 | 167,879(0.53%)#13 | 633,591(0.14%)#47 |
| 48. | Avon Lake | 876 | 104,647(0.84%)#18 | 633,591(0.14%)#48 |
| 49. | Milford City Balance | 870 | 16,347(5.32%)#3 | 633,591(0.14%)#49 |
| 50. | Scottsdale | 855 | 8,902(9.60%)#2 | 633,591(0.13%)#50 |
| 51. | Binghamton | 852 | 29,667(2.87%)#2 | 633,591(0.13%)#51 |
| 52. | Monroeville | 852 | 167,879(0.51%)#14 | 633,591(0.13%)#52 |
| 53. | Milwaukee | 849 | 12,252(6.93%)#1 | 633,591(0.13%)#53 |
| 54. | Struthers | 836 | 104,647(0.80%)#19 | 633,591(0.13%)#54 |
| 55. | Virginia Beach | 835 | 15,892(5.25%)#1 | 633,591(0.13%)#55 |
| 56. | Joliet | 830 | 31,271(2.65%)#3 | 633,591(0.13%)#56 |
| 57. | Wilkes Barre | 827 | 167,879(0.49%)#15 | 633,591(0.13%)#57 |
| 58. | Arlington | 813 | 15,892(5.12%)#2 | 633,591(0.13%)#58 |
| 59. | Hermitage | 810 | 167,879(0.48%)#16 | 633,591(0.13%)#59 |
| 60. | Brook Park | 799 | 104,647(0.76%)#20 | 633,591(0.13%)#60 |
| 61. | Lorain | 781 | 104,647(0.75%)#21 | 633,591(0.12%)#61 |
| 62. | Colorado Springs | 779 | 8,275(9.41%)#2 | 633,591(0.12%)#62 |
| 63. | Seven Hills | 779 | 104,647(0.74%)#22 | 633,591(0.12%)#63 |
| 64. | Austin | 756 | 12,004(6.30%)#2 | 633,591(0.12%)#64 |
| 65. | Crown Point | 747 | 17,775(4.20%)#3 | 633,591(0.12%)#65 |
| 66. | Murrysville | 724 | 167,879(0.43%)#17 | 633,591(0.11%)#66 |
| 67. | Boston | 722 | 7,178(10.06%)#1 | 633,591(0.11%)#67 |
| 68. | Portland | 719 | 3,420(21.02%)#1 | 633,591(0.11%)#68 |
| 69. | Raleigh | 715 | 12,416(5.76%)#2 | 633,591(0.11%)#69 |
| 70. | Fairview Park | 706 | 104,647(0.67%)#23 | 633,591(0.11%)#70 |
| 71. | Elyria | 703 | 104,647(0.67%)#24 | 633,591(0.11%)#71 |
| 72. | Hudson | 697 | 104,647(0.67%)#25 | 633,591(0.11%)#72 |
| 73. | Oak Lawn | 694 | 31,271(2.22%)#4 | 633,591(0.11%)#73 |
| 74. | Willoughby | 693 | 104,647(0.66%)#26 | 633,591(0.11%)#74 |
| 75. | Barberton | 687 | 104,647(0.66%)#27 | 633,591(0.11%)#75 |
| 76. | Munster | 677 | 17,775(3.81%)#4 | 633,591(0.11%)#76 |
| 77. | Schererville | 675 | 17,775(3.80%)#5 | 633,591(0.11%)#77 |
| 78. | San Jose | 670 | 23,894(2.80%)#4 | 633,591(0.11%)#78 |
| 79. | Tampa | 667 | 30,881(2.16%)#1 | 633,591(0.11%)#79 |
| 80. | Louisville | 660 | 3,188(20.70%)#1 | 633,591(0.10%)#80 |
| 81. | Streator | 658 | 31,271(2.10%)#5 | 633,591(0.10%)#81 |
| 82. | Sterling Heights | 652 | 21,248(3.07%)#1 | 633,591(0.10%)#82 |
| 83. | Middleburg Heights | 643 | 104,647(0.61%)#28 | 633,591(0.10%)#83 |
| 84. | Levittown | 641 | 167,879(0.38%)#18 | 633,591(0.10%)#84 |
| 85. | Plum Borough | 641 | 167,879(0.38%)#19 | 633,591(0.10%)#85 |
| 86. | Madison | 632 | 12,252(5.16%)#2 | 633,591(0.10%)#86 |
| 87. | Livonia | 630 | 21,248(2.96%)#2 | 633,591(0.10%)#87 |
| 88. | Warren | 626 | 104,647(0.60%)#29 | 633,591(0.10%)#88 |
| 89. | Bay Village | 626 | 104,647(0.60%)#30 | 633,591(0.10%)#89 |
| 90. | Valparaiso | 624 | 17,775(3.51%)#6 | 633,591(0.10%)#90 |
| 91. | Carmel | 622 | 17,775(3.50%)#7 | 633,591(0.10%)#91 |
| 92. | Mesa | 619 | 8,902(6.95%)#3 | 633,591(0.10%)#92 |
| 93. | Berea | 618 | 104,647(0.59%)#31 | 633,591(0.10%)#93 |
| 94. | Cortland | 609 | 104,647(0.58%)#32 | 633,591(0.10%)#94 |
| 95. | Orlando | 593 | 30,881(1.92%)#2 | 633,591(0.09%)#95 |
| 96. | Albuquerque | 573 | 1,352(42.38%)#1 | 633,591(0.09%)#96 |
| 97. | Macedonia | 570 | 104,647(0.54%)#33 | 633,591(0.09%)#97 |
| 98. | Jacksonville | 564 | 30,881(1.83%)#3 | 633,591(0.09%)#98 |
| 99. | Parma Heights | 564 | 104,647(0.54%)#34 | 633,591(0.09%)#99 |
| 100. | St Paul | 563 | 7,532(7.47%)#2 | 633,591(0.09%)#100 |
Common Questions
What are the Top 10 Cities with the Largest Slovak Community in the United States?
Top 10 Cities with the Largest Slovak Community in the United States are:
What city has the Largest Slovak Community in the United States?
New York has the Largest Slovak Community in the United States with 7,571.
What is the Total Slovak Population in the United States?
Total Slovak Population in the United States is 633,591.