Cities with the Highest Percentage of Bulgarian Population in the United States
RELATED REPORTS & OPTIONS
Bulgarian
United States
Compare Cities
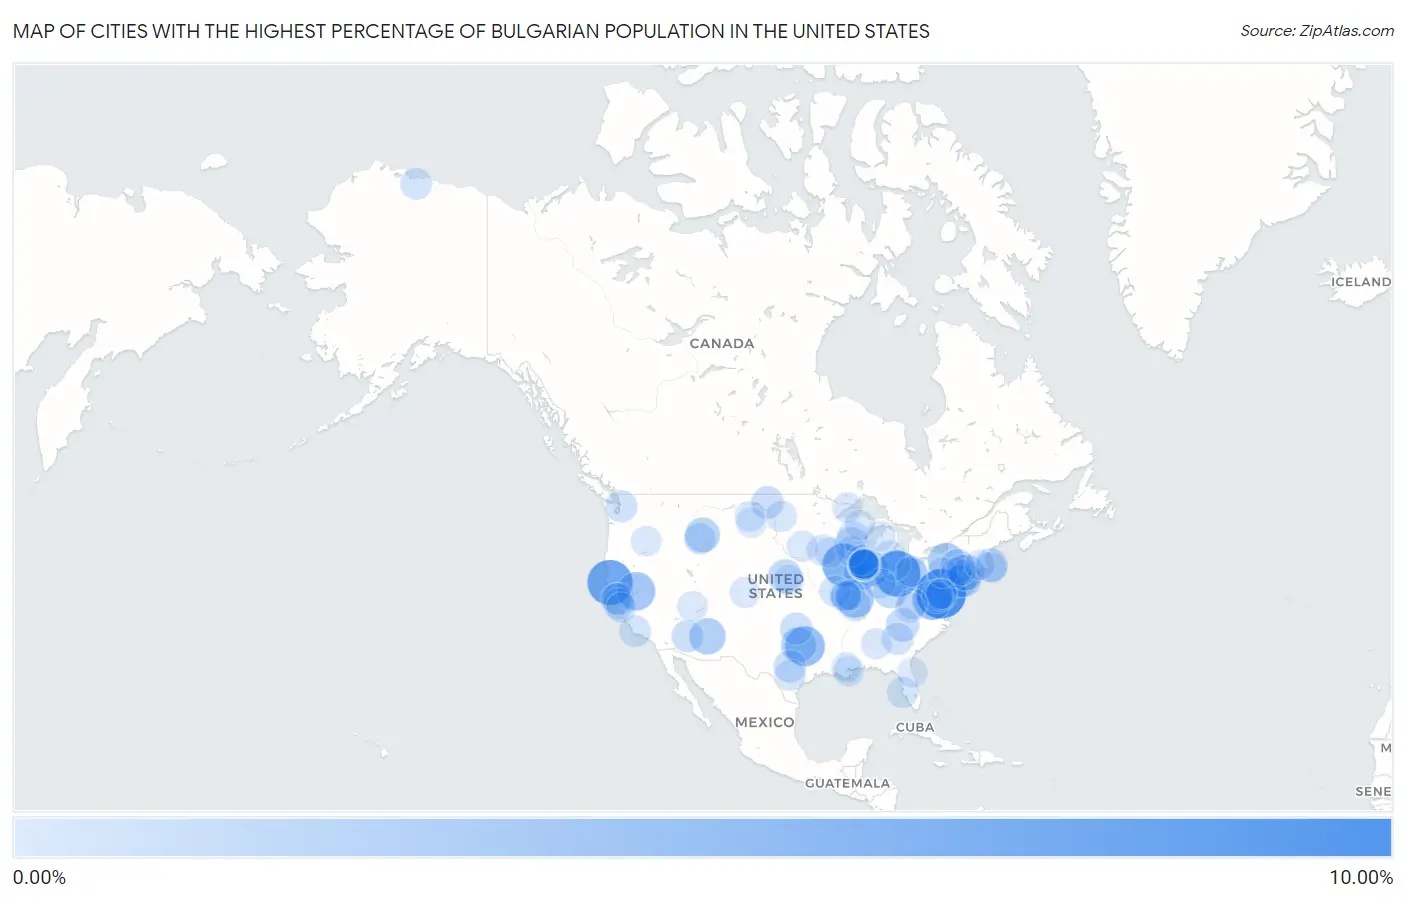
Map of Cities with the Highest Percentage of Bulgarian Population in the United States
0.00%
10.00%
Cities with the Highest Percentage of Bulgarian Population in the United States
| City | Bulgarian | vs State | vs National | |
| 1. | Chevy Chase View | 9.97% | 0.039%(+9.93)#1 | 0.033%(+9.94)#1 |
| 2. | New Riegel | 8.23% | 0.026%(+8.21)#1 | 0.033%(+8.20)#2 |
| 3. | Miranda | 7.93% | 0.033%(+7.89)#1 | 0.033%(+7.89)#3 |
| 4. | Baldwin | 6.77% | 0.015%(+6.75)#1 | 0.033%(+6.73)#4 |
| 5. | Wind Gap Borough | 5.95% | 0.029%(+5.92)#1 | 0.033%(+5.92)#5 |
| 6. | Union Valley | 5.40% | 0.015%(+5.38)#1 | 0.033%(+5.36)#6 |
| 7. | Ruckersville | 5.25% | 0.037%(+5.22)#1 | 0.033%(+5.22)#7 |
| 8. | Tahoe Vista | 4.61% | 0.033%(+4.58)#2 | 0.033%(+4.58)#8 |
| 9. | New Minden | 4.41% | 0.13%(+4.27)#1 | 0.033%(+4.37)#9 |
| 10. | Northeast Ithaca | 3.92% | 0.032%(+3.89)#1 | 0.033%(+3.89)#10 |
| 11. | Pinetop Lakeside | 3.77% | 0.035%(+3.74)#1 | 0.033%(+3.74)#11 |
| 12. | Golden S Bridge | 3.34% | 0.032%(+3.31)#2 | 0.033%(+3.31)#12 |
| 13. | Lantana | 3.33% | 0.015%(+3.32)#2 | 0.033%(+3.30)#13 |
| 14. | Mazon | 3.27% | 0.13%(+3.14)#2 | 0.033%(+3.24)#14 |
| 15. | Remlap | 3.21% | 0.0088%(+3.20)#1 | 0.033%(+3.18)#15 |
| 16. | Chesterton | 3.14% | 0.025%(+3.11)#1 | 0.033%(+3.10)#16 |
| 17. | Gardiner | 3.09% | 0.029%(+3.06)#1 | 0.033%(+3.06)#17 |
| 18. | Navesink | 2.84% | 0.040%(+2.80)#1 | 0.033%(+2.80)#18 |
| 19. | Livingston Manor | 2.78% | 0.032%(+2.75)#3 | 0.033%(+2.75)#19 |
| 20. | Highpoint | 2.63% | 0.026%(+2.60)#2 | 0.033%(+2.59)#20 |
| 21. | Riverdale | 2.56% | 0.0083%(+2.55)#1 | 0.033%(+2.52)#21 |
| 22. | Lake Sherwood | 2.38% | 0.028%(+2.35)#1 | 0.033%(+2.35)#22 |
| 23. | Roselle | 2.34% | 0.13%(+2.20)#3 | 0.033%(+2.30)#23 |
| 24. | Avery Creek | 2.34% | 0.023%(+2.31)#1 | 0.033%(+2.30)#24 |
| 25. | Provincetown | 2.33% | 0.068%(+2.26)#1 | 0.033%(+2.30)#25 |
| 26. | Cranbury | 2.14% | 0.040%(+2.10)#2 | 0.033%(+2.11)#26 |
| 27. | One Loudoun | 2.05% | 0.037%(+2.01)#2 | 0.033%(+2.02)#27 |
| 28. | Des Lacs | 2.00% | 0.021%(+1.98)#1 | 0.033%(+1.97)#28 |
| 29. | Elk Grove Village | 1.99% | 0.13%(+1.86)#4 | 0.033%(+1.96)#29 |
| 30. | Kenwood | 1.97% | 0.033%(+1.94)#3 | 0.033%(+1.94)#30 |
| 31. | Horseshoe Bay | 1.91% | 0.015%(+1.90)#3 | 0.033%(+1.88)#31 |
| 32. | Rosemont | 1.89% | 0.13%(+1.76)#5 | 0.033%(+1.86)#32 |
| 33. | Cole | 1.88% | 0.013%(+1.86)#1 | 0.033%(+1.84)#33 |
| 34. | Brimfield | 1.88% | 0.026%(+1.85)#3 | 0.033%(+1.84)#34 |
| 35. | Mount Prospect | 1.85% | 0.13%(+1.72)#6 | 0.033%(+1.82)#35 |
| 36. | Congress | 1.85% | 0.035%(+1.82)#2 | 0.033%(+1.82)#36 |
| 37. | Murphysboro | 1.82% | 0.13%(+1.68)#7 | 0.033%(+1.78)#37 |
| 38. | Mill Creek | 1.78% | 0.059%(+1.72)#1 | 0.033%(+1.75)#38 |
| 39. | Watkinsville | 1.77% | 0.021%(+1.75)#1 | 0.033%(+1.74)#39 |
| 40. | Los Alamos | 1.68% | 0.033%(+1.65)#4 | 0.033%(+1.65)#40 |
| 41. | Wayne | 1.66% | 0.029%(+1.64)#2 | 0.033%(+1.63)#41 |
| 42. | Woodburn | 1.62% | 0.037%(+1.58)#3 | 0.033%(+1.58)#42 |
| 43. | Parkdale | 1.61% | 0.033%(+1.58)#1 | 0.033%(+1.58)#43 |
| 44. | Nuiqsut | 1.60% | 0.026%(+1.57)#1 | 0.033%(+1.56)#44 |
| 45. | West Yellowstone | 1.57% | 0.029%(+1.54)#2 | 0.033%(+1.54)#45 |
| 46. | Arlington Heights | 1.53% | 0.13%(+1.39)#8 | 0.033%(+1.50)#46 |
| 47. | Longboat Key | 1.52% | 0.041%(+1.48)#1 | 0.033%(+1.49)#47 |
| 48. | Itasca | 1.52% | 0.13%(+1.38)#9 | 0.033%(+1.48)#48 |
| 49. | Laingsburg | 1.52% | 0.030%(+1.48)#1 | 0.033%(+1.48)#49 |
| 50. | Tiburon | 1.51% | 0.033%(+1.48)#5 | 0.033%(+1.48)#50 |
| 51. | Navy | 1.51% | 0.037%(+1.47)#4 | 0.033%(+1.48)#51 |
| 52. | Occidental | 1.51% | 0.033%(+1.48)#6 | 0.033%(+1.48)#52 |
| 53. | Pelham | 1.50% | 0.032%(+1.47)#4 | 0.033%(+1.47)#53 |
| 54. | Dundee | 1.50% | 0.030%(+1.47)#2 | 0.033%(+1.46)#54 |
| 55. | Rolling Meadows | 1.49% | 0.13%(+1.36)#10 | 0.033%(+1.46)#55 |
| 56. | The Plains | 1.47% | 0.037%(+1.43)#5 | 0.033%(+1.43)#56 |
| 57. | Windcrest | 1.42% | 0.015%(+1.41)#4 | 0.033%(+1.39)#57 |
| 58. | Centralia | 1.42% | 0.033%(+1.39)#2 | 0.033%(+1.39)#58 |
| 59. | South Dennis | 1.42% | 0.068%(+1.35)#2 | 0.033%(+1.39)#59 |
| 60. | St Paul | 1.40% | 0.033%(+1.36)#3 | 0.033%(+1.36)#60 |
| 61. | Dawson | 1.39% | 0.021%(+1.37)#2 | 0.033%(+1.36)#61 |
| 62. | Chagrin Falls | 1.38% | 0.026%(+1.36)#4 | 0.033%(+1.35)#62 |
| 63. | Bricelyn | 1.36% | 0.023%(+1.34)#1 | 0.033%(+1.33)#63 |
| 64. | Bealeton | 1.35% | 0.037%(+1.31)#6 | 0.033%(+1.32)#64 |
| 65. | Buffalo Grove | 1.31% | 0.13%(+1.18)#11 | 0.033%(+1.28)#65 |
| 66. | Egan | 1.29% | 0.0069%(+1.29)#1 | 0.033%(+1.26)#66 |
| 67. | Schofield | 1.29% | 0.028%(+1.26)#2 | 0.033%(+1.25)#67 |
| 68. | Baraboo | 1.26% | 0.028%(+1.23)#3 | 0.033%(+1.23)#68 |
| 69. | Garden View | 1.24% | 0.029%(+1.21)#3 | 0.033%(+1.21)#69 |
| 70. | Coleytown | 1.24% | 0.029%(+1.21)#1 | 0.033%(+1.21)#70 |
| 71. | Powers Lake | 1.23% | 0.028%(+1.20)#4 | 0.033%(+1.20)#71 |
| 72. | Conashaugh Lakes | 1.23% | 0.029%(+1.20)#4 | 0.033%(+1.19)#72 |
| 73. | Maryland Heights | 1.22% | 0.033%(+1.19)#4 | 0.033%(+1.19)#73 |
| 74. | Scotchtown | 1.22% | 0.032%(+1.19)#5 | 0.033%(+1.18)#74 |
| 75. | Glen Carbon | 1.20% | 0.13%(+1.07)#12 | 0.033%(+1.17)#75 |
| 76. | Gleneagle | 1.20% | 0.034%(+1.17)#1 | 0.033%(+1.17)#76 |
| 77. | Childersburg | 1.18% | 0.0088%(+1.17)#2 | 0.033%(+1.15)#77 |
| 78. | Roseland | 1.16% | 0.0083%(+1.15)#2 | 0.033%(+1.13)#78 |
| 79. | Idylwood | 1.15% | 0.037%(+1.12)#7 | 0.033%(+1.12)#79 |
| 80. | Beach | 1.15% | 0.021%(+1.13)#3 | 0.033%(+1.12)#80 |
| 81. | Tropic | 1.15% | 0.0081%(+1.14)#1 | 0.033%(+1.11)#81 |
| 82. | Leland | 1.14% | 0.030%(+1.11)#3 | 0.033%(+1.10)#82 |
| 83. | Pendleton | 1.13% | 0.025%(+1.11)#2 | 0.033%(+1.10)#83 |
| 84. | Grand Marais | 1.13% | 0.023%(+1.11)#2 | 0.033%(+1.10)#84 |
| 85. | Bradley | 1.12% | 0.0026%(+1.12)#1 | 0.033%(+1.09)#85 |
| 86. | Millington | 1.12% | 0.040%(+1.08)#3 | 0.033%(+1.09)#86 |
| 87. | West Menlo Park | 1.12% | 0.033%(+1.08)#7 | 0.033%(+1.08)#87 |
| 88. | Prairie City | 1.12% | 0.031%(+1.08)#1 | 0.033%(+1.08)#88 |
| 89. | Osage | 1.11% | 0.015%(+1.10)#2 | 0.033%(+1.08)#89 |
| 90. | Davy | 1.11% | 0.0026%(+1.10)#2 | 0.033%(+1.07)#90 |
| 91. | Elmwood | 1.10% | 0.012%(+1.09)#1 | 0.033%(+1.07)#91 |
| 92. | Lake Zurich | 1.09% | 0.13%(+0.955)#13 | 0.033%(+1.06)#92 |
| 93. | Wood Dale | 1.09% | 0.13%(+0.952)#14 | 0.033%(+1.05)#93 |
| 94. | Springfield | 1.08% | 0.012%(+1.07)#2 | 0.033%(+1.04)#94 |
| 95. | Marmarth | 1.08% | 0.021%(+1.05)#4 | 0.033%(+1.04)#95 |
| 96. | Iron River | 1.07% | 0.030%(+1.04)#4 | 0.033%(+1.04)#96 |
| 97. | Harrisville | 1.06% | 0.013%(+1.04)#1 | 0.033%(+1.02)#97 |
| 98. | Sharpsville Borough | 1.04% | 0.029%(+1.01)#5 | 0.033%(+1.00)#98 |
| 99. | St Augustine Beach | 1.03% | 0.041%(+0.992)#2 | 0.033%(+1.00)#99 |
| 100. | Palatine | 1.02% | 0.13%(+0.891)#15 | 0.033%(+0.992)#100 |
Common Questions
What are the Top 10 Cities with the Highest Percentage of Bulgarian Population in the United States?
Top 10 Cities with the Highest Percentage of Bulgarian Population in the United States are:
#1
9.97%
#2
8.23%
#3
7.93%
#4
6.77%
#5
5.40%
#6
5.25%
#7
4.61%
#8
4.41%
#9
3.92%
#10
3.77%
What city has the Highest Percentage of Bulgarian Population in the United States?
Chevy Chase View has the Highest Percentage of Bulgarian Population in the United States with 9.97%.
What is the Percentage of Bulgarian Population in the United States?
Percentage of Bulgarian Population in the United States is 0.033%.