Cities with the Highest Percentage of Iraqi Population in the United States
RELATED REPORTS & OPTIONS
Iraqi
United States
Compare Cities
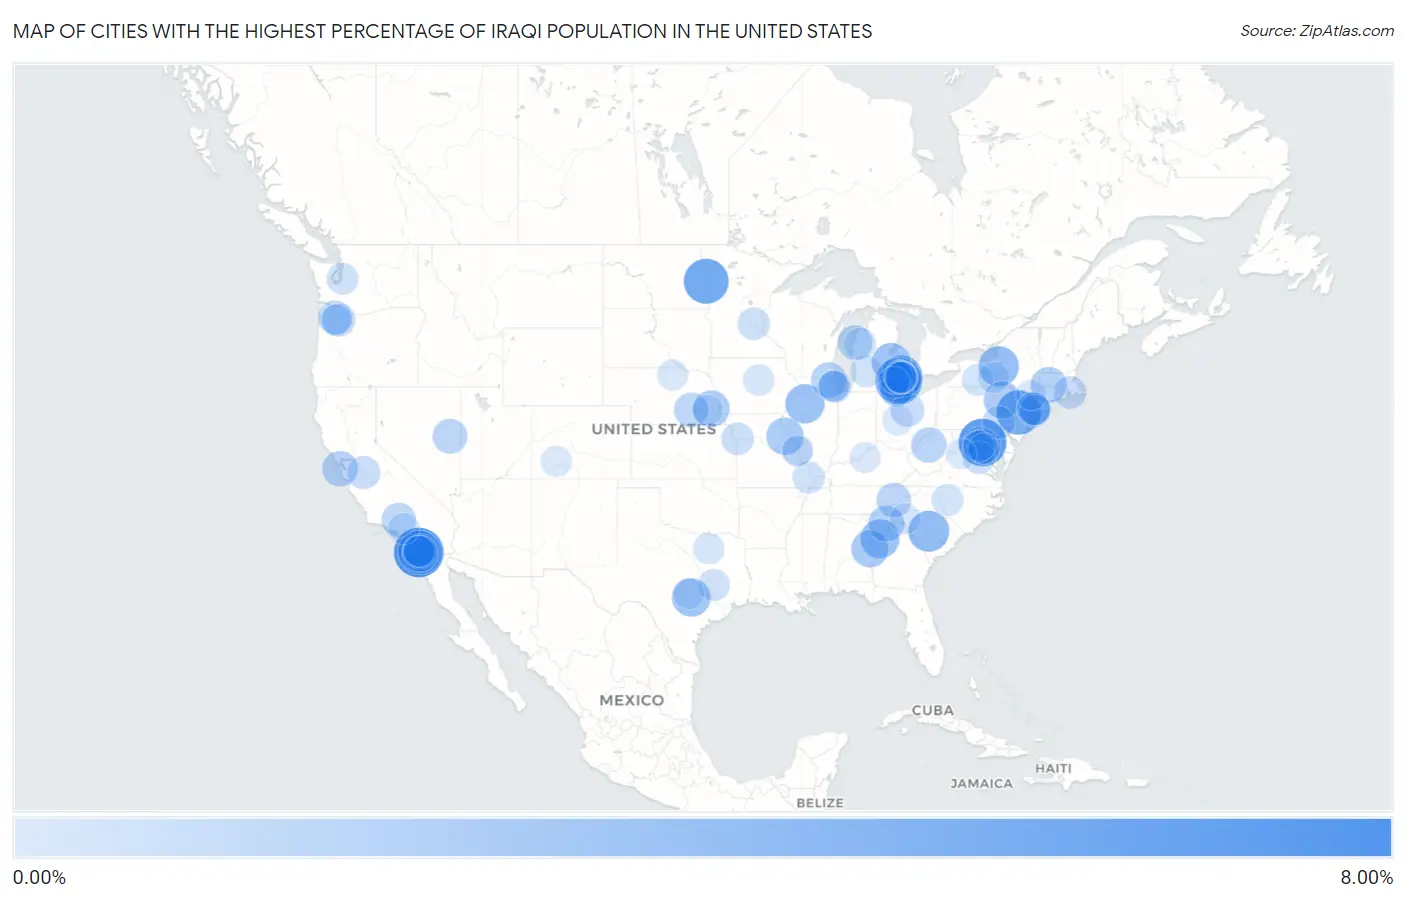
Map of Cities with the Highest Percentage of Iraqi Population in the United States
0.00%
8.00%
Cities with the Highest Percentage of Iraqi Population in the United States
| City | Iraqi | vs State | vs National | |
| 1. | El Cajon | 7.02% | 0.062%(+6.95)#1 | 0.050%(+6.97)#1 |
| 2. | Lowes Island | 6.38% | 0.079%(+6.30)#1 | 0.050%(+6.33)#2 |
| 3. | Dearborn Heights | 6.02% | 0.37%(+5.65)#1 | 0.050%(+5.97)#3 |
| 4. | Hendrum | 5.49% | 0.035%(+5.45)#1 | 0.050%(+5.44)#4 |
| 5. | White House Station | 5.33% | 0.021%(+5.31)#1 | 0.050%(+5.28)#5 |
| 6. | Rancho San Diego | 4.99% | 0.062%(+4.93)#2 | 0.050%(+4.94)#6 |
| 7. | Dearborn | 4.89% | 0.37%(+4.52)#2 | 0.050%(+4.84)#7 |
| 8. | Sterling Heights | 4.61% | 0.37%(+4.24)#3 | 0.050%(+4.56)#8 |
| 9. | Bostonia | 4.40% | 0.062%(+4.34)#3 | 0.050%(+4.35)#9 |
| 10. | Seven Oaks | 4.20% | 0.020%(+4.18)#1 | 0.050%(+4.15)#10 |
| 11. | Solvay | 3.98% | 0.035%(+3.95)#1 | 0.050%(+3.93)#11 |
| 12. | North East Borough | 3.74% | 0.023%(+3.72)#1 | 0.050%(+3.69)#12 |
| 13. | Toulon | 3.65% | 0.060%(+3.59)#1 | 0.050%(+3.61)#13 |
| 14. | Birch Run | 3.56% | 0.37%(+3.19)#4 | 0.050%(+3.51)#14 |
| 15. | Fairburn | 3.54% | 0.030%(+3.51)#1 | 0.050%(+3.49)#15 |
| 16. | Buda | 3.45% | 0.065%(+3.39)#1 | 0.050%(+3.40)#16 |
| 17. | Trucksville | 3.06% | 0.023%(+3.03)#2 | 0.050%(+3.01)#17 |
| 18. | Bowling Green | 3.04% | 0.044%(+2.99)#1 | 0.050%(+2.99)#18 |
| 19. | Fredonia | 3.02% | 0.0025%(+3.01)#1 | 0.050%(+2.97)#19 |
| 20. | Alvo | 2.86% | 0.14%(+2.72)#1 | 0.050%(+2.81)#20 |
| 21. | Keego Harbor | 2.67% | 0.37%(+2.30)#5 | 0.050%(+2.62)#21 |
| 22. | West Springfield Town | 2.64% | 0.055%(+2.58)#1 | 0.050%(+2.59)#22 |
| 23. | Dawsonville | 2.63% | 0.030%(+2.61)#2 | 0.050%(+2.59)#23 |
| 24. | West Pittston Borough | 2.62% | 0.023%(+2.59)#3 | 0.050%(+2.57)#24 |
| 25. | Jamul | 2.61% | 0.062%(+2.55)#4 | 0.050%(+2.56)#25 |
| 26. | Wixom | 2.57% | 0.37%(+2.20)#6 | 0.050%(+2.52)#26 |
| 27. | Montara | 2.49% | 0.062%(+2.43)#5 | 0.050%(+2.44)#27 |
| 28. | Grantsville | 2.43% | 0.0050%(+2.42)#1 | 0.050%(+2.38)#28 |
| 29. | Long Lake | 2.42% | 0.060%(+2.36)#2 | 0.050%(+2.37)#29 |
| 30. | Granite Hills | 2.36% | 0.062%(+2.30)#6 | 0.050%(+2.31)#30 |
| 31. | Sudley | 2.29% | 0.079%(+2.21)#2 | 0.050%(+2.24)#31 |
| 32. | Mcgill | 2.28% | 0.036%(+2.24)#1 | 0.050%(+2.23)#32 |
| 33. | Pigeon Forge | 2.21% | 0.056%(+2.15)#1 | 0.050%(+2.16)#33 |
| 34. | Manistee | 2.19% | 0.37%(+1.82)#7 | 0.050%(+2.14)#34 |
| 35. | Henderson | 2.19% | 0.14%(+2.05)#2 | 0.050%(+2.14)#35 |
| 36. | Kings Park | 2.17% | 0.079%(+2.09)#3 | 0.050%(+2.12)#36 |
| 37. | Elizabeth Lake | 2.15% | 0.062%(+2.09)#7 | 0.050%(+2.10)#37 |
| 38. | Saddle Rock | 2.07% | 0.035%(+2.04)#2 | 0.050%(+2.02)#38 |
| 39. | Kings Point | 1.95% | 0.035%(+1.91)#3 | 0.050%(+1.90)#39 |
| 40. | Oak Hills | 1.94% | 0.041%(+1.90)#1 | 0.050%(+1.89)#40 |
| 41. | Walled Lake | 1.94% | 0.37%(+1.57)#8 | 0.050%(+1.89)#41 |
| 42. | Arcola | 1.85% | 0.079%(+1.77)#4 | 0.050%(+1.80)#42 |
| 43. | Rumson Borough | 1.84% | 0.021%(+1.82)#2 | 0.050%(+1.79)#43 |
| 44. | Ontario | 1.82% | 0.026%(+1.80)#1 | 0.050%(+1.77)#44 |
| 45. | Spring Valley Cdp San Diego County | 1.78% | 0.062%(+1.72)#8 | 0.050%(+1.73)#45 |
| 46. | Jennings Lodge | 1.77% | 0.041%(+1.73)#2 | 0.050%(+1.73)#46 |
| 47. | Farmington Hills | 1.76% | 0.37%(+1.39)#9 | 0.050%(+1.71)#47 |
| 48. | Luna Pier | 1.71% | 0.37%(+1.35)#10 | 0.050%(+1.66)#48 |
| 49. | Hilmar Irwin | 1.70% | 0.062%(+1.63)#9 | 0.050%(+1.65)#49 |
| 50. | Great Falls Crossing | 1.64% | 0.079%(+1.56)#5 | 0.050%(+1.59)#50 |
| 51. | Leola | 1.64% | 0.023%(+1.61)#4 | 0.050%(+1.59)#51 |
| 52. | Ocean Grove | 1.64% | 0.055%(+1.58)#2 | 0.050%(+1.59)#52 |
| 53. | Skokie | 1.63% | 0.060%(+1.57)#3 | 0.050%(+1.58)#53 |
| 54. | Spotsylvania Courthouse | 1.60% | 0.079%(+1.52)#6 | 0.050%(+1.55)#54 |
| 55. | Oakwood Park | 1.59% | 0.044%(+1.55)#2 | 0.050%(+1.54)#55 |
| 56. | Troy | 1.54% | 0.37%(+1.17)#11 | 0.050%(+1.49)#56 |
| 57. | Hazel Park | 1.53% | 0.37%(+1.17)#12 | 0.050%(+1.48)#57 |
| 58. | Plandome Manor | 1.50% | 0.035%(+1.47)#4 | 0.050%(+1.45)#58 |
| 59. | Anoka | 1.50% | 0.035%(+1.47)#2 | 0.050%(+1.45)#59 |
| 60. | Warren | 1.49% | 0.37%(+1.12)#13 | 0.050%(+1.44)#60 |
| 61. | Madison Heights | 1.44% | 0.37%(+1.07)#14 | 0.050%(+1.39)#61 |
| 62. | Benton | 1.40% | 0.044%(+1.36)#3 | 0.050%(+1.35)#62 |
| 63. | Caledonia | 1.38% | 0.37%(+1.01)#15 | 0.050%(+1.33)#63 |
| 64. | Winter Gardens | 1.36% | 0.062%(+1.29)#10 | 0.050%(+1.31)#64 |
| 65. | Ypsilanti | 1.35% | 0.37%(+0.978)#16 | 0.050%(+1.30)#65 |
| 66. | Kurten | 1.34% | 0.065%(+1.28)#2 | 0.050%(+1.29)#66 |
| 67. | Wellston | 1.34% | 0.37%(+0.971)#17 | 0.050%(+1.29)#67 |
| 68. | Des Moines | 1.33% | 0.068%(+1.27)#1 | 0.050%(+1.28)#68 |
| 69. | Randleman | 1.31% | 0.014%(+1.30)#1 | 0.050%(+1.26)#69 |
| 70. | Morton Grove | 1.31% | 0.060%(+1.25)#4 | 0.050%(+1.26)#70 |
| 71. | Hornell | 1.24% | 0.035%(+1.21)#5 | 0.050%(+1.19)#71 |
| 72. | Sierra Madre | 1.22% | 0.062%(+1.16)#11 | 0.050%(+1.17)#72 |
| 73. | Eldora | 1.21% | 0.034%(+1.18)#1 | 0.050%(+1.16)#73 |
| 74. | Haymarket | 1.21% | 0.079%(+1.13)#7 | 0.050%(+1.16)#74 |
| 75. | Sachse | 1.20% | 0.065%(+1.13)#3 | 0.050%(+1.15)#75 |
| 76. | Center Line | 1.18% | 0.37%(+0.809)#18 | 0.050%(+1.13)#76 |
| 77. | Powell | 1.17% | 0.056%(+1.12)#2 | 0.050%(+1.12)#77 |
| 78. | Ida | 1.17% | 0.37%(+0.798)#19 | 0.050%(+1.12)#78 |
| 79. | Durham | 1.13% | 0.041%(+1.09)#3 | 0.050%(+1.08)#79 |
| 80. | Danville Borough | 1.13% | 0.023%(+1.10)#5 | 0.050%(+1.08)#80 |
| 81. | Stuart | 1.12% | 0.14%(+0.977)#3 | 0.050%(+1.07)#81 |
| 82. | Greens Farms | 1.11% | 0.012%(+1.10)#1 | 0.050%(+1.06)#82 |
| 83. | Northwest Ithaca | 1.11% | 0.035%(+1.08)#6 | 0.050%(+1.06)#83 |
| 84. | Troy Hills | 1.09% | 0.021%(+1.07)#3 | 0.050%(+1.05)#84 |
| 85. | Santee | 1.09% | 0.062%(+1.03)#12 | 0.050%(+1.04)#85 |
| 86. | Lake City | 1.08% | 0.035%(+1.04)#1 | 0.050%(+1.03)#86 |
| 87. | Lorton | 1.06% | 0.079%(+0.982)#8 | 0.050%(+1.01)#87 |
| 88. | Rock Hill | 1.06% | 0.044%(+1.01)#4 | 0.050%(+1.01)#88 |
| 89. | Central | 1.04% | 0.020%(+1.02)#2 | 0.050%(+0.993)#89 |
| 90. | Hurstbourne | 1.01% | 0.034%(+0.976)#1 | 0.050%(+0.960)#90 |
| 91. | Bee Cave | 1.00% | 0.065%(+0.938)#4 | 0.050%(+0.953)#91 |
| 92. | Bala Cynwyd | 0.99% | 0.023%(+0.964)#6 | 0.050%(+0.937)#92 |
| 93. | Manhasset Hills | 0.97% | 0.035%(+0.939)#7 | 0.050%(+0.923)#93 |
| 94. | Marysville | 0.97% | 0.026%(+0.947)#2 | 0.050%(+0.923)#94 |
| 95. | Harrisonburg | 0.94% | 0.079%(+0.858)#9 | 0.050%(+0.887)#95 |
| 96. | Wappingers Falls | 0.94% | 0.035%(+0.901)#8 | 0.050%(+0.885)#96 |
| 97. | Affton | 0.92% | 0.044%(+0.875)#5 | 0.050%(+0.869)#97 |
| 98. | Niles | 0.91% | 0.060%(+0.847)#5 | 0.050%(+0.858)#98 |
| 99. | Neshanic Station | 0.88% | 0.021%(+0.863)#4 | 0.050%(+0.834)#99 |
| 100. | Lincoln | 0.87% | 0.14%(+0.723)#4 | 0.050%(+0.815)#100 |
Common Questions
What are the Top 10 Cities with the Highest Percentage of Iraqi Population in the United States?
Top 10 Cities with the Highest Percentage of Iraqi Population in the United States are:
#1
7.02%
#2
6.38%
#3
6.02%
#4
5.49%
#5
5.33%
#6
4.99%
#7
4.89%
#8
4.61%
#9
4.40%
#10
4.20%
What city has the Highest Percentage of Iraqi Population in the United States?
El Cajon has the Highest Percentage of Iraqi Population in the United States with 7.02%.
What is the Percentage of Iraqi Population in the United States?
Percentage of Iraqi Population in the United States is 0.050%.