Cities with the Highest Percentage of Sudanese Population in the United States
RELATED REPORTS & OPTIONS
Sudanese
United States
Compare Cities
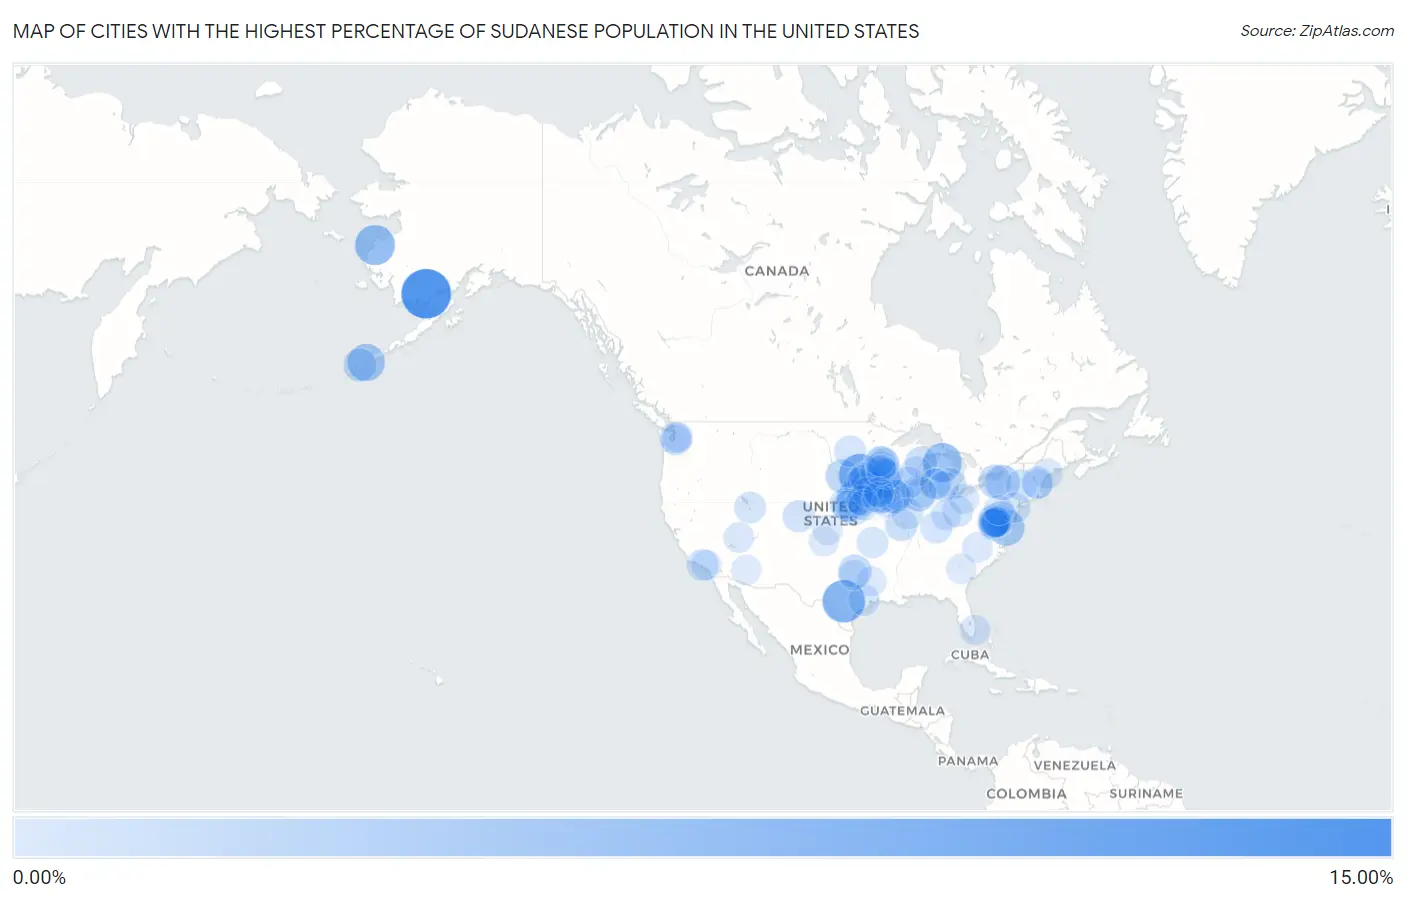
Map of Cities with the Highest Percentage of Sudanese Population in the United States
0.00%
15.00%
Cities with the Highest Percentage of Sudanese Population in the United States
| City | Sudanese | vs State | vs National | |
| 1. | New Stuyahok | 10.12% | 0.17%(+9.94)#1 | 0.022%(+10.1)#1 |
| 2. | Fair Oaks Ranch | 6.47% | 0.022%(+6.45)#1 | 0.022%(+6.45)#2 |
| 3. | Jasper | 6.27% | 0.068%(+6.20)#1 | 0.022%(+6.25)#3 |
| 4. | Emmonak | 5.26% | 0.17%(+5.09)#2 | 0.022%(+5.24)#4 |
| 5. | Vanderbilt | 4.65% | 0.028%(+4.62)#1 | 0.022%(+4.62)#5 |
| 6. | Akutan | 3.84% | 0.17%(+3.67)#3 | 0.022%(+3.82)#6 |
| 7. | Princess Anne | 3.58% | 0.036%(+3.54)#1 | 0.022%(+3.55)#7 |
| 8. | Schuyler | 2.93% | 0.29%(+2.64)#1 | 0.022%(+2.91)#8 |
| 9. | Callender | 2.78% | 0.21%(+2.56)#1 | 0.022%(+2.76)#9 |
| 10. | Glendale Heights | 2.72% | 0.017%(+2.70)#1 | 0.022%(+2.70)#10 |
| 11. | Lakeland | 2.71% | 0.017%(+2.69)#1 | 0.022%(+2.68)#11 |
| 12. | Dulles Town Center | 2.63% | 0.060%(+2.57)#1 | 0.022%(+2.61)#12 |
| 13. | Castle Shannon Borough | 2.54% | 0.0081%(+2.53)#1 | 0.022%(+2.51)#13 |
| 14. | Woodland Park Borough | 2.46% | 0.012%(+2.45)#1 | 0.022%(+2.44)#14 |
| 15. | Le Mars | 2.31% | 0.21%(+2.10)#2 | 0.022%(+2.29)#15 |
| 16. | White Lake | 2.23% | 0.086%(+2.14)#1 | 0.022%(+2.21)#16 |
| 17. | Austin | 2.12% | 0.068%(+2.05)#2 | 0.022%(+2.10)#17 |
| 18. | Alta | 2.08% | 0.21%(+1.87)#3 | 0.022%(+2.06)#18 |
| 19. | Potomac Mills | 2.06% | 0.060%(+2.00)#2 | 0.022%(+2.04)#19 |
| 20. | Aubrey | 1.92% | 0.022%(+1.90)#2 | 0.022%(+1.90)#20 |
| 21. | Unalaska | 1.89% | 0.17%(+1.72)#4 | 0.022%(+1.87)#21 |
| 22. | Sheldon | 1.86% | 0.21%(+1.65)#4 | 0.022%(+1.84)#22 |
| 23. | Webster | 1.83% | 0.017%(+1.82)#2 | 0.022%(+1.81)#23 |
| 24. | Iowa City | 1.82% | 0.21%(+1.61)#5 | 0.022%(+1.80)#24 |
| 25. | Coralville | 1.81% | 0.21%(+1.60)#6 | 0.022%(+1.79)#25 |
| 26. | Newton | 1.68% | 0.21%(+1.47)#7 | 0.022%(+1.66)#26 |
| 27. | Charles City | 1.53% | 0.21%(+1.32)#8 | 0.022%(+1.51)#27 |
| 28. | Mccool Junction | 1.53% | 0.29%(+1.24)#2 | 0.022%(+1.51)#28 |
| 29. | Middle River | 1.52% | 0.036%(+1.48)#2 | 0.022%(+1.50)#29 |
| 30. | Twin Oaks | 1.45% | 0.011%(+1.44)#1 | 0.022%(+1.43)#30 |
| 31. | Mcnair | 1.42% | 0.060%(+1.36)#3 | 0.022%(+1.40)#31 |
| 32. | Hilltop | 1.39% | 0.068%(+1.33)#3 | 0.022%(+1.37)#32 |
| 33. | Four Square Mile | 1.37% | 0.037%(+1.34)#1 | 0.022%(+1.35)#33 |
| 34. | Peshtigo | 1.35% | 0.0064%(+1.34)#1 | 0.022%(+1.33)#34 |
| 35. | Des Moines | 1.33% | 0.21%(+1.12)#9 | 0.022%(+1.31)#35 |
| 36. | Castle Pines | 1.32% | 0.037%(+1.28)#2 | 0.022%(+1.30)#36 |
| 37. | South Hooksett | 1.27% | 0.060%(+1.21)#1 | 0.022%(+1.25)#37 |
| 38. | Mankato | 1.26% | 0.068%(+1.20)#4 | 0.022%(+1.24)#38 |
| 39. | Grand Blanc | 1.21% | 0.028%(+1.18)#2 | 0.022%(+1.19)#39 |
| 40. | Shorewood Hills | 1.20% | 0.0064%(+1.19)#2 | 0.022%(+1.18)#40 |
| 41. | Marina Del Rey | 1.14% | 0.010%(+1.13)#1 | 0.022%(+1.12)#41 |
| 42. | Thornhill | 1.13% | 0.0097%(+1.12)#1 | 0.022%(+1.11)#42 |
| 43. | Bailey S Crossroads | 1.11% | 0.060%(+1.05)#4 | 0.022%(+1.08)#43 |
| 44. | Draper | 1.10% | 0.067%(+1.03)#1 | 0.022%(+1.08)#44 |
| 45. | Oradell Borough | 1.08% | 0.012%(+1.07)#2 | 0.022%(+1.06)#45 |
| 46. | Gwinner | 1.06% | 0.020%(+1.04)#1 | 0.022%(+1.03)#46 |
| 47. | Wheatland | 1.04% | 0.21%(+0.826)#10 | 0.022%(+1.02)#47 |
| 48. | Jerome | 1.00% | 0.017%(+0.986)#2 | 0.022%(+0.981)#48 |
| 49. | Katy | 0.98% | 0.022%(+0.959)#3 | 0.022%(+0.959)#49 |
| 50. | Vienna | 0.93% | 0.060%(+0.873)#5 | 0.022%(+0.911)#50 |
| 51. | Grand Island | 0.92% | 0.29%(+0.636)#3 | 0.022%(+0.902)#51 |
| 52. | Cohoes | 0.92% | 0.017%(+0.901)#3 | 0.022%(+0.897)#52 |
| 53. | Fairbury | 0.89% | 0.29%(+0.607)#4 | 0.022%(+0.872)#53 |
| 54. | Pataskala | 0.89% | 0.010%(+0.881)#1 | 0.022%(+0.869)#54 |
| 55. | Owatonna | 0.89% | 0.068%(+0.822)#5 | 0.022%(+0.868)#55 |
| 56. | Kentwood | 0.89% | 0.028%(+0.860)#3 | 0.022%(+0.866)#56 |
| 57. | Noel | 0.88% | 0.011%(+0.870)#2 | 0.022%(+0.859)#57 |
| 58. | Boulevard Park | 0.84% | 0.023%(+0.816)#1 | 0.022%(+0.817)#58 |
| 59. | Bellevue | 0.83% | 0.29%(+0.540)#5 | 0.022%(+0.805)#59 |
| 60. | Clay Center | 0.77% | 0.29%(+0.482)#6 | 0.022%(+0.747)#60 |
| 61. | Rochester | 0.75% | 0.068%(+0.680)#6 | 0.022%(+0.726)#61 |
| 62. | South Kensington | 0.74% | 0.036%(+0.705)#3 | 0.022%(+0.719)#62 |
| 63. | Algona | 0.70% | 0.023%(+0.682)#2 | 0.022%(+0.683)#63 |
| 64. | Franklin Park | 0.70% | 0.012%(+0.688)#3 | 0.022%(+0.678)#64 |
| 65. | Maplewood | 0.70% | 0.068%(+0.628)#7 | 0.022%(+0.674)#65 |
| 66. | Omaha | 0.65% | 0.29%(+0.364)#7 | 0.022%(+0.629)#66 |
| 67. | Issaquah | 0.65% | 0.023%(+0.627)#3 | 0.022%(+0.628)#67 |
| 68. | Flemington Borough | 0.64% | 0.012%(+0.625)#4 | 0.022%(+0.615)#68 |
| 69. | Neenah | 0.61% | 0.0064%(+0.605)#3 | 0.022%(+0.590)#69 |
| 70. | Denison | 0.60% | 0.21%(+0.388)#11 | 0.022%(+0.579)#70 |
| 71. | Centerville | 0.59% | 0.010%(+0.577)#2 | 0.022%(+0.566)#71 |
| 72. | Glen Rock Borough | 0.59% | 0.012%(+0.576)#5 | 0.022%(+0.565)#72 |
| 73. | Worthington | 0.59% | 0.068%(+0.517)#8 | 0.022%(+0.563)#73 |
| 74. | Nebraska City | 0.58% | 0.29%(+0.291)#8 | 0.022%(+0.557)#74 |
| 75. | Dania Beach | 0.56% | 0.0077%(+0.554)#1 | 0.022%(+0.540)#75 |
| 76. | Broadview Heights | 0.56% | 0.010%(+0.550)#3 | 0.022%(+0.538)#76 |
| 77. | Brunswick | 0.55% | 0.025%(+0.525)#1 | 0.022%(+0.528)#77 |
| 78. | Wyoming | 0.55% | 0.028%(+0.519)#4 | 0.022%(+0.525)#78 |
| 79. | Hurst | 0.55% | 0.022%(+0.525)#4 | 0.022%(+0.525)#79 |
| 80. | Hurricane | 0.54% | 0.067%(+0.476)#2 | 0.022%(+0.521)#80 |
| 81. | Ottumwa | 0.54% | 0.21%(+0.323)#12 | 0.022%(+0.514)#81 |
| 82. | Greensboro | 0.52% | 0.025%(+0.499)#1 | 0.022%(+0.502)#82 |
| 83. | Lansing | 0.52% | 0.028%(+0.490)#5 | 0.022%(+0.497)#83 |
| 84. | Manchester | 0.51% | 0.060%(+0.452)#2 | 0.022%(+0.490)#84 |
| 85. | West Des Moines | 0.50% | 0.21%(+0.290)#13 | 0.022%(+0.481)#85 |
| 86. | Kingstowne | 0.50% | 0.060%(+0.440)#6 | 0.022%(+0.477)#86 |
| 87. | Long Branch | 0.50% | 0.060%(+0.438)#7 | 0.022%(+0.476)#87 |
| 88. | Guymon | 0.49% | 0.0043%(+0.490)#1 | 0.022%(+0.472)#88 |
| 89. | Garden City | 0.49% | 0.018%(+0.476)#1 | 0.022%(+0.472)#89 |
| 90. | Martinez | 0.48% | 0.016%(+0.466)#1 | 0.022%(+0.461)#90 |
| 91. | Evanston | 0.48% | 0.017%(+0.464)#3 | 0.022%(+0.459)#91 |
| 92. | Henderson | 0.48% | 0.022%(+0.458)#5 | 0.022%(+0.458)#92 |
| 93. | Burnsville | 0.48% | 0.068%(+0.408)#9 | 0.022%(+0.454)#93 |
| 94. | Ramsey | 0.48% | 0.068%(+0.407)#10 | 0.022%(+0.453)#94 |
| 95. | Buckhall | 0.47% | 0.060%(+0.413)#8 | 0.022%(+0.451)#95 |
| 96. | Ames | 0.47% | 0.21%(+0.256)#14 | 0.022%(+0.447)#96 |
| 97. | Valinda | 0.46% | 0.010%(+0.454)#2 | 0.022%(+0.443)#97 |
| 98. | Faribault | 0.46% | 0.068%(+0.395)#11 | 0.022%(+0.441)#98 |
| 99. | Lower Allen | 0.46% | 0.0081%(+0.454)#2 | 0.022%(+0.441)#99 |
| 100. | Avondale | 0.44% | 0.035%(+0.408)#1 | 0.022%(+0.421)#100 |
Common Questions
What are the Top 10 Cities with the Highest Percentage of Sudanese Population in the United States?
Top 10 Cities with the Highest Percentage of Sudanese Population in the United States are:
#1
10.12%
#2
6.47%
#3
6.27%
#4
5.26%
#5
4.65%
#6
3.84%
#7
3.58%
#8
2.93%
#9
2.78%
#10
2.72%
What city has the Highest Percentage of Sudanese Population in the United States?
New Stuyahok has the Highest Percentage of Sudanese Population in the United States with 10.12%.
What is the Percentage of Sudanese Population in the United States?
Percentage of Sudanese Population in the United States is 0.022%.