Lely Resort, FL Map & Demographics
Lely Resort Map
Lely Resort Overview
$58,504
PER CAPITA INCOME
$95,635
AVG FAMILY INCOME
$80,290
AVG HOUSEHOLD INCOME
9.1%
WAGE / INCOME GAP [ % ]
90.9¢/ $1
WAGE / INCOME GAP [ $ ]
0.47
INEQUALITY / GINI INDEX
7,505
TOTAL POPULATION
3,490
MALE POPULATION
4,015
FEMALE POPULATION
86.92
MALES / 100 FEMALES
115.04
FEMALES / 100 MALES
59.5
MEDIAN AGE
2.5
AVG FAMILY SIZE
2.1
AVG HOUSEHOLD SIZE
2,637
LABOR FORCE [ PEOPLE ]
40.4%
PERCENT IN LABOR FORCE
2.4%
UNEMPLOYMENT RATE
Income in Lely Resort
Income Overview in Lely Resort
Per Capita Income in Lely Resort is $58,504, while median incomes of families and households are $95,635 and $80,290 respectively.
| Characteristic | Number | Measure |
| Per Capita Income | 7,505 | $58,504 |
| Median Family Income | 2,318 | $95,635 |
| Mean Family Income | 2,318 | $125,918 |
| Median Household Income | 3,604 | $80,290 |
| Mean Household Income | 3,604 | $120,869 |
| Income Deficit | 2,318 | $0 |
| Wage / Income Gap (%) | 7,505 | 9.09% |
| Wage / Income Gap ($) | 7,505 | 90.91¢ per $1 |
| Gini / Inequality Index | 7,505 | 0.47 |
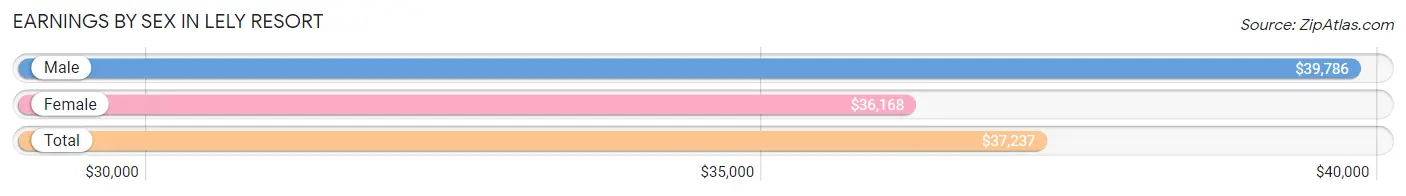
Earnings by Sex in Lely Resort
Average Earnings in Lely Resort are $37,237, $39,786 for men and $36,168 for women, a difference of 9.1%.
| Sex | Number | Average Earnings |
| Male | 1,584 (56.0%) | $39,786 |
| Female | 1,244 (44.0%) | $36,168 |
| Total | 2,828 (100.0%) | $37,237 |
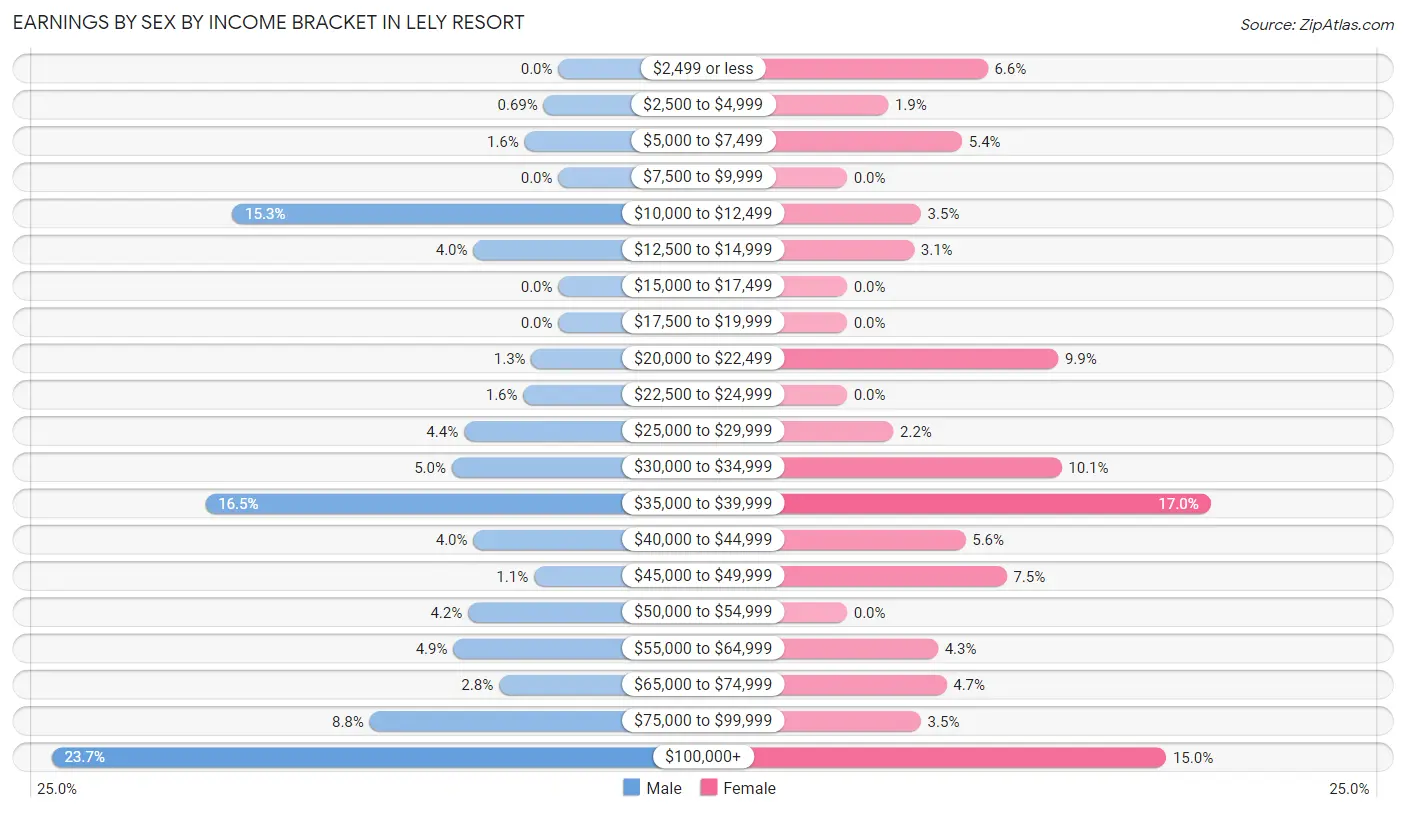
Earnings by Sex by Income Bracket in Lely Resort
The most common earnings brackets in Lely Resort are $100,000+ for men (376 | 23.7%) and $35,000 to $39,999 for women (212 | 17.0%).
| Income | Male | Female |
| $2,499 or less | 0 (0.0%) | 82 (6.6%) |
| $2,500 to $4,999 | 11 (0.7%) | 24 (1.9%) |
| $5,000 to $7,499 | 25 (1.6%) | 67 (5.4%) |
| $7,500 to $9,999 | 0 (0.0%) | 0 (0.0%) |
| $10,000 to $12,499 | 242 (15.3%) | 43 (3.5%) |
| $12,500 to $14,999 | 63 (4.0%) | 39 (3.1%) |
| $15,000 to $17,499 | 0 (0.0%) | 0 (0.0%) |
| $17,500 to $19,999 | 0 (0.0%) | 0 (0.0%) |
| $20,000 to $22,499 | 20 (1.3%) | 123 (9.9%) |
| $22,500 to $24,999 | 26 (1.6%) | 0 (0.0%) |
| $25,000 to $29,999 | 70 (4.4%) | 27 (2.2%) |
| $30,000 to $34,999 | 79 (5.0%) | 125 (10.1%) |
| $35,000 to $39,999 | 262 (16.5%) | 212 (17.0%) |
| $40,000 to $44,999 | 63 (4.0%) | 69 (5.6%) |
| $45,000 to $49,999 | 18 (1.1%) | 93 (7.5%) |
| $50,000 to $54,999 | 67 (4.2%) | 0 (0.0%) |
| $55,000 to $64,999 | 78 (4.9%) | 53 (4.3%) |
| $65,000 to $74,999 | 44 (2.8%) | 58 (4.7%) |
| $75,000 to $99,999 | 140 (8.8%) | 43 (3.5%) |
| $100,000+ | 376 (23.7%) | 186 (14.9%) |
| Total | 1,584 (100.0%) | 1,244 (100.0%) |
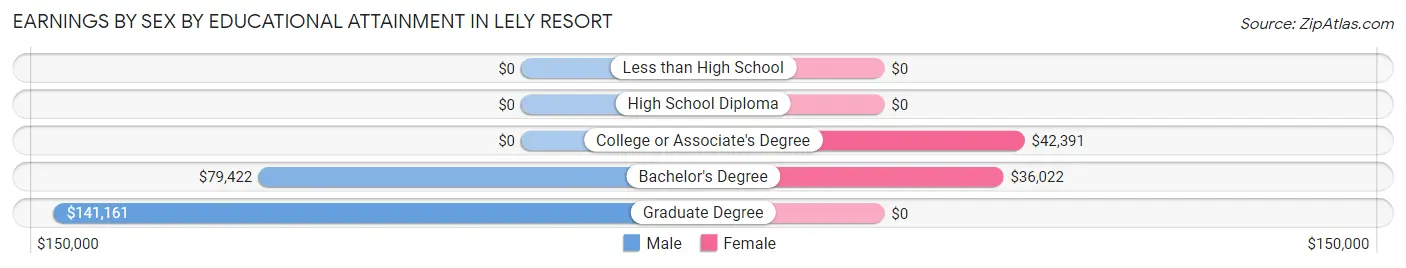
Earnings by Sex by Educational Attainment in Lely Resort
Average earnings in Lely Resort are $40,000 for men and $36,510 for women, a difference of 8.7%. Men with an educational attainment of graduate degree enjoy the highest average annual earnings of $141,161, while those with bachelor's degree education earn the least with $79,422. Women with an educational attainment of college or associate's degree earn the most with the average annual earnings of $42,391, while those with bachelor's degree education have the smallest earnings of $36,022.
| Educational Attainment | Male Income | Female Income |
| Less than High School | - | - |
| High School Diploma | - | - |
| College or Associate's Degree | - | - |
| Bachelor's Degree | $79,422 | $36,022 |
| Graduate Degree | $141,161 | $0 |
| Total | $40,000 | $36,510 |
Family Income in Lely Resort
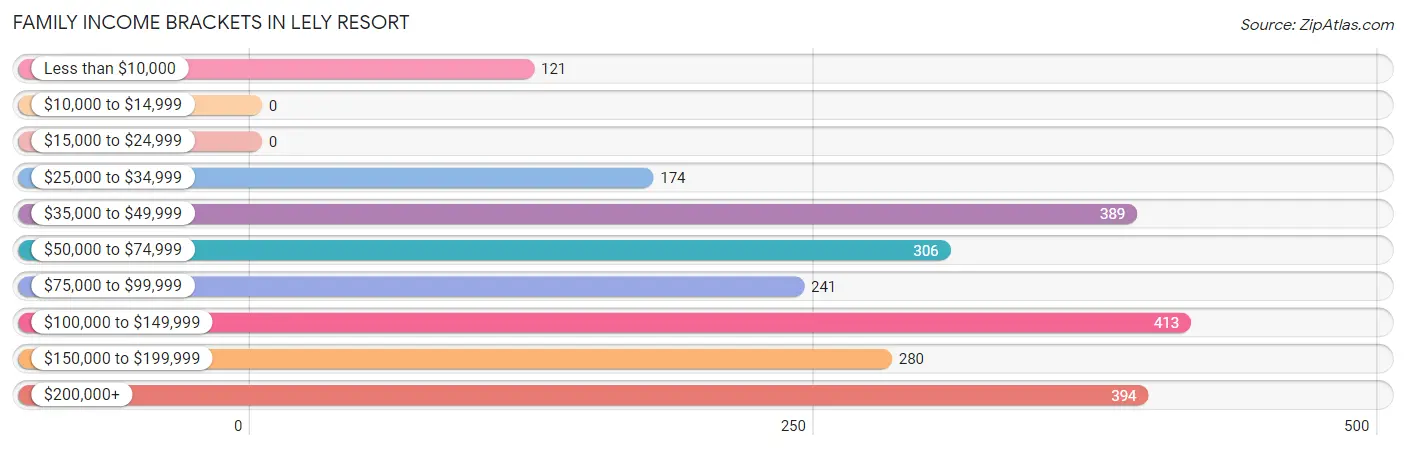
Family Income Brackets in Lely Resort
According to the Lely Resort family income data, there are 413 families falling into the $100,000 to $149,999 income range, which is the most common income bracket and makes up 17.8% of all families.
| Income Bracket | # Families | % Families |
| Less than $10,000 | 121 | 5.2% |
| $10,000 to $14,999 | 0 | 0.0% |
| $15,000 to $24,999 | 0 | 0.0% |
| $25,000 to $34,999 | 174 | 7.5% |
| $35,000 to $49,999 | 389 | 16.8% |
| $50,000 to $74,999 | 306 | 13.2% |
| $75,000 to $99,999 | 241 | 10.4% |
| $100,000 to $149,999 | 413 | 17.8% |
| $150,000 to $199,999 | 280 | 12.1% |
| $200,000+ | 394 | 17.0% |
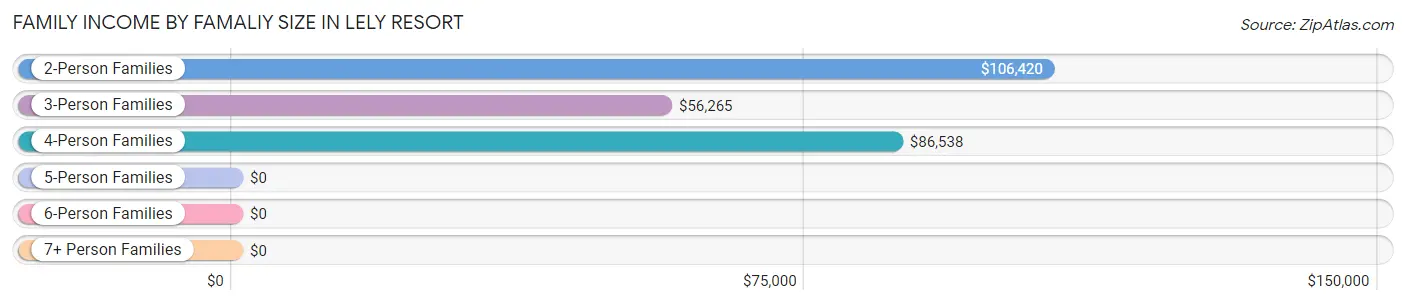
Family Income by Famaliy Size in Lely Resort
2-person families (1,679 | 72.4%) account for the highest median family income in Lely Resort with $106,420 per family, while 2-person families (1,679 | 72.4%) have the highest median income of $53,210 per family member.
| Income Bracket | # Families | Median Income |
| 2-Person Families | 1,679 (72.4%) | $106,420 |
| 3-Person Families | 427 (18.4%) | $56,265 |
| 4-Person Families | 212 (9.1%) | $86,538 |
| 5-Person Families | 0 (0.0%) | $0 |
| 6-Person Families | 0 (0.0%) | $0 |
| 7+ Person Families | 0 (0.0%) | $0 |
| Total | 2,318 (100.0%) | $95,635 |
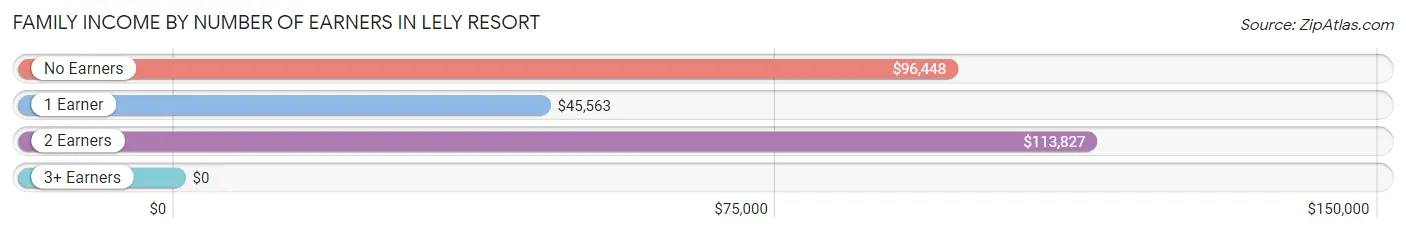
Family Income by Number of Earners in Lely Resort
| Number of Earners | # Families | Median Income |
| No Earners | 1,073 (46.3%) | $96,448 |
| 1 Earner | 734 (31.7%) | $45,563 |
| 2 Earners | 450 (19.4%) | $113,827 |
| 3+ Earners | 61 (2.6%) | $0 |
| Total | 2,318 (100.0%) | $95,635 |
Household Income in Lely Resort
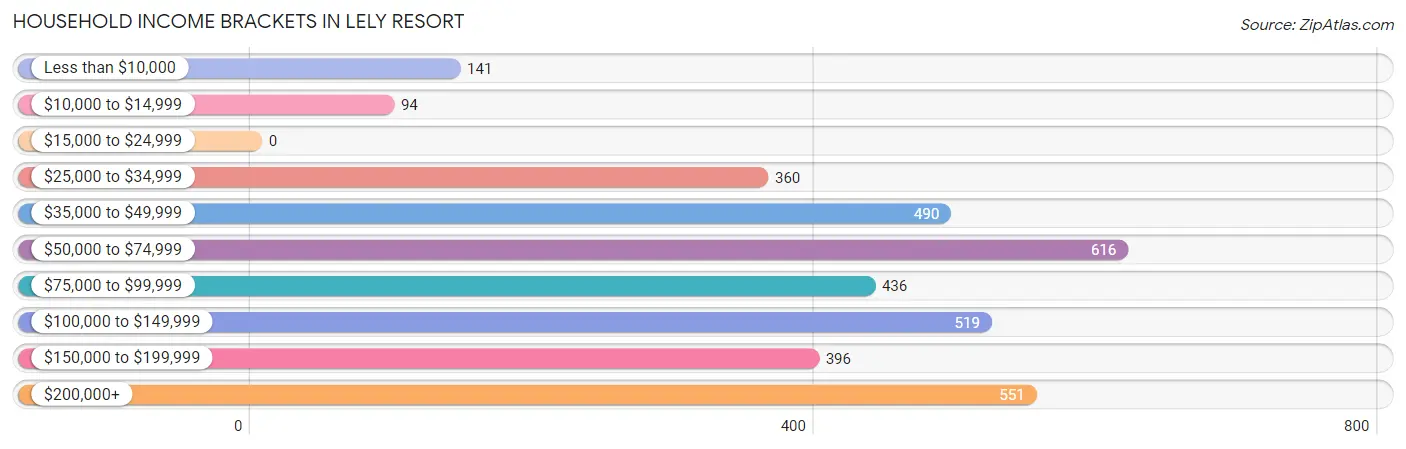
Household Income Brackets in Lely Resort
With 616 households falling in the category, the $50,000 to $74,999 income range is the most frequent in Lely Resort, accounting for 17.1% of all households.
| Income Bracket | # Households | % Households |
| Less than $10,000 | 141 | 3.9% |
| $10,000 to $14,999 | 94 | 2.6% |
| $15,000 to $24,999 | 0 | 0.0% |
| $25,000 to $34,999 | 360 | 10.0% |
| $35,000 to $49,999 | 490 | 13.6% |
| $50,000 to $74,999 | 616 | 17.1% |
| $75,000 to $99,999 | 436 | 12.1% |
| $100,000 to $149,999 | 519 | 14.4% |
| $150,000 to $199,999 | 396 | 11.0% |
| $200,000+ | 551 | 15.3% |
Household Income by Householder Age in Lely Resort
The median household income in Lely Resort is $80,290, with the highest median household income of $105,531 found in the 65+ years age bracket for the primary householder. A total of 1,919 households (53.2%) fall into this category. Meanwhile, the 15 to 24 years age bracket for the primary householder has the lowest median household income of $0, with 50 households (1.4%) in this group.
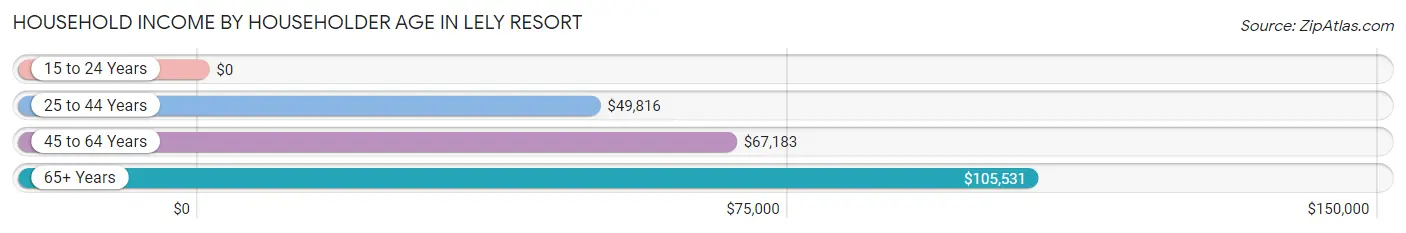
| Income Bracket | # Households | Median Income |
| 15 to 24 Years | 50 (1.4%) | $0 |
| 25 to 44 Years | 787 (21.8%) | $49,816 |
| 45 to 64 Years | 848 (23.5%) | $67,183 |
| 65+ Years | 1,919 (53.2%) | $105,531 |
| Total | 3,604 (100.0%) | $80,290 |
Poverty in Lely Resort
Income Below Poverty by Sex and Age in Lely Resort
With 12.9% poverty level for males and 4.3% for females among the residents of Lely Resort, 35 to 44 year old males and 55 to 64 year old females are the most vulnerable to poverty, with 213 males (44.3%) and 111 females (21.5%) in their respective age groups living below the poverty level.
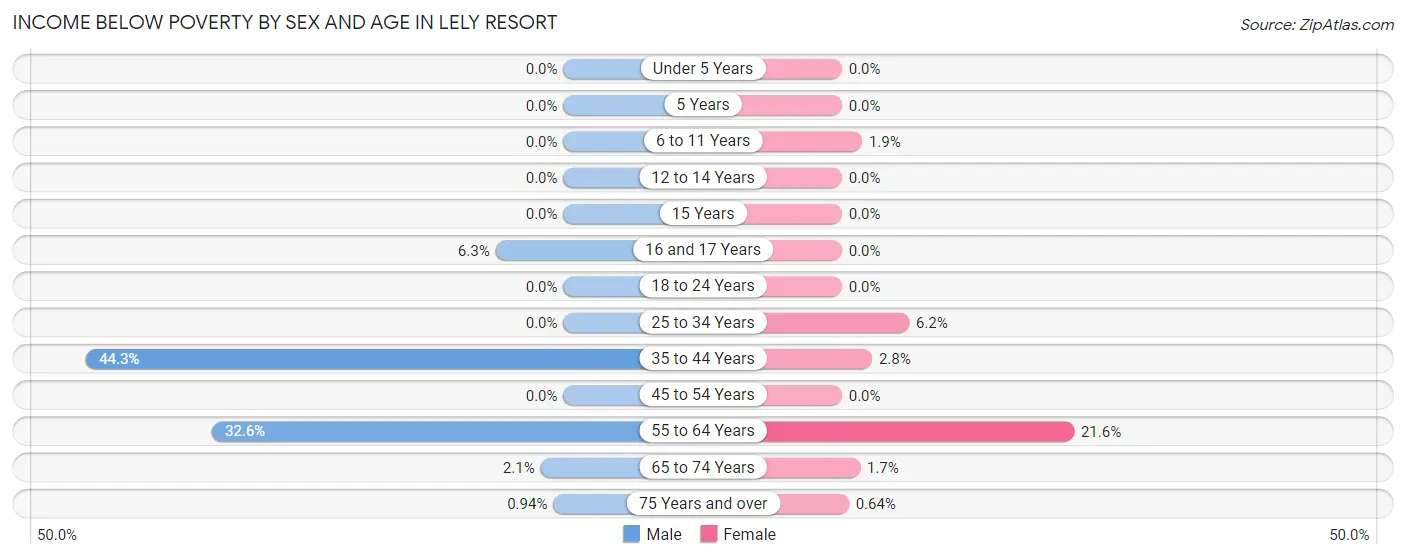
| Age Bracket | Male | Female |
| Under 5 Years | 0 (0.0%) | 0 (0.0%) |
| 5 Years | 0 (0.0%) | 0 (0.0%) |
| 6 to 11 Years | 0 (0.0%) | 7 (1.9%) |
| 12 to 14 Years | 0 (0.0%) | 0 (0.0%) |
| 15 Years | 0 (0.0%) | 0 (0.0%) |
| 16 and 17 Years | 8 (6.3%) | 0 (0.0%) |
| 18 to 24 Years | 0 (0.0%) | 0 (0.0%) |
| 25 to 34 Years | 0 (0.0%) | 29 (6.2%) |
| 35 to 44 Years | 213 (44.3%) | 6 (2.8%) |
| 45 to 54 Years | 0 (0.0%) | 0 (0.0%) |
| 55 to 64 Years | 209 (32.6%) | 111 (21.5%) |
| 65 to 74 Years | 12 (2.1%) | 12 (1.7%) |
| 75 Years and over | 7 (0.9%) | 7 (0.6%) |
| Total | 449 (12.9%) | 172 (4.3%) |
Income Above Poverty by Sex and Age in Lely Resort
According to the poverty statistics in Lely Resort, males aged under 5 years and females aged under 5 years are the age groups that are most secure financially, with 100.0% of males and 100.0% of females in these age groups living above the poverty line.
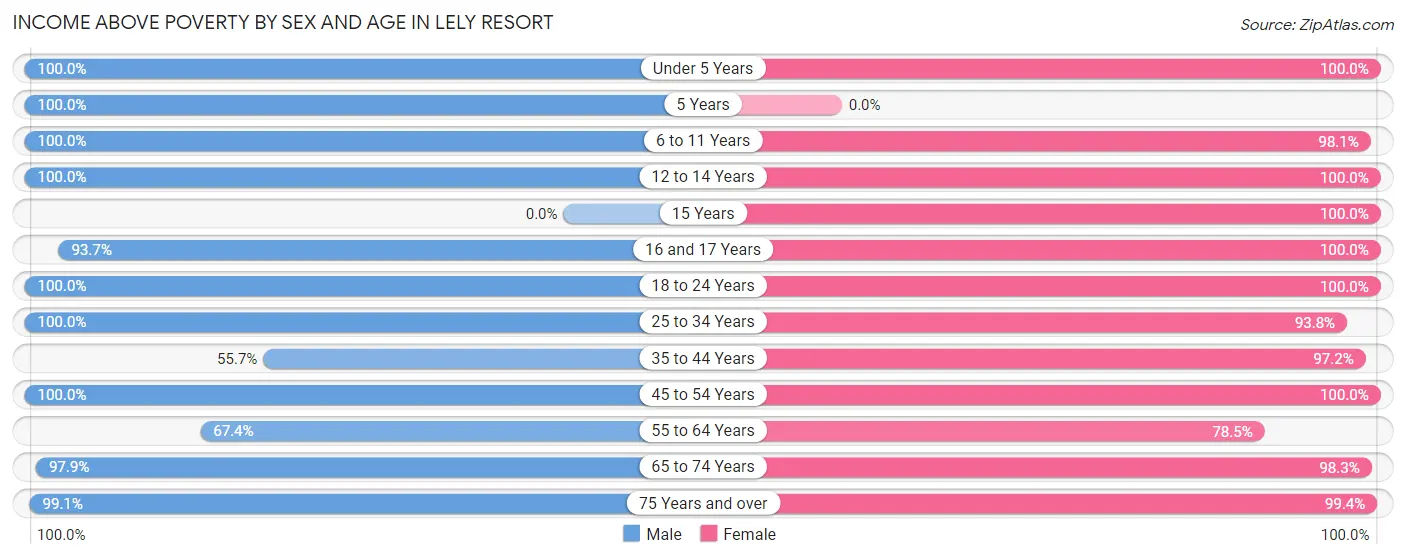
| Age Bracket | Male | Female |
| Under 5 Years | 156 (100.0%) | 68 (100.0%) |
| 5 Years | 21 (100.0%) | 0 (0.0%) |
| 6 to 11 Years | 233 (100.0%) | 367 (98.1%) |
| 12 to 14 Years | 29 (100.0%) | 43 (100.0%) |
| 15 Years | 0 (0.0%) | 28 (100.0%) |
| 16 and 17 Years | 119 (93.7%) | 118 (100.0%) |
| 18 to 24 Years | 98 (100.0%) | 76 (100.0%) |
| 25 to 34 Years | 186 (100.0%) | 436 (93.8%) |
| 35 to 44 Years | 268 (55.7%) | 208 (97.2%) |
| 45 to 54 Years | 198 (100.0%) | 283 (100.0%) |
| 55 to 64 Years | 432 (67.4%) | 404 (78.4%) |
| 65 to 74 Years | 553 (97.9%) | 699 (98.3%) |
| 75 Years and over | 737 (99.1%) | 1,087 (99.4%) |
| Total | 3,030 (87.1%) | 3,817 (95.7%) |
Income Below Poverty Among Married-Couple Families in Lely Resort
The poverty statistics for married-couple families in Lely Resort show that 5.9% or 114 of the total 1,930 families live below the poverty line. Families with no children have the highest poverty rate of 7.2%, comprising of 114 families. On the other hand, families with 1 or 2 children have the lowest poverty rate of 0.0%, which includes 0 families.
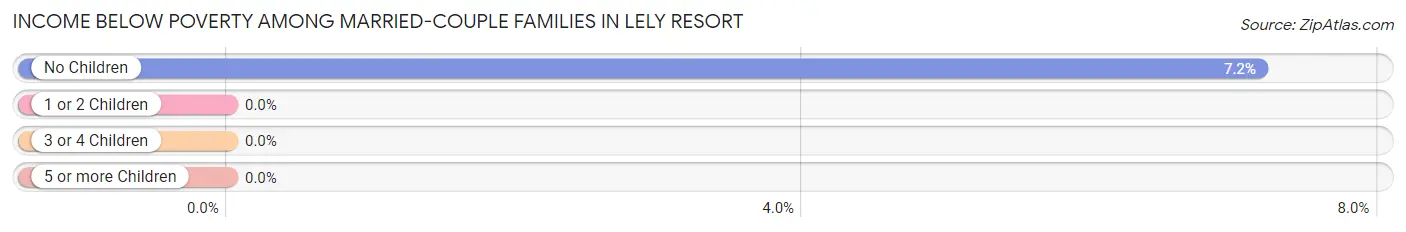
| Children | Above Poverty | Below Poverty |
| No Children | 1,475 (92.8%) | 114 (7.2%) |
| 1 or 2 Children | 341 (100.0%) | 0 (0.0%) |
| 3 or 4 Children | 0 (0.0%) | 0 (0.0%) |
| 5 or more Children | 0 (0.0%) | 0 (0.0%) |
| Total | 1,816 (94.1%) | 114 (5.9%) |
Income Below Poverty Among Single-Parent Households in Lely Resort
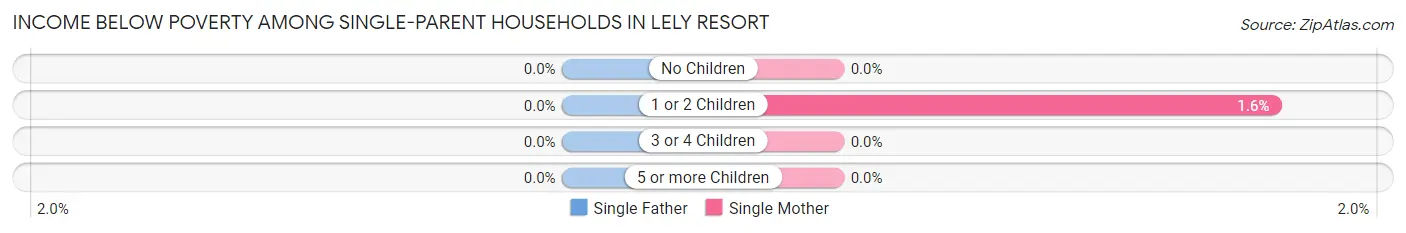
| Children | Single Father | Single Mother |
| No Children | 0 (0.0%) | 0 (0.0%) |
| 1 or 2 Children | 0 (0.0%) | 6 (1.6%) |
| 3 or 4 Children | 0 (0.0%) | 0 (0.0%) |
| 5 or more Children | 0 (0.0%) | 0 (0.0%) |
| Total | 0 (0.0%) | 6 (1.5%) |
Income Below Poverty Among Married-Couple vs Single-Parent Households in Lely Resort
The poverty data for Lely Resort shows that 114 of the married-couple family households (5.9%) and 6 of the single-parent households (1.5%) are living below the poverty level. Within the married-couple family households, those with no children have the highest poverty rate, with 114 households (7.2%) falling below the poverty line. Among the single-parent households, those with 1 or 2 children have the highest poverty rate, with 6 household (1.6%) living below poverty.
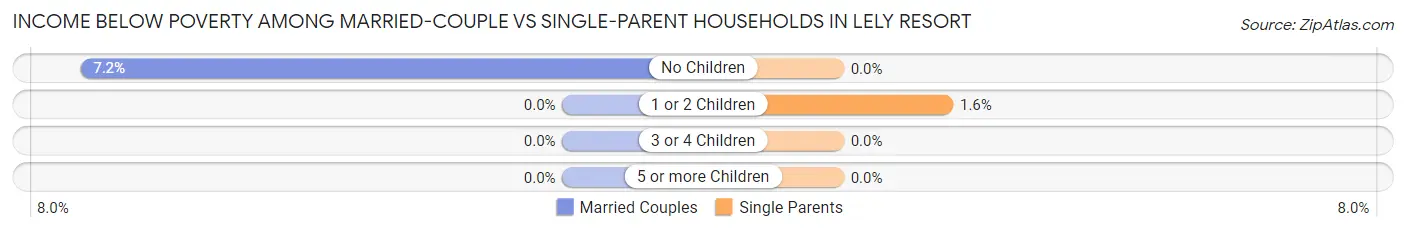
| Children | Married-Couple Families | Single-Parent Households |
| No Children | 114 (7.2%) | 0 (0.0%) |
| 1 or 2 Children | 0 (0.0%) | 6 (1.6%) |
| 3 or 4 Children | 0 (0.0%) | 0 (0.0%) |
| 5 or more Children | 0 (0.0%) | 0 (0.0%) |
| Total | 114 (5.9%) | 6 (1.5%) |
Race in Lely Resort
The most populous races in Lely Resort are White / Caucasian (5,792 | 77.2%), Black / African American (1,209 | 16.1%), and Hispanic or Latino (878 | 11.7%).
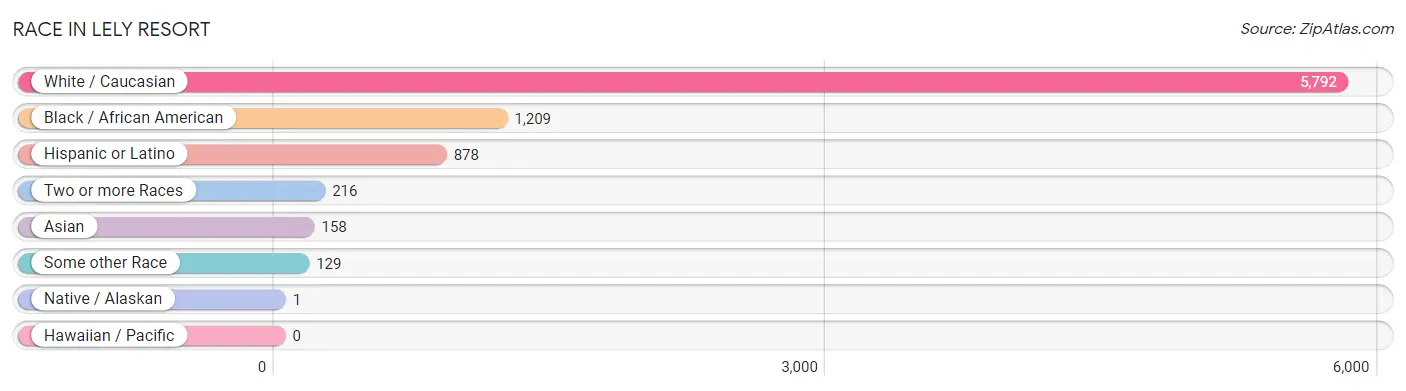
| Race | # Population | % Population |
| Asian | 158 | 2.1% |
| Black / African American | 1,209 | 16.1% |
| Hawaiian / Pacific | 0 | 0.0% |
| Hispanic or Latino | 878 | 11.7% |
| Native / Alaskan | 1 | 0.0% |
| White / Caucasian | 5,792 | 77.2% |
| Two or more Races | 216 | 2.9% |
| Some other Race | 129 | 1.7% |
| Total | 7,505 | 100.0% |
Ancestry in Lely Resort
The most populous ancestries reported in Lely Resort are Irish (1,604 | 21.4%), Italian (996 | 13.3%), German (942 | 12.6%), Haitian (881 | 11.7%), and English (510 | 6.8%), together accounting for 65.7% of all Lely Resort residents.
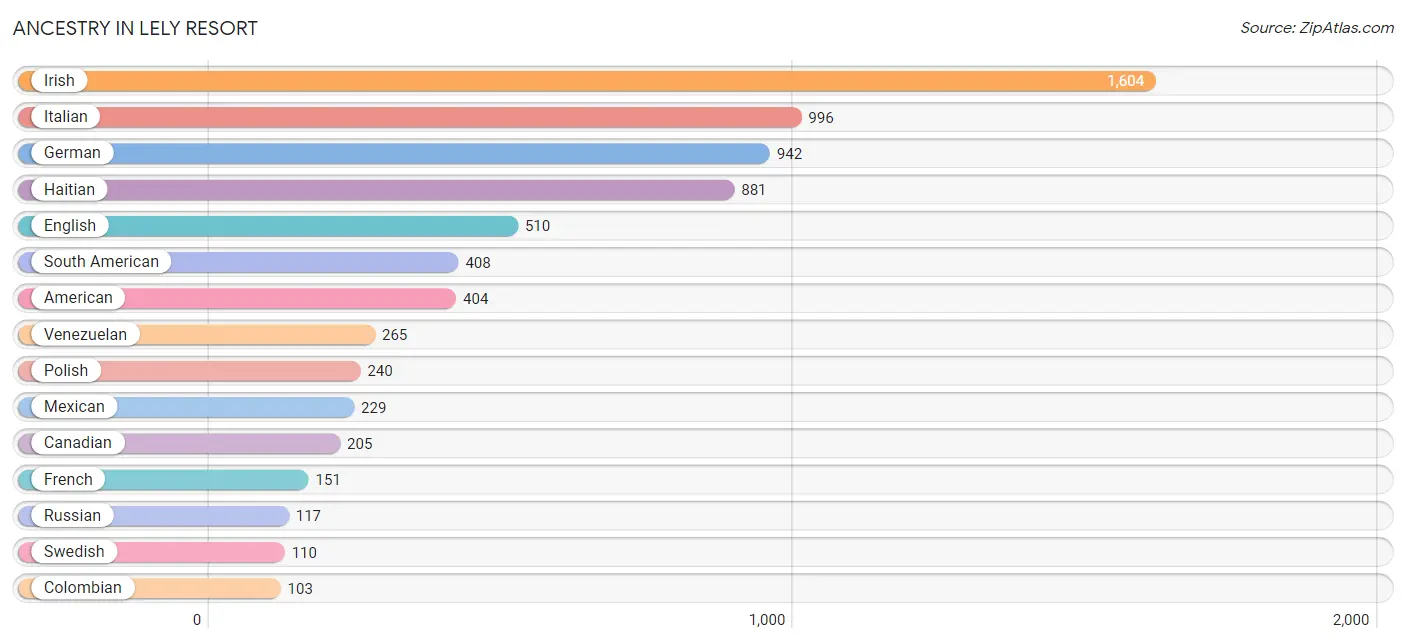
| Ancestry | # Population | % Population |
| American | 404 | 5.4% |
| Armenian | 5 | 0.1% |
| Austrian | 28 | 0.4% |
| Belgian | 13 | 0.2% |
| Bhutanese | 46 | 0.6% |
| British | 84 | 1.1% |
| Canadian | 205 | 2.7% |
| Colombian | 103 | 1.4% |
| Croatian | 21 | 0.3% |
| Cuban | 101 | 1.3% |
| Czech | 44 | 0.6% |
| Danish | 88 | 1.2% |
| Dutch | 50 | 0.7% |
| Eastern European | 53 | 0.7% |
| Ecuadorian | 40 | 0.5% |
| English | 510 | 6.8% |
| Estonian | 23 | 0.3% |
| European | 63 | 0.8% |
| Finnish | 9 | 0.1% |
| French | 151 | 2.0% |
| French Canadian | 36 | 0.5% |
| German | 942 | 12.6% |
| Haitian | 881 | 11.7% |
| Hungarian | 29 | 0.4% |
| Indian (Asian) | 28 | 0.4% |
| Indonesian | 20 | 0.3% |
| Iranian | 14 | 0.2% |
| Irish | 1,604 | 21.4% |
| Italian | 996 | 13.3% |
| Korean | 45 | 0.6% |
| Lithuanian | 5 | 0.1% |
| Mexican | 229 | 3.0% |
| Norwegian | 97 | 1.3% |
| Polish | 240 | 3.2% |
| Portuguese | 13 | 0.2% |
| Puerto Rican | 100 | 1.3% |
| Romanian | 6 | 0.1% |
| Russian | 117 | 1.6% |
| Scandinavian | 19 | 0.3% |
| Scotch-Irish | 15 | 0.2% |
| Scottish | 98 | 1.3% |
| Slovak | 16 | 0.2% |
| South American | 408 | 5.4% |
| Spaniard | 11 | 0.2% |
| Swedish | 110 | 1.5% |
| Swiss | 34 | 0.4% |
| Thai | 39 | 0.5% |
| Ukrainian | 27 | 0.4% |
| Venezuelan | 265 | 3.5% |
| West Indian | 31 | 0.4% | View All 50 Rows |
Immigrants in Lely Resort
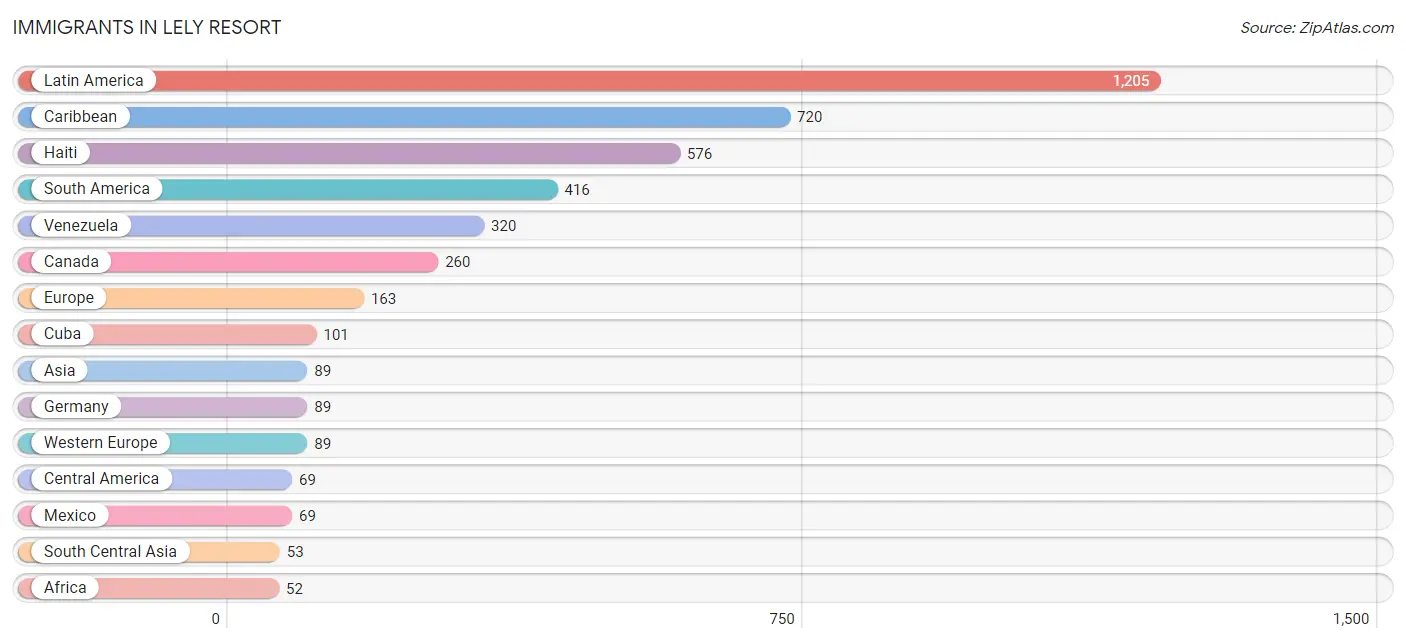
The most numerous immigrant groups reported in Lely Resort came from Latin America (1,205 | 16.1%), Caribbean (720 | 9.6%), Haiti (576 | 7.7%), South America (416 | 5.5%), and Venezuela (320 | 4.3%), together accounting for 43.1% of all Lely Resort residents.
| Immigration Origin | # Population | % Population |
| Africa | 52 | 0.7% |
| Asia | 89 | 1.2% |
| Brazil | 46 | 0.6% |
| Canada | 260 | 3.5% |
| Caribbean | 720 | 9.6% |
| Central America | 69 | 0.9% |
| Cuba | 101 | 1.3% |
| Eastern Europe | 6 | 0.1% |
| Ecuador | 40 | 0.5% |
| Egypt | 34 | 0.4% |
| Europe | 163 | 2.2% |
| Germany | 89 | 1.2% |
| Guyana | 10 | 0.1% |
| Haiti | 576 | 7.7% |
| India | 39 | 0.5% |
| Iran | 14 | 0.2% |
| Italy | 6 | 0.1% |
| Jamaica | 43 | 0.6% |
| Latin America | 1,205 | 16.1% |
| Mexico | 69 | 0.9% |
| Northern Africa | 34 | 0.4% |
| Northern Europe | 51 | 0.7% |
| Philippines | 36 | 0.5% |
| Romania | 6 | 0.1% |
| South Africa | 18 | 0.2% |
| South America | 416 | 5.5% |
| South Central Asia | 53 | 0.7% |
| South Eastern Asia | 36 | 0.5% |
| Southern Europe | 17 | 0.2% |
| Spain | 11 | 0.2% |
| Venezuela | 320 | 4.3% |
| Western Europe | 89 | 1.2% | View All 32 Rows |
Sex and Age in Lely Resort
Sex and Age in Lely Resort
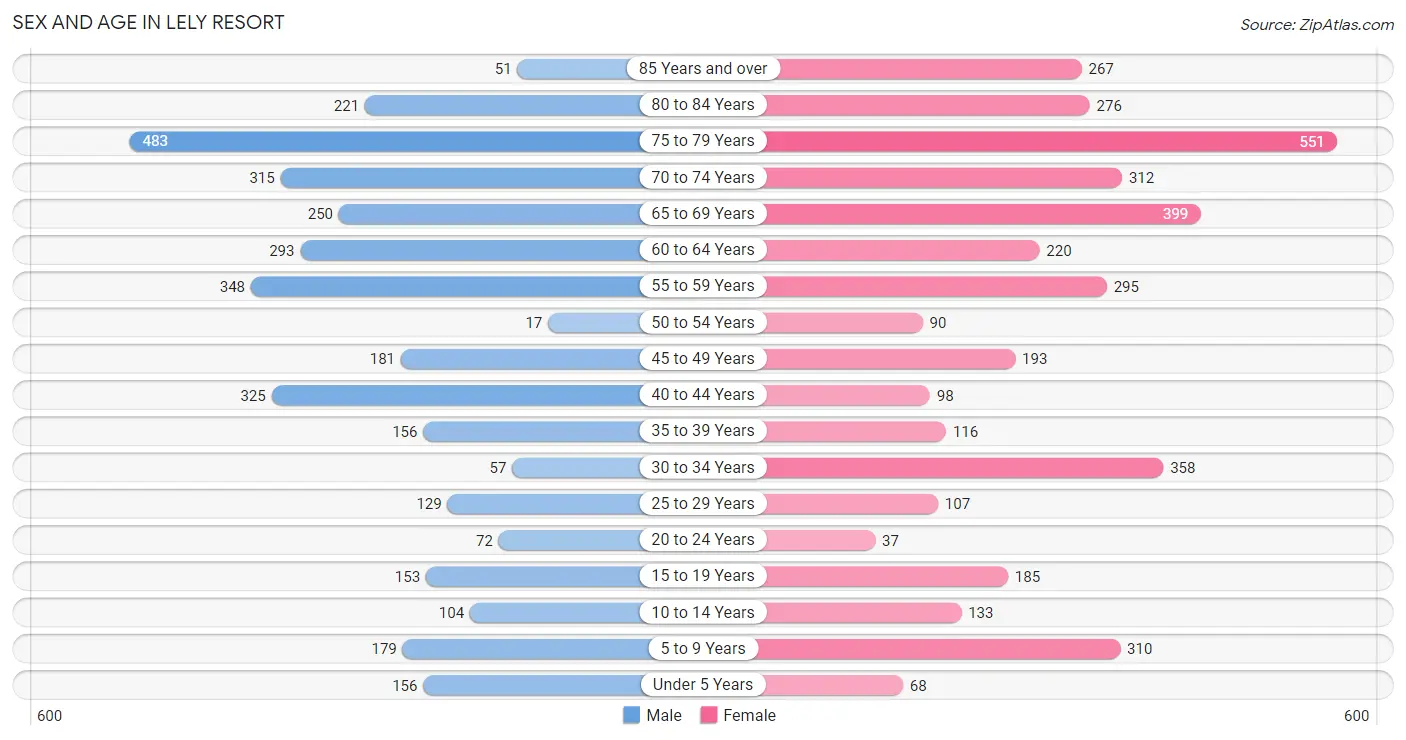
The most populous age groups in Lely Resort are 75 to 79 Years (483 | 13.8%) for men and 75 to 79 Years (551 | 13.7%) for women.
| Age Bracket | Male | Female |
| Under 5 Years | 156 (4.5%) | 68 (1.7%) |
| 5 to 9 Years | 179 (5.1%) | 310 (7.7%) |
| 10 to 14 Years | 104 (3.0%) | 133 (3.3%) |
| 15 to 19 Years | 153 (4.4%) | 185 (4.6%) |
| 20 to 24 Years | 72 (2.1%) | 37 (0.9%) |
| 25 to 29 Years | 129 (3.7%) | 107 (2.7%) |
| 30 to 34 Years | 57 (1.6%) | 358 (8.9%) |
| 35 to 39 Years | 156 (4.5%) | 116 (2.9%) |
| 40 to 44 Years | 325 (9.3%) | 98 (2.4%) |
| 45 to 49 Years | 181 (5.2%) | 193 (4.8%) |
| 50 to 54 Years | 17 (0.5%) | 90 (2.2%) |
| 55 to 59 Years | 348 (10.0%) | 295 (7.3%) |
| 60 to 64 Years | 293 (8.4%) | 220 (5.5%) |
| 65 to 69 Years | 250 (7.2%) | 399 (9.9%) |
| 70 to 74 Years | 315 (9.0%) | 312 (7.8%) |
| 75 to 79 Years | 483 (13.8%) | 551 (13.7%) |
| 80 to 84 Years | 221 (6.3%) | 276 (6.9%) |
| 85 Years and over | 51 (1.5%) | 267 (6.7%) |
| Total | 3,490 (100.0%) | 4,015 (100.0%) |
Families and Households in Lely Resort
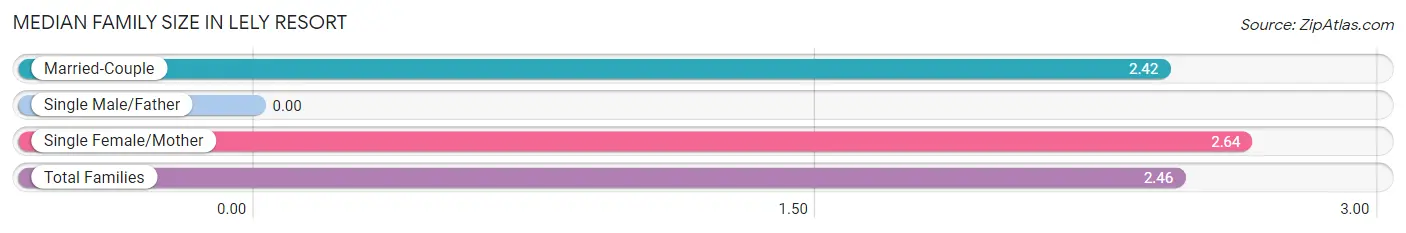
Median Family Size in Lely Resort
| Family Type | # Families | Family Size |
| Married-Couple | 1,930 (83.3%) | 2.42 |
| Single Male/Father | 0 (0.0%) | - |
| Single Female/Mother | 388 (16.7%) | 2.64 |
| Total Families | 2,318 (100.0%) | 2.46 |
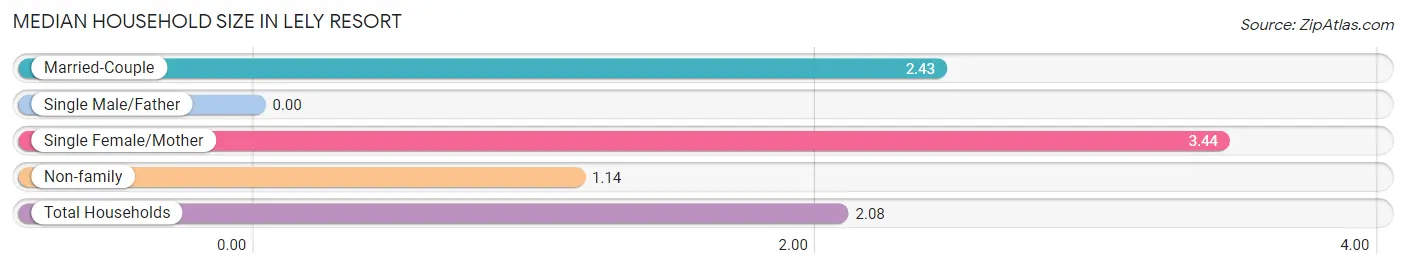
Median Household Size in Lely Resort
| Household Type | # Households | Household Size |
| Married-Couple | 1,930 (53.5%) | 2.43 |
| Single Male/Father | 0 (0.0%) | - |
| Single Female/Mother | 388 (10.8%) | 3.44 |
| Non-family | 1,286 (35.7%) | 1.14 |
| Total Households | 3,604 (100.0%) | 2.08 |
Household Size by Marriage Status in Lely Resort
Out of a total of 3,604 households in Lely Resort, 2,318 (64.3%) are family households, while 1,286 (35.7%) are nonfamily households. The most numerous type of family households are 2-person households, comprising 1,482, and the most common type of nonfamily households are 1-person households, comprising 1,097.
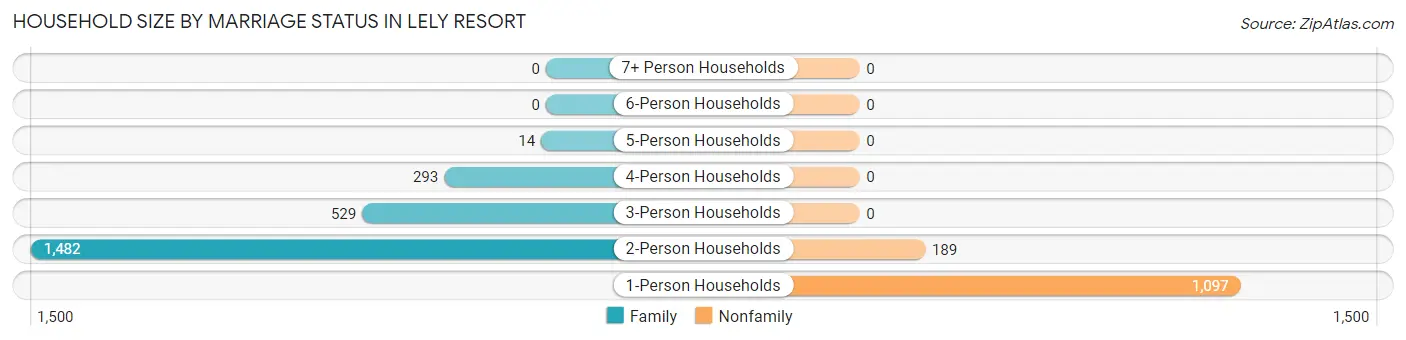
| Household Size | Family Households | Nonfamily Households |
| 1-Person Households | - | 1,097 (30.4%) |
| 2-Person Households | 1,482 (41.1%) | 189 (5.2%) |
| 3-Person Households | 529 (14.7%) | 0 (0.0%) |
| 4-Person Households | 293 (8.1%) | 0 (0.0%) |
| 5-Person Households | 14 (0.4%) | 0 (0.0%) |
| 6-Person Households | 0 (0.0%) | 0 (0.0%) |
| 7+ Person Households | 0 (0.0%) | 0 (0.0%) |
| Total | 2,318 (64.3%) | 1,286 (35.7%) |
Female Fertility in Lely Resort
Fertility by Age in Lely Resort
Average fertility rate in Lely Resort is 19.0 births per 1,000 women. Women in the age bracket of 20 to 34 years have the highest fertility rate with 44.0 births per 1,000 women. Women in the age bracket of 20 to 34 years acount for 100.0% of all women with births.
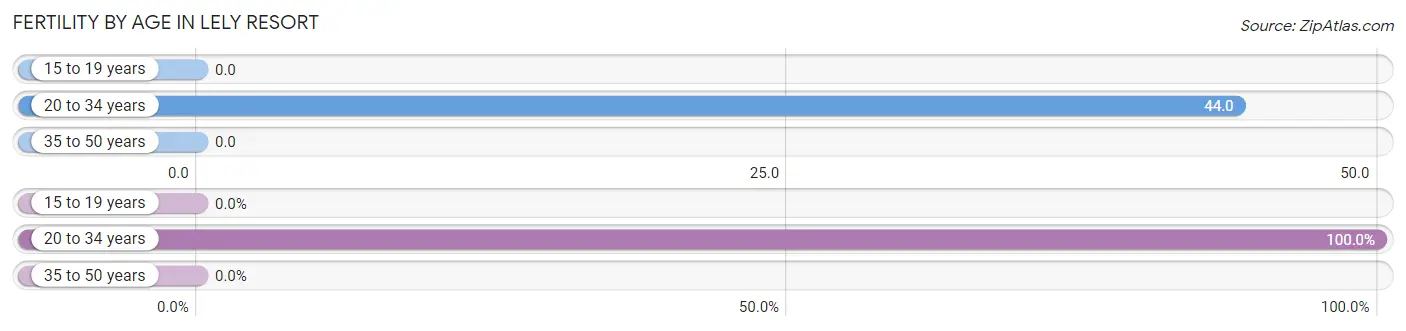
| Age Bracket | Women with Births | Births / 1,000 Women |
| 15 to 19 years | 0 (0.0%) | 0.0 |
| 20 to 34 years | 22 (100.0%) | 44.0 |
| 35 to 50 years | 0 (0.0%) | 0.0 |
| Total | 22 (100.0%) | 19.0 |
Fertility by Age by Marriage Status in Lely Resort
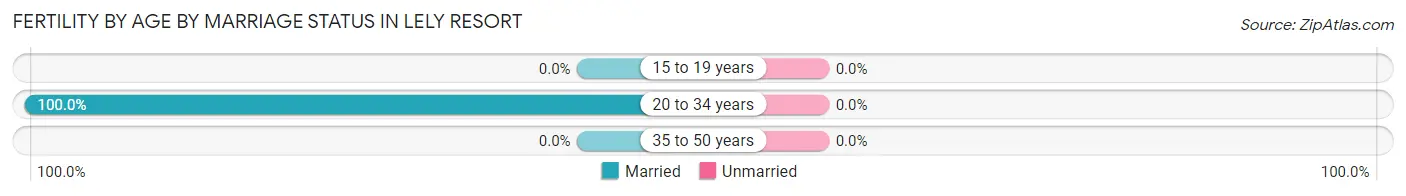
| Age Bracket | Married | Unmarried |
| 15 to 19 years | 0 (0.0%) | 0 (0.0%) |
| 20 to 34 years | 22 (100.0%) | 0 (0.0%) |
| 35 to 50 years | 0 (0.0%) | 0 (0.0%) |
| Total | 22 (100.0%) | 0 (0.0%) |
Fertility by Education in Lely Resort
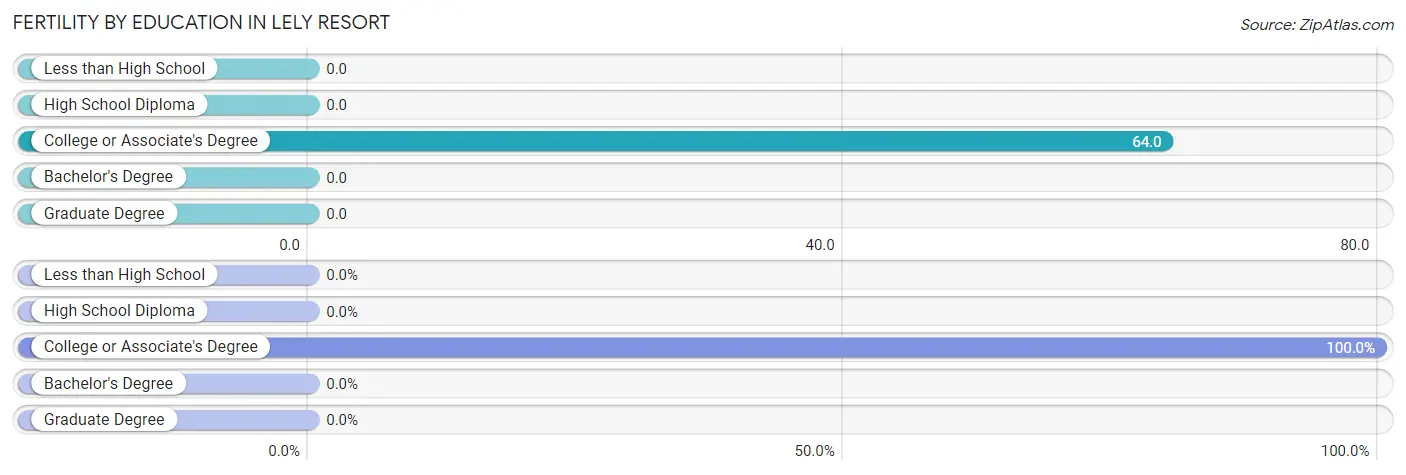
| Educational Attainment | Women with Births | Births / 1,000 Women |
| Less than High School | 0 (0.0%) | 0.0 |
| High School Diploma | 0 (0.0%) | 0.0 |
| College or Associate's Degree | 22 (100.0%) | 64.0 |
| Bachelor's Degree | 0 (0.0%) | 0.0 |
| Graduate Degree | 0 (0.0%) | 0.0 |
| Total | 22 (100.0%) | 19.0 |
Fertility by Education by Marriage Status in Lely Resort
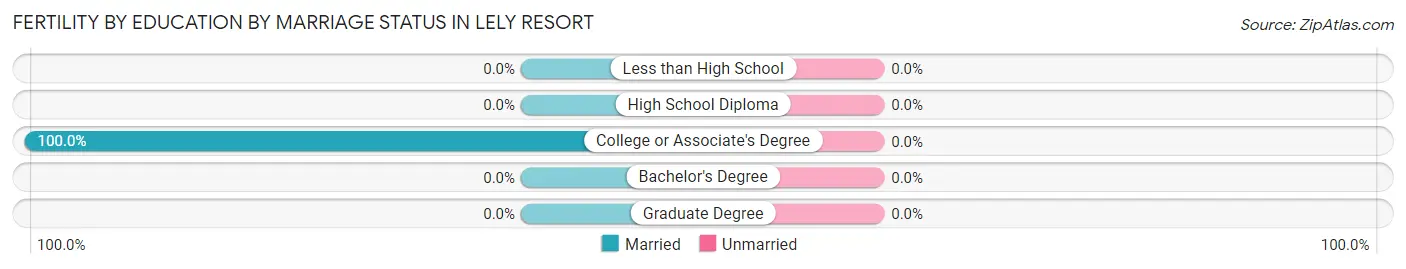
| Educational Attainment | Married | Unmarried |
| Less than High School | 0 (0.0%) | 0 (0.0%) |
| High School Diploma | 0 (0.0%) | 0 (0.0%) |
| College or Associate's Degree | 22 (100.0%) | 0 (0.0%) |
| Bachelor's Degree | 0 (0.0%) | 0 (0.0%) |
| Graduate Degree | 0 (0.0%) | 0 (0.0%) |
| Total | 22 (100.0%) | 0 (0.0%) |
Employment Characteristics in Lely Resort
Employment by Class of Employer in Lely Resort
Among the 2,576 employed individuals in Lely Resort, private company employees (1,878 | 72.9%), not-for-profit organizations (224 | 8.7%), and local government employees (138 | 5.4%) make up the most common classes of employment.
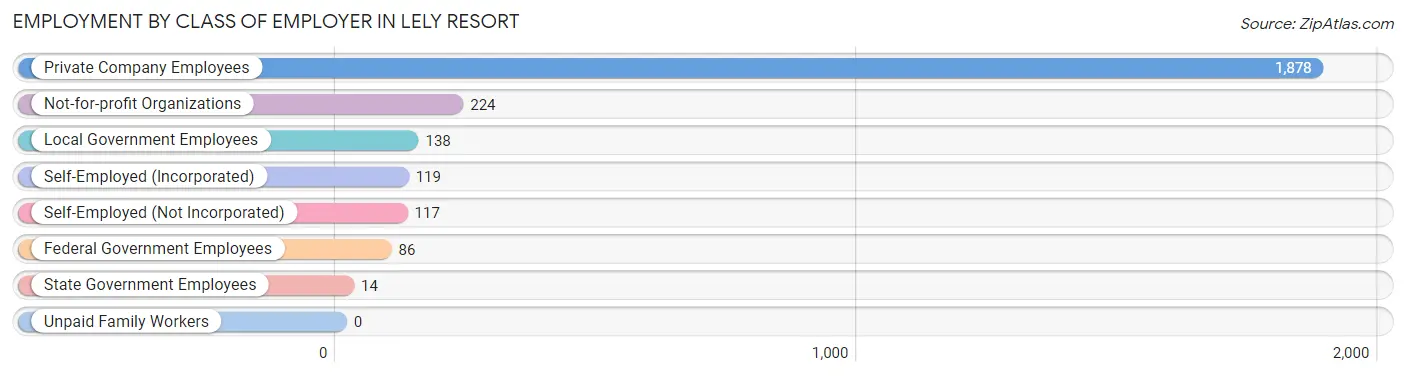
| Employer Class | # Employees | % Employees |
| Private Company Employees | 1,878 | 72.9% |
| Self-Employed (Incorporated) | 119 | 4.6% |
| Self-Employed (Not Incorporated) | 117 | 4.5% |
| Not-for-profit Organizations | 224 | 8.7% |
| Local Government Employees | 138 | 5.4% |
| State Government Employees | 14 | 0.5% |
| Federal Government Employees | 86 | 3.3% |
| Unpaid Family Workers | 0 | 0.0% |
| Total | 2,576 | 100.0% |
Employment Status by Age in Lely Resort
According to the labor force statistics for Lely Resort, out of the total population over 16 years of age (6,527), 40.4% or 2,637 individuals are in the labor force, with 2.4% or 63 of them unemployed. The age group with the highest labor force participation rate is 35 to 44 years, with 96.5% or 671 individuals in the labor force. Within the labor force, the 20 to 24 years age range has the highest percentage of unemployed individuals, with 34.9% or 29 of them being unemployed.
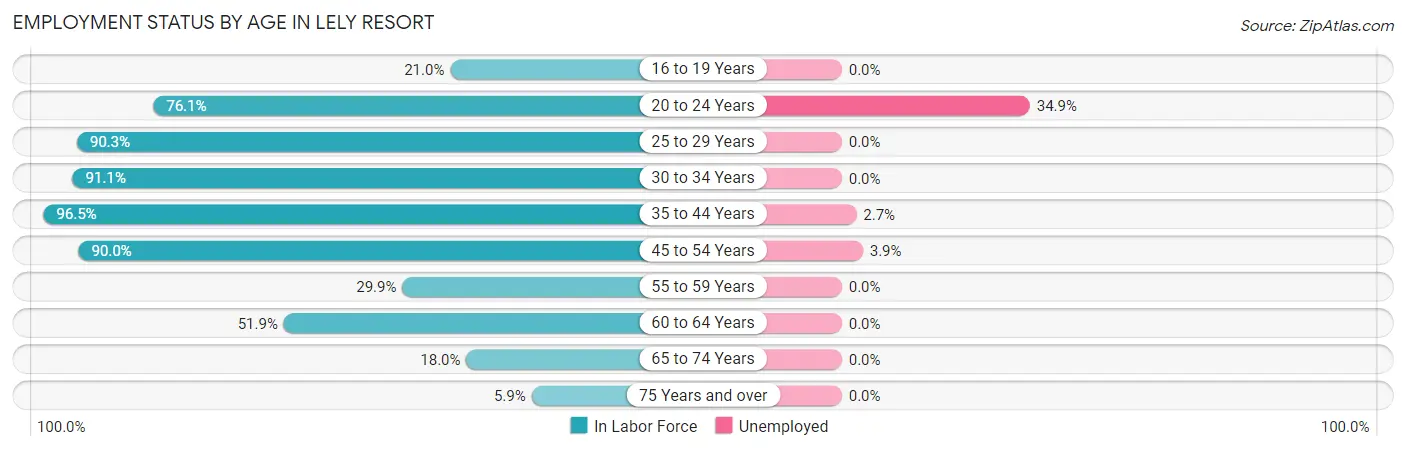
| Age Bracket | In Labor Force | Unemployed |
| 16 to 19 Years | 65 (21.0%) | 0 (0.0%) |
| 20 to 24 Years | 83 (76.1%) | 29 (34.9%) |
| 25 to 29 Years | 213 (90.3%) | 0 (0.0%) |
| 30 to 34 Years | 378 (91.1%) | 0 (0.0%) |
| 35 to 44 Years | 671 (96.5%) | 18 (2.7%) |
| 45 to 54 Years | 433 (90.0%) | 17 (3.9%) |
| 55 to 59 Years | 192 (29.9%) | 0 (0.0%) |
| 60 to 64 Years | 266 (51.9%) | 0 (0.0%) |
| 65 to 74 Years | 230 (18.0%) | 0 (0.0%) |
| 75 Years and over | 109 (5.9%) | 0 (0.0%) |
| Total | 2,637 (40.4%) | 63 (2.4%) |
Employment Status by Educational Attainment in Lely Resort
According to labor force statistics for Lely Resort, 72.2% of individuals (2,154) out of the total population between 25 and 64 years of age (2,983) are in the labor force, with 1.6% or 34 of them being unemployed. The group with the highest labor force participation rate are those with the educational attainment of high school diploma, with 94.0% or 731 individuals in the labor force. Within the labor force, individuals with college / associate degree education have the highest percentage of unemployment, with 3.0% or 17 of them being unemployed.
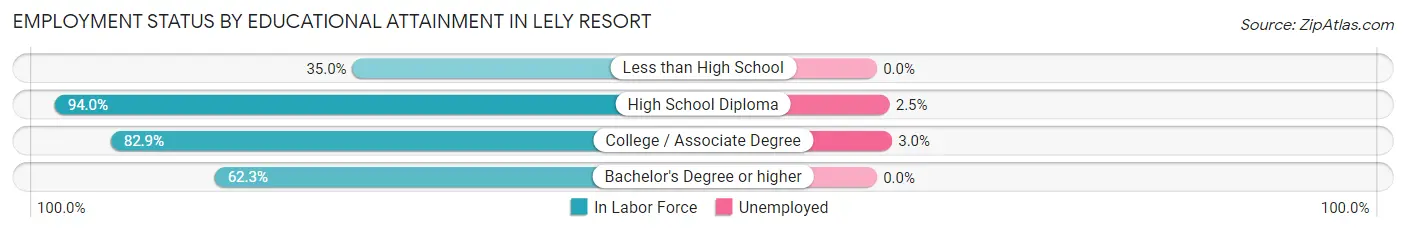
| Educational Attainment | In Labor Force | Unemployed |
| Less than High School | 117 (35.0%) | 0 (0.0%) |
| High School Diploma | 731 (94.0%) | 19 (2.5%) |
| College / Associate Degree | 559 (82.9%) | 20 (3.0%) |
| Bachelor's Degree or higher | 746 (62.3%) | 0 (0.0%) |
| Total | 2,154 (72.2%) | 48 (1.6%) |
Employment Occupations by Sex in Lely Resort
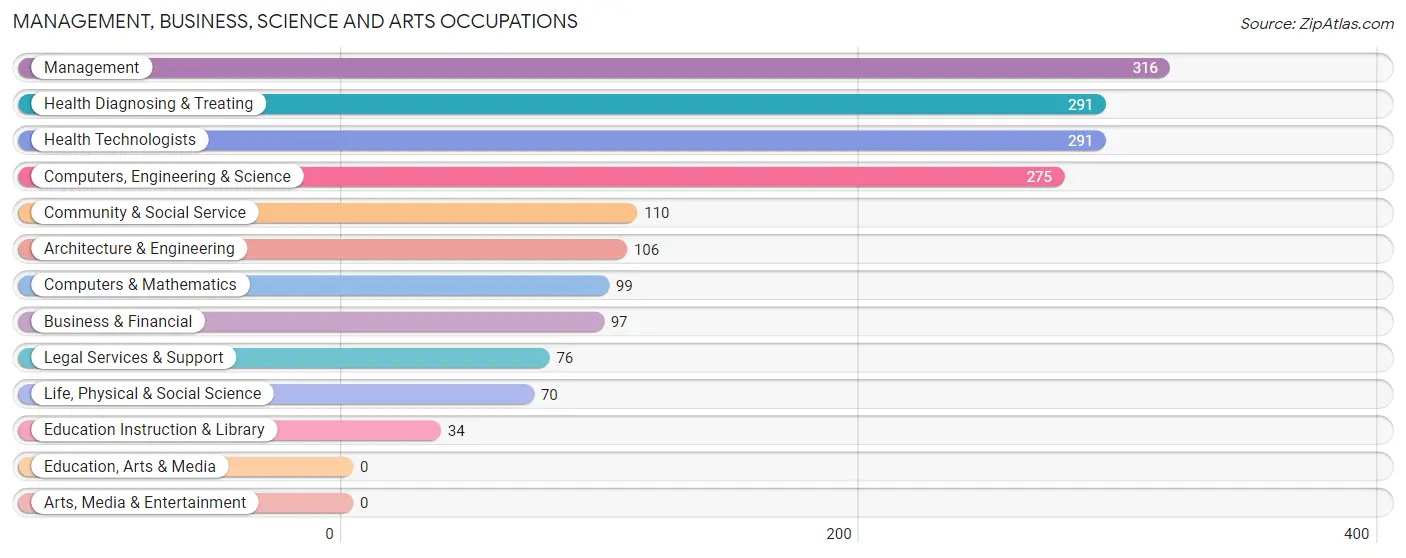
Management, Business, Science and Arts Occupations
The most common Management, Business, Science and Arts occupations in Lely Resort are Management (316 | 12.3%), Health Diagnosing & Treating (291 | 11.3%), Health Technologists (291 | 11.3%), Computers, Engineering & Science (275 | 10.7%), and Community & Social Service (110 | 4.3%).
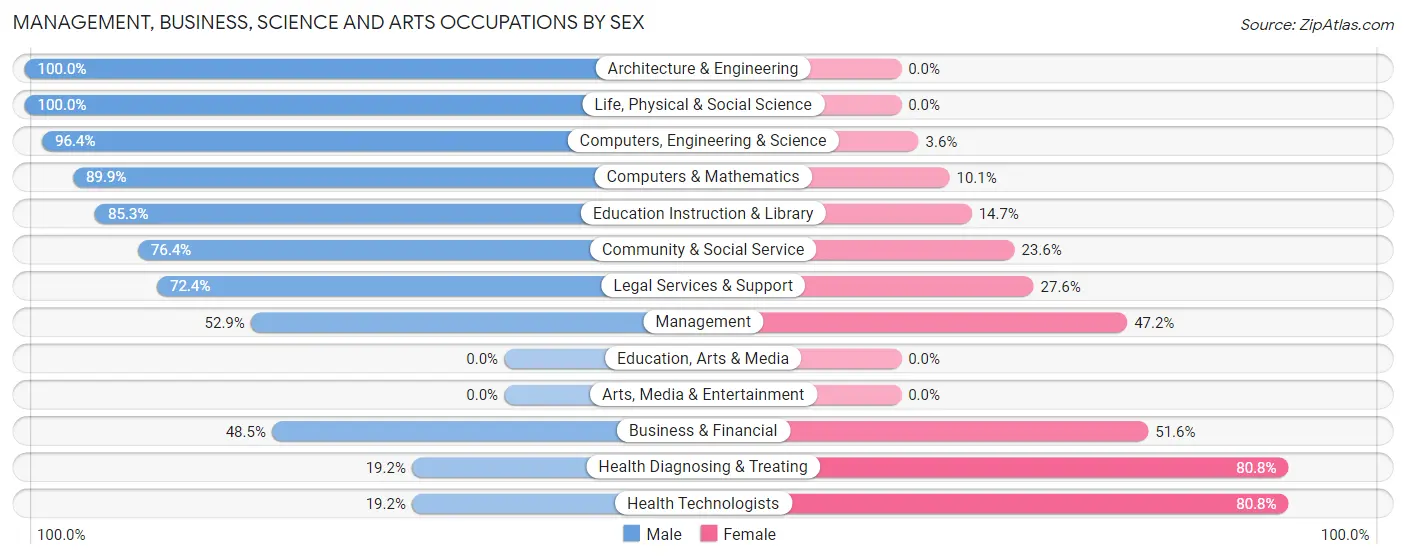
Management, Business, Science and Arts Occupations by Sex
Within the Management, Business, Science and Arts occupations in Lely Resort, the most male-oriented occupations are Architecture & Engineering (100.0%), Life, Physical & Social Science (100.0%), and Computers, Engineering & Science (96.4%), while the most female-oriented occupations are Health Diagnosing & Treating (80.8%), Health Technologists (80.8%), and Business & Financial (51.5%).
| Occupation | Male | Female |
| Management | 167 (52.8%) | 149 (47.1%) |
| Business & Financial | 47 (48.4%) | 50 (51.5%) |
| Computers, Engineering & Science | 265 (96.4%) | 10 (3.6%) |
| Computers & Mathematics | 89 (89.9%) | 10 (10.1%) |
| Architecture & Engineering | 106 (100.0%) | 0 (0.0%) |
| Life, Physical & Social Science | 70 (100.0%) | 0 (0.0%) |
| Community & Social Service | 84 (76.4%) | 26 (23.6%) |
| Education, Arts & Media | 0 (0.0%) | 0 (0.0%) |
| Legal Services & Support | 55 (72.4%) | 21 (27.6%) |
| Education Instruction & Library | 29 (85.3%) | 5 (14.7%) |
| Arts, Media & Entertainment | 0 (0.0%) | 0 (0.0%) |
| Health Diagnosing & Treating | 56 (19.2%) | 235 (80.8%) |
| Health Technologists | 56 (19.2%) | 235 (80.8%) |
| Total (Category) | 619 (56.8%) | 470 (43.2%) |
| Total (Overall) | 1,451 (56.3%) | 1,125 (43.7%) |
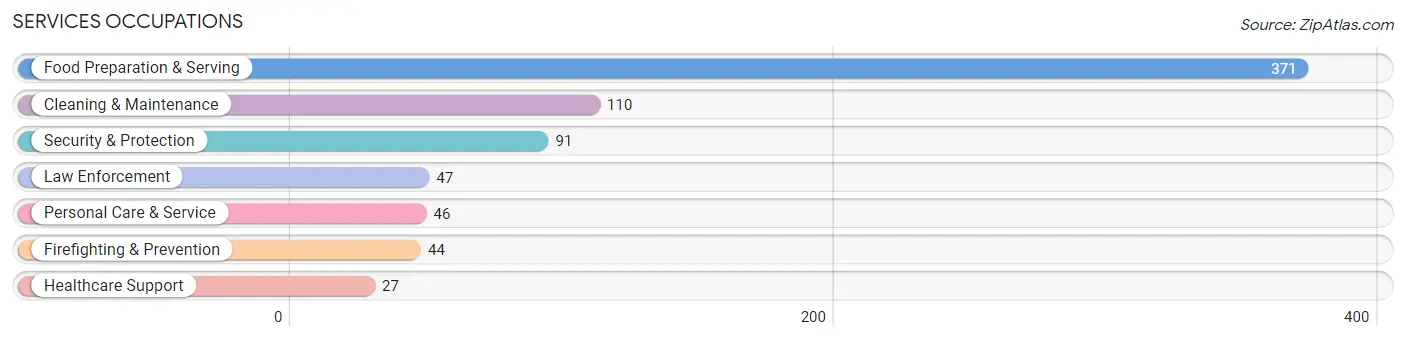
Services Occupations
The most common Services occupations in Lely Resort are Food Preparation & Serving (371 | 14.4%), Cleaning & Maintenance (110 | 4.3%), Security & Protection (91 | 3.5%), Law Enforcement (47 | 1.8%), and Personal Care & Service (46 | 1.8%).
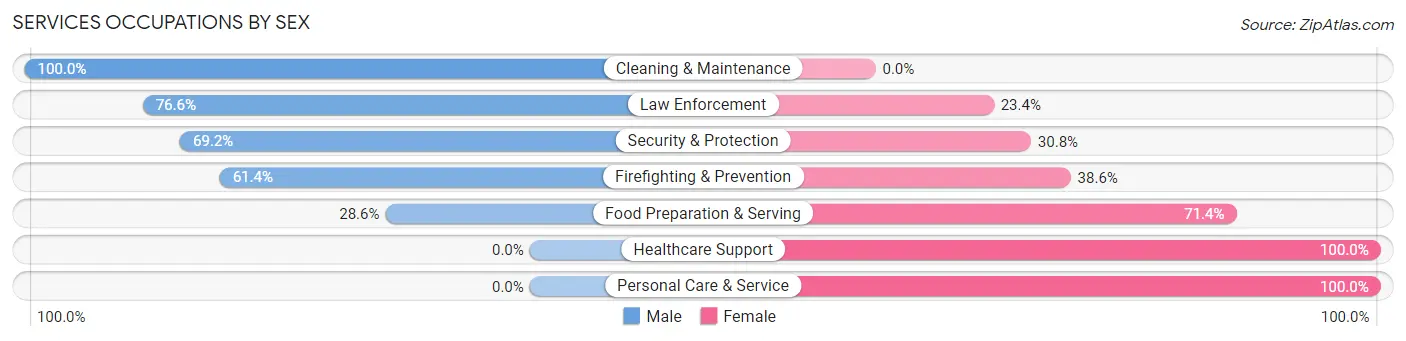
Services Occupations by Sex
Within the Services occupations in Lely Resort, the most male-oriented occupations are Cleaning & Maintenance (100.0%), Law Enforcement (76.6%), and Security & Protection (69.2%), while the most female-oriented occupations are Healthcare Support (100.0%), Personal Care & Service (100.0%), and Food Preparation & Serving (71.4%).
| Occupation | Male | Female |
| Healthcare Support | 0 (0.0%) | 27 (100.0%) |
| Security & Protection | 63 (69.2%) | 28 (30.8%) |
| Firefighting & Prevention | 27 (61.4%) | 17 (38.6%) |
| Law Enforcement | 36 (76.6%) | 11 (23.4%) |
| Food Preparation & Serving | 106 (28.6%) | 265 (71.4%) |
| Cleaning & Maintenance | 110 (100.0%) | 0 (0.0%) |
| Personal Care & Service | 0 (0.0%) | 46 (100.0%) |
| Total (Category) | 279 (43.3%) | 366 (56.7%) |
| Total (Overall) | 1,451 (56.3%) | 1,125 (43.7%) |
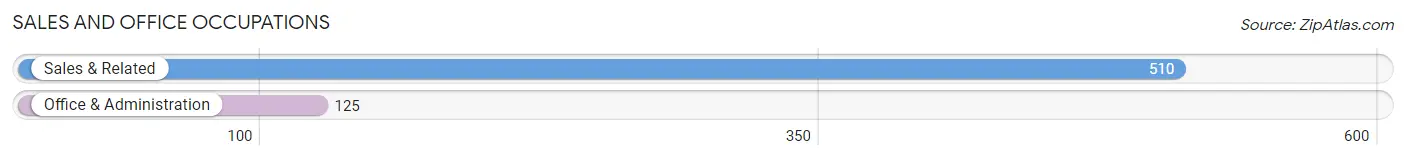
Sales and Office Occupations
The most common Sales and Office occupations in Lely Resort are Sales & Related (510 | 19.8%), and Office & Administration (125 | 4.9%).
Sales and Office Occupations by Sex
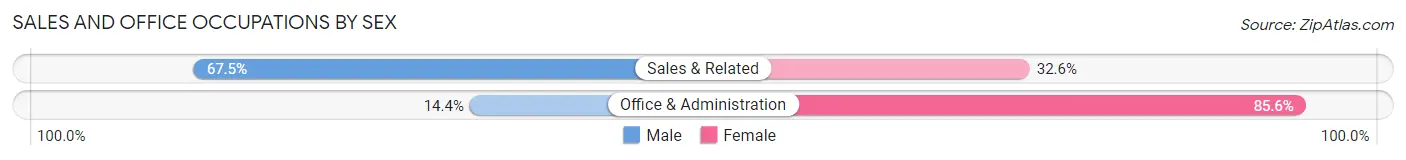
| Occupation | Male | Female |
| Sales & Related | 344 (67.4%) | 166 (32.6%) |
| Office & Administration | 18 (14.4%) | 107 (85.6%) |
| Total (Category) | 362 (57.0%) | 273 (43.0%) |
| Total (Overall) | 1,451 (56.3%) | 1,125 (43.7%) |
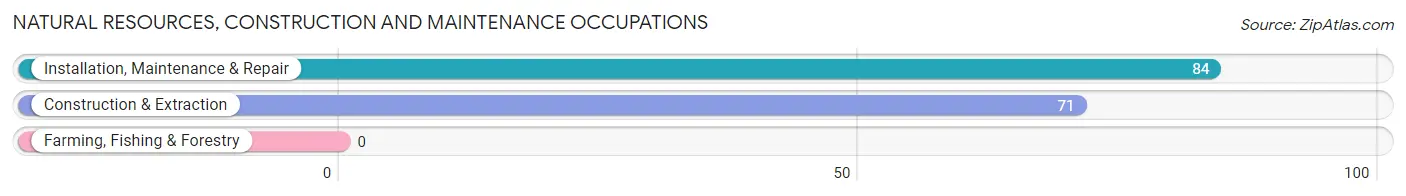
Natural Resources, Construction and Maintenance Occupations
The most common Natural Resources, Construction and Maintenance occupations in Lely Resort are Installation, Maintenance & Repair (84 | 3.3%), and Construction & Extraction (71 | 2.8%).
Natural Resources, Construction and Maintenance Occupations by Sex
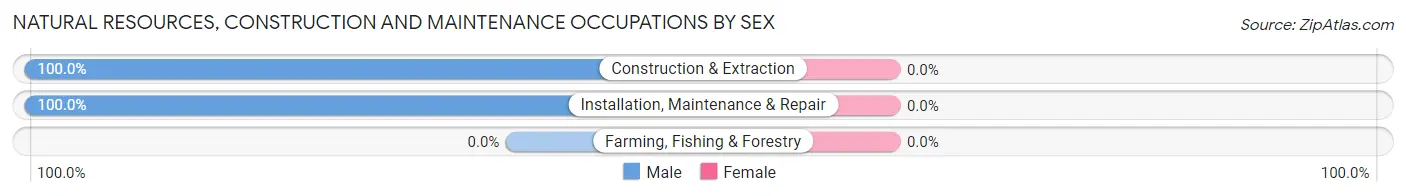
| Occupation | Male | Female |
| Farming, Fishing & Forestry | 0 (0.0%) | 0 (0.0%) |
| Construction & Extraction | 71 (100.0%) | 0 (0.0%) |
| Installation, Maintenance & Repair | 84 (100.0%) | 0 (0.0%) |
| Total (Category) | 155 (100.0%) | 0 (0.0%) |
| Total (Overall) | 1,451 (56.3%) | 1,125 (43.7%) |
Production, Transportation and Moving Occupations
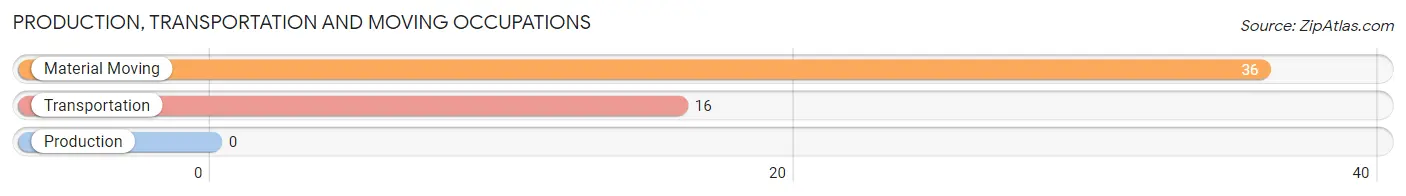
The most common Production, Transportation and Moving occupations in Lely Resort are Material Moving (36 | 1.4%), and Transportation (16 | 0.6%).
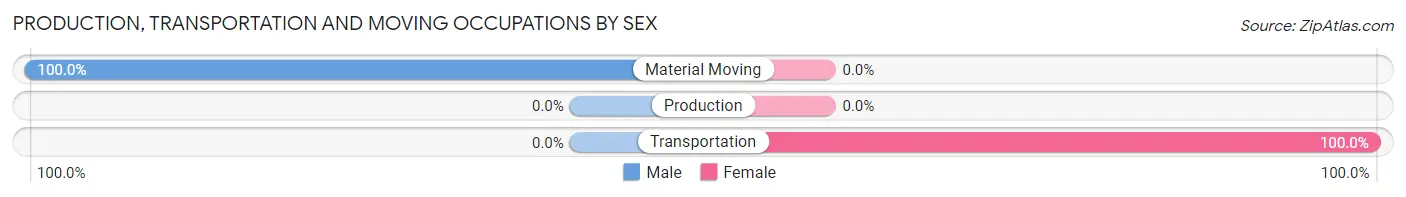
Production, Transportation and Moving Occupations by Sex
| Occupation | Male | Female |
| Production | 0 (0.0%) | 0 (0.0%) |
| Transportation | 0 (0.0%) | 16 (100.0%) |
| Material Moving | 36 (100.0%) | 0 (0.0%) |
| Total (Category) | 36 (69.2%) | 16 (30.8%) |
| Total (Overall) | 1,451 (56.3%) | 1,125 (43.7%) |
Employment Industries by Sex in Lely Resort
Employment Industries in Lely Resort
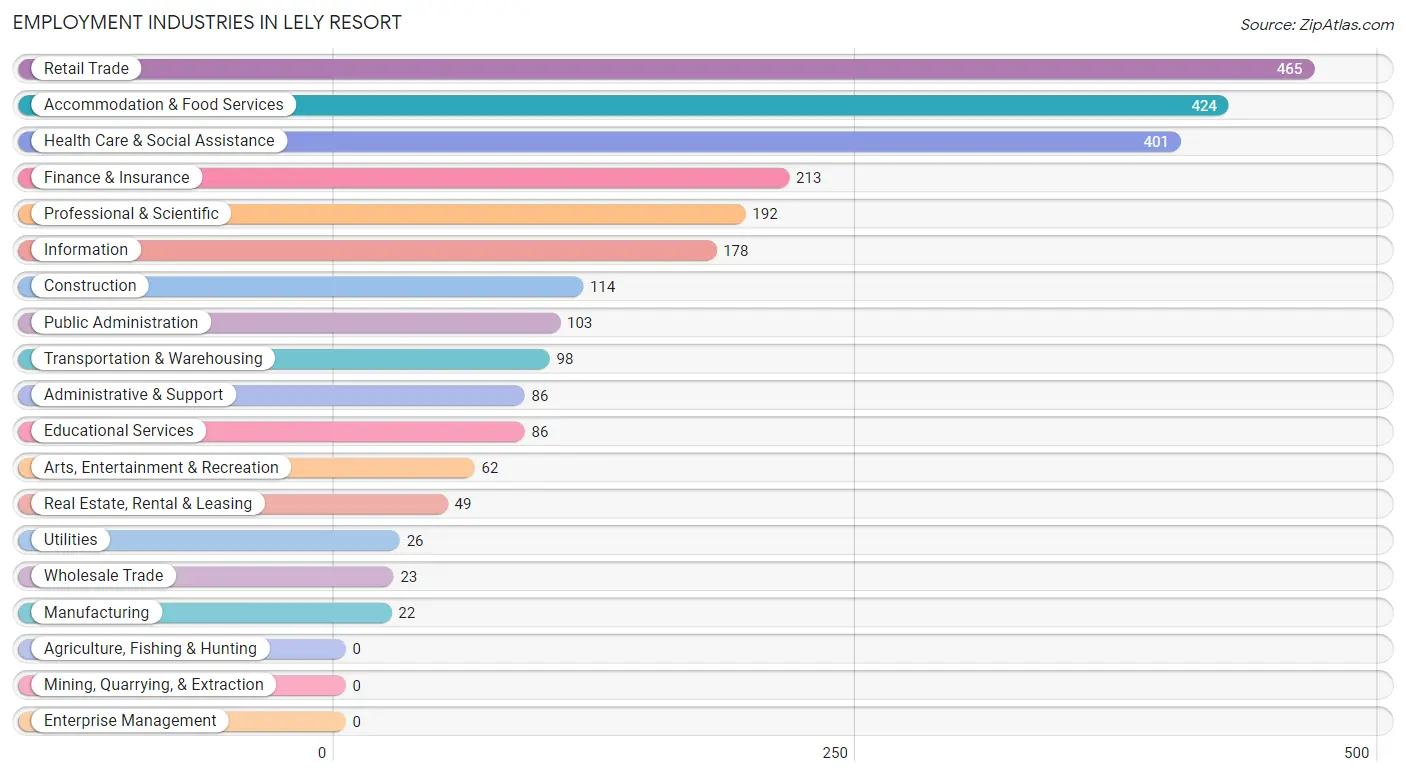
The major employment industries in Lely Resort include Retail Trade (465 | 18.0%), Accommodation & Food Services (424 | 16.5%), Health Care & Social Assistance (401 | 15.6%), Finance & Insurance (213 | 8.3%), and Professional & Scientific (192 | 7.4%).
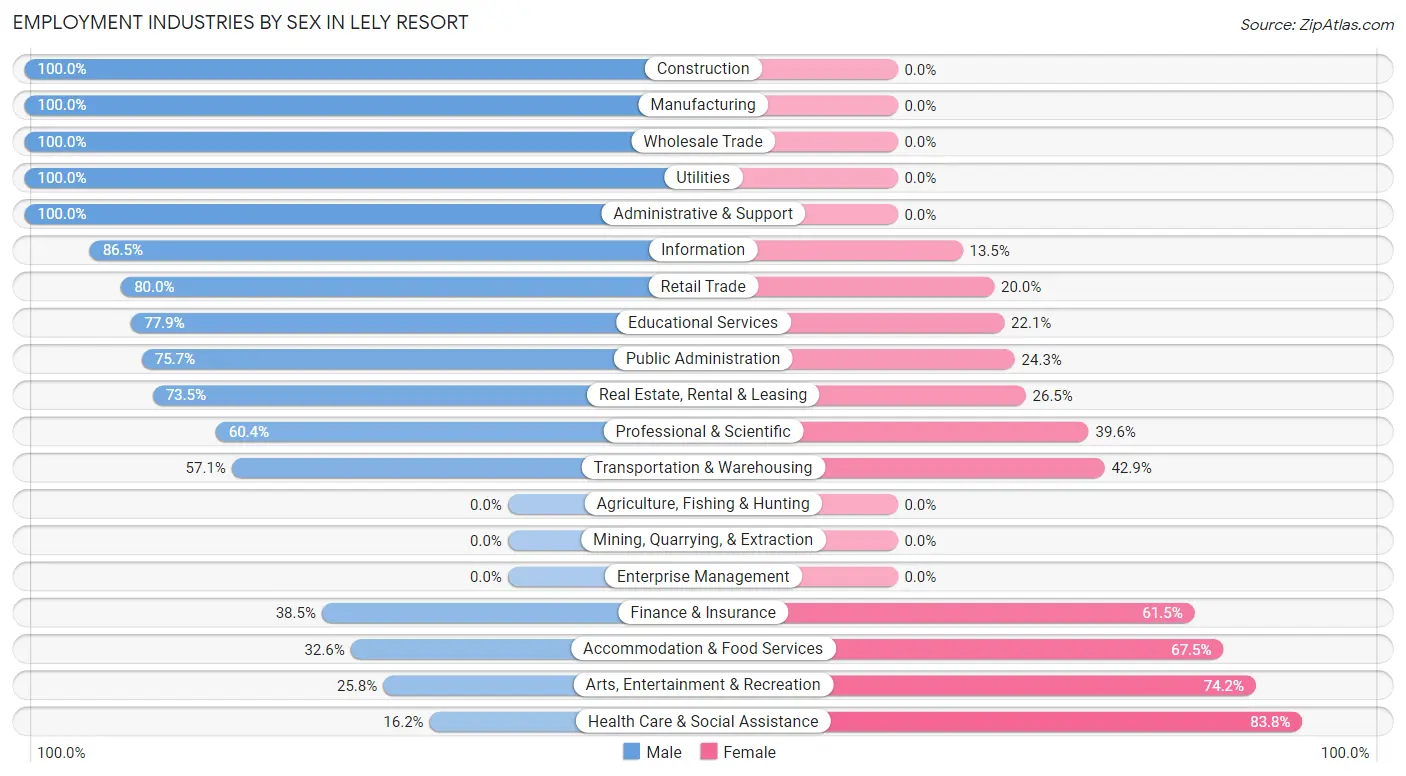
Employment Industries by Sex in Lely Resort
The Lely Resort industries that see more men than women are Construction (100.0%), Manufacturing (100.0%), and Wholesale Trade (100.0%), whereas the industries that tend to have a higher number of women are Health Care & Social Assistance (83.8%), Arts, Entertainment & Recreation (74.2%), and Accommodation & Food Services (67.4%).
| Industry | Male | Female |
| Agriculture, Fishing & Hunting | 0 (0.0%) | 0 (0.0%) |
| Mining, Quarrying, & Extraction | 0 (0.0%) | 0 (0.0%) |
| Construction | 114 (100.0%) | 0 (0.0%) |
| Manufacturing | 22 (100.0%) | 0 (0.0%) |
| Wholesale Trade | 23 (100.0%) | 0 (0.0%) |
| Retail Trade | 372 (80.0%) | 93 (20.0%) |
| Transportation & Warehousing | 56 (57.1%) | 42 (42.9%) |
| Utilities | 26 (100.0%) | 0 (0.0%) |
| Information | 154 (86.5%) | 24 (13.5%) |
| Finance & Insurance | 82 (38.5%) | 131 (61.5%) |
| Real Estate, Rental & Leasing | 36 (73.5%) | 13 (26.5%) |
| Professional & Scientific | 116 (60.4%) | 76 (39.6%) |
| Enterprise Management | 0 (0.0%) | 0 (0.0%) |
| Administrative & Support | 86 (100.0%) | 0 (0.0%) |
| Educational Services | 67 (77.9%) | 19 (22.1%) |
| Health Care & Social Assistance | 65 (16.2%) | 336 (83.8%) |
| Arts, Entertainment & Recreation | 16 (25.8%) | 46 (74.2%) |
| Accommodation & Food Services | 138 (32.6%) | 286 (67.4%) |
| Public Administration | 78 (75.7%) | 25 (24.3%) |
| Total | 1,451 (56.3%) | 1,125 (43.7%) |
Education in Lely Resort
School Enrollment in Lely Resort
The most common levels of schooling among the 1,233 students in Lely Resort are elementary school (463 | 37.6%), high school (305 | 24.7%), and college / undergraduate (234 | 19.0%).
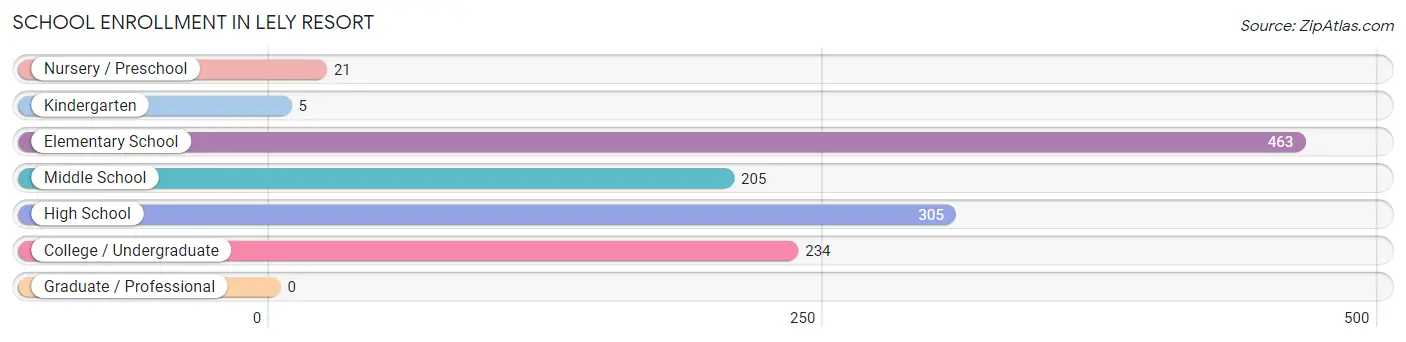
| School Level | # Students | % Students |
| Nursery / Preschool | 21 | 1.7% |
| Kindergarten | 5 | 0.4% |
| Elementary School | 463 | 37.6% |
| Middle School | 205 | 16.6% |
| High School | 305 | 24.7% |
| College / Undergraduate | 234 | 19.0% |
| Graduate / Professional | 0 | 0.0% |
| Total | 1,233 | 100.0% |
School Enrollment by Age by Funding Source in Lely Resort
Out of a total of 1,233 students who are enrolled in schools in Lely Resort, 134 (10.9%) attend a private institution, while the remaining 1,099 (89.1%) are enrolled in public schools. The age group of 20 to 24 year olds has the highest likelihood of being enrolled in private schools, with 37 (100.0% in the age bracket) enrolled. Conversely, the age group of 25 to 34 year olds has the lowest likelihood of being enrolled in a private school, with 197 (100.0% in the age bracket) attending a public institution.
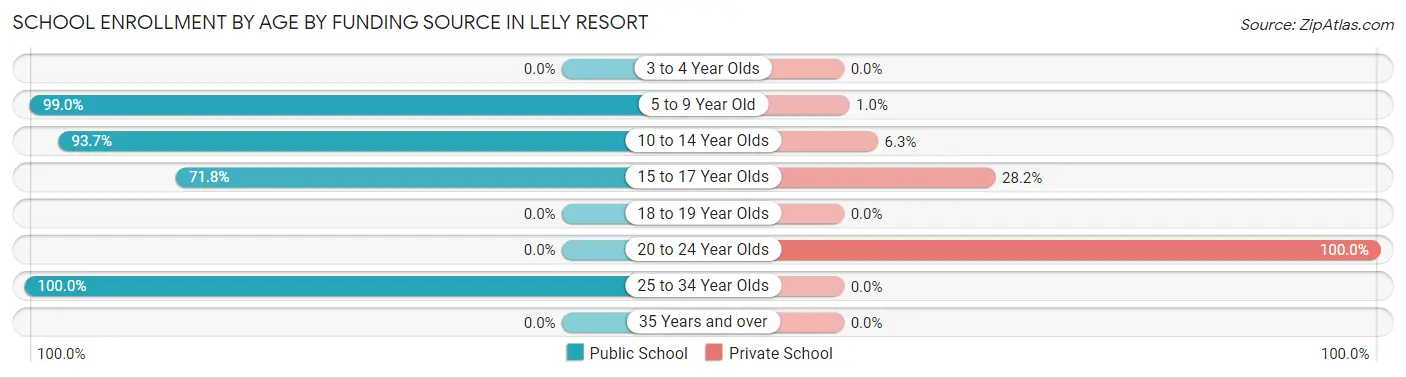
| Age Bracket | Public School | Private School |
| 3 to 4 Year Olds | 0 (0.0%) | 0 (0.0%) |
| 5 to 9 Year Old | 484 (99.0%) | 5 (1.0%) |
| 10 to 14 Year Olds | 222 (93.7%) | 15 (6.3%) |
| 15 to 17 Year Olds | 196 (71.8%) | 77 (28.2%) |
| 18 to 19 Year Olds | 0 (0.0%) | 0 (0.0%) |
| 20 to 24 Year Olds | 0 (0.0%) | 37 (100.0%) |
| 25 to 34 Year Olds | 197 (100.0%) | 0 (0.0%) |
| 35 Years and over | 0 (0.0%) | 0 (0.0%) |
| Total | 1,099 (89.1%) | 134 (10.9%) |
Educational Attainment by Field of Study in Lely Resort
Business (855 | 25.2%), education (583 | 17.2%), science & technology (578 | 17.1%), social sciences (226 | 6.7%), and literature & languages (210 | 6.2%) are the most common fields of study among 3,390 individuals in Lely Resort who have obtained a bachelor's degree or higher.
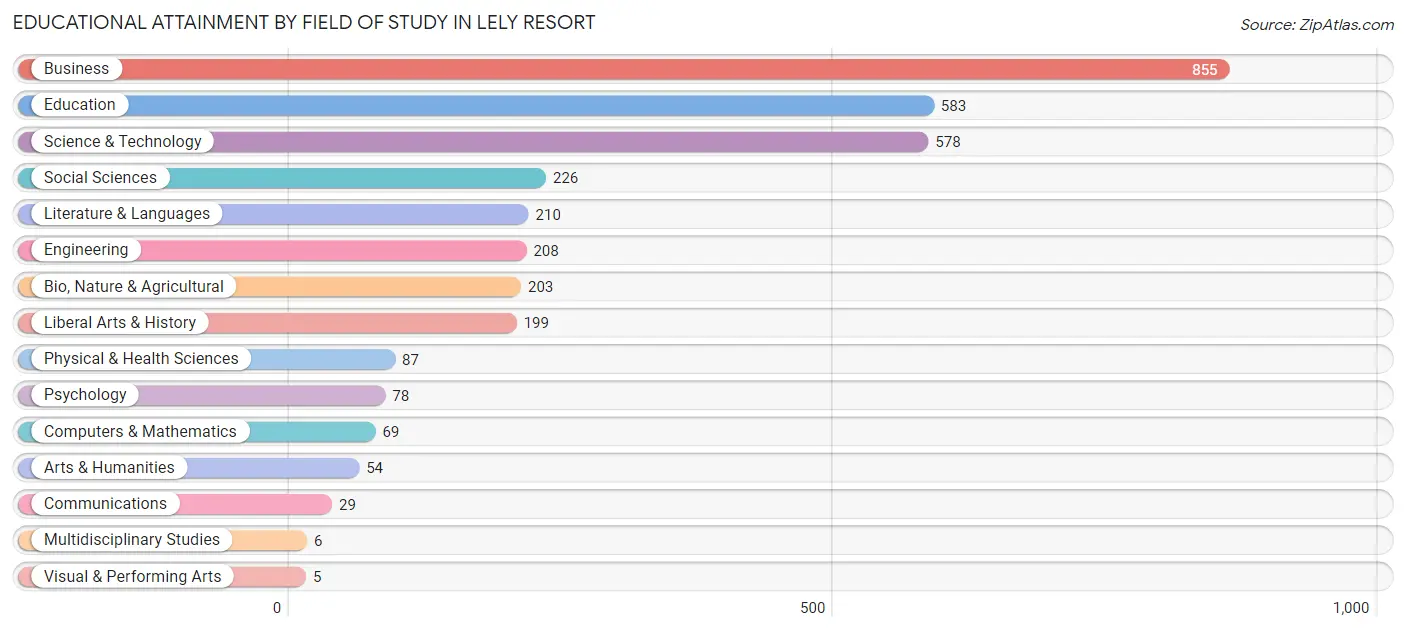
| Field of Study | # Graduates | % Graduates |
| Computers & Mathematics | 69 | 2.0% |
| Bio, Nature & Agricultural | 203 | 6.0% |
| Physical & Health Sciences | 87 | 2.6% |
| Psychology | 78 | 2.3% |
| Social Sciences | 226 | 6.7% |
| Engineering | 208 | 6.1% |
| Multidisciplinary Studies | 6 | 0.2% |
| Science & Technology | 578 | 17.1% |
| Business | 855 | 25.2% |
| Education | 583 | 17.2% |
| Literature & Languages | 210 | 6.2% |
| Liberal Arts & History | 199 | 5.9% |
| Visual & Performing Arts | 5 | 0.2% |
| Communications | 29 | 0.9% |
| Arts & Humanities | 54 | 1.6% |
| Total | 3,390 | 100.0% |
Transportation & Commute in Lely Resort
Vehicle Availability by Sex in Lely Resort
The most prevalent vehicle ownership categories in Lely Resort are males with 2 vehicles (903, accounting for 62.2%) and females with 2 vehicles (762, making up 80.3%).
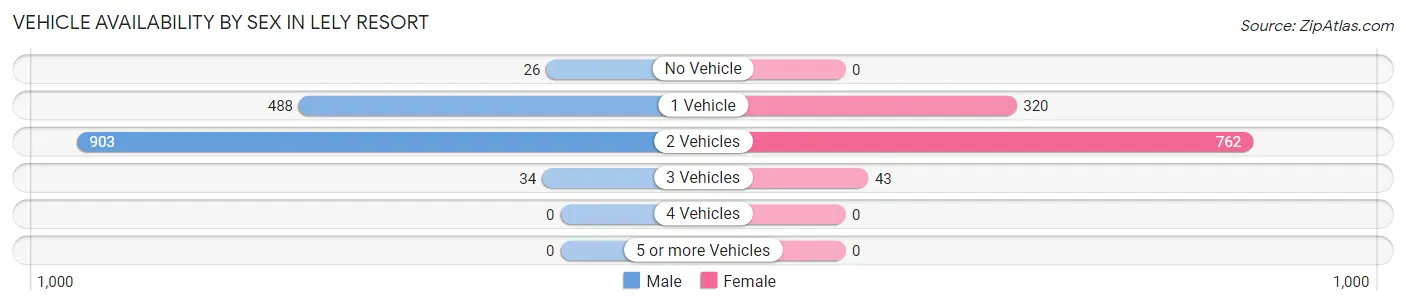
| Vehicles Available | Male | Female |
| No Vehicle | 26 (1.8%) | 0 (0.0%) |
| 1 Vehicle | 488 (33.6%) | 320 (28.4%) |
| 2 Vehicles | 903 (62.2%) | 762 (67.7%) |
| 3 Vehicles | 34 (2.3%) | 43 (3.8%) |
| 4 Vehicles | 0 (0.0%) | 0 (0.0%) |
| 5 or more Vehicles | 0 (0.0%) | 0 (0.0%) |
| Total | 1,451 (100.0%) | 1,125 (100.0%) |
Commute Time in Lely Resort
The most frequently occuring commute durations in Lely Resort are 20 to 24 minutes (727 commuters, 32.7%), 15 to 19 minutes (375 commuters, 16.9%), and 35 to 39 minutes (271 commuters, 12.2%).
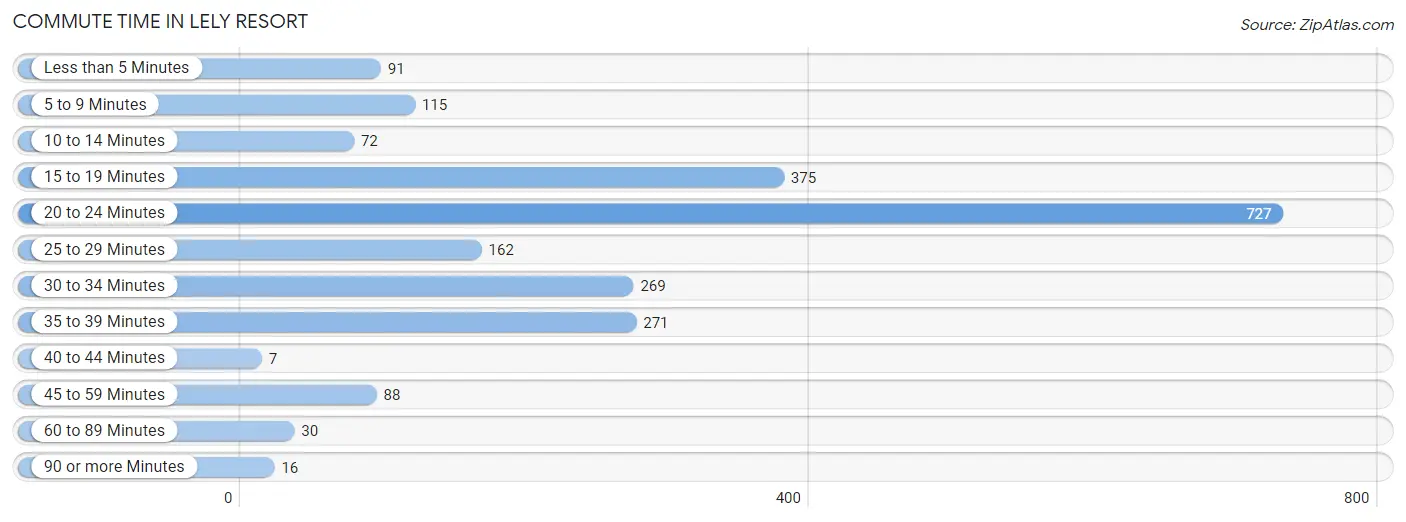
| Commute Time | # Commuters | % Commuters |
| Less than 5 Minutes | 91 | 4.1% |
| 5 to 9 Minutes | 115 | 5.2% |
| 10 to 14 Minutes | 72 | 3.2% |
| 15 to 19 Minutes | 375 | 16.9% |
| 20 to 24 Minutes | 727 | 32.7% |
| 25 to 29 Minutes | 162 | 7.3% |
| 30 to 34 Minutes | 269 | 12.1% |
| 35 to 39 Minutes | 271 | 12.2% |
| 40 to 44 Minutes | 7 | 0.3% |
| 45 to 59 Minutes | 88 | 4.0% |
| 60 to 89 Minutes | 30 | 1.3% |
| 90 or more Minutes | 16 | 0.7% |
Commute Time by Sex in Lely Resort
The most common commute times in Lely Resort are 20 to 24 minutes (585 commuters, 46.3%) for males and 15 to 19 minutes (332 commuters, 34.6%) for females.
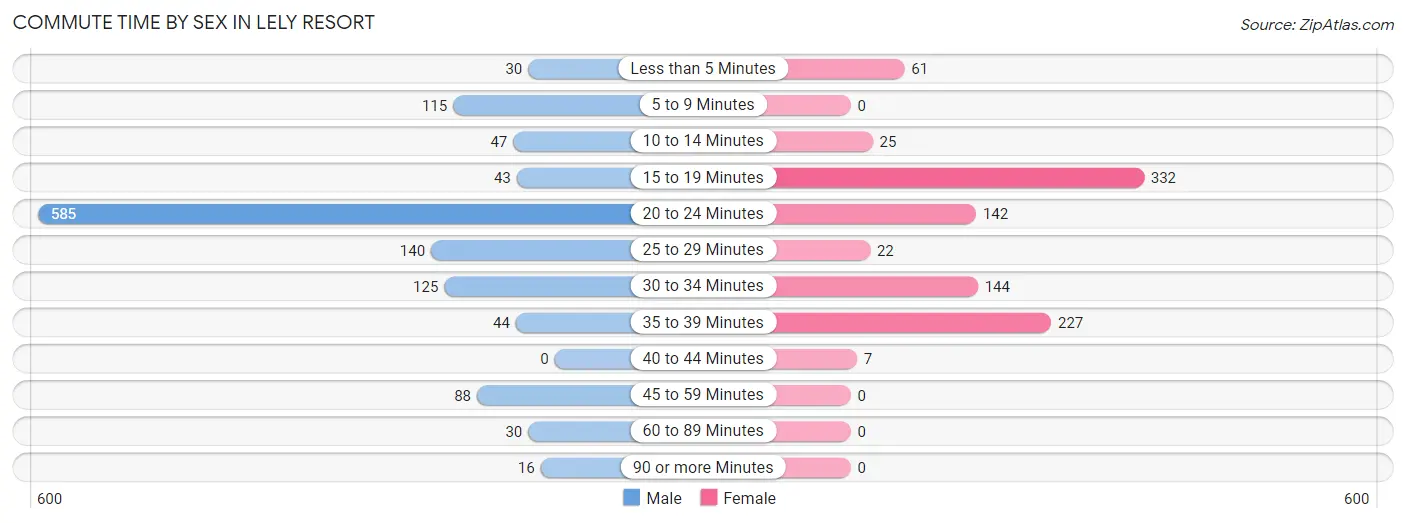
| Commute Time | Male | Female |
| Less than 5 Minutes | 30 (2.4%) | 61 (6.4%) |
| 5 to 9 Minutes | 115 (9.1%) | 0 (0.0%) |
| 10 to 14 Minutes | 47 (3.7%) | 25 (2.6%) |
| 15 to 19 Minutes | 43 (3.4%) | 332 (34.6%) |
| 20 to 24 Minutes | 585 (46.3%) | 142 (14.8%) |
| 25 to 29 Minutes | 140 (11.1%) | 22 (2.3%) |
| 30 to 34 Minutes | 125 (9.9%) | 144 (15.0%) |
| 35 to 39 Minutes | 44 (3.5%) | 227 (23.6%) |
| 40 to 44 Minutes | 0 (0.0%) | 7 (0.7%) |
| 45 to 59 Minutes | 88 (7.0%) | 0 (0.0%) |
| 60 to 89 Minutes | 30 (2.4%) | 0 (0.0%) |
| 90 or more Minutes | 16 (1.3%) | 0 (0.0%) |
Time of Departure to Work by Sex in Lely Resort
The most frequent times of departure to work in Lely Resort are 7:00 AM to 7:29 AM (518, 41.0%) for males and 10:00 AM to 10:59 AM (219, 22.8%) for females.
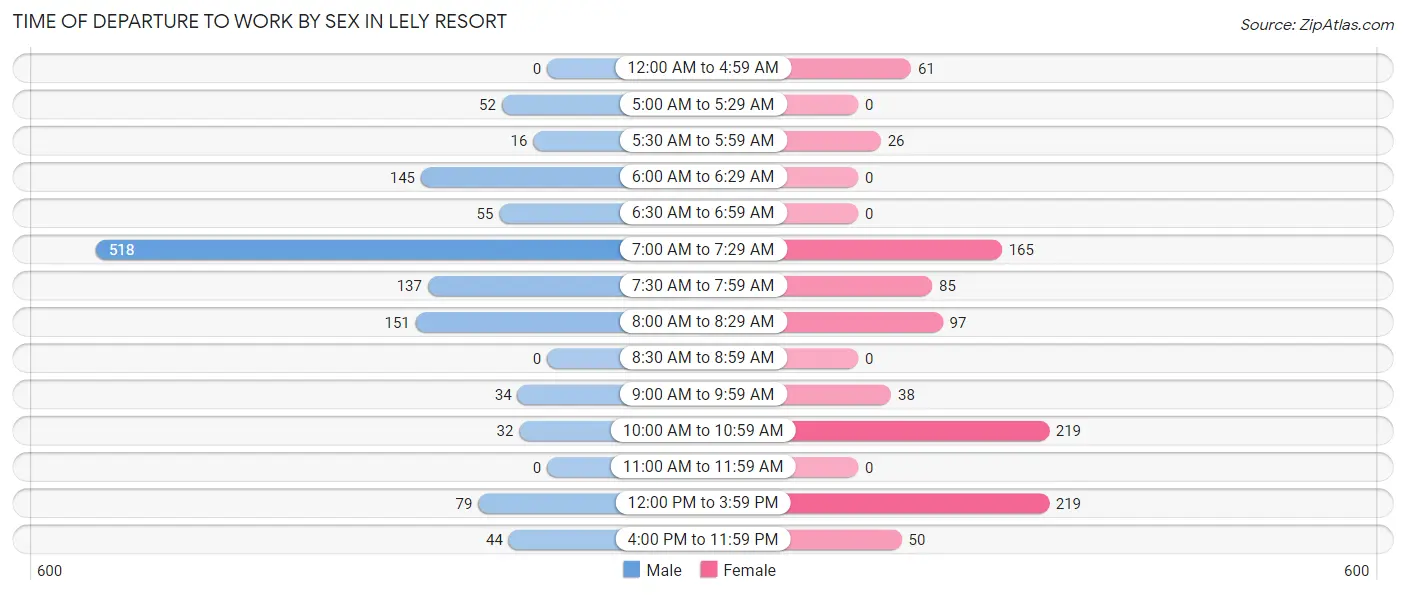
| Time of Departure | Male | Female |
| 12:00 AM to 4:59 AM | 0 (0.0%) | 61 (6.4%) |
| 5:00 AM to 5:29 AM | 52 (4.1%) | 0 (0.0%) |
| 5:30 AM to 5:59 AM | 16 (1.3%) | 26 (2.7%) |
| 6:00 AM to 6:29 AM | 145 (11.5%) | 0 (0.0%) |
| 6:30 AM to 6:59 AM | 55 (4.3%) | 0 (0.0%) |
| 7:00 AM to 7:29 AM | 518 (41.0%) | 165 (17.2%) |
| 7:30 AM to 7:59 AM | 137 (10.8%) | 85 (8.8%) |
| 8:00 AM to 8:29 AM | 151 (12.0%) | 97 (10.1%) |
| 8:30 AM to 8:59 AM | 0 (0.0%) | 0 (0.0%) |
| 9:00 AM to 9:59 AM | 34 (2.7%) | 38 (4.0%) |
| 10:00 AM to 10:59 AM | 32 (2.5%) | 219 (22.8%) |
| 11:00 AM to 11:59 AM | 0 (0.0%) | 0 (0.0%) |
| 12:00 PM to 3:59 PM | 79 (6.2%) | 219 (22.8%) |
| 4:00 PM to 11:59 PM | 44 (3.5%) | 50 (5.2%) |
| Total | 1,263 (100.0%) | 960 (100.0%) |
Housing Occupancy in Lely Resort
Occupancy by Ownership in Lely Resort
Of the total 3,604 dwellings in Lely Resort, owner-occupied units account for 2,043 (56.7%), while renter-occupied units make up 1,561 (43.3%).
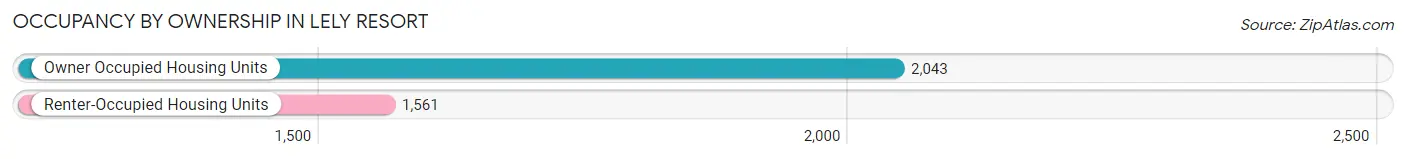
| Occupancy | # Housing Units | % Housing Units |
| Owner Occupied Housing Units | 2,043 | 56.7% |
| Renter-Occupied Housing Units | 1,561 | 43.3% |
| Total Occupied Housing Units | 3,604 | 100.0% |
Occupancy by Household Size in Lely Resort
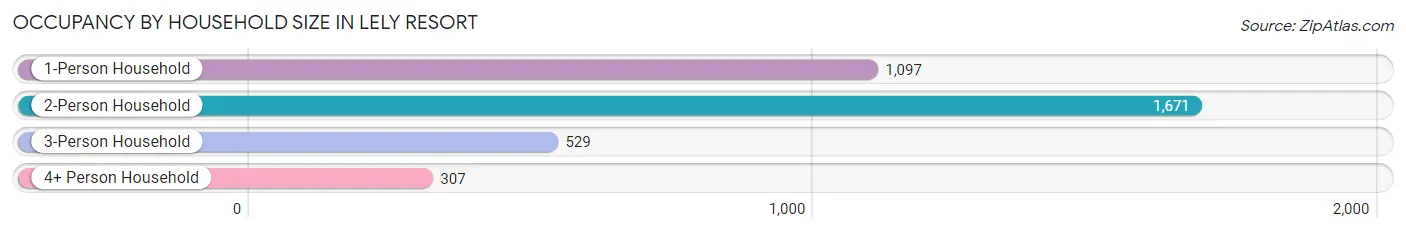
| Household Size | # Housing Units | % Housing Units |
| 1-Person Household | 1,097 | 30.4% |
| 2-Person Household | 1,671 | 46.4% |
| 3-Person Household | 529 | 14.7% |
| 4+ Person Household | 307 | 8.5% |
| Total Housing Units | 3,604 | 100.0% |
Occupancy by Ownership by Household Size in Lely Resort
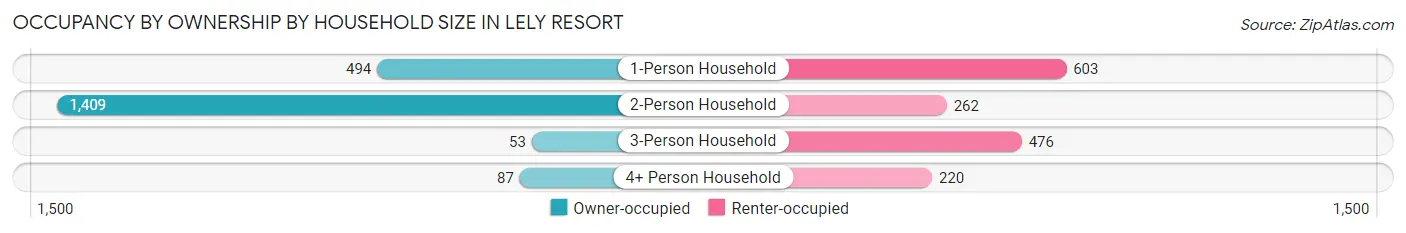
| Household Size | Owner-occupied | Renter-occupied |
| 1-Person Household | 494 (45.0%) | 603 (55.0%) |
| 2-Person Household | 1,409 (84.3%) | 262 (15.7%) |
| 3-Person Household | 53 (10.0%) | 476 (90.0%) |
| 4+ Person Household | 87 (28.3%) | 220 (71.7%) |
| Total Housing Units | 2,043 (56.7%) | 1,561 (43.3%) |
Occupancy by Educational Attainment in Lely Resort
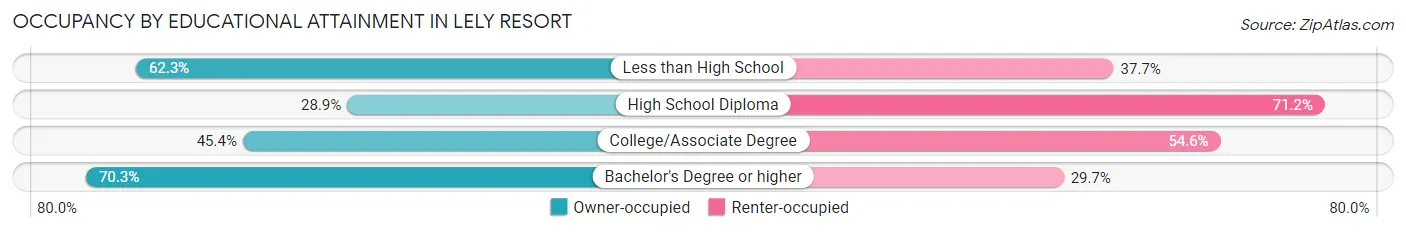
| Household Size | Owner-occupied | Renter-occupied |
| Less than High School | 139 (62.3%) | 84 (37.7%) |
| High School Diploma | 176 (28.8%) | 434 (71.2%) |
| College/Associate Degree | 400 (45.4%) | 481 (54.6%) |
| Bachelor's Degree or higher | 1,328 (70.3%) | 562 (29.7%) |
Occupancy by Age of Householder in Lely Resort
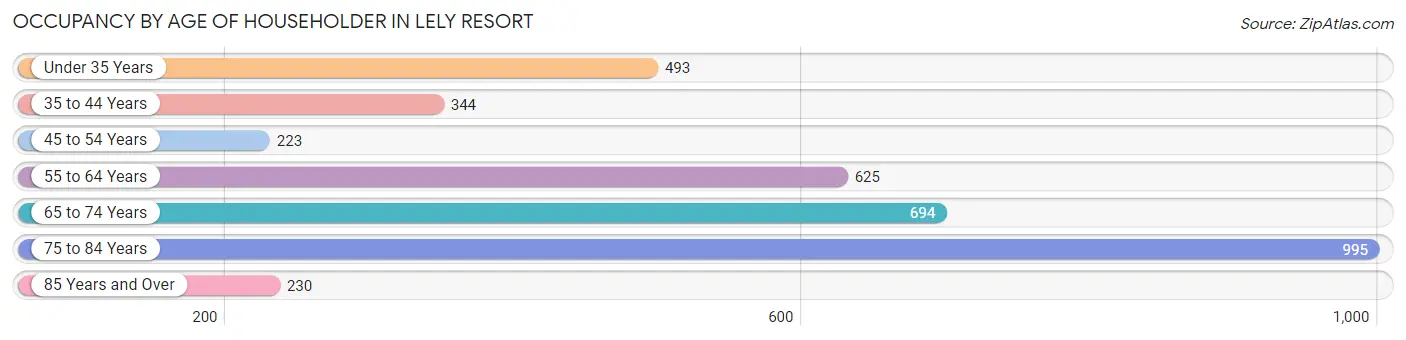
| Age Bracket | # Households | % Households |
| Under 35 Years | 493 | 13.7% |
| 35 to 44 Years | 344 | 9.5% |
| 45 to 54 Years | 223 | 6.2% |
| 55 to 64 Years | 625 | 17.3% |
| 65 to 74 Years | 694 | 19.3% |
| 75 to 84 Years | 995 | 27.6% |
| 85 Years and Over | 230 | 6.4% |
| Total | 3,604 | 100.0% |
Housing Finances in Lely Resort
Median Income by Occupancy in Lely Resort
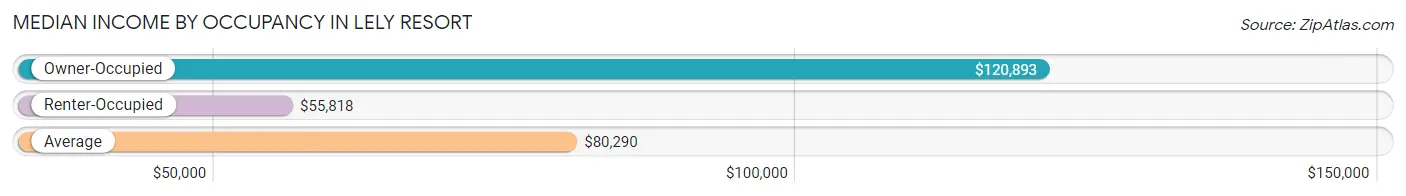
| Occupancy Type | # Households | Median Income |
| Owner-Occupied | 2,043 (56.7%) | $120,893 |
| Renter-Occupied | 1,561 (43.3%) | $55,818 |
| Average | 3,604 (100.0%) | $80,290 |
Occupancy by Householder Income Bracket in Lely Resort
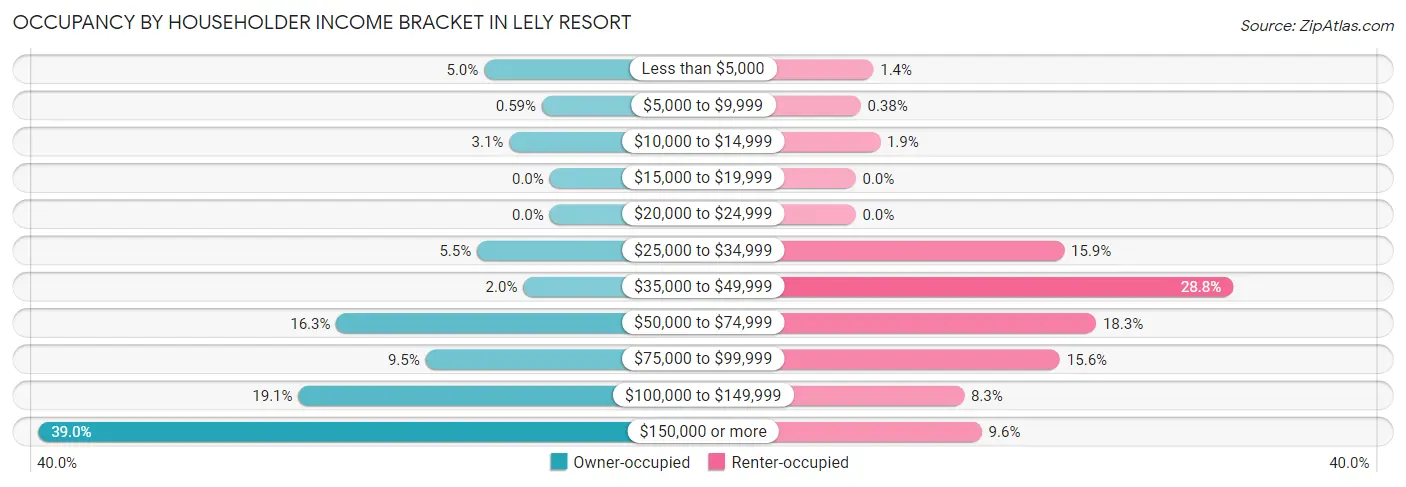
| Income Bracket | Owner-occupied | Renter-occupied |
| Less than $5,000 | 102 (5.0%) | 21 (1.3%) |
| $5,000 to $9,999 | 12 (0.6%) | 6 (0.4%) |
| $10,000 to $14,999 | 63 (3.1%) | 29 (1.9%) |
| $15,000 to $19,999 | 0 (0.0%) | 0 (0.0%) |
| $20,000 to $24,999 | 0 (0.0%) | 0 (0.0%) |
| $25,000 to $34,999 | 113 (5.5%) | 248 (15.9%) |
| $35,000 to $49,999 | 41 (2.0%) | 449 (28.8%) |
| $50,000 to $74,999 | 332 (16.3%) | 286 (18.3%) |
| $75,000 to $99,999 | 193 (9.5%) | 243 (15.6%) |
| $100,000 to $149,999 | 391 (19.1%) | 129 (8.3%) |
| $150,000 or more | 796 (39.0%) | 150 (9.6%) |
| Total | 2,043 (100.0%) | 1,561 (100.0%) |
Monthly Housing Cost Tiers in Lely Resort
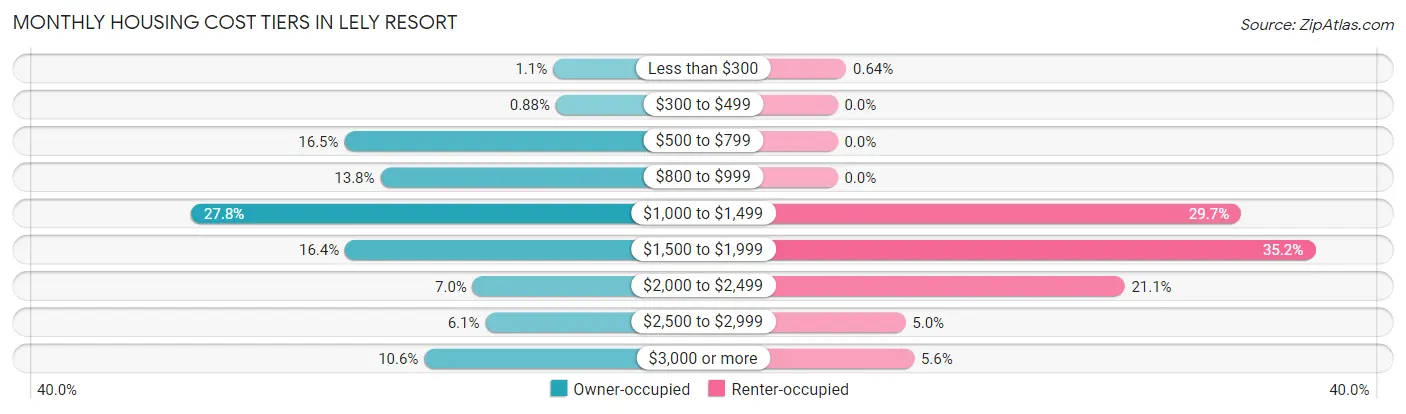
| Monthly Cost | Owner-occupied | Renter-occupied |
| Less than $300 | 22 (1.1%) | 10 (0.6%) |
| $300 to $499 | 18 (0.9%) | 0 (0.0%) |
| $500 to $799 | 336 (16.5%) | 0 (0.0%) |
| $800 to $999 | 282 (13.8%) | 0 (0.0%) |
| $1,000 to $1,499 | 567 (27.8%) | 464 (29.7%) |
| $1,500 to $1,999 | 335 (16.4%) | 549 (35.2%) |
| $2,000 to $2,499 | 143 (7.0%) | 330 (21.1%) |
| $2,500 to $2,999 | 124 (6.1%) | 78 (5.0%) |
| $3,000 or more | 216 (10.6%) | 88 (5.6%) |
| Total | 2,043 (100.0%) | 1,561 (100.0%) |
Physical Housing Characteristics in Lely Resort
Housing Structures in Lely Resort
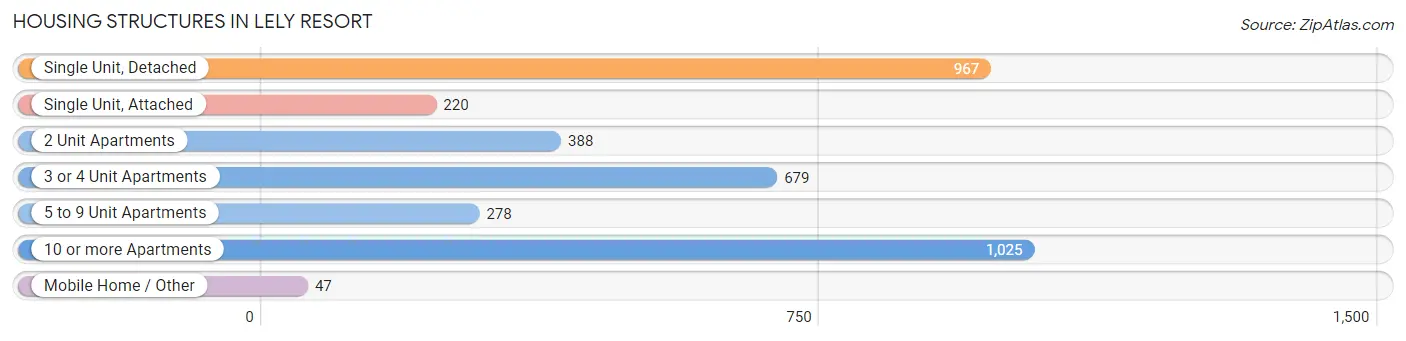
| Structure Type | # Housing Units | % Housing Units |
| Single Unit, Detached | 967 | 26.8% |
| Single Unit, Attached | 220 | 6.1% |
| 2 Unit Apartments | 388 | 10.8% |
| 3 or 4 Unit Apartments | 679 | 18.8% |
| 5 to 9 Unit Apartments | 278 | 7.7% |
| 10 or more Apartments | 1,025 | 28.4% |
| Mobile Home / Other | 47 | 1.3% |
| Total | 3,604 | 100.0% |
Housing Structures by Occupancy in Lely Resort
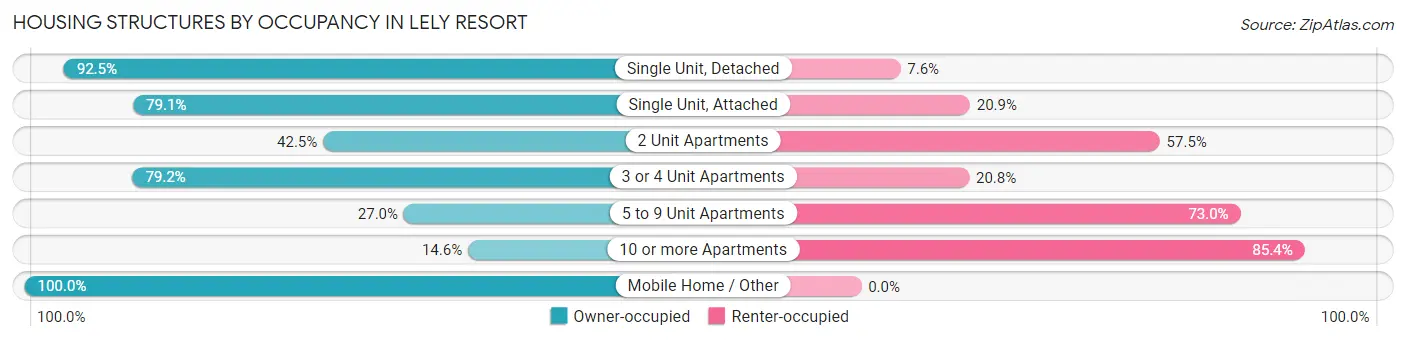
| Structure Type | Owner-occupied | Renter-occupied |
| Single Unit, Detached | 894 (92.4%) | 73 (7.5%) |
| Single Unit, Attached | 174 (79.1%) | 46 (20.9%) |
| 2 Unit Apartments | 165 (42.5%) | 223 (57.5%) |
| 3 or 4 Unit Apartments | 538 (79.2%) | 141 (20.8%) |
| 5 to 9 Unit Apartments | 75 (27.0%) | 203 (73.0%) |
| 10 or more Apartments | 150 (14.6%) | 875 (85.4%) |
| Mobile Home / Other | 47 (100.0%) | 0 (0.0%) |
| Total | 2,043 (56.7%) | 1,561 (43.3%) |
Housing Structures by Number of Rooms in Lely Resort
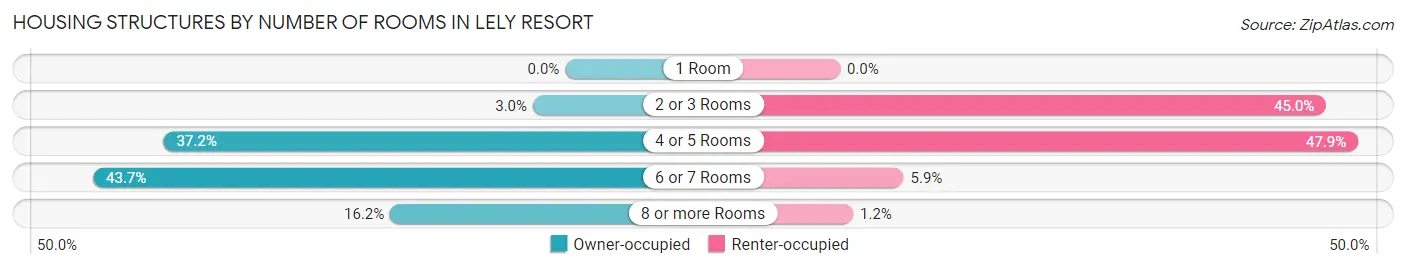
| Number of Rooms | Owner-occupied | Renter-occupied |
| 1 Room | 0 (0.0%) | 0 (0.0%) |
| 2 or 3 Rooms | 61 (3.0%) | 702 (45.0%) |
| 4 or 5 Rooms | 759 (37.1%) | 748 (47.9%) |
| 6 or 7 Rooms | 892 (43.7%) | 92 (5.9%) |
| 8 or more Rooms | 331 (16.2%) | 19 (1.2%) |
| Total | 2,043 (100.0%) | 1,561 (100.0%) |
Housing Structure by Heating Type in Lely Resort
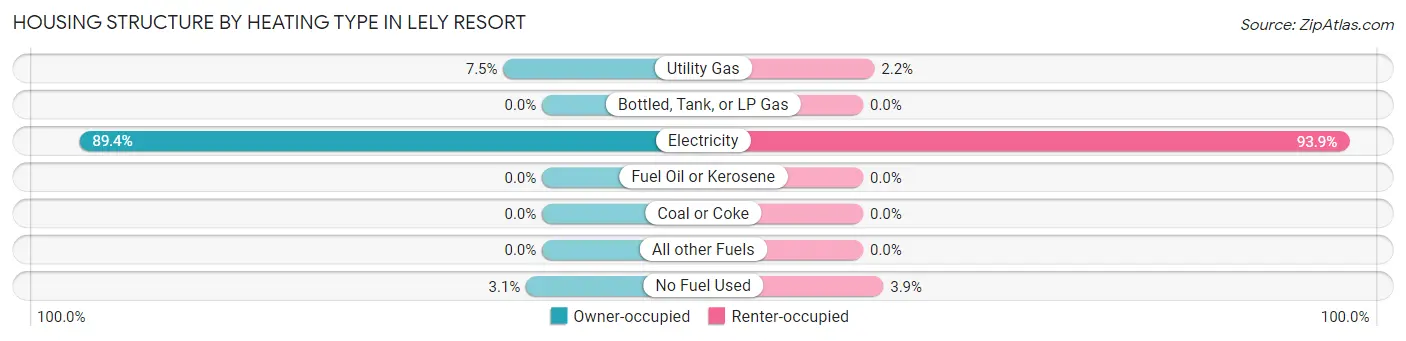
| Heating Type | Owner-occupied | Renter-occupied |
| Utility Gas | 153 (7.5%) | 34 (2.2%) |
| Bottled, Tank, or LP Gas | 0 (0.0%) | 0 (0.0%) |
| Electricity | 1,827 (89.4%) | 1,466 (93.9%) |
| Fuel Oil or Kerosene | 0 (0.0%) | 0 (0.0%) |
| Coal or Coke | 0 (0.0%) | 0 (0.0%) |
| All other Fuels | 0 (0.0%) | 0 (0.0%) |
| No Fuel Used | 63 (3.1%) | 61 (3.9%) |
| Total | 2,043 (100.0%) | 1,561 (100.0%) |
Household Vehicle Usage in Lely Resort
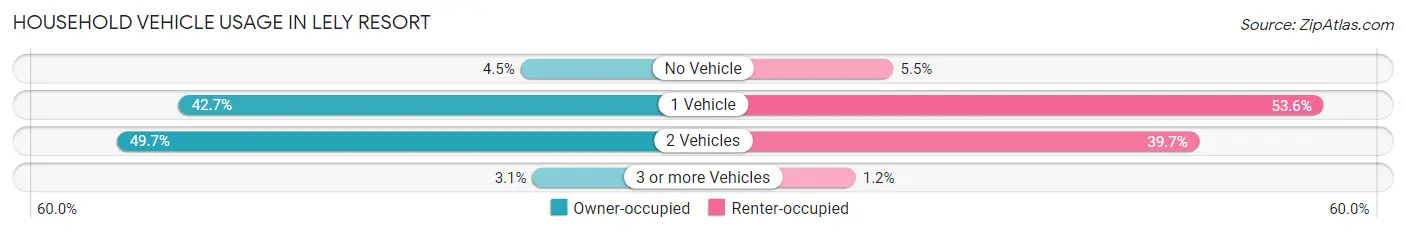
| Vehicles per Household | Owner-occupied | Renter-occupied |
| No Vehicle | 91 (4.4%) | 85 (5.4%) |
| 1 Vehicle | 873 (42.7%) | 837 (53.6%) |
| 2 Vehicles | 1,015 (49.7%) | 620 (39.7%) |
| 3 or more Vehicles | 64 (3.1%) | 19 (1.2%) |
| Total | 2,043 (100.0%) | 1,561 (100.0%) |
Real Estate & Mortgages in Lely Resort
Real Estate and Mortgage Overview in Lely Resort
| Characteristic | Without Mortgage | With Mortgage |
| Housing Units | 1,399 | 644 |
| Median Property Value | $549,400 | $581,800 |
| Median Household Income | $118,250 | $285 |
| Monthly Housing Costs | $1,037 | $216 |
| Real Estate Taxes | $4,375 | $0 |
Property Value by Mortgage Status in Lely Resort
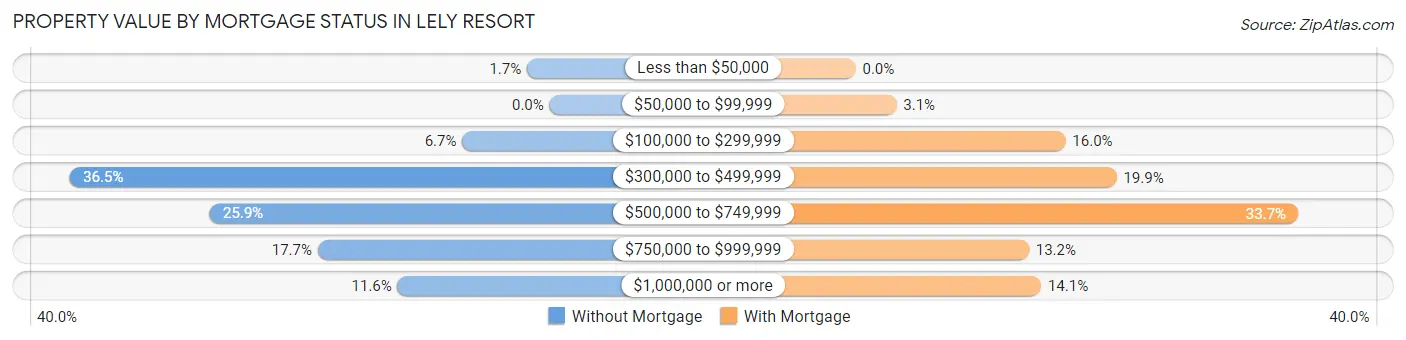
| Property Value | Without Mortgage | With Mortgage |
| Less than $50,000 | 24 (1.7%) | 0 (0.0%) |
| $50,000 to $99,999 | 0 (0.0%) | 20 (3.1%) |
| $100,000 to $299,999 | 93 (6.7%) | 103 (16.0%) |
| $300,000 to $499,999 | 511 (36.5%) | 128 (19.9%) |
| $500,000 to $749,999 | 362 (25.9%) | 217 (33.7%) |
| $750,000 to $999,999 | 247 (17.7%) | 85 (13.2%) |
| $1,000,000 or more | 162 (11.6%) | 91 (14.1%) |
| Total | 1,399 (100.0%) | 644 (100.0%) |
Household Income by Mortgage Status in Lely Resort
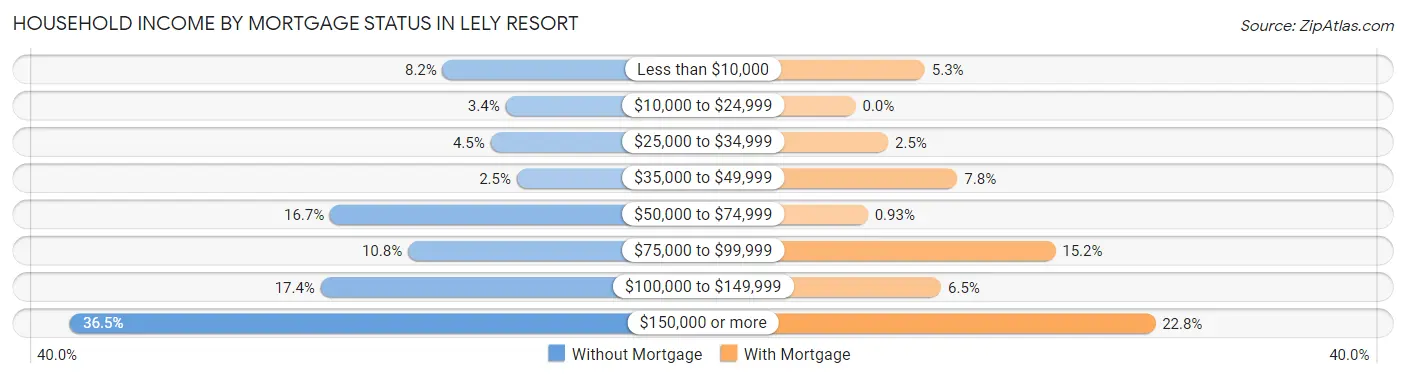
| Household Income | Without Mortgage | With Mortgage |
| Less than $10,000 | 114 (8.2%) | 34 (5.3%) |
| $10,000 to $24,999 | 47 (3.4%) | 0 (0.0%) |
| $25,000 to $34,999 | 63 (4.5%) | 16 (2.5%) |
| $35,000 to $49,999 | 35 (2.5%) | 50 (7.8%) |
| $50,000 to $74,999 | 234 (16.7%) | 6 (0.9%) |
| $75,000 to $99,999 | 151 (10.8%) | 98 (15.2%) |
| $100,000 to $149,999 | 244 (17.4%) | 42 (6.5%) |
| $150,000 or more | 511 (36.5%) | 147 (22.8%) |
| Total | 1,399 (100.0%) | 644 (100.0%) |
Property Value to Household Income Ratio in Lely Resort
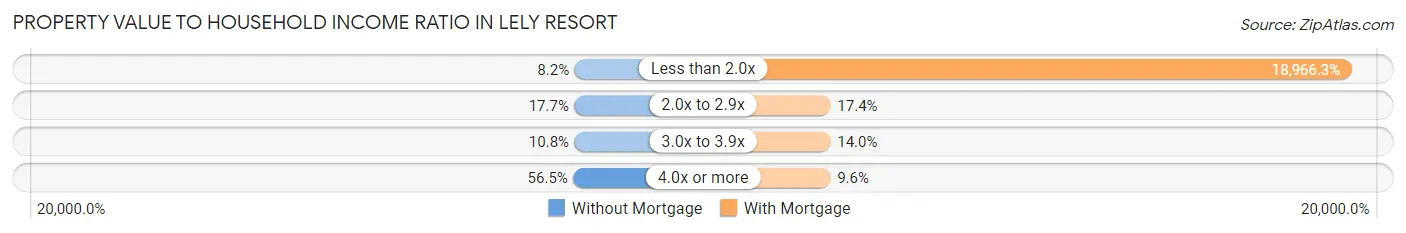
| Value-to-Income Ratio | Without Mortgage | With Mortgage |
| Less than 2.0x | 114 (8.2%) | 122,143 (18,966.3%) |
| 2.0x to 2.9x | 248 (17.7%) | 112 (17.4%) |
| 3.0x to 3.9x | 151 (10.8%) | 90 (14.0%) |
| 4.0x or more | 791 (56.5%) | 62 (9.6%) |
| Total | 1,399 (100.0%) | 644 (100.0%) |
Real Estate Taxes by Mortgage Status in Lely Resort
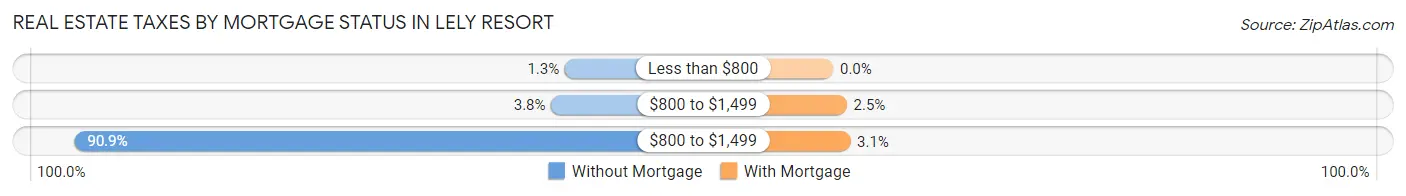
| Property Taxes | Without Mortgage | With Mortgage |
| Less than $800 | 18 (1.3%) | 0 (0.0%) |
| $800 to $1,499 | 53 (3.8%) | 16 (2.5%) |
| $800 to $1,499 | 1,272 (90.9%) | 20 (3.1%) |
| Total | 1,399 (100.0%) | 644 (100.0%) |
Health & Disability in Lely Resort
Health Insurance Coverage by Age in Lely Resort
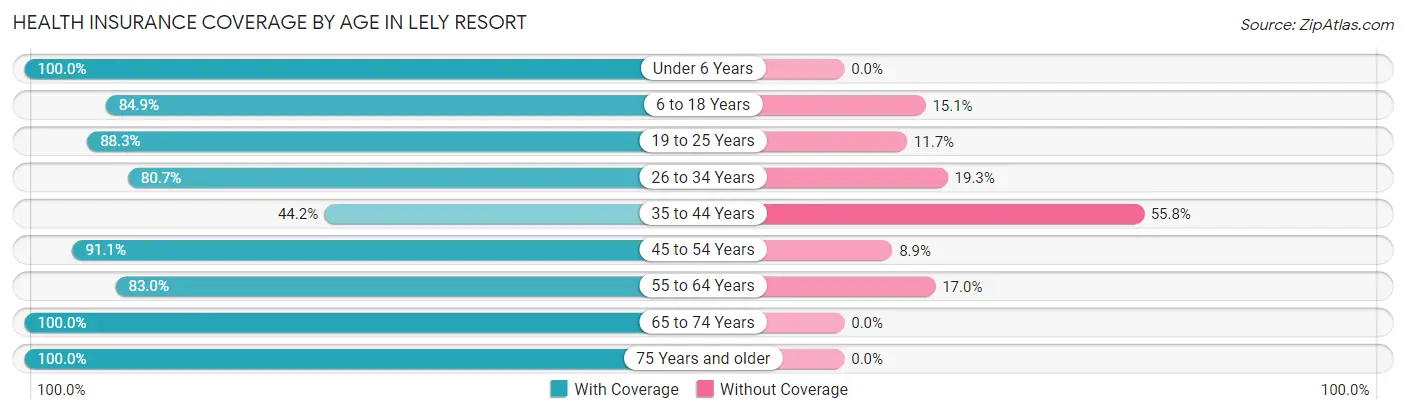
| Age Bracket | With Coverage | Without Coverage |
| Under 6 Years | 245 (100.0%) | 0 (0.0%) |
| 6 to 18 Years | 830 (84.9%) | 148 (15.1%) |
| 19 to 25 Years | 174 (88.3%) | 23 (11.7%) |
| 26 to 34 Years | 507 (80.7%) | 121 (19.3%) |
| 35 to 44 Years | 307 (44.2%) | 388 (55.8%) |
| 45 to 54 Years | 438 (91.1%) | 43 (8.9%) |
| 55 to 64 Years | 960 (83.0%) | 196 (17.0%) |
| 65 to 74 Years | 1,276 (100.0%) | 0 (0.0%) |
| 75 Years and older | 1,838 (100.0%) | 0 (0.0%) |
| Total | 6,575 (87.7%) | 919 (12.3%) |
Health Insurance Coverage by Citizenship Status in Lely Resort
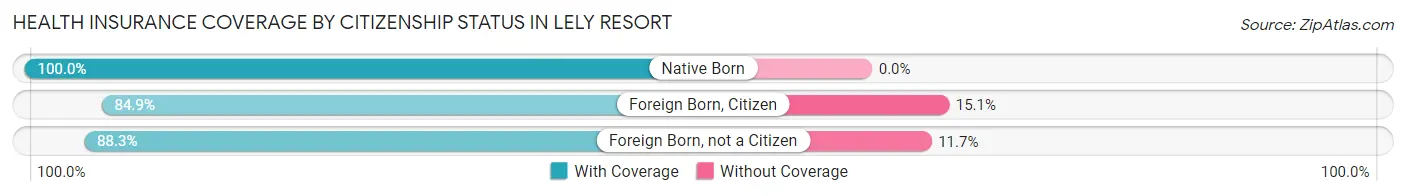
| Citizenship Status | With Coverage | Without Coverage |
| Native Born | 245 (100.0%) | 0 (0.0%) |
| Foreign Born, Citizen | 830 (84.9%) | 148 (15.1%) |
| Foreign Born, not a Citizen | 174 (88.3%) | 23 (11.7%) |
Health Insurance Coverage by Household Income in Lely Resort
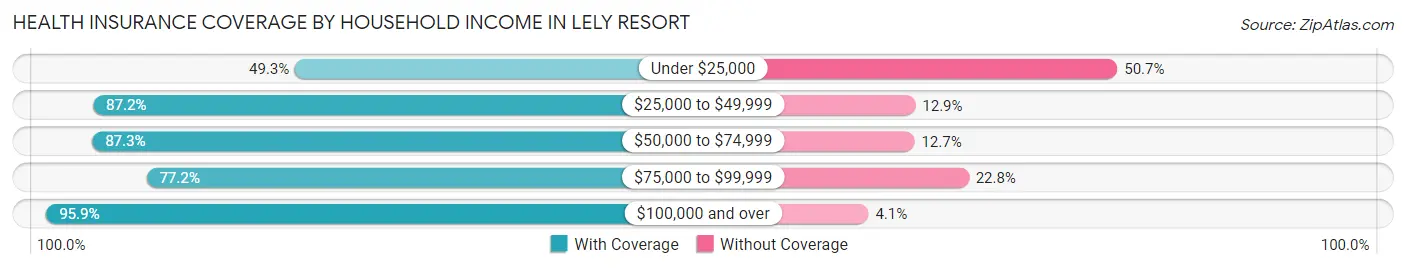
| Household Income | With Coverage | Without Coverage |
| Under $25,000 | 181 (49.3%) | 186 (50.7%) |
| $25,000 to $49,999 | 1,600 (87.2%) | 236 (12.9%) |
| $50,000 to $74,999 | 1,081 (87.3%) | 157 (12.7%) |
| $75,000 to $99,999 | 723 (77.2%) | 214 (22.8%) |
| $100,000 and over | 2,978 (95.9%) | 126 (4.1%) |
Public vs Private Health Insurance Coverage by Age in Lely Resort
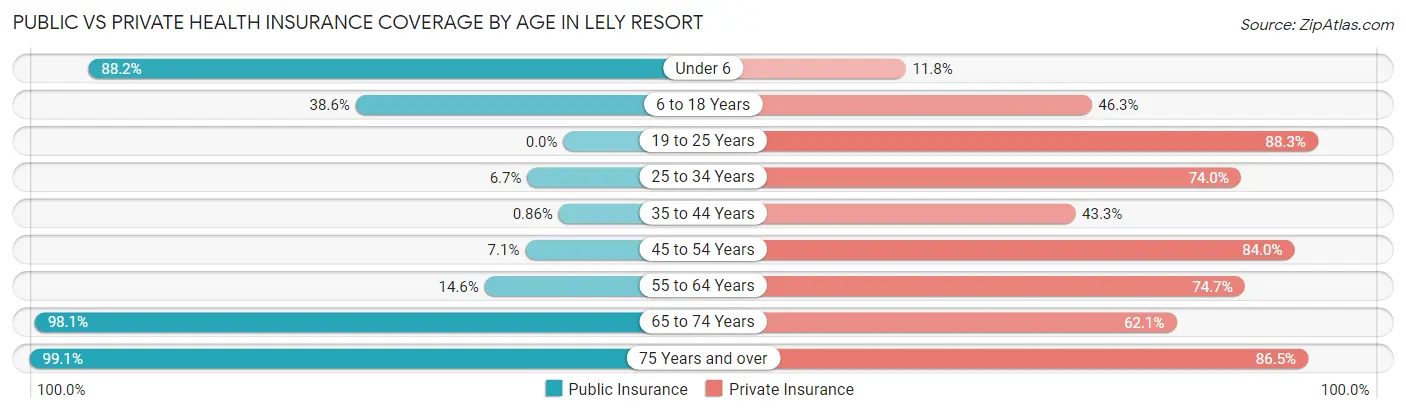
| Age Bracket | Public Insurance | Private Insurance |
| Under 6 | 216 (88.2%) | 29 (11.8%) |
| 6 to 18 Years | 377 (38.6%) | 453 (46.3%) |
| 19 to 25 Years | 0 (0.0%) | 174 (88.3%) |
| 25 to 34 Years | 42 (6.7%) | 465 (74.0%) |
| 35 to 44 Years | 6 (0.9%) | 301 (43.3%) |
| 45 to 54 Years | 34 (7.1%) | 404 (84.0%) |
| 55 to 64 Years | 169 (14.6%) | 864 (74.7%) |
| 65 to 74 Years | 1,252 (98.1%) | 792 (62.1%) |
| 75 Years and over | 1,821 (99.1%) | 1,590 (86.5%) |
| Total | 3,917 (52.3%) | 5,072 (67.7%) |
Disability Status by Sex by Age in Lely Resort
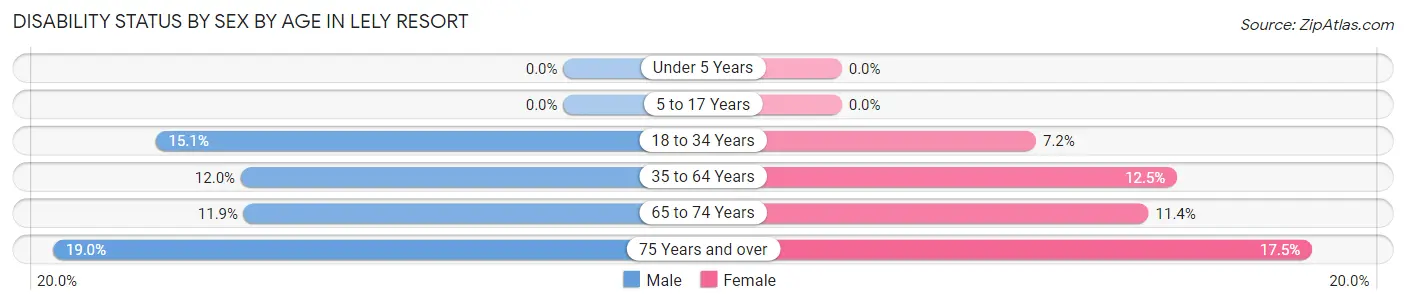
| Age Bracket | Male | Female |
| Under 5 Years | 0 (0.0%) | 0 (0.0%) |
| 5 to 17 Years | 0 (0.0%) | 0 (0.0%) |
| 18 to 34 Years | 43 (15.1%) | 39 (7.2%) |
| 35 to 64 Years | 158 (12.0%) | 126 (12.4%) |
| 65 to 74 Years | 67 (11.9%) | 81 (11.4%) |
| 75 Years and over | 141 (19.0%) | 191 (17.5%) |
Disability Class by Sex by Age in Lely Resort
Disability Class: Hearing Difficulty
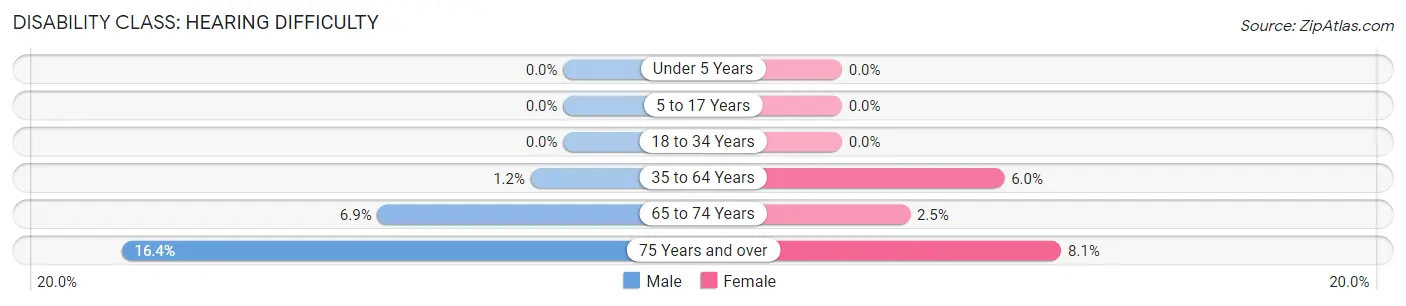
| Age Bracket | Male | Female |
| Under 5 Years | 0 (0.0%) | 0 (0.0%) |
| 5 to 17 Years | 0 (0.0%) | 0 (0.0%) |
| 18 to 34 Years | 0 (0.0%) | 0 (0.0%) |
| 35 to 64 Years | 16 (1.2%) | 61 (6.0%) |
| 65 to 74 Years | 39 (6.9%) | 18 (2.5%) |
| 75 Years and over | 122 (16.4%) | 89 (8.1%) |
Disability Class: Vision Difficulty
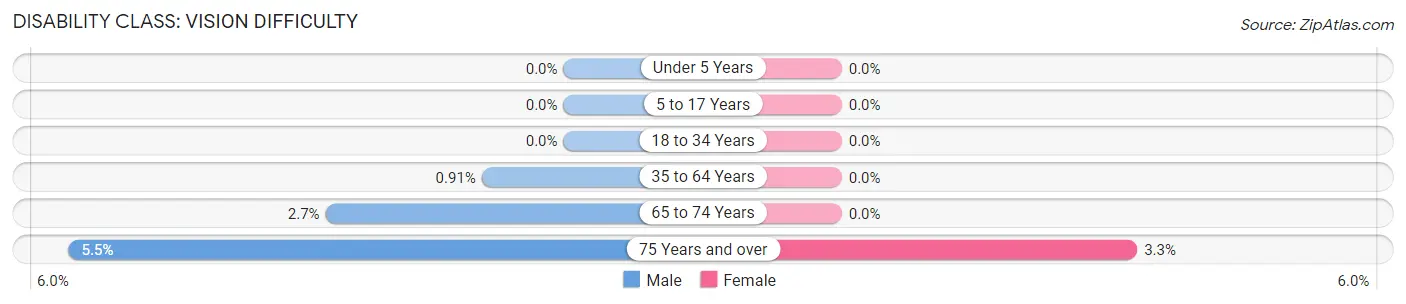
| Age Bracket | Male | Female |
| Under 5 Years | 0 (0.0%) | 0 (0.0%) |
| 5 to 17 Years | 0 (0.0%) | 0 (0.0%) |
| 18 to 34 Years | 0 (0.0%) | 0 (0.0%) |
| 35 to 64 Years | 12 (0.9%) | 0 (0.0%) |
| 65 to 74 Years | 15 (2.6%) | 0 (0.0%) |
| 75 Years and over | 41 (5.5%) | 36 (3.3%) |
Disability Class: Cognitive Difficulty
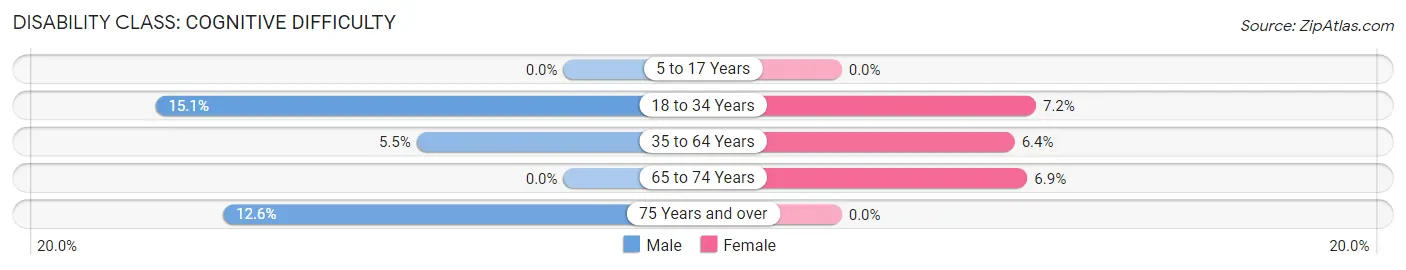
| Age Bracket | Male | Female |
| 5 to 17 Years | 0 (0.0%) | 0 (0.0%) |
| 18 to 34 Years | 43 (15.1%) | 39 (7.2%) |
| 35 to 64 Years | 72 (5.4%) | 65 (6.4%) |
| 65 to 74 Years | 0 (0.0%) | 49 (6.9%) |
| 75 Years and over | 94 (12.6%) | 0 (0.0%) |
Disability Class: Ambulatory Difficulty
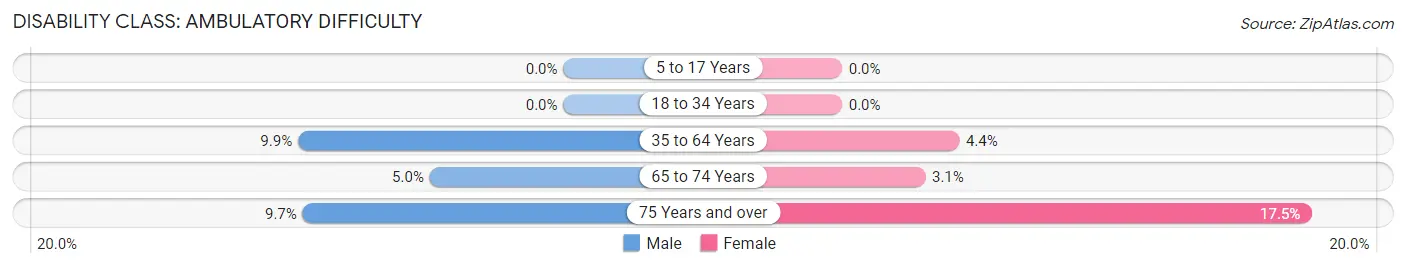
| Age Bracket | Male | Female |
| 5 to 17 Years | 0 (0.0%) | 0 (0.0%) |
| 18 to 34 Years | 0 (0.0%) | 0 (0.0%) |
| 35 to 64 Years | 130 (9.9%) | 44 (4.3%) |
| 65 to 74 Years | 28 (5.0%) | 22 (3.1%) |
| 75 Years and over | 72 (9.7%) | 191 (17.5%) |
Disability Class: Self-Care Difficulty
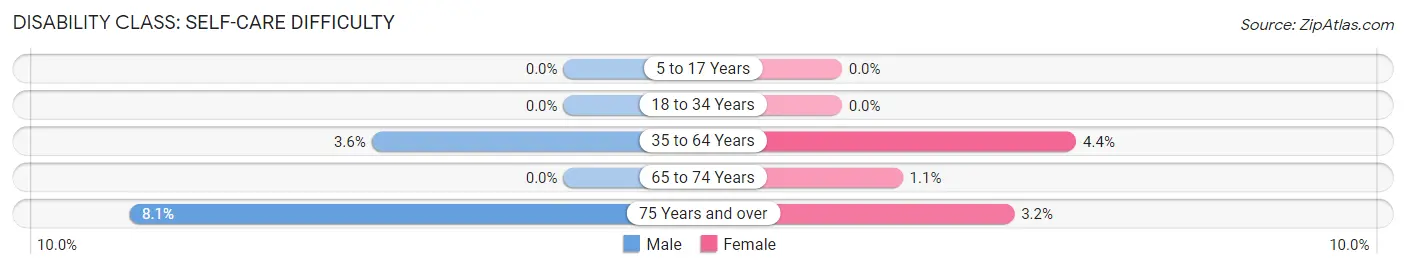
| Age Bracket | Male | Female |
| 5 to 17 Years | 0 (0.0%) | 0 (0.0%) |
| 18 to 34 Years | 0 (0.0%) | 0 (0.0%) |
| 35 to 64 Years | 47 (3.6%) | 44 (4.3%) |
| 65 to 74 Years | 0 (0.0%) | 8 (1.1%) |
| 75 Years and over | 60 (8.1%) | 35 (3.2%) |
Technology Access in Lely Resort
Computing Device Access in Lely Resort
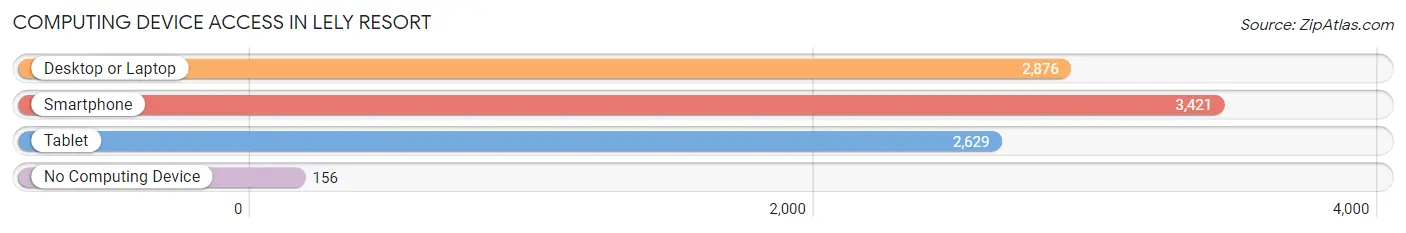
| Device Type | # Households | % Households |
| Desktop or Laptop | 2,876 | 79.8% |
| Smartphone | 3,421 | 94.9% |
| Tablet | 2,629 | 73.0% |
| No Computing Device | 156 | 4.3% |
| Total | 3,604 | 100.0% |
Internet Access in Lely Resort
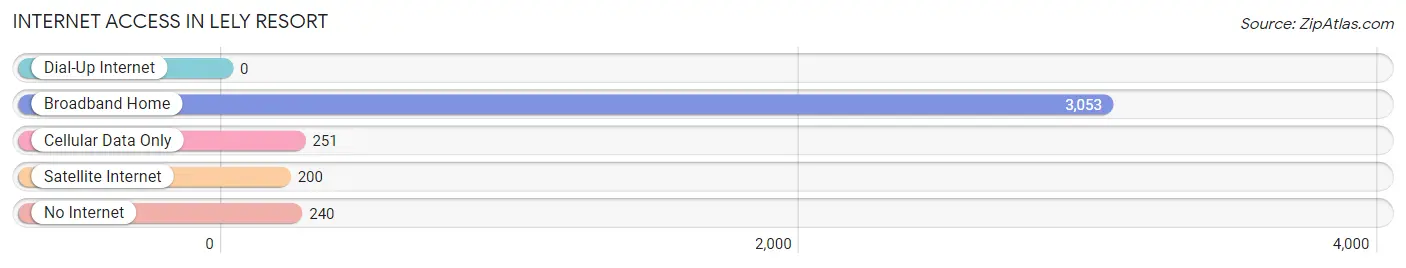
| Internet Type | # Households | % Households |
| Dial-Up Internet | 0 | 0.0% |
| Broadband Home | 3,053 | 84.7% |
| Cellular Data Only | 251 | 7.0% |
| Satellite Internet | 200 | 5.6% |
| No Internet | 240 | 6.7% |
| Total | 3,604 | 100.0% |
Lely Resort Summary
Lely Resort is a master-planned community located in Collier County, Florida, United States. It is situated in the heart of Naples, just south of the city of Naples and north of Marco Island. The community is named after the Dutch-born American golf course designer, Lee Lely, who designed the two championship golf courses in the community.
History
Lely Resort was developed in the late 1990s by Stock Development, a Naples-based real estate development company. The community was designed to be a luxurious, master-planned community with a variety of amenities and activities for residents. The community was designed to be a self-contained community with its own shopping, dining, and entertainment options.
The community was designed to be a golf-centric community, with two championship golf courses designed by Lee Lely. The two courses, the Flamingo Island Course and the Mustang Course, are both 18-hole courses and are considered to be some of the best courses in the area.
The community also features a variety of other amenities, including a clubhouse, tennis courts, swimming pools, and a fitness center. The community also features a variety of parks and trails, as well as a variety of other recreational activities.
Geography
Lely Resort is located in Collier County, Florida, in the heart of Naples. The community is situated just south of the city of Naples and north of Marco Island. The community is located on the west side of US 41, and is bordered by the Imperial River to the east.
The community is located in a tropical climate, with hot, humid summers and mild winters. The average temperature in the summer is around 90 degrees Fahrenheit, and the average temperature in the winter is around 70 degrees Fahrenheit.
Economy
Lely Resort is a master-planned community, and as such, the economy of the community is largely based on the real estate market. The community is home to a variety of luxury homes, ranging from single-family homes to condominiums and townhomes. The community also features a variety of amenities, including two championship golf courses, a clubhouse, tennis courts, swimming pools, and a fitness center.
The community also features a variety of shopping, dining, and entertainment options. The community is home to a variety of restaurants, bars, and cafes, as well as a variety of retail stores. The community also features a variety of other businesses, including medical offices, financial services, and professional services.
Demographics
As of the 2010 census, the population of Lely Resort was 8,845. The population is largely white, with the majority of the population being of European descent. The median age of the population is 54.7 years, and the median household income is $87,945.
The community is largely affluent, with the majority of the population having a college degree or higher. The community is also home to a variety of professionals, including doctors, lawyers, and business owners. The community is also home to a variety of retirees, as well as a variety of other professionals.
Common Questions
What is Per Capita Income in Lely Resort?
Per Capita income in Lely Resort is $58,504.
What is the Median Family Income in Lely Resort?
Median Family Income in Lely Resort is $95,635.
What is the Median Household income in Lely Resort?
Median Household Income in Lely Resort is $80,290.
What is Income or Wage Gap in Lely Resort?
Income or Wage Gap in Lely Resort is 9.1%.
Women in Lely Resort earn 90.9 cents for every dollar earned by a man.
What is Inequality or Gini Index in Lely Resort?
Inequality or Gini Index in Lely Resort is 0.47.
What is the Total Population of Lely Resort?
Total Population of Lely Resort is 7,505.
What is the Total Male Population of Lely Resort?
Total Male Population of Lely Resort is 3,490.
What is the Total Female Population of Lely Resort?
Total Female Population of Lely Resort is 4,015.
What is the Ratio of Males per 100 Females in Lely Resort?
There are 86.92 Males per 100 Females in Lely Resort.
What is the Ratio of Females per 100 Males in Lely Resort?
There are 115.04 Females per 100 Males in Lely Resort.
What is the Median Population Age in Lely Resort?
Median Population Age in Lely Resort is 59.5 Years.
What is the Average Family Size in Lely Resort
Average Family Size in Lely Resort is 2.5 People.
What is the Average Household Size in Lely Resort
Average Household Size in Lely Resort is 2.1 People.
How Large is the Labor Force in Lely Resort?
There are 2,637 People in the Labor Forcein in Lely Resort.
What is the Percentage of People in the Labor Force in Lely Resort?
40.4% of People are in the Labor Force in Lely Resort.
What is the Unemployment Rate in Lely Resort?
Unemployment Rate in Lely Resort is 2.4%.