Goodview, MN Map & Demographics
Goodview Map
Goodview Overview
$34,649
PER CAPITA INCOME
$86,856
AVG FAMILY INCOME
$66,065
AVG HOUSEHOLD INCOME
6.1%
WAGE / INCOME GAP [ % ]
93.9¢/ $1
WAGE / INCOME GAP [ $ ]
0.33
INEQUALITY / GINI INDEX
4,109
TOTAL POPULATION
2,193
MALE POPULATION
1,916
FEMALE POPULATION
114.46
MALES / 100 FEMALES
87.37
FEMALES / 100 MALES
36.1
MEDIAN AGE
2.9
AVG FAMILY SIZE
2.1
AVG HOUSEHOLD SIZE
2,472
LABOR FORCE [ PEOPLE ]
73.4%
PERCENT IN LABOR FORCE
4.5%
UNEMPLOYMENT RATE
Goodview Area Codes
Income in Goodview
Income Overview in Goodview
Per Capita Income in Goodview is $34,649, while median incomes of families and households are $86,856 and $66,065 respectively.
| Characteristic | Number | Measure |
| Per Capita Income | 4,109 | $34,649 |
| Median Family Income | 937 | $86,856 |
| Mean Family Income | 937 | $90,560 |
| Median Household Income | 1,915 | $66,065 |
| Mean Household Income | 1,915 | $74,043 |
| Income Deficit | 937 | $0 |
| Wage / Income Gap (%) | 4,109 | 6.08% |
| Wage / Income Gap ($) | 4,109 | 93.92¢ per $1 |
| Gini / Inequality Index | 4,109 | 0.33 |
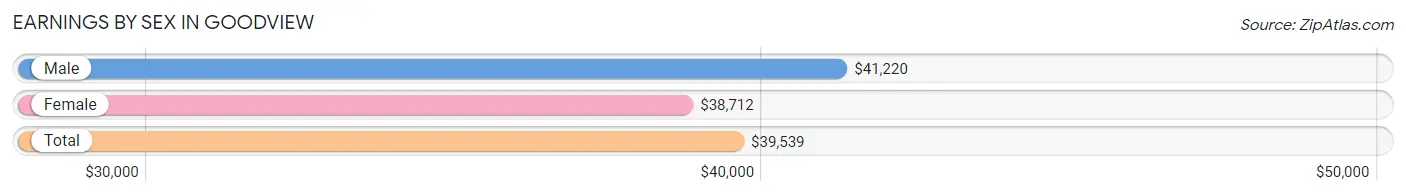
Earnings by Sex in Goodview
Average Earnings in Goodview are $39,539, $41,220 for men and $38,712 for women, a difference of 6.1%.
| Sex | Number | Average Earnings |
| Male | 1,478 (55.9%) | $41,220 |
| Female | 1,166 (44.1%) | $38,712 |
| Total | 2,644 (100.0%) | $39,539 |
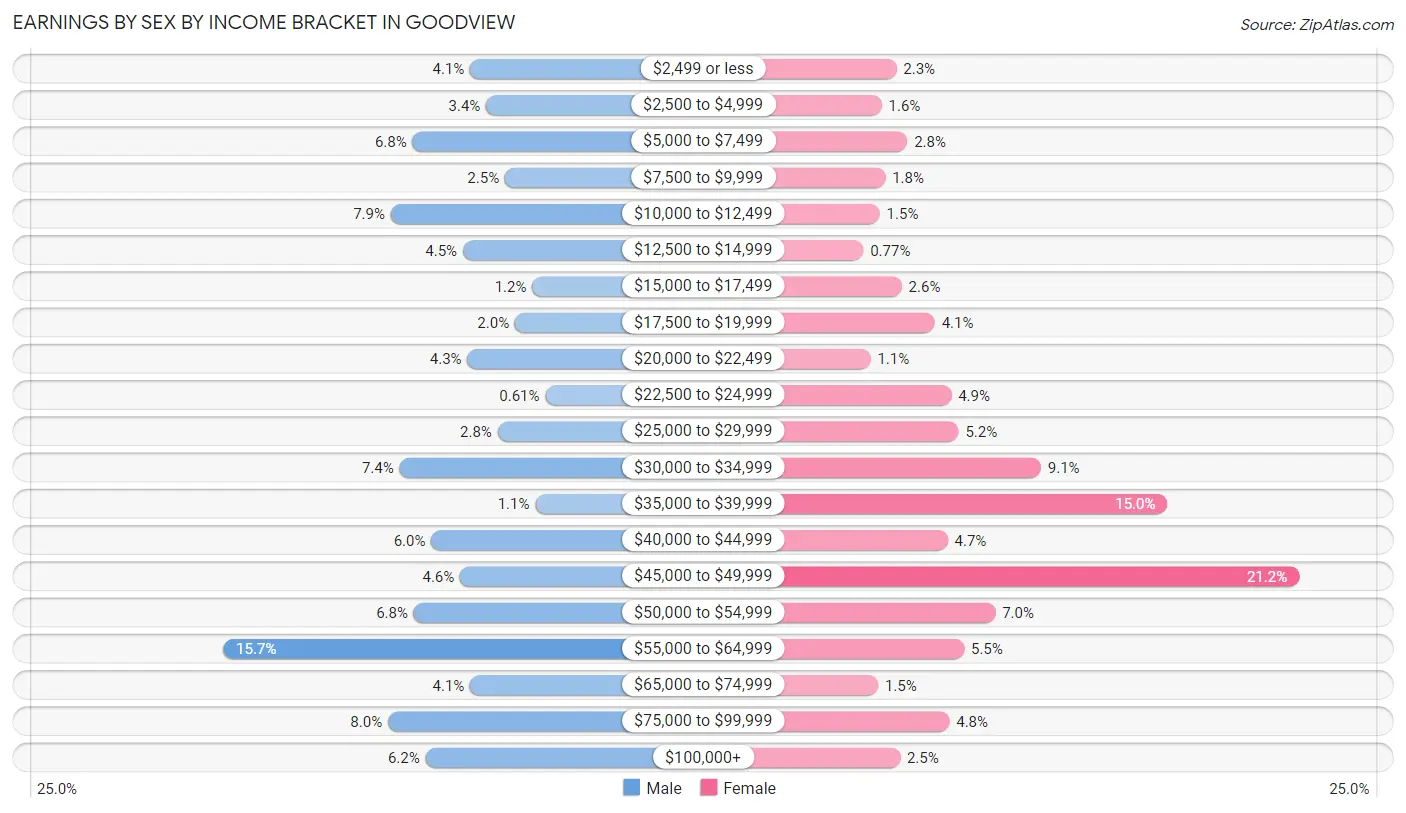
Earnings by Sex by Income Bracket in Goodview
The most common earnings brackets in Goodview are $55,000 to $64,999 for men (232 | 15.7%) and $45,000 to $49,999 for women (247 | 21.2%).
| Income | Male | Female |
| $2,499 or less | 61 (4.1%) | 27 (2.3%) |
| $2,500 to $4,999 | 50 (3.4%) | 19 (1.6%) |
| $5,000 to $7,499 | 101 (6.8%) | 33 (2.8%) |
| $7,500 to $9,999 | 37 (2.5%) | 21 (1.8%) |
| $10,000 to $12,499 | 116 (7.9%) | 18 (1.5%) |
| $12,500 to $14,999 | 66 (4.5%) | 9 (0.8%) |
| $15,000 to $17,499 | 18 (1.2%) | 30 (2.6%) |
| $17,500 to $19,999 | 30 (2.0%) | 48 (4.1%) |
| $20,000 to $22,499 | 63 (4.3%) | 13 (1.1%) |
| $22,500 to $24,999 | 9 (0.6%) | 57 (4.9%) |
| $25,000 to $29,999 | 42 (2.8%) | 61 (5.2%) |
| $30,000 to $34,999 | 110 (7.4%) | 106 (9.1%) |
| $35,000 to $39,999 | 16 (1.1%) | 175 (15.0%) |
| $40,000 to $44,999 | 88 (5.9%) | 55 (4.7%) |
| $45,000 to $49,999 | 68 (4.6%) | 247 (21.2%) |
| $50,000 to $54,999 | 100 (6.8%) | 81 (7.0%) |
| $55,000 to $64,999 | 232 (15.7%) | 64 (5.5%) |
| $65,000 to $74,999 | 61 (4.1%) | 17 (1.5%) |
| $75,000 to $99,999 | 118 (8.0%) | 56 (4.8%) |
| $100,000+ | 92 (6.2%) | 29 (2.5%) |
| Total | 1,478 (100.0%) | 1,166 (100.0%) |
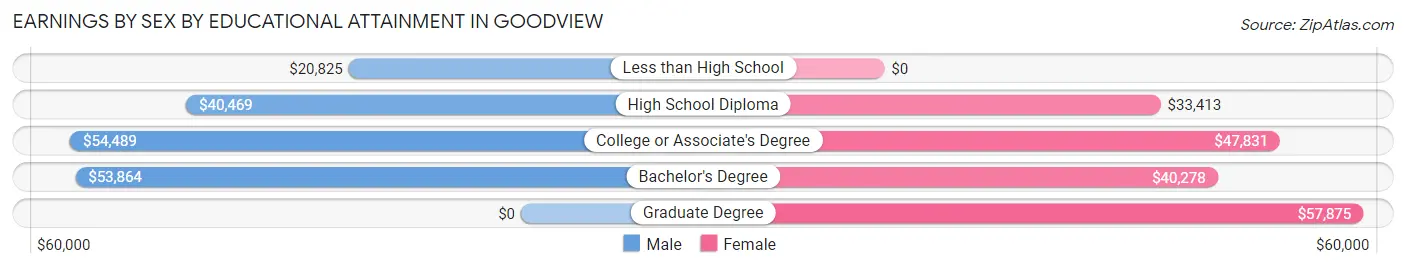
Earnings by Sex by Educational Attainment in Goodview
Average earnings in Goodview are $47,917 for men and $41,722 for women, a difference of 12.9%. Men with an educational attainment of college or associate's degree enjoy the highest average annual earnings of $54,489, while those with less than high school education earn the least with $20,825. Women with an educational attainment of graduate degree earn the most with the average annual earnings of $57,875, while those with high school diploma education have the smallest earnings of $33,413.
| Educational Attainment | Male Income | Female Income |
| Less than High School | $20,825 | $0 |
| High School Diploma | $40,469 | $33,413 |
| College or Associate's Degree | $54,489 | $47,831 |
| Bachelor's Degree | $53,864 | $40,278 |
| Graduate Degree | - | - |
| Total | $47,917 | $41,722 |
Family Income in Goodview
Family Income Brackets in Goodview
According to the Goodview family income data, there are 331 families falling into the $75,000 to $99,999 income range, which is the most common income bracket and makes up 35.3% of all families.
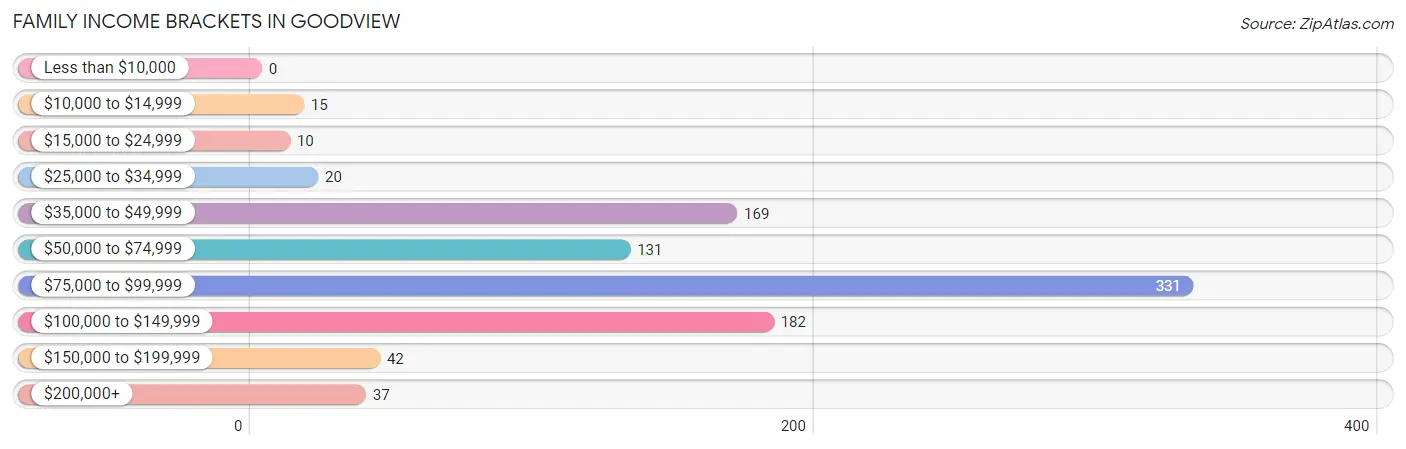
| Income Bracket | # Families | % Families |
| Less than $10,000 | 0 | 0.0% |
| $10,000 to $14,999 | 15 | 1.6% |
| $15,000 to $24,999 | 10 | 1.1% |
| $25,000 to $34,999 | 20 | 2.1% |
| $35,000 to $49,999 | 169 | 18.0% |
| $50,000 to $74,999 | 131 | 14.0% |
| $75,000 to $99,999 | 331 | 35.3% |
| $100,000 to $149,999 | 182 | 19.4% |
| $150,000 to $199,999 | 42 | 4.5% |
| $200,000+ | 37 | 3.9% |
Family Income by Famaliy Size in Goodview
4-person families (76 | 8.1%) account for the highest median family income in Goodview with $105,500 per family, while 2-person families (598 | 63.8%) have the highest median income of $38,492 per family member.
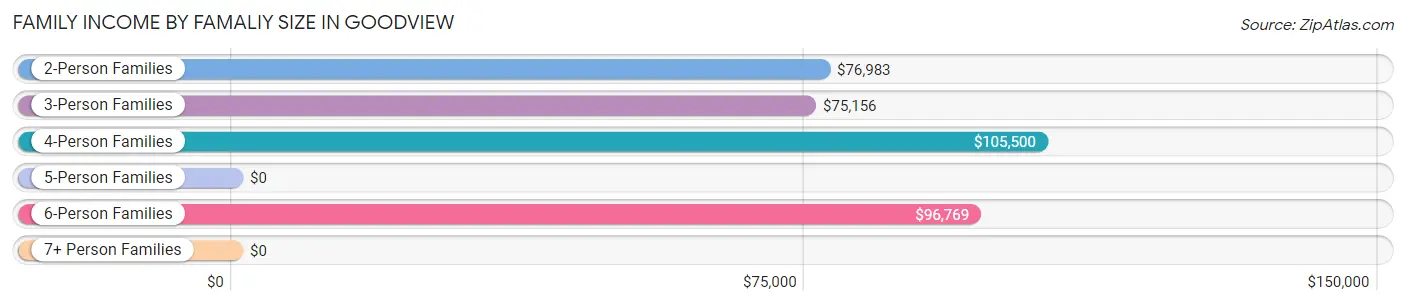
| Income Bracket | # Families | Median Income |
| 2-Person Families | 598 (63.8%) | $76,983 |
| 3-Person Families | 123 (13.1%) | $75,156 |
| 4-Person Families | 76 (8.1%) | $105,500 |
| 5-Person Families | 25 (2.7%) | $0 |
| 6-Person Families | 115 (12.3%) | $96,769 |
| 7+ Person Families | 0 (0.0%) | $0 |
| Total | 937 (100.0%) | $86,856 |
Family Income by Number of Earners in Goodview
The median family income in Goodview is $86,856, with families comprising 2 earners (448) having the highest median family income of $96,535, while families with 1 earner (310) have the lowest median family income of $49,313, accounting for 47.8% and 33.1% of families, respectively.
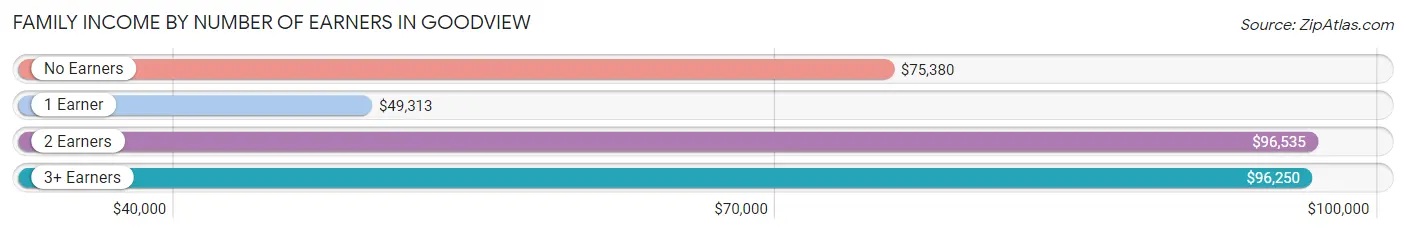
| Number of Earners | # Families | Median Income |
| No Earners | 97 (10.3%) | $75,380 |
| 1 Earner | 310 (33.1%) | $49,313 |
| 2 Earners | 448 (47.8%) | $96,535 |
| 3+ Earners | 82 (8.7%) | $96,250 |
| Total | 937 (100.0%) | $86,856 |
Household Income in Goodview
Household Income Brackets in Goodview
With 511 households falling in the category, the $75,000 to $99,999 income range is the most frequent in Goodview, accounting for 26.7% of all households. In contrast, only 10 households (0.5%) fall into the less than $10,000 income bracket, making it the least populous group.
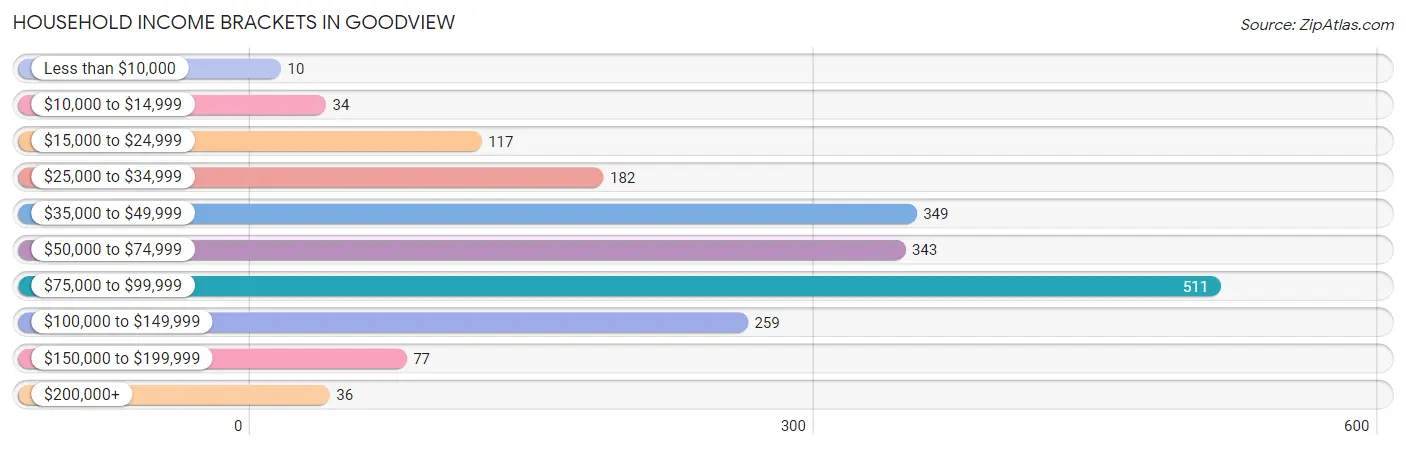
| Income Bracket | # Households | % Households |
| Less than $10,000 | 10 | 0.5% |
| $10,000 to $14,999 | 34 | 1.8% |
| $15,000 to $24,999 | 117 | 6.1% |
| $25,000 to $34,999 | 182 | 9.5% |
| $35,000 to $49,999 | 349 | 18.2% |
| $50,000 to $74,999 | 343 | 17.9% |
| $75,000 to $99,999 | 511 | 26.7% |
| $100,000 to $149,999 | 259 | 13.5% |
| $150,000 to $199,999 | 77 | 4.0% |
| $200,000+ | 36 | 1.9% |
Household Income by Householder Age in Goodview
The median household income in Goodview is $66,065, with the highest median household income of $84,015 found in the 45 to 64 years age bracket for the primary householder. A total of 724 households (37.8%) fall into this category. Meanwhile, the 65+ years age bracket for the primary householder has the lowest median household income of $46,250, with 436 households (22.8%) in this group.
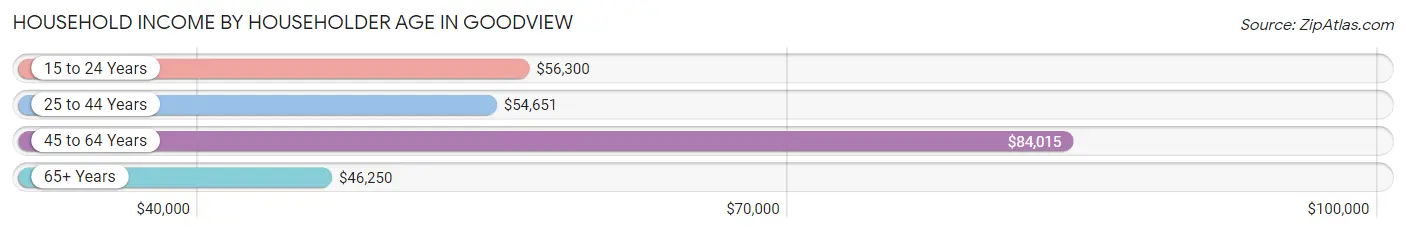
| Income Bracket | # Households | Median Income |
| 15 to 24 Years | 158 (8.3%) | $56,300 |
| 25 to 44 Years | 597 (31.2%) | $54,651 |
| 45 to 64 Years | 724 (37.8%) | $84,015 |
| 65+ Years | 436 (22.8%) | $46,250 |
| Total | 1,915 (100.0%) | $66,065 |
Poverty in Goodview
Income Below Poverty by Sex and Age in Goodview
With 6.2% poverty level for males and 4.9% for females among the residents of Goodview, 18 to 24 year old males and 5 year old females are the most vulnerable to poverty, with 50 males (18.2%) and 13 females (26.0%) in their respective age groups living below the poverty level.
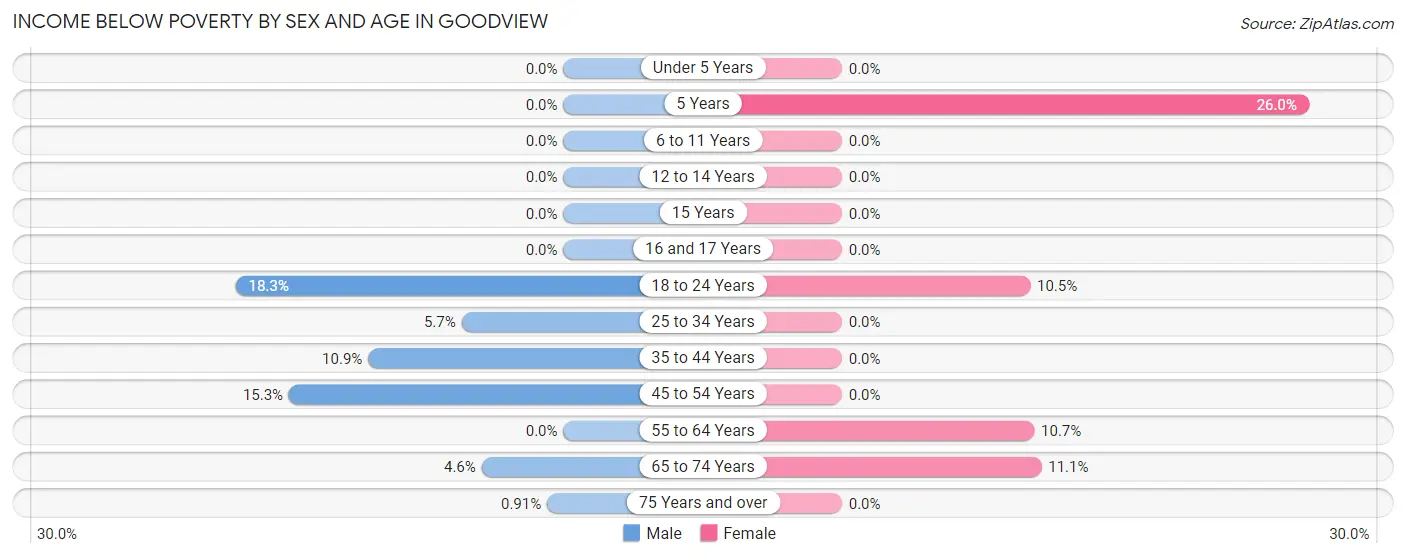
| Age Bracket | Male | Female |
| Under 5 Years | 0 (0.0%) | 0 (0.0%) |
| 5 Years | 0 (0.0%) | 13 (26.0%) |
| 6 to 11 Years | 0 (0.0%) | 0 (0.0%) |
| 12 to 14 Years | 0 (0.0%) | 0 (0.0%) |
| 15 Years | 0 (0.0%) | 0 (0.0%) |
| 16 and 17 Years | 0 (0.0%) | 0 (0.0%) |
| 18 to 24 Years | 50 (18.2%) | 24 (10.5%) |
| 25 to 34 Years | 23 (5.7%) | 0 (0.0%) |
| 35 to 44 Years | 15 (10.9%) | 0 (0.0%) |
| 45 to 54 Years | 35 (15.3%) | 0 (0.0%) |
| 55 to 64 Years | 0 (0.0%) | 33 (10.7%) |
| 65 to 74 Years | 10 (4.5%) | 23 (11.1%) |
| 75 Years and over | 1 (0.9%) | 0 (0.0%) |
| Total | 134 (6.2%) | 93 (4.9%) |
Income Above Poverty by Sex and Age in Goodview
According to the poverty statistics in Goodview, males aged under 5 years and females aged under 5 years are the age groups that are most secure financially, with 100.0% of males and 100.0% of females in these age groups living above the poverty line.
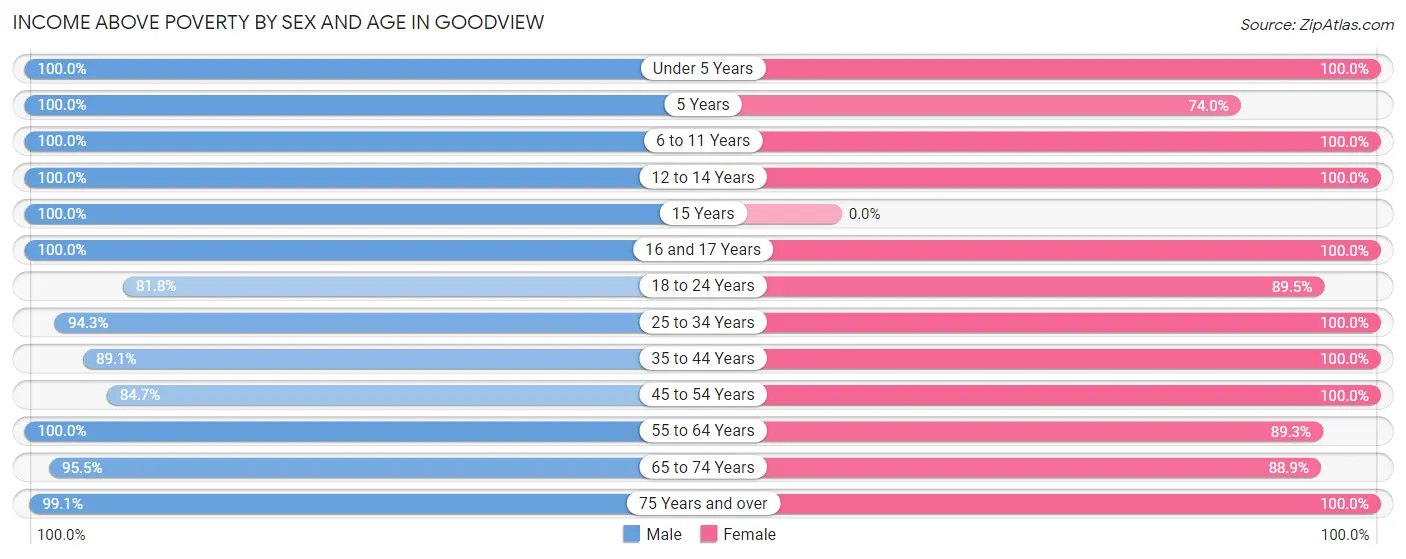
| Age Bracket | Male | Female |
| Under 5 Years | 69 (100.0%) | 148 (100.0%) |
| 5 Years | 35 (100.0%) | 37 (74.0%) |
| 6 to 11 Years | 132 (100.0%) | 89 (100.0%) |
| 12 to 14 Years | 134 (100.0%) | 14 (100.0%) |
| 15 Years | 41 (100.0%) | 0 (0.0%) |
| 16 and 17 Years | 40 (100.0%) | 13 (100.0%) |
| 18 to 24 Years | 224 (81.8%) | 205 (89.5%) |
| 25 to 34 Years | 383 (94.3%) | 278 (100.0%) |
| 35 to 44 Years | 123 (89.1%) | 201 (100.0%) |
| 45 to 54 Years | 194 (84.7%) | 244 (100.0%) |
| 55 to 64 Years | 344 (100.0%) | 275 (89.3%) |
| 65 to 74 Years | 210 (95.5%) | 184 (88.9%) |
| 75 Years and over | 109 (99.1%) | 127 (100.0%) |
| Total | 2,038 (93.8%) | 1,815 (95.1%) |
Income Below Poverty Among Married-Couple Families in Goodview
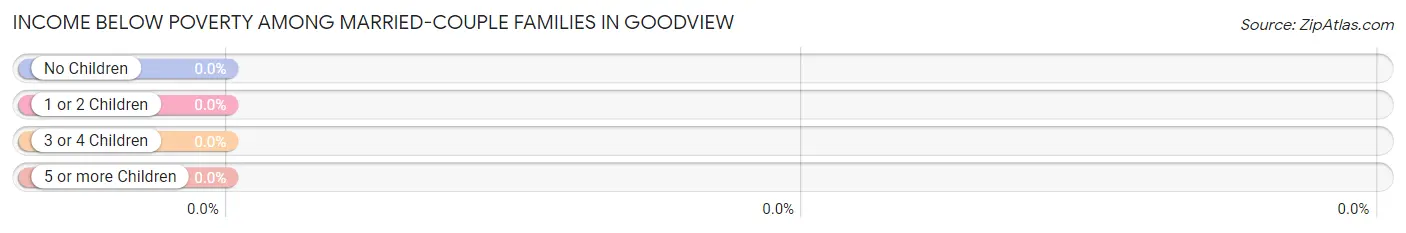
| Children | Above Poverty | Below Poverty |
| No Children | 489 (100.0%) | 0 (0.0%) |
| 1 or 2 Children | 98 (100.0%) | 0 (0.0%) |
| 3 or 4 Children | 126 (100.0%) | 0 (0.0%) |
| 5 or more Children | 0 (0.0%) | 0 (0.0%) |
| Total | 713 (100.0%) | 0 (0.0%) |
Income Below Poverty Among Single-Parent Households in Goodview
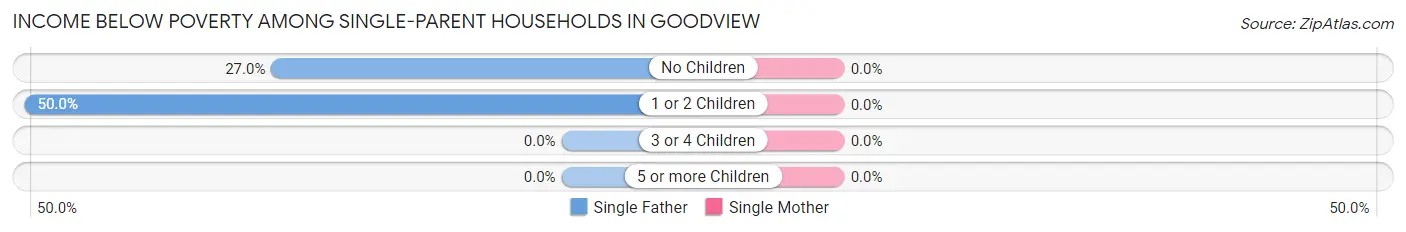
| Children | Single Father | Single Mother |
| No Children | 10 (27.0%) | 0 (0.0%) |
| 1 or 2 Children | 15 (50.0%) | 0 (0.0%) |
| 3 or 4 Children | 0 (0.0%) | 0 (0.0%) |
| 5 or more Children | 0 (0.0%) | 0 (0.0%) |
| Total | 25 (37.3%) | 0 (0.0%) |
Income Below Poverty Among Married-Couple vs Single-Parent Households in Goodview
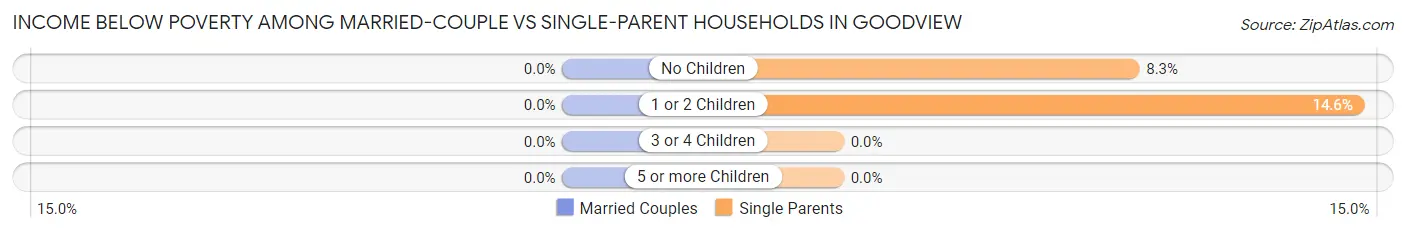
| Children | Married-Couple Families | Single-Parent Households |
| No Children | 0 (0.0%) | 10 (8.3%) |
| 1 or 2 Children | 0 (0.0%) | 15 (14.6%) |
| 3 or 4 Children | 0 (0.0%) | 0 (0.0%) |
| 5 or more Children | 0 (0.0%) | 0 (0.0%) |
| Total | 0 (0.0%) | 25 (11.2%) |
Race in Goodview
The most populous races in Goodview are White / Caucasian (3,855 | 93.8%), Two or more Races (147 | 3.6%), and Asian (102 | 2.5%).
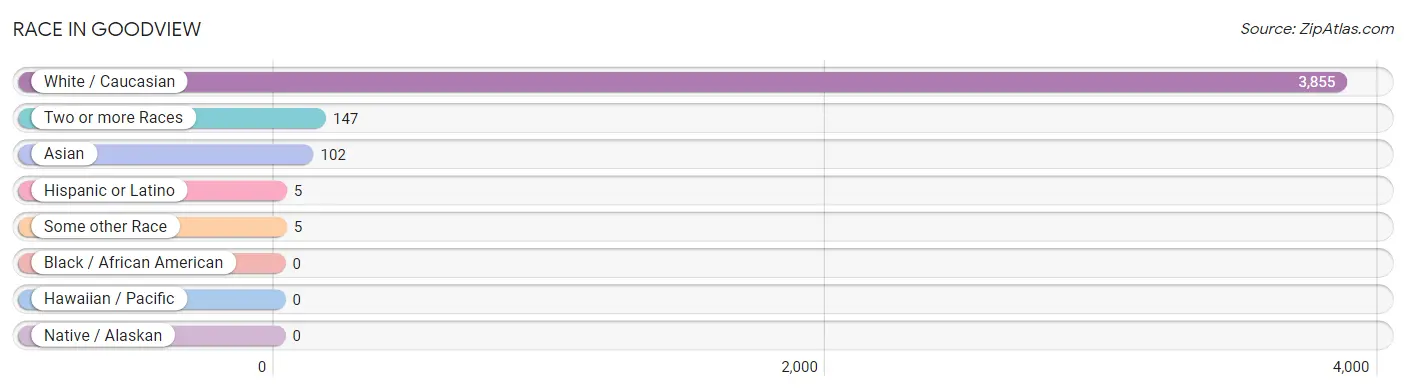
| Race | # Population | % Population |
| Asian | 102 | 2.5% |
| Black / African American | 0 | 0.0% |
| Hawaiian / Pacific | 0 | 0.0% |
| Hispanic or Latino | 5 | 0.1% |
| Native / Alaskan | 0 | 0.0% |
| White / Caucasian | 3,855 | 93.8% |
| Two or more Races | 147 | 3.6% |
| Some other Race | 5 | 0.1% |
| Total | 4,109 | 100.0% |
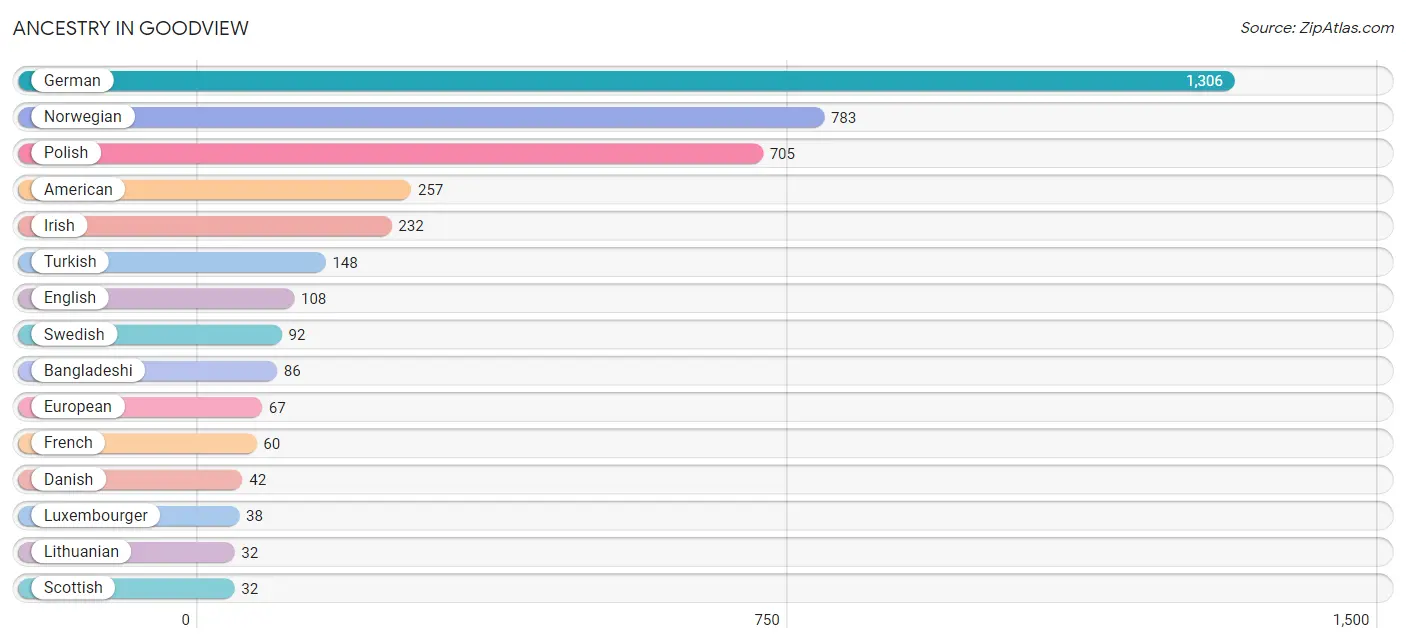
Ancestry in Goodview
The most populous ancestries reported in Goodview are German (1,306 | 31.8%), Norwegian (783 | 19.1%), Polish (705 | 17.2%), American (257 | 6.2%), and Irish (232 | 5.7%), together accounting for 79.9% of all Goodview residents.
| Ancestry | # Population | % Population |
| Albanian | 21 | 0.5% |
| American | 257 | 6.2% |
| Arab | 14 | 0.3% |
| Austrian | 21 | 0.5% |
| Bangladeshi | 86 | 2.1% |
| British | 15 | 0.4% |
| Cherokee | 1 | 0.0% |
| Czech | 14 | 0.3% |
| Danish | 42 | 1.0% |
| Dutch | 28 | 0.7% |
| Eastern European | 8 | 0.2% |
| English | 108 | 2.6% |
| European | 67 | 1.6% |
| Finnish | 29 | 0.7% |
| French | 60 | 1.5% |
| German | 1,306 | 31.8% |
| Greek | 7 | 0.2% |
| Hungarian | 27 | 0.7% |
| Irish | 232 | 5.7% |
| Italian | 21 | 0.5% |
| Lebanese | 2 | 0.1% |
| Lithuanian | 32 | 0.8% |
| Luxembourger | 38 | 0.9% |
| Mexican | 5 | 0.1% |
| Northern European | 16 | 0.4% |
| Norwegian | 783 | 19.1% |
| Palestinian | 12 | 0.3% |
| Polish | 705 | 17.2% |
| Russian | 15 | 0.4% |
| Scotch-Irish | 9 | 0.2% |
| Scottish | 32 | 0.8% |
| Sri Lankan | 16 | 0.4% |
| Swedish | 92 | 2.2% |
| Swiss | 11 | 0.3% |
| Turkish | 148 | 3.6% |
| Ukrainian | 6 | 0.2% |
| Welsh | 10 | 0.2% | View All 37 Rows |
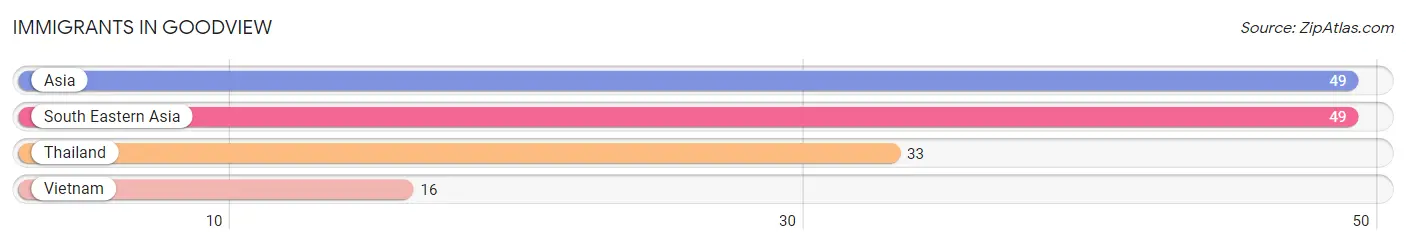
Immigrants in Goodview
The most numerous immigrant groups reported in Goodview came from Asia (49 | 1.2%), South Eastern Asia (49 | 1.2%), Thailand (33 | 0.8%), and Vietnam (16 | 0.4%), together accounting for 3.6% of all Goodview residents.
| Immigration Origin | # Population | % Population |
| Asia | 49 | 1.2% |
| South Eastern Asia | 49 | 1.2% |
| Thailand | 33 | 0.8% |
| Vietnam | 16 | 0.4% | View All 4 Rows |
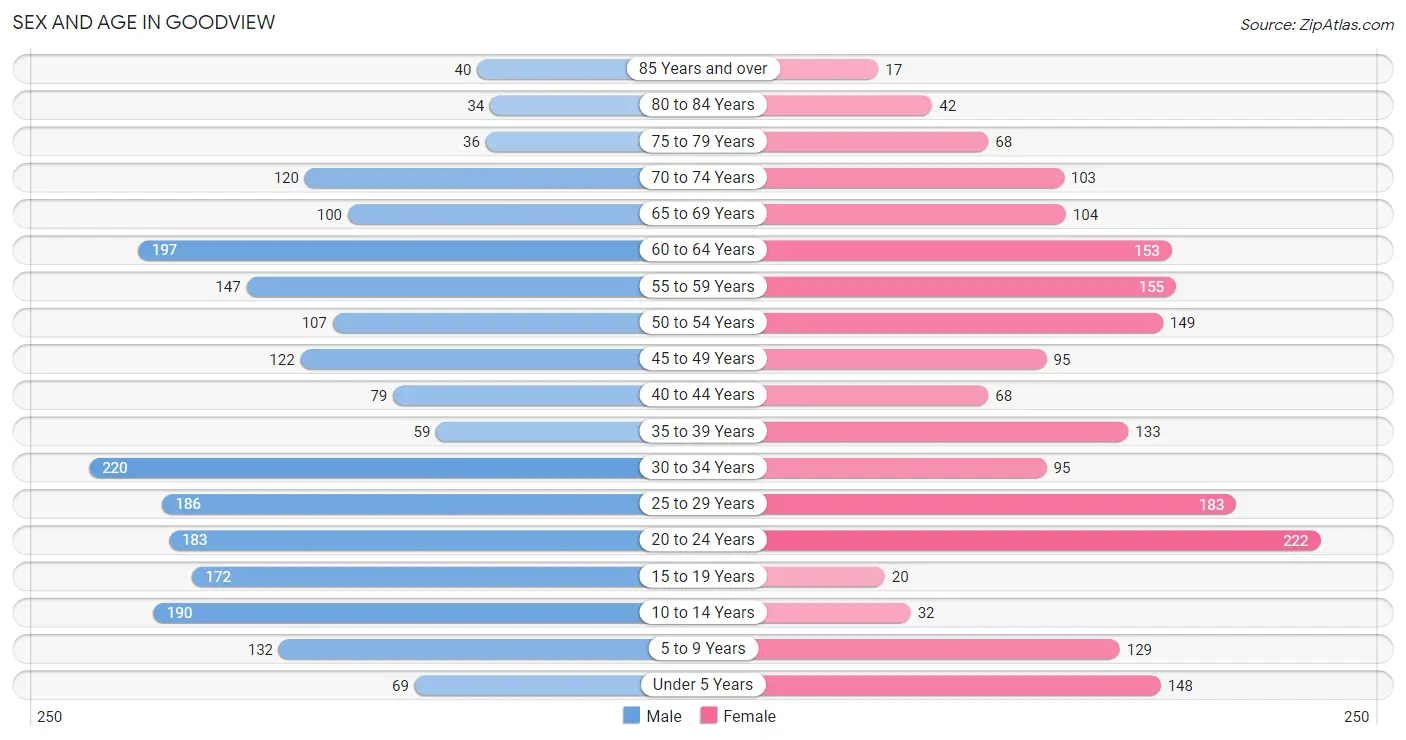
Sex and Age in Goodview
Sex and Age in Goodview
The most populous age groups in Goodview are 30 to 34 Years (220 | 10.0%) for men and 20 to 24 Years (222 | 11.6%) for women.
| Age Bracket | Male | Female |
| Under 5 Years | 69 (3.2%) | 148 (7.7%) |
| 5 to 9 Years | 132 (6.0%) | 129 (6.7%) |
| 10 to 14 Years | 190 (8.7%) | 32 (1.7%) |
| 15 to 19 Years | 172 (7.8%) | 20 (1.0%) |
| 20 to 24 Years | 183 (8.3%) | 222 (11.6%) |
| 25 to 29 Years | 186 (8.5%) | 183 (9.6%) |
| 30 to 34 Years | 220 (10.0%) | 95 (5.0%) |
| 35 to 39 Years | 59 (2.7%) | 133 (6.9%) |
| 40 to 44 Years | 79 (3.6%) | 68 (3.5%) |
| 45 to 49 Years | 122 (5.6%) | 95 (5.0%) |
| 50 to 54 Years | 107 (4.9%) | 149 (7.8%) |
| 55 to 59 Years | 147 (6.7%) | 155 (8.1%) |
| 60 to 64 Years | 197 (9.0%) | 153 (8.0%) |
| 65 to 69 Years | 100 (4.6%) | 104 (5.4%) |
| 70 to 74 Years | 120 (5.5%) | 103 (5.4%) |
| 75 to 79 Years | 36 (1.6%) | 68 (3.5%) |
| 80 to 84 Years | 34 (1.5%) | 42 (2.2%) |
| 85 Years and over | 40 (1.8%) | 17 (0.9%) |
| Total | 2,193 (100.0%) | 1,916 (100.0%) |
Families and Households in Goodview
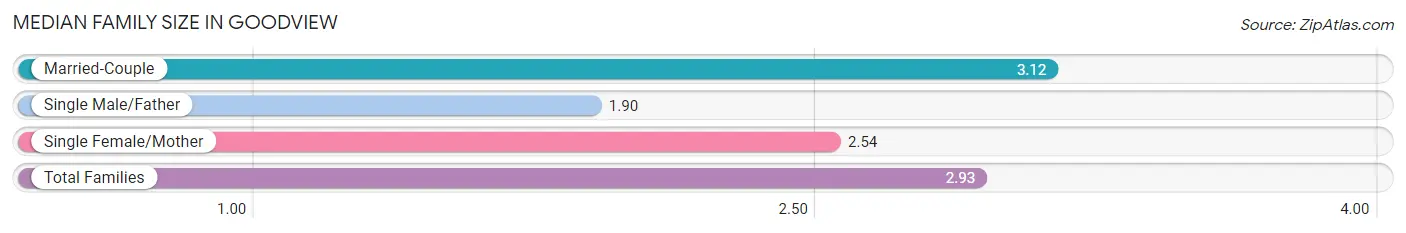
Median Family Size in Goodview
The median family size in Goodview is 2.93 persons per family, with married-couple families (713 | 76.1%) accounting for the largest median family size of 3.12 persons per family. On the other hand, single male/father families (67 | 7.1%) represent the smallest median family size with 1.90 persons per family.
| Family Type | # Families | Family Size |
| Married-Couple | 713 (76.1%) | 3.12 |
| Single Male/Father | 67 (7.1%) | 1.90 |
| Single Female/Mother | 157 (16.8%) | 2.54 |
| Total Families | 937 (100.0%) | 2.93 |
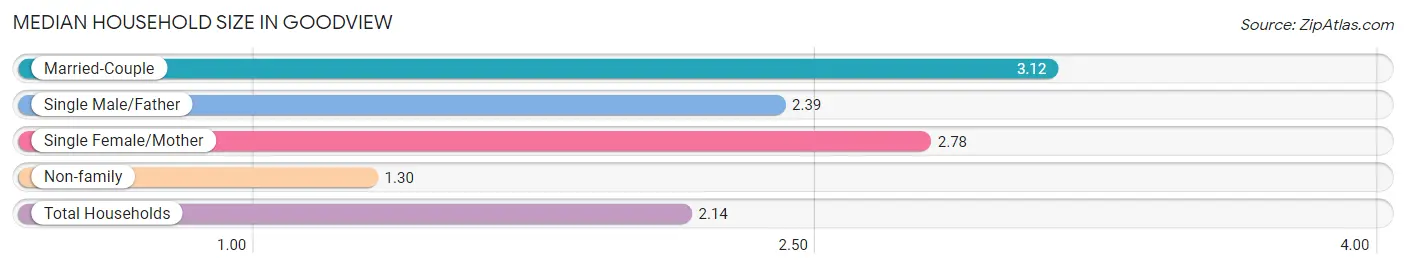
Median Household Size in Goodview
The median household size in Goodview is 2.14 persons per household, with married-couple households (713 | 37.2%) accounting for the largest median household size of 3.12 persons per household. non-family households (978 | 51.1%) represent the smallest median household size with 1.30 persons per household.
| Household Type | # Households | Household Size |
| Married-Couple | 713 (37.2%) | 3.12 |
| Single Male/Father | 67 (3.5%) | 2.39 |
| Single Female/Mother | 157 (8.2%) | 2.78 |
| Non-family | 978 (51.1%) | 1.30 |
| Total Households | 1,915 (100.0%) | 2.14 |
Household Size by Marriage Status in Goodview
Out of a total of 1,915 households in Goodview, 937 (48.9%) are family households, while 978 (51.1%) are nonfamily households. The most numerous type of family households are 2-person households, comprising 550, and the most common type of nonfamily households are 1-person households, comprising 727.
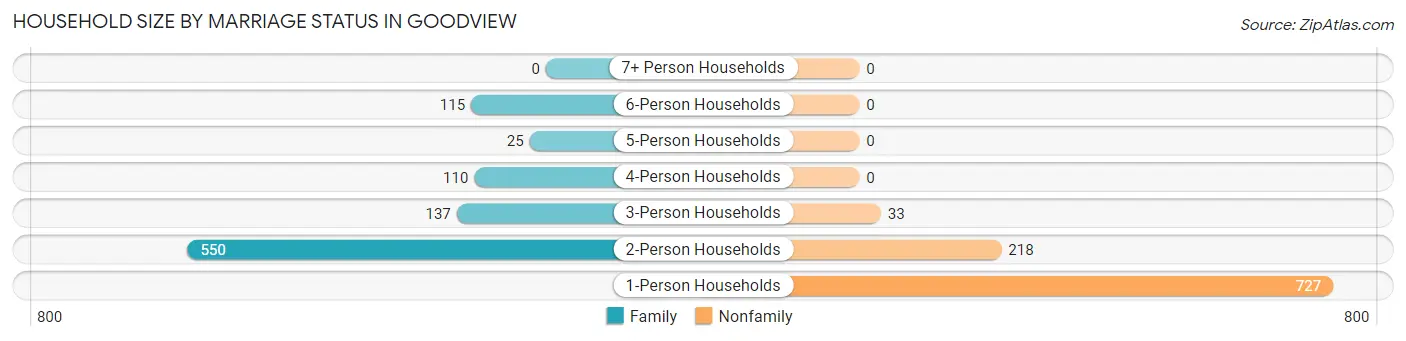
| Household Size | Family Households | Nonfamily Households |
| 1-Person Households | - | 727 (38.0%) |
| 2-Person Households | 550 (28.7%) | 218 (11.4%) |
| 3-Person Households | 137 (7.1%) | 33 (1.7%) |
| 4-Person Households | 110 (5.7%) | 0 (0.0%) |
| 5-Person Households | 25 (1.3%) | 0 (0.0%) |
| 6-Person Households | 115 (6.0%) | 0 (0.0%) |
| 7+ Person Households | 0 (0.0%) | 0 (0.0%) |
| Total | 937 (48.9%) | 978 (51.1%) |
Female Fertility in Goodview
Fertility by Age in Goodview
Average fertility rate in Goodview is 86.0 births per 1,000 women. Women in the age bracket of 35 to 50 years have the highest fertility rate with 148.0 births per 1,000 women. Women in the age bracket of 35 to 50 years acount for 70.7% of all women with births.
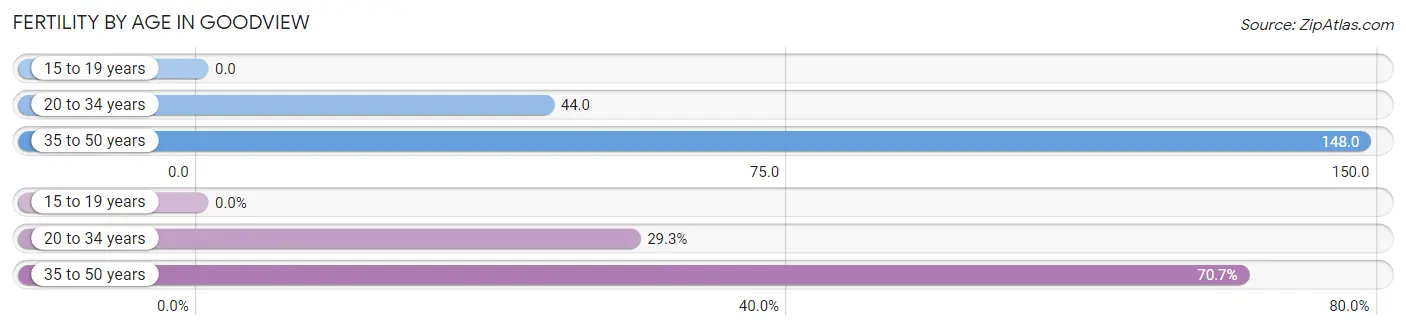
| Age Bracket | Women with Births | Births / 1,000 Women |
| 15 to 19 years | 0 (0.0%) | 0.0 |
| 20 to 34 years | 22 (29.3%) | 44.0 |
| 35 to 50 years | 53 (70.7%) | 148.0 |
| Total | 75 (100.0%) | 86.0 |
Fertility by Age by Marriage Status in Goodview
81.3% of women with births (75) in Goodview are married. The highest percentage of unmarried women with births falls into 20 to 34 years age bracket with 63.6% of them unmarried at the time of birth, while the lowest percentage of unmarried women with births belong to 35 to 50 years age bracket with 0.0% of them unmarried.
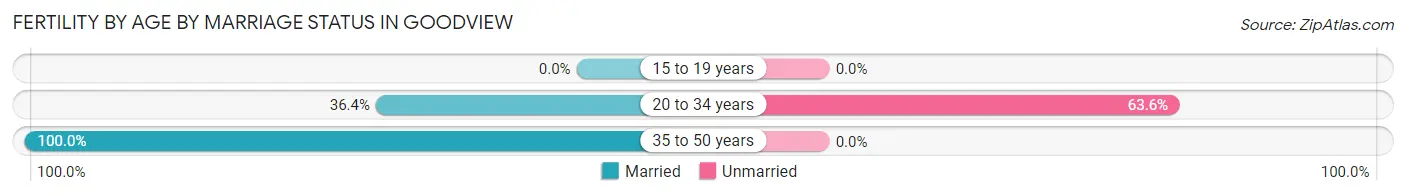
| Age Bracket | Married | Unmarried |
| 15 to 19 years | 0 (0.0%) | 0 (0.0%) |
| 20 to 34 years | 8 (36.4%) | 14 (63.6%) |
| 35 to 50 years | 53 (100.0%) | 0 (0.0%) |
| Total | 61 (81.3%) | 14 (18.7%) |
Fertility by Education in Goodview
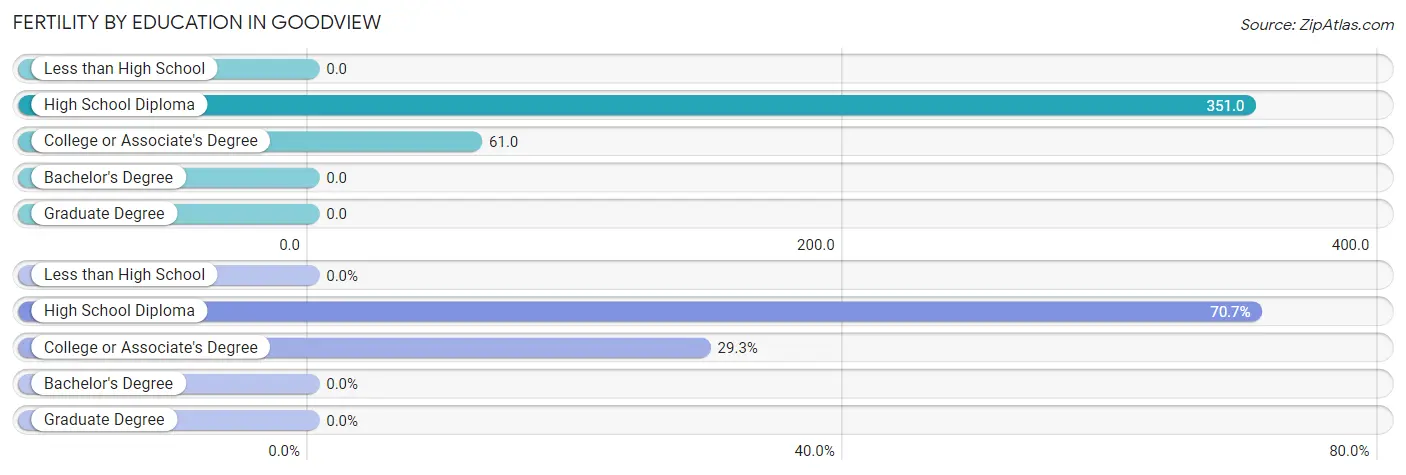
| Educational Attainment | Women with Births | Births / 1,000 Women |
| Less than High School | 0 (0.0%) | 0.0 |
| High School Diploma | 53 (70.7%) | 351.0 |
| College or Associate's Degree | 22 (29.3%) | 61.0 |
| Bachelor's Degree | 0 (0.0%) | 0.0 |
| Graduate Degree | 0 (0.0%) | 0.0 |
| Total | 75 (100.0%) | 86.0 |
Fertility by Education by Marriage Status in Goodview
18.7% of women with births in Goodview are unmarried. Women with the educational attainment of high school diploma are most likely to be married with 100.0% of them married at childbirth, while women with the educational attainment of college or associate's degree are least likely to be married with 63.6% of them unmarried at childbirth.
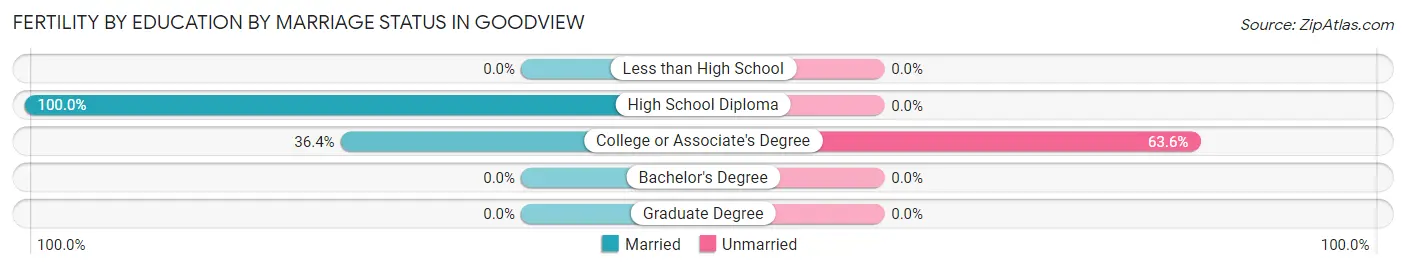
| Educational Attainment | Married | Unmarried |
| Less than High School | 0 (0.0%) | 0 (0.0%) |
| High School Diploma | 53 (100.0%) | 0 (0.0%) |
| College or Associate's Degree | 8 (36.4%) | 14 (63.6%) |
| Bachelor's Degree | 0 (0.0%) | 0 (0.0%) |
| Graduate Degree | 0 (0.0%) | 0 (0.0%) |
| Total | 61 (81.3%) | 14 (18.7%) |
Employment Characteristics in Goodview
Employment by Class of Employer in Goodview
Among the 2,300 employed individuals in Goodview, private company employees (1,575 | 68.5%), not-for-profit organizations (288 | 12.5%), and local government employees (134 | 5.8%) make up the most common classes of employment.
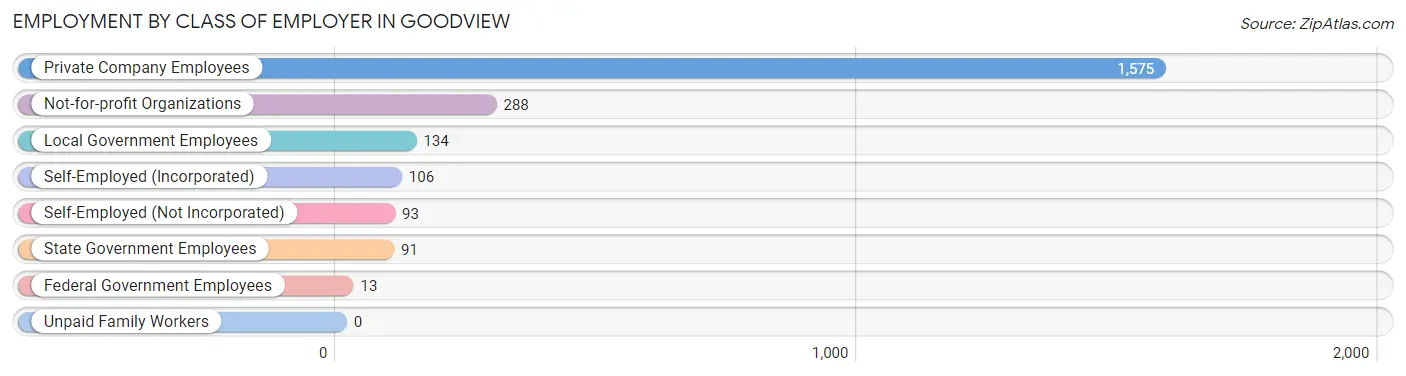
| Employer Class | # Employees | % Employees |
| Private Company Employees | 1,575 | 68.5% |
| Self-Employed (Incorporated) | 106 | 4.6% |
| Self-Employed (Not Incorporated) | 93 | 4.0% |
| Not-for-profit Organizations | 288 | 12.5% |
| Local Government Employees | 134 | 5.8% |
| State Government Employees | 91 | 4.0% |
| Federal Government Employees | 13 | 0.6% |
| Unpaid Family Workers | 0 | 0.0% |
| Total | 2,300 | 100.0% |
Employment Status by Age in Goodview
According to the labor force statistics for Goodview, out of the total population over 16 years of age (3,368), 73.4% or 2,472 individuals are in the labor force, with 4.5% or 111 of them unemployed. The age group with the highest labor force participation rate is 45 to 54 years, with 97.9% or 463 individuals in the labor force. Within the labor force, the 55 to 59 years age range has the highest percentage of unemployed individuals, with 18.0% or 47 of them being unemployed.
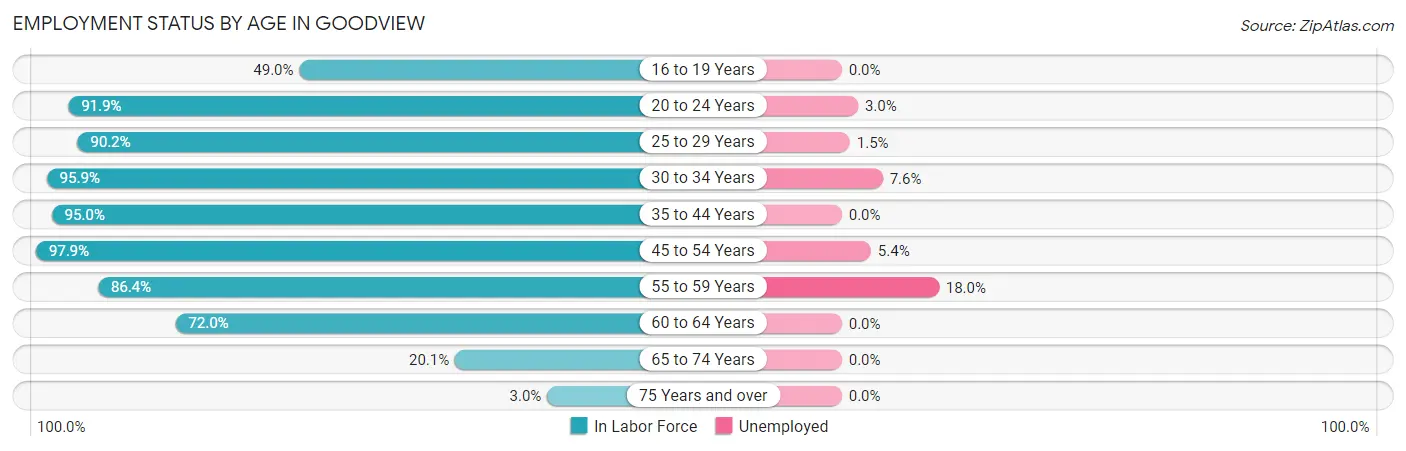
| Age Bracket | In Labor Force | Unemployed |
| 16 to 19 Years | 74 (49.0%) | 0 (0.0%) |
| 20 to 24 Years | 372 (91.9%) | 11 (3.0%) |
| 25 to 29 Years | 333 (90.2%) | 5 (1.5%) |
| 30 to 34 Years | 302 (95.9%) | 23 (7.6%) |
| 35 to 44 Years | 322 (95.0%) | 0 (0.0%) |
| 45 to 54 Years | 463 (97.9%) | 25 (5.4%) |
| 55 to 59 Years | 261 (86.4%) | 47 (18.0%) |
| 60 to 64 Years | 252 (72.0%) | 0 (0.0%) |
| 65 to 74 Years | 86 (20.1%) | 0 (0.0%) |
| 75 Years and over | 7 (3.0%) | 0 (0.0%) |
| Total | 2,472 (73.4%) | 111 (4.5%) |
Employment Status by Educational Attainment in Goodview
According to labor force statistics for Goodview, 90.0% of individuals (1,933) out of the total population between 25 and 64 years of age (2,148) are in the labor force, with 5.2% or 101 of them being unemployed. The group with the highest labor force participation rate are those with the educational attainment of bachelor's degree or higher, with 96.0% or 651 individuals in the labor force. Within the labor force, individuals with less than high school education have the highest percentage of unemployment, with 26.9% or 28 of them being unemployed.
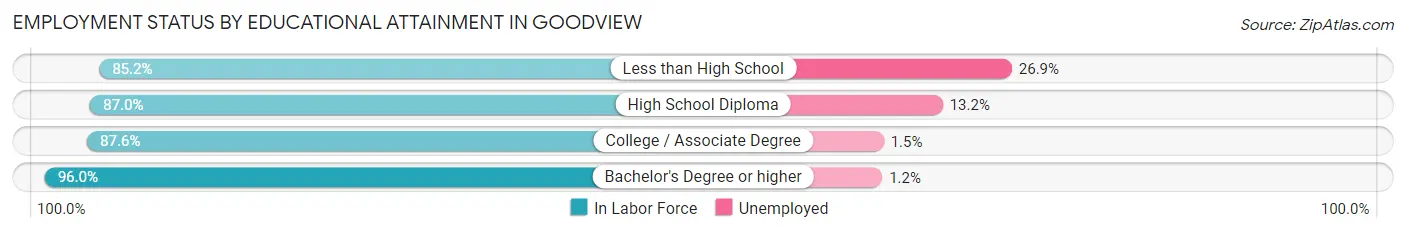
| Educational Attainment | In Labor Force | Unemployed |
| Less than High School | 104 (85.2%) | 33 (26.9%) |
| High School Diploma | 395 (87.0%) | 60 (13.2%) |
| College / Associate Degree | 783 (87.6%) | 13 (1.5%) |
| Bachelor's Degree or higher | 651 (96.0%) | 8 (1.2%) |
| Total | 1,933 (90.0%) | 112 (5.2%) |
Employment Occupations by Sex in Goodview
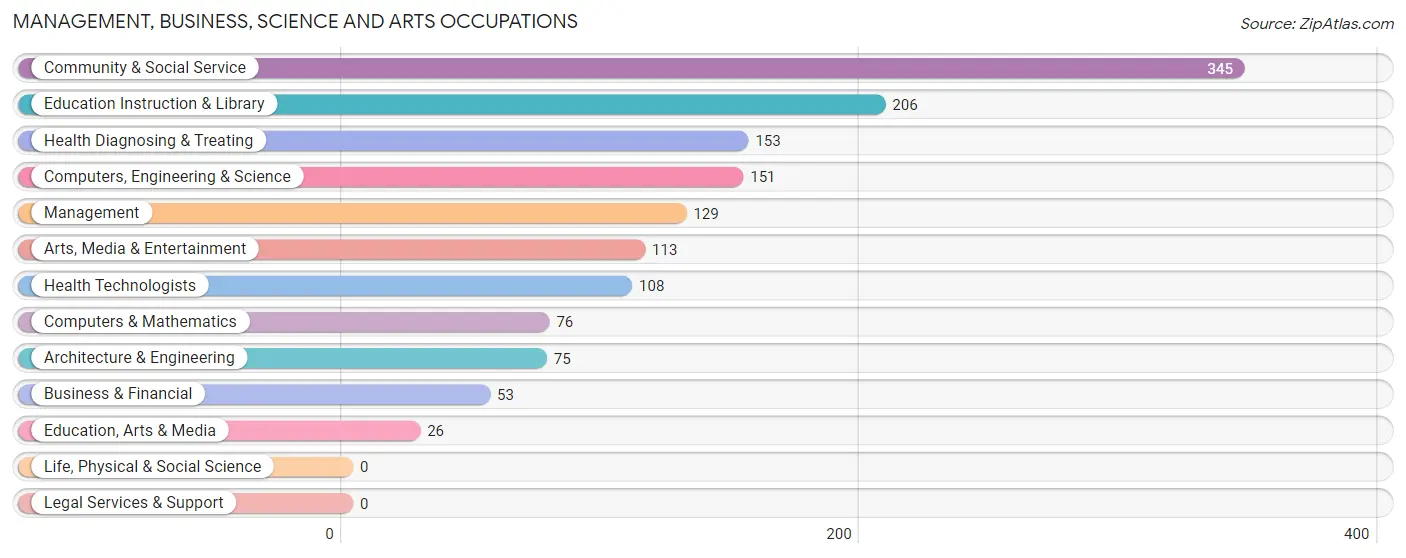
Management, Business, Science and Arts Occupations
The most common Management, Business, Science and Arts occupations in Goodview are Community & Social Service (345 | 14.6%), Education Instruction & Library (206 | 8.7%), Health Diagnosing & Treating (153 | 6.5%), Computers, Engineering & Science (151 | 6.4%), and Management (129 | 5.5%).
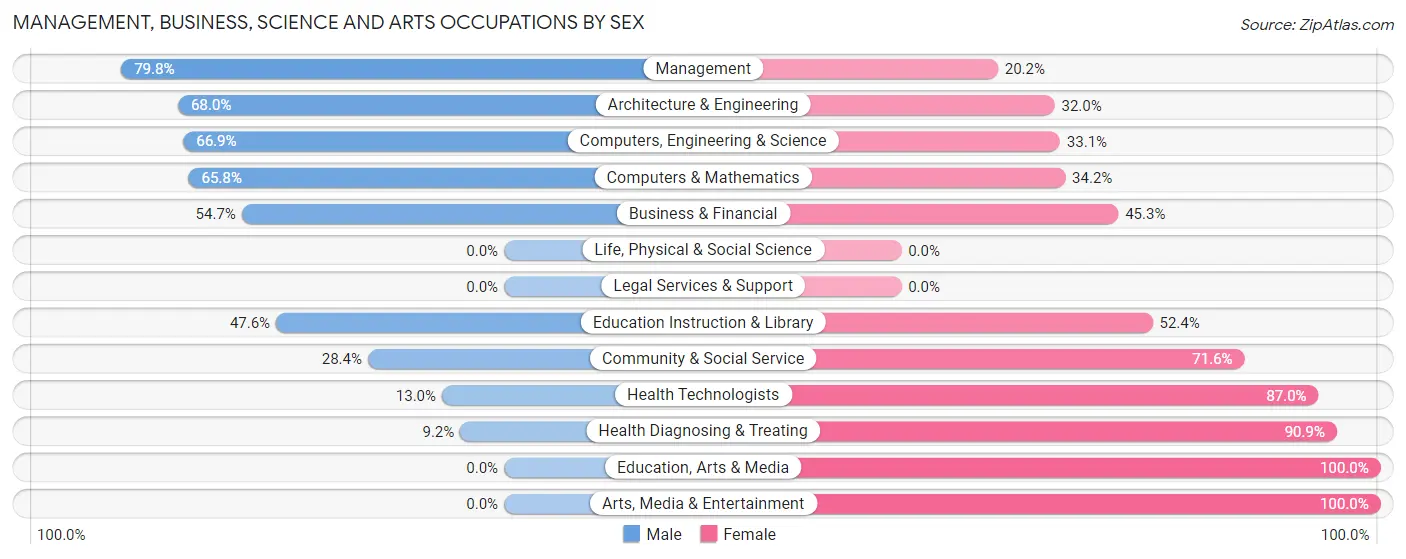
Management, Business, Science and Arts Occupations by Sex
Within the Management, Business, Science and Arts occupations in Goodview, the most male-oriented occupations are Management (79.8%), Architecture & Engineering (68.0%), and Computers, Engineering & Science (66.9%), while the most female-oriented occupations are Education, Arts & Media (100.0%), Arts, Media & Entertainment (100.0%), and Health Diagnosing & Treating (90.8%).
| Occupation | Male | Female |
| Management | 103 (79.8%) | 26 (20.2%) |
| Business & Financial | 29 (54.7%) | 24 (45.3%) |
| Computers, Engineering & Science | 101 (66.9%) | 50 (33.1%) |
| Computers & Mathematics | 50 (65.8%) | 26 (34.2%) |
| Architecture & Engineering | 51 (68.0%) | 24 (32.0%) |
| Life, Physical & Social Science | 0 (0.0%) | 0 (0.0%) |
| Community & Social Service | 98 (28.4%) | 247 (71.6%) |
| Education, Arts & Media | 0 (0.0%) | 26 (100.0%) |
| Legal Services & Support | 0 (0.0%) | 0 (0.0%) |
| Education Instruction & Library | 98 (47.6%) | 108 (52.4%) |
| Arts, Media & Entertainment | 0 (0.0%) | 113 (100.0%) |
| Health Diagnosing & Treating | 14 (9.1%) | 139 (90.8%) |
| Health Technologists | 14 (13.0%) | 94 (87.0%) |
| Total (Category) | 345 (41.5%) | 486 (58.5%) |
| Total (Overall) | 1,255 (53.2%) | 1,106 (46.8%) |
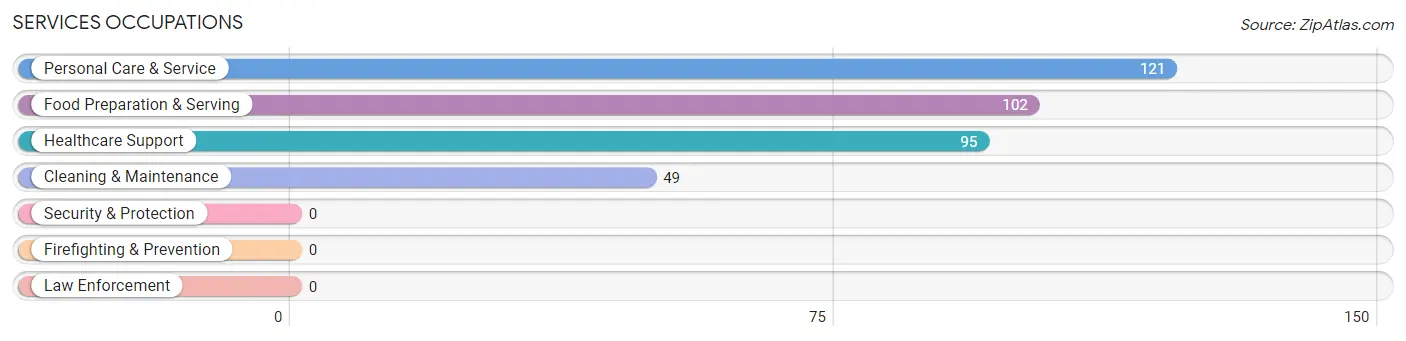
Services Occupations
The most common Services occupations in Goodview are Personal Care & Service (121 | 5.1%), Food Preparation & Serving (102 | 4.3%), Healthcare Support (95 | 4.0%), and Cleaning & Maintenance (49 | 2.1%).
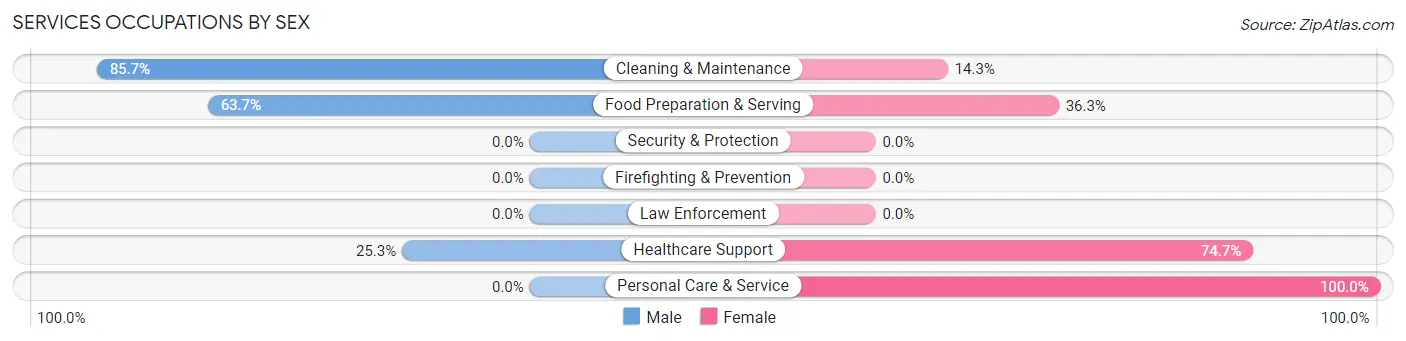
Services Occupations by Sex
Within the Services occupations in Goodview, the most male-oriented occupations are Cleaning & Maintenance (85.7%), Food Preparation & Serving (63.7%), and Healthcare Support (25.3%), while the most female-oriented occupations are Personal Care & Service (100.0%), Healthcare Support (74.7%), and Food Preparation & Serving (36.3%).
| Occupation | Male | Female |
| Healthcare Support | 24 (25.3%) | 71 (74.7%) |
| Security & Protection | 0 (0.0%) | 0 (0.0%) |
| Firefighting & Prevention | 0 (0.0%) | 0 (0.0%) |
| Law Enforcement | 0 (0.0%) | 0 (0.0%) |
| Food Preparation & Serving | 65 (63.7%) | 37 (36.3%) |
| Cleaning & Maintenance | 42 (85.7%) | 7 (14.3%) |
| Personal Care & Service | 0 (0.0%) | 121 (100.0%) |
| Total (Category) | 131 (35.7%) | 236 (64.3%) |
| Total (Overall) | 1,255 (53.2%) | 1,106 (46.8%) |
Sales and Office Occupations
The most common Sales and Office occupations in Goodview are Sales & Related (231 | 9.8%), and Office & Administration (211 | 8.9%).
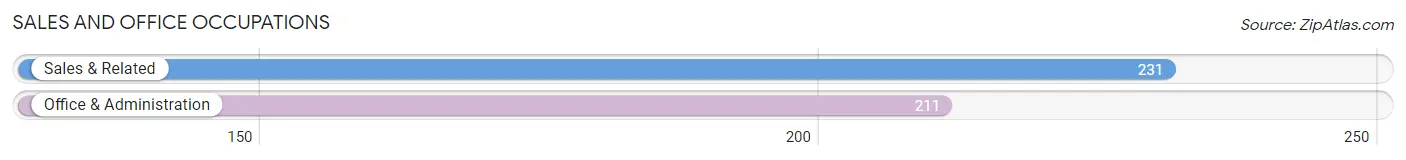
Sales and Office Occupations by Sex
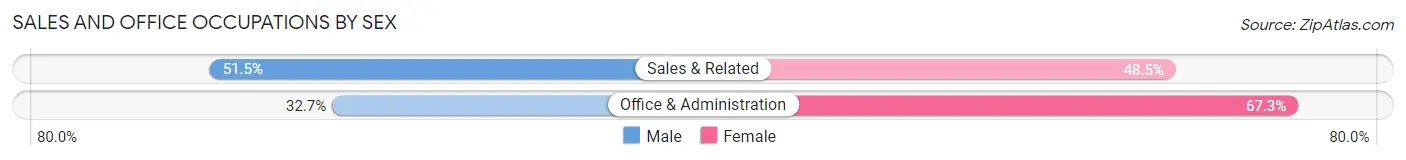
| Occupation | Male | Female |
| Sales & Related | 119 (51.5%) | 112 (48.5%) |
| Office & Administration | 69 (32.7%) | 142 (67.3%) |
| Total (Category) | 188 (42.5%) | 254 (57.5%) |
| Total (Overall) | 1,255 (53.2%) | 1,106 (46.8%) |
Natural Resources, Construction and Maintenance Occupations
The most common Natural Resources, Construction and Maintenance occupations in Goodview are Construction & Extraction (125 | 5.3%), Installation, Maintenance & Repair (46 | 1.9%), and Farming, Fishing & Forestry (21 | 0.9%).
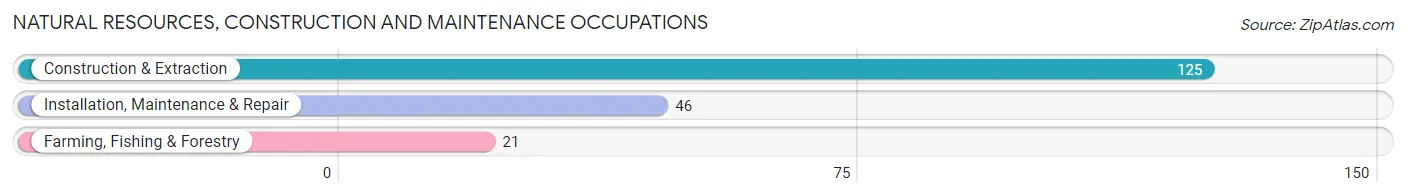
Natural Resources, Construction and Maintenance Occupations by Sex
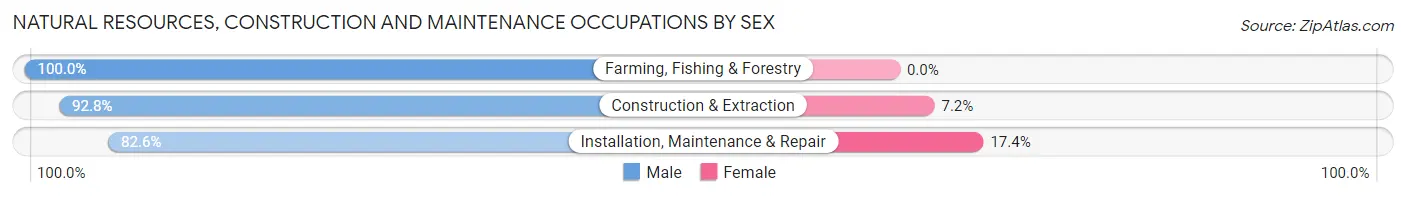
| Occupation | Male | Female |
| Farming, Fishing & Forestry | 21 (100.0%) | 0 (0.0%) |
| Construction & Extraction | 116 (92.8%) | 9 (7.2%) |
| Installation, Maintenance & Repair | 38 (82.6%) | 8 (17.4%) |
| Total (Category) | 175 (91.1%) | 17 (8.8%) |
| Total (Overall) | 1,255 (53.2%) | 1,106 (46.8%) |
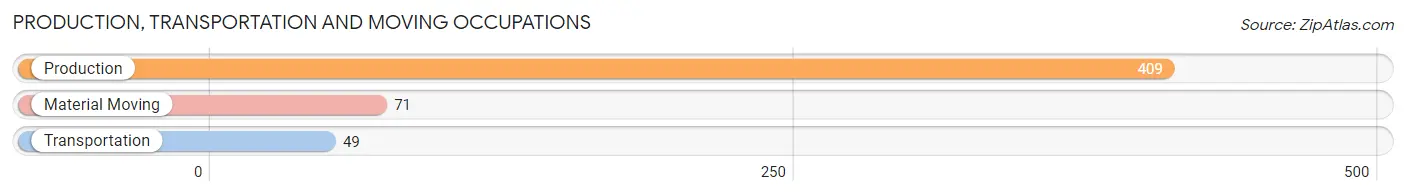
Production, Transportation and Moving Occupations
The most common Production, Transportation and Moving occupations in Goodview are Production (409 | 17.3%), Material Moving (71 | 3.0%), and Transportation (49 | 2.1%).
Production, Transportation and Moving Occupations by Sex
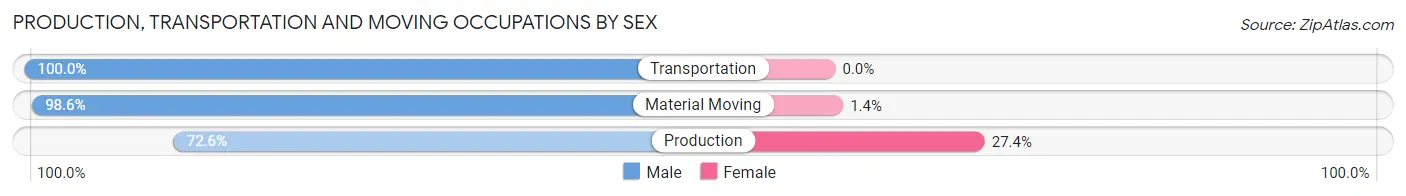
| Occupation | Male | Female |
| Production | 297 (72.6%) | 112 (27.4%) |
| Transportation | 49 (100.0%) | 0 (0.0%) |
| Material Moving | 70 (98.6%) | 1 (1.4%) |
| Total (Category) | 416 (78.6%) | 113 (21.4%) |
| Total (Overall) | 1,255 (53.2%) | 1,106 (46.8%) |
Employment Industries by Sex in Goodview
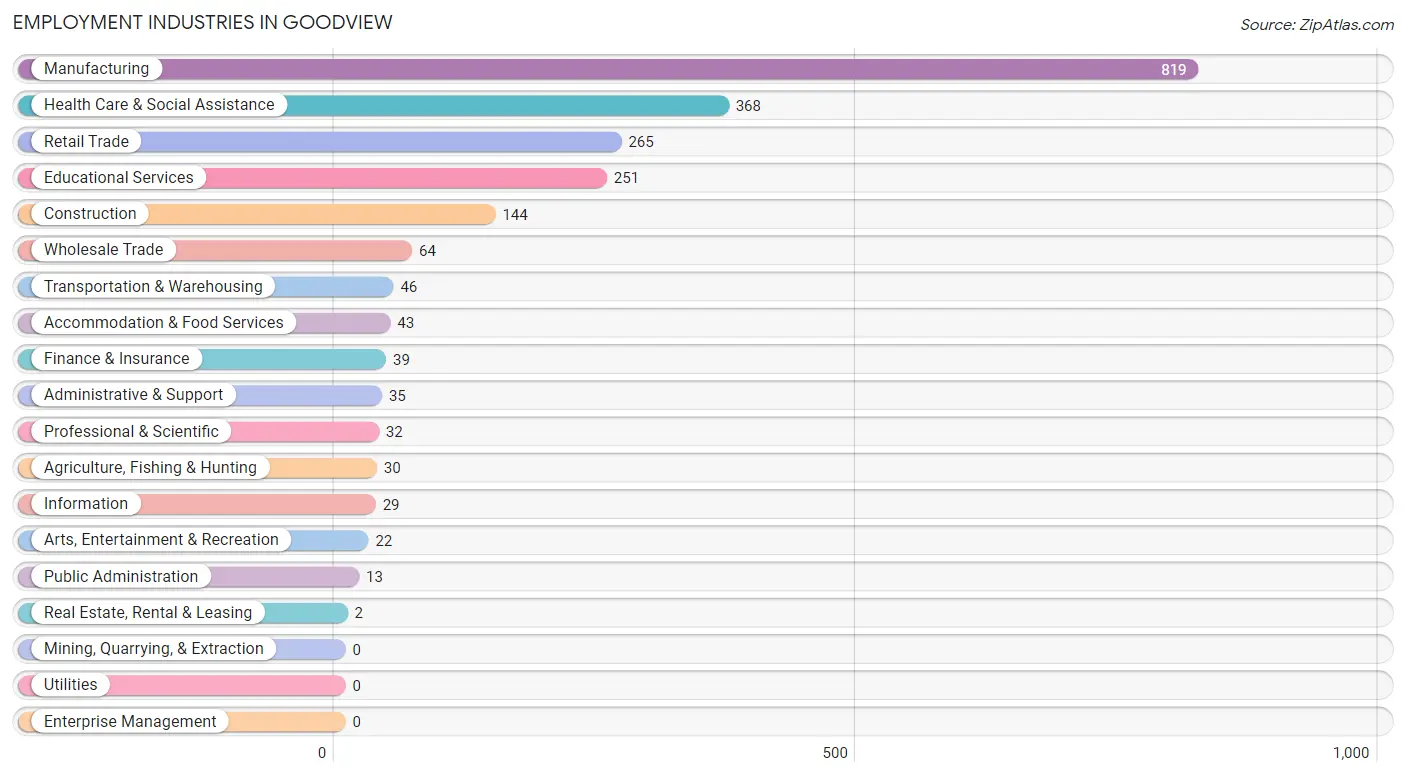
Employment Industries in Goodview
The major employment industries in Goodview include Manufacturing (819 | 34.7%), Health Care & Social Assistance (368 | 15.6%), Retail Trade (265 | 11.2%), Educational Services (251 | 10.6%), and Construction (144 | 6.1%).
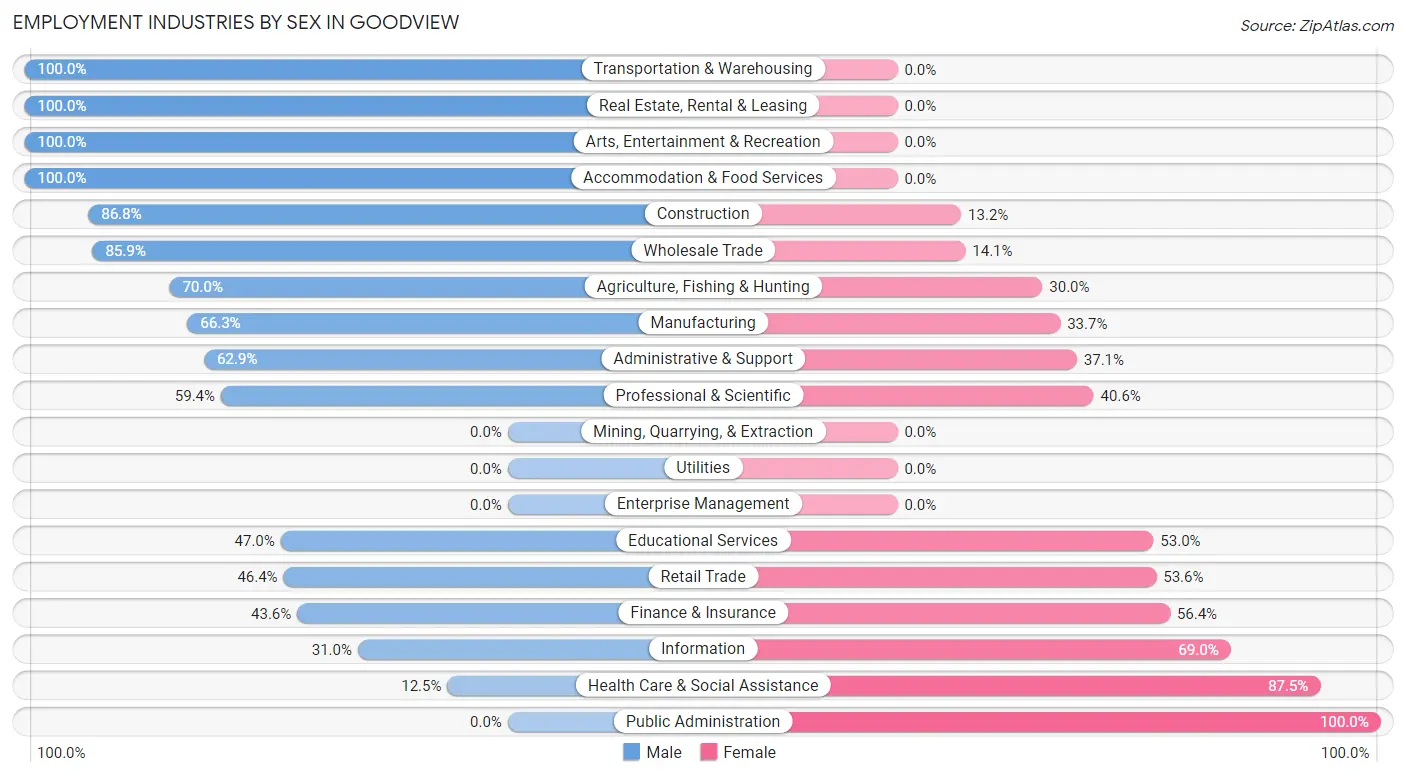
Employment Industries by Sex in Goodview
The Goodview industries that see more men than women are Transportation & Warehousing (100.0%), Real Estate, Rental & Leasing (100.0%), and Arts, Entertainment & Recreation (100.0%), whereas the industries that tend to have a higher number of women are Public Administration (100.0%), Health Care & Social Assistance (87.5%), and Information (69.0%).
| Industry | Male | Female |
| Agriculture, Fishing & Hunting | 21 (70.0%) | 9 (30.0%) |
| Mining, Quarrying, & Extraction | 0 (0.0%) | 0 (0.0%) |
| Construction | 125 (86.8%) | 19 (13.2%) |
| Manufacturing | 543 (66.3%) | 276 (33.7%) |
| Wholesale Trade | 55 (85.9%) | 9 (14.1%) |
| Retail Trade | 123 (46.4%) | 142 (53.6%) |
| Transportation & Warehousing | 46 (100.0%) | 0 (0.0%) |
| Utilities | 0 (0.0%) | 0 (0.0%) |
| Information | 9 (31.0%) | 20 (69.0%) |
| Finance & Insurance | 17 (43.6%) | 22 (56.4%) |
| Real Estate, Rental & Leasing | 2 (100.0%) | 0 (0.0%) |
| Professional & Scientific | 19 (59.4%) | 13 (40.6%) |
| Enterprise Management | 0 (0.0%) | 0 (0.0%) |
| Administrative & Support | 22 (62.9%) | 13 (37.1%) |
| Educational Services | 118 (47.0%) | 133 (53.0%) |
| Health Care & Social Assistance | 46 (12.5%) | 322 (87.5%) |
| Arts, Entertainment & Recreation | 22 (100.0%) | 0 (0.0%) |
| Accommodation & Food Services | 43 (100.0%) | 0 (0.0%) |
| Public Administration | 0 (0.0%) | 13 (100.0%) |
| Total | 1,255 (53.2%) | 1,106 (46.8%) |
Education in Goodview
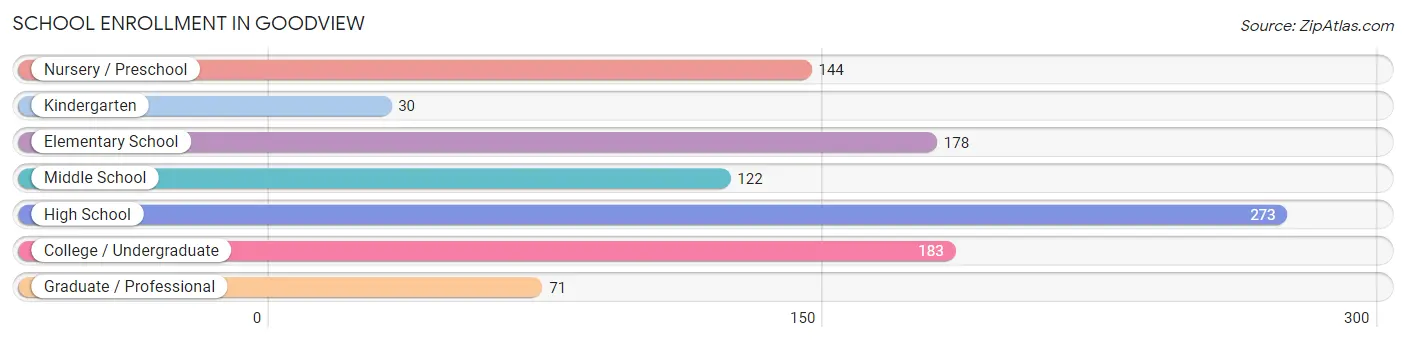
School Enrollment in Goodview
The most common levels of schooling among the 1,001 students in Goodview are high school (273 | 27.3%), college / undergraduate (183 | 18.3%), and elementary school (178 | 17.8%).
| School Level | # Students | % Students |
| Nursery / Preschool | 144 | 14.4% |
| Kindergarten | 30 | 3.0% |
| Elementary School | 178 | 17.8% |
| Middle School | 122 | 12.2% |
| High School | 273 | 27.3% |
| College / Undergraduate | 183 | 18.3% |
| Graduate / Professional | 71 | 7.1% |
| Total | 1,001 | 100.0% |
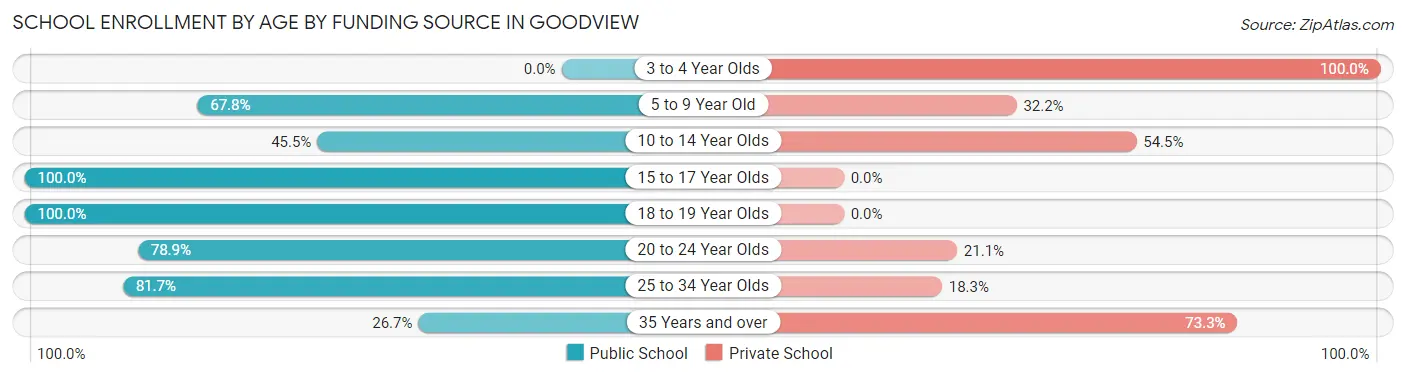
School Enrollment by Age by Funding Source in Goodview
Out of a total of 1,001 students who are enrolled in schools in Goodview, 356 (35.6%) attend a private institution, while the remaining 645 (64.4%) are enrolled in public schools. The age group of 3 to 4 year olds has the highest likelihood of being enrolled in private schools, with 81 (100.0% in the age bracket) enrolled. Conversely, the age group of 15 to 17 year olds has the lowest likelihood of being enrolled in a private school, with 94 (100.0% in the age bracket) attending a public institution.
| Age Bracket | Public School | Private School |
| 3 to 4 Year Olds | 0 (0.0%) | 81 (100.0%) |
| 5 to 9 Year Old | 177 (67.8%) | 84 (32.2%) |
| 10 to 14 Year Olds | 101 (45.5%) | 121 (54.5%) |
| 15 to 17 Year Olds | 94 (100.0%) | 0 (0.0%) |
| 18 to 19 Year Olds | 73 (100.0%) | 0 (0.0%) |
| 20 to 24 Year Olds | 116 (78.9%) | 31 (21.1%) |
| 25 to 34 Year Olds | 76 (81.7%) | 17 (18.3%) |
| 35 Years and over | 8 (26.7%) | 22 (73.3%) |
| Total | 645 (64.4%) | 356 (35.6%) |
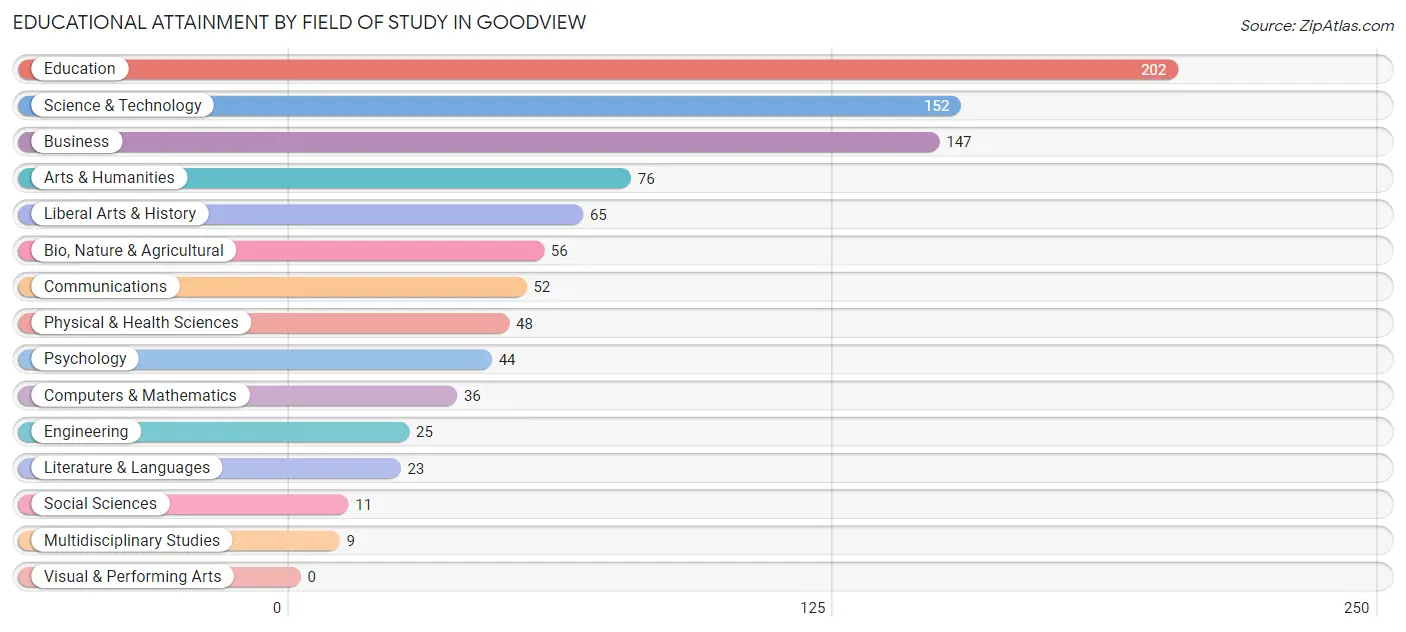
Educational Attainment by Field of Study in Goodview
Education (202 | 21.3%), science & technology (152 | 16.1%), business (147 | 15.5%), arts & humanities (76 | 8.0%), and liberal arts & history (65 | 6.9%) are the most common fields of study among 946 individuals in Goodview who have obtained a bachelor's degree or higher.
| Field of Study | # Graduates | % Graduates |
| Computers & Mathematics | 36 | 3.8% |
| Bio, Nature & Agricultural | 56 | 5.9% |
| Physical & Health Sciences | 48 | 5.1% |
| Psychology | 44 | 4.6% |
| Social Sciences | 11 | 1.2% |
| Engineering | 25 | 2.6% |
| Multidisciplinary Studies | 9 | 0.9% |
| Science & Technology | 152 | 16.1% |
| Business | 147 | 15.5% |
| Education | 202 | 21.3% |
| Literature & Languages | 23 | 2.4% |
| Liberal Arts & History | 65 | 6.9% |
| Visual & Performing Arts | 0 | 0.0% |
| Communications | 52 | 5.5% |
| Arts & Humanities | 76 | 8.0% |
| Total | 946 | 100.0% |
Transportation & Commute in Goodview
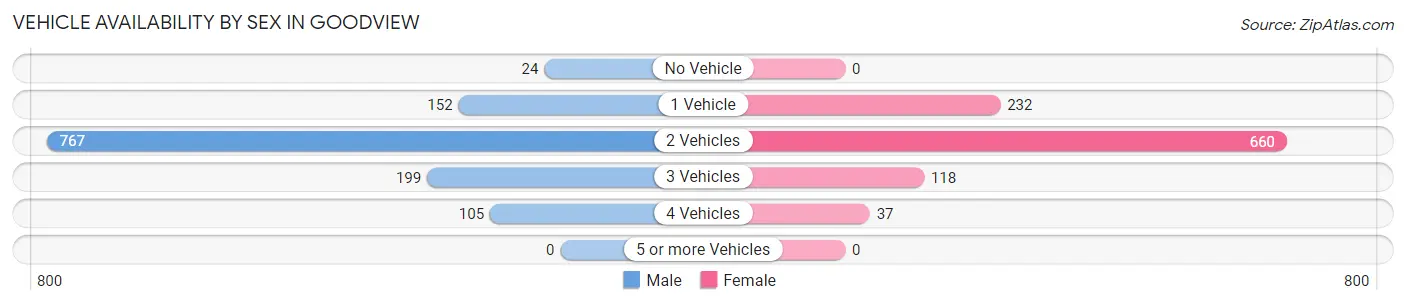
Vehicle Availability by Sex in Goodview
The most prevalent vehicle ownership categories in Goodview are males with 2 vehicles (767, accounting for 61.5%) and females with 2 vehicles (660, making up 73.3%).
| Vehicles Available | Male | Female |
| No Vehicle | 24 (1.9%) | 0 (0.0%) |
| 1 Vehicle | 152 (12.2%) | 232 (22.2%) |
| 2 Vehicles | 767 (61.5%) | 660 (63.0%) |
| 3 Vehicles | 199 (16.0%) | 118 (11.3%) |
| 4 Vehicles | 105 (8.4%) | 37 (3.5%) |
| 5 or more Vehicles | 0 (0.0%) | 0 (0.0%) |
| Total | 1,247 (100.0%) | 1,047 (100.0%) |
Commute Time in Goodview
The most frequently occuring commute durations in Goodview are 10 to 14 minutes (716 commuters, 32.4%), 5 to 9 minutes (451 commuters, 20.4%), and 15 to 19 minutes (431 commuters, 19.5%).
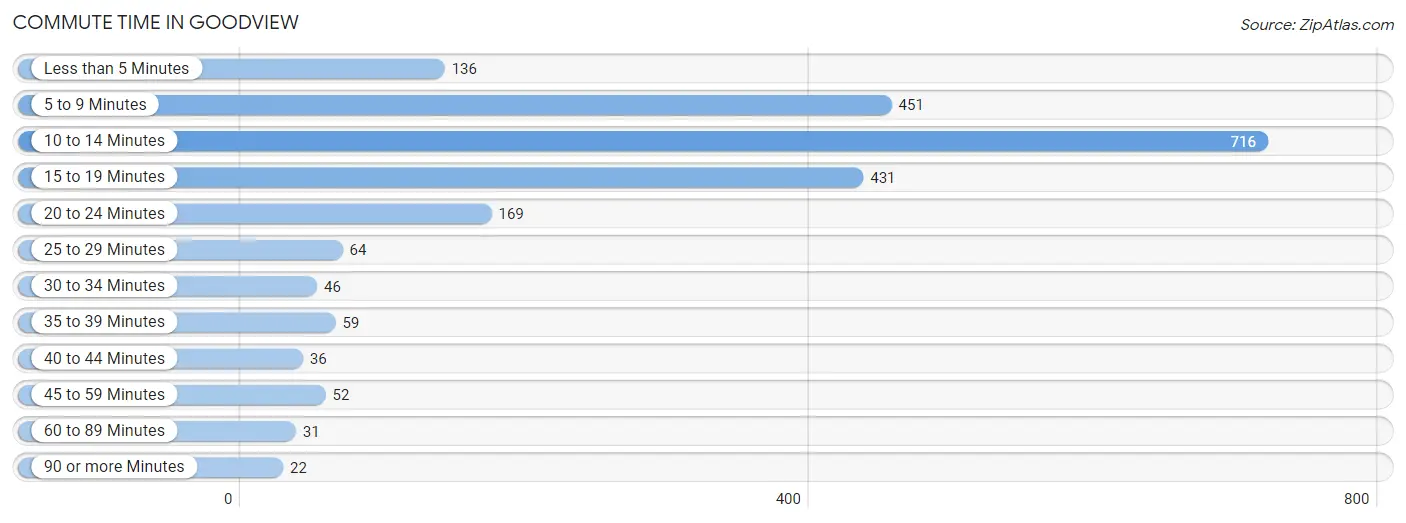
| Commute Time | # Commuters | % Commuters |
| Less than 5 Minutes | 136 | 6.1% |
| 5 to 9 Minutes | 451 | 20.4% |
| 10 to 14 Minutes | 716 | 32.4% |
| 15 to 19 Minutes | 431 | 19.5% |
| 20 to 24 Minutes | 169 | 7.6% |
| 25 to 29 Minutes | 64 | 2.9% |
| 30 to 34 Minutes | 46 | 2.1% |
| 35 to 39 Minutes | 59 | 2.7% |
| 40 to 44 Minutes | 36 | 1.6% |
| 45 to 59 Minutes | 52 | 2.4% |
| 60 to 89 Minutes | 31 | 1.4% |
| 90 or more Minutes | 22 | 1.0% |
Commute Time by Sex in Goodview
The most common commute times in Goodview are 10 to 14 minutes (332 commuters, 27.3%) for males and 10 to 14 minutes (384 commuters, 38.5%) for females.
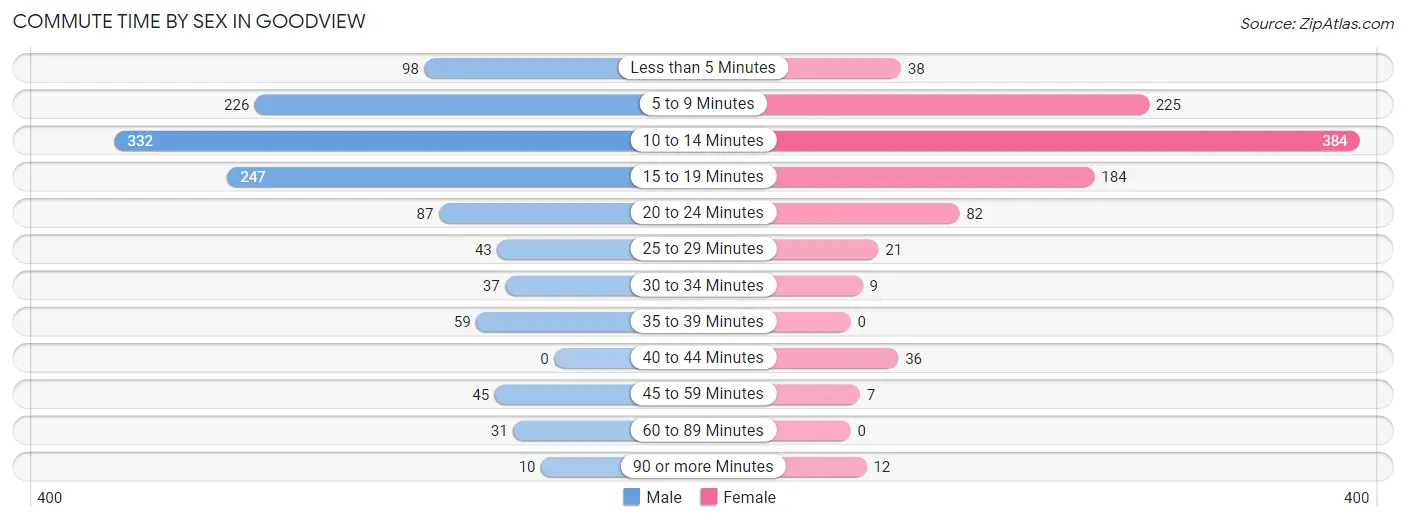
| Commute Time | Male | Female |
| Less than 5 Minutes | 98 (8.1%) | 38 (3.8%) |
| 5 to 9 Minutes | 226 (18.6%) | 225 (22.6%) |
| 10 to 14 Minutes | 332 (27.3%) | 384 (38.5%) |
| 15 to 19 Minutes | 247 (20.3%) | 184 (18.4%) |
| 20 to 24 Minutes | 87 (7.2%) | 82 (8.2%) |
| 25 to 29 Minutes | 43 (3.5%) | 21 (2.1%) |
| 30 to 34 Minutes | 37 (3.0%) | 9 (0.9%) |
| 35 to 39 Minutes | 59 (4.9%) | 0 (0.0%) |
| 40 to 44 Minutes | 0 (0.0%) | 36 (3.6%) |
| 45 to 59 Minutes | 45 (3.7%) | 7 (0.7%) |
| 60 to 89 Minutes | 31 (2.5%) | 0 (0.0%) |
| 90 or more Minutes | 10 (0.8%) | 12 (1.2%) |
Time of Departure to Work by Sex in Goodview
The most frequent times of departure to work in Goodview are 12:00 PM to 3:59 PM (231, 19.0%) for males and 7:00 AM to 7:29 AM (241, 24.1%) for females.
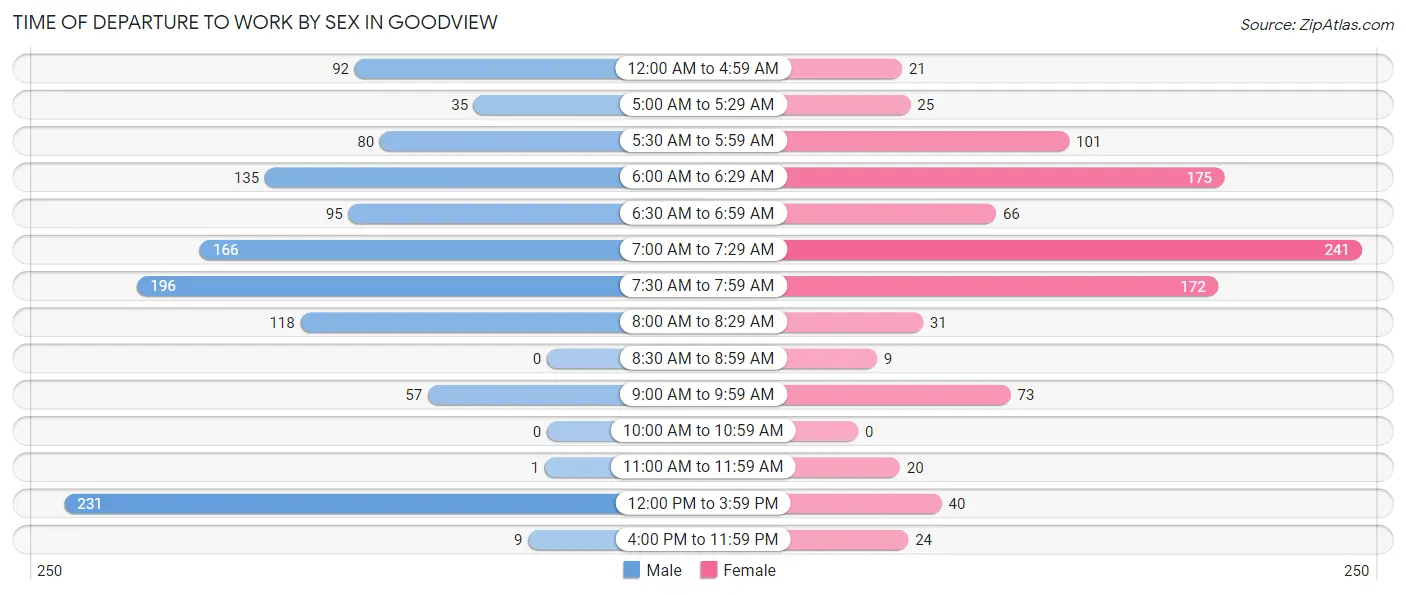
| Time of Departure | Male | Female |
| 12:00 AM to 4:59 AM | 92 (7.6%) | 21 (2.1%) |
| 5:00 AM to 5:29 AM | 35 (2.9%) | 25 (2.5%) |
| 5:30 AM to 5:59 AM | 80 (6.6%) | 101 (10.1%) |
| 6:00 AM to 6:29 AM | 135 (11.1%) | 175 (17.5%) |
| 6:30 AM to 6:59 AM | 95 (7.8%) | 66 (6.6%) |
| 7:00 AM to 7:29 AM | 166 (13.7%) | 241 (24.1%) |
| 7:30 AM to 7:59 AM | 196 (16.1%) | 172 (17.2%) |
| 8:00 AM to 8:29 AM | 118 (9.7%) | 31 (3.1%) |
| 8:30 AM to 8:59 AM | 0 (0.0%) | 9 (0.9%) |
| 9:00 AM to 9:59 AM | 57 (4.7%) | 73 (7.3%) |
| 10:00 AM to 10:59 AM | 0 (0.0%) | 0 (0.0%) |
| 11:00 AM to 11:59 AM | 1 (0.1%) | 20 (2.0%) |
| 12:00 PM to 3:59 PM | 231 (19.0%) | 40 (4.0%) |
| 4:00 PM to 11:59 PM | 9 (0.7%) | 24 (2.4%) |
| Total | 1,215 (100.0%) | 998 (100.0%) |
Housing Occupancy in Goodview
Occupancy by Ownership in Goodview
Of the total 1,915 dwellings in Goodview, owner-occupied units account for 1,193 (62.3%), while renter-occupied units make up 722 (37.7%).
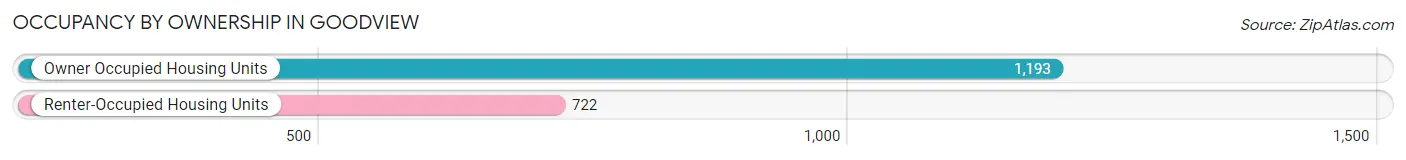
| Occupancy | # Housing Units | % Housing Units |
| Owner Occupied Housing Units | 1,193 | 62.3% |
| Renter-Occupied Housing Units | 722 | 37.7% |
| Total Occupied Housing Units | 1,915 | 100.0% |
Occupancy by Household Size in Goodview
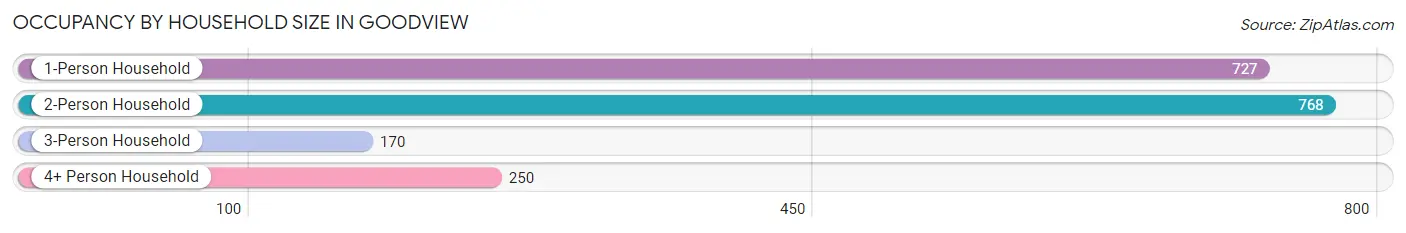
| Household Size | # Housing Units | % Housing Units |
| 1-Person Household | 727 | 38.0% |
| 2-Person Household | 768 | 40.1% |
| 3-Person Household | 170 | 8.9% |
| 4+ Person Household | 250 | 13.1% |
| Total Housing Units | 1,915 | 100.0% |
Occupancy by Ownership by Household Size in Goodview
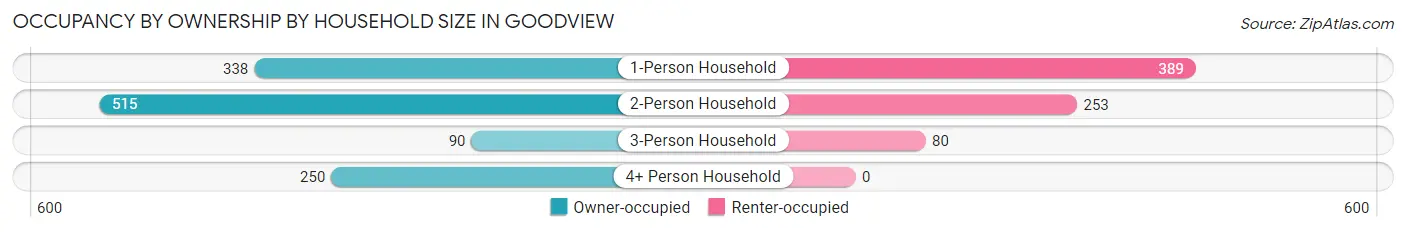
| Household Size | Owner-occupied | Renter-occupied |
| 1-Person Household | 338 (46.5%) | 389 (53.5%) |
| 2-Person Household | 515 (67.1%) | 253 (32.9%) |
| 3-Person Household | 90 (52.9%) | 80 (47.1%) |
| 4+ Person Household | 250 (100.0%) | 0 (0.0%) |
| Total Housing Units | 1,193 (62.3%) | 722 (37.7%) |
Occupancy by Educational Attainment in Goodview
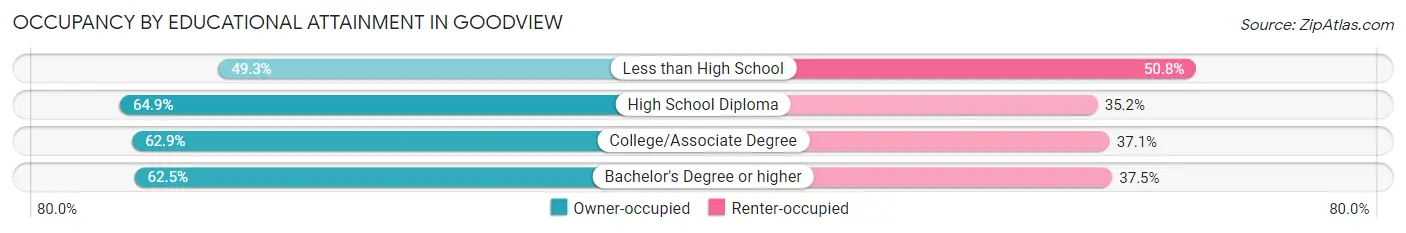
| Household Size | Owner-occupied | Renter-occupied |
| Less than High School | 66 (49.2%) | 68 (50.7%) |
| High School Diploma | 286 (64.8%) | 155 (35.1%) |
| College/Associate Degree | 472 (62.9%) | 278 (37.1%) |
| Bachelor's Degree or higher | 369 (62.5%) | 221 (37.5%) |
Occupancy by Age of Householder in Goodview
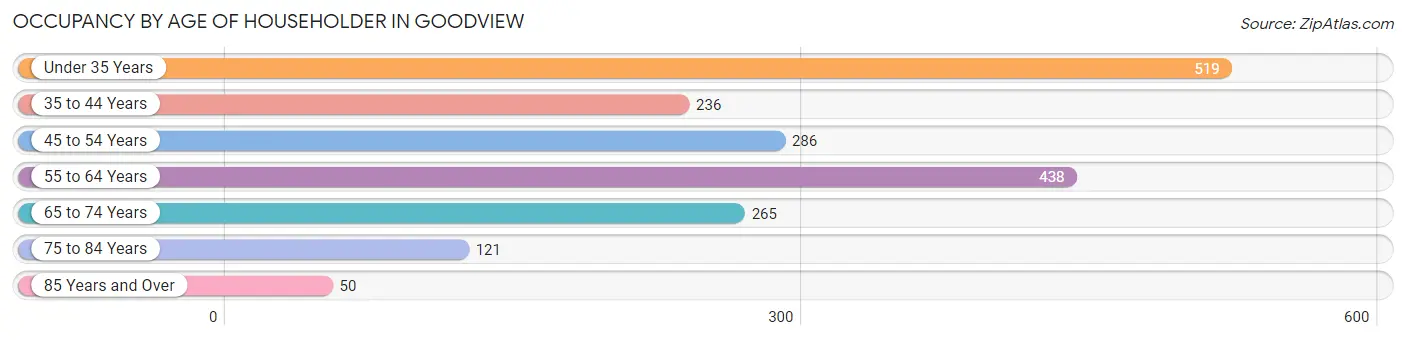
| Age Bracket | # Households | % Households |
| Under 35 Years | 519 | 27.1% |
| 35 to 44 Years | 236 | 12.3% |
| 45 to 54 Years | 286 | 14.9% |
| 55 to 64 Years | 438 | 22.9% |
| 65 to 74 Years | 265 | 13.8% |
| 75 to 84 Years | 121 | 6.3% |
| 85 Years and Over | 50 | 2.6% |
| Total | 1,915 | 100.0% |
Housing Finances in Goodview
Median Income by Occupancy in Goodview
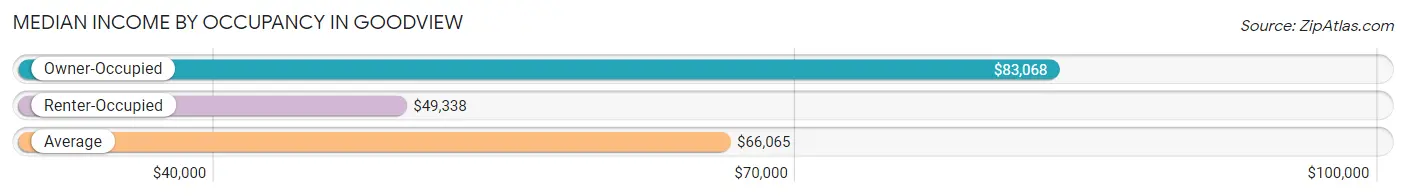
| Occupancy Type | # Households | Median Income |
| Owner-Occupied | 1,193 (62.3%) | $83,068 |
| Renter-Occupied | 722 (37.7%) | $49,338 |
| Average | 1,915 (100.0%) | $66,065 |
Occupancy by Householder Income Bracket in Goodview
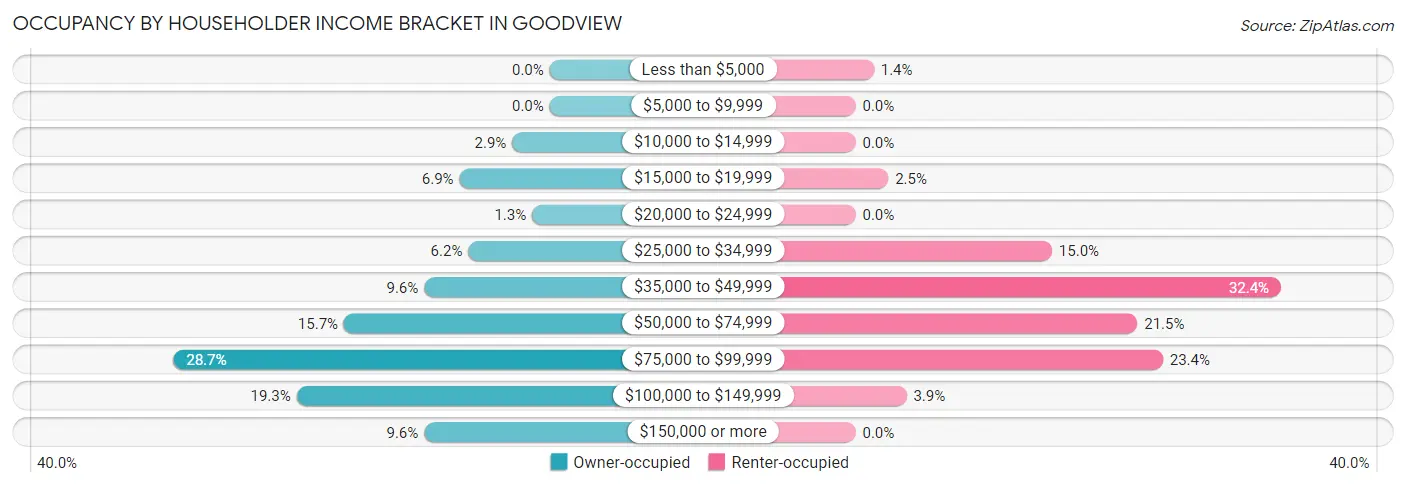
| Income Bracket | Owner-occupied | Renter-occupied |
| Less than $5,000 | 0 (0.0%) | 10 (1.4%) |
| $5,000 to $9,999 | 0 (0.0%) | 0 (0.0%) |
| $10,000 to $14,999 | 34 (2.9%) | 0 (0.0%) |
| $15,000 to $19,999 | 82 (6.9%) | 18 (2.5%) |
| $20,000 to $24,999 | 16 (1.3%) | 0 (0.0%) |
| $25,000 to $34,999 | 74 (6.2%) | 108 (15.0%) |
| $35,000 to $49,999 | 114 (9.6%) | 234 (32.4%) |
| $50,000 to $74,999 | 187 (15.7%) | 155 (21.5%) |
| $75,000 to $99,999 | 342 (28.7%) | 169 (23.4%) |
| $100,000 to $149,999 | 230 (19.3%) | 28 (3.9%) |
| $150,000 or more | 114 (9.6%) | 0 (0.0%) |
| Total | 1,193 (100.0%) | 722 (100.0%) |
Monthly Housing Cost Tiers in Goodview
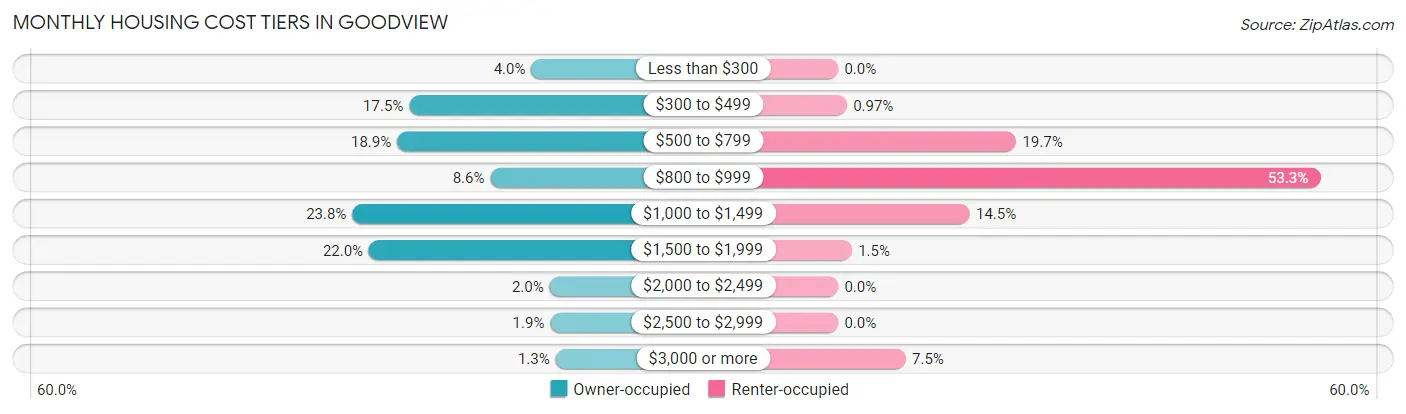
| Monthly Cost | Owner-occupied | Renter-occupied |
| Less than $300 | 48 (4.0%) | 0 (0.0%) |
| $300 to $499 | 209 (17.5%) | 7 (1.0%) |
| $500 to $799 | 225 (18.9%) | 142 (19.7%) |
| $800 to $999 | 102 (8.6%) | 385 (53.3%) |
| $1,000 to $1,499 | 284 (23.8%) | 105 (14.5%) |
| $1,500 to $1,999 | 262 (22.0%) | 11 (1.5%) |
| $2,000 to $2,499 | 24 (2.0%) | 0 (0.0%) |
| $2,500 to $2,999 | 23 (1.9%) | 0 (0.0%) |
| $3,000 or more | 16 (1.3%) | 54 (7.5%) |
| Total | 1,193 (100.0%) | 722 (100.0%) |
Physical Housing Characteristics in Goodview
Housing Structures in Goodview
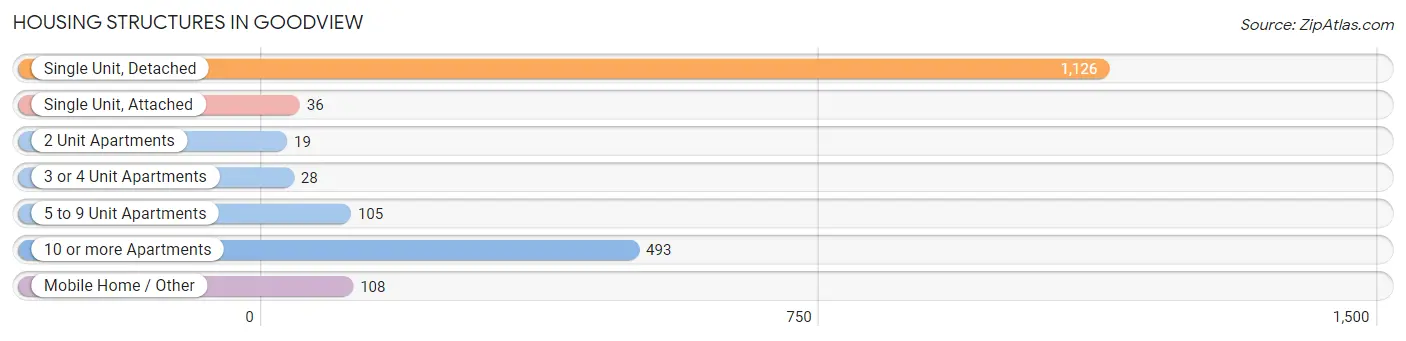
| Structure Type | # Housing Units | % Housing Units |
| Single Unit, Detached | 1,126 | 58.8% |
| Single Unit, Attached | 36 | 1.9% |
| 2 Unit Apartments | 19 | 1.0% |
| 3 or 4 Unit Apartments | 28 | 1.5% |
| 5 to 9 Unit Apartments | 105 | 5.5% |
| 10 or more Apartments | 493 | 25.7% |
| Mobile Home / Other | 108 | 5.6% |
| Total | 1,915 | 100.0% |
Housing Structures by Occupancy in Goodview
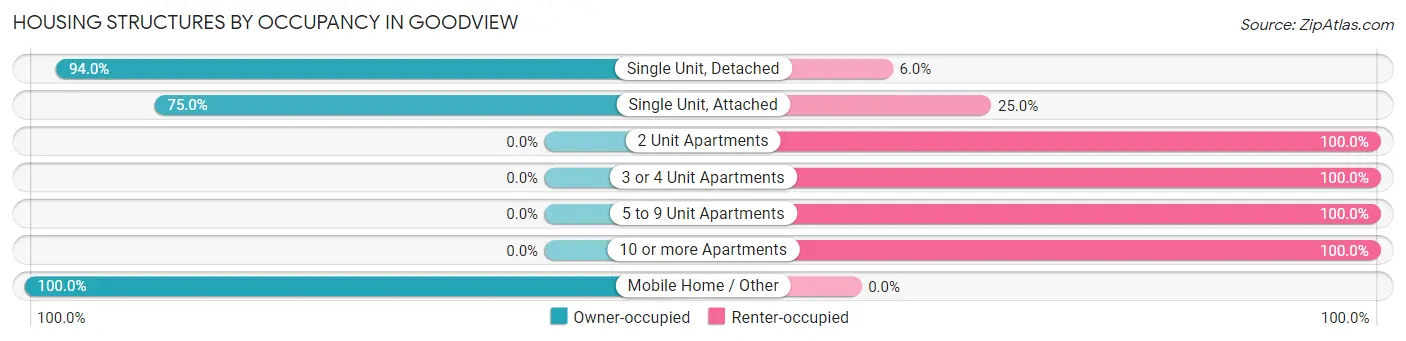
| Structure Type | Owner-occupied | Renter-occupied |
| Single Unit, Detached | 1,058 (94.0%) | 68 (6.0%) |
| Single Unit, Attached | 27 (75.0%) | 9 (25.0%) |
| 2 Unit Apartments | 0 (0.0%) | 19 (100.0%) |
| 3 or 4 Unit Apartments | 0 (0.0%) | 28 (100.0%) |
| 5 to 9 Unit Apartments | 0 (0.0%) | 105 (100.0%) |
| 10 or more Apartments | 0 (0.0%) | 493 (100.0%) |
| Mobile Home / Other | 108 (100.0%) | 0 (0.0%) |
| Total | 1,193 (62.3%) | 722 (37.7%) |
Housing Structures by Number of Rooms in Goodview
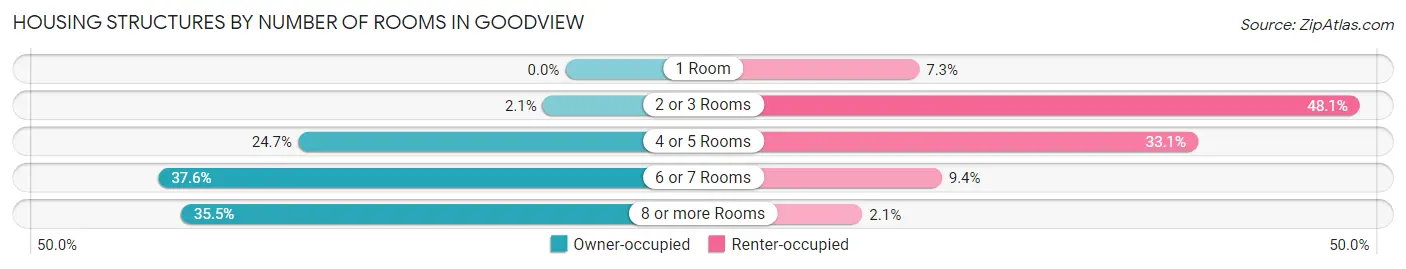
| Number of Rooms | Owner-occupied | Renter-occupied |
| 1 Room | 0 (0.0%) | 53 (7.3%) |
| 2 or 3 Rooms | 25 (2.1%) | 347 (48.1%) |
| 4 or 5 Rooms | 295 (24.7%) | 239 (33.1%) |
| 6 or 7 Rooms | 449 (37.6%) | 68 (9.4%) |
| 8 or more Rooms | 424 (35.5%) | 15 (2.1%) |
| Total | 1,193 (100.0%) | 722 (100.0%) |
Housing Structure by Heating Type in Goodview
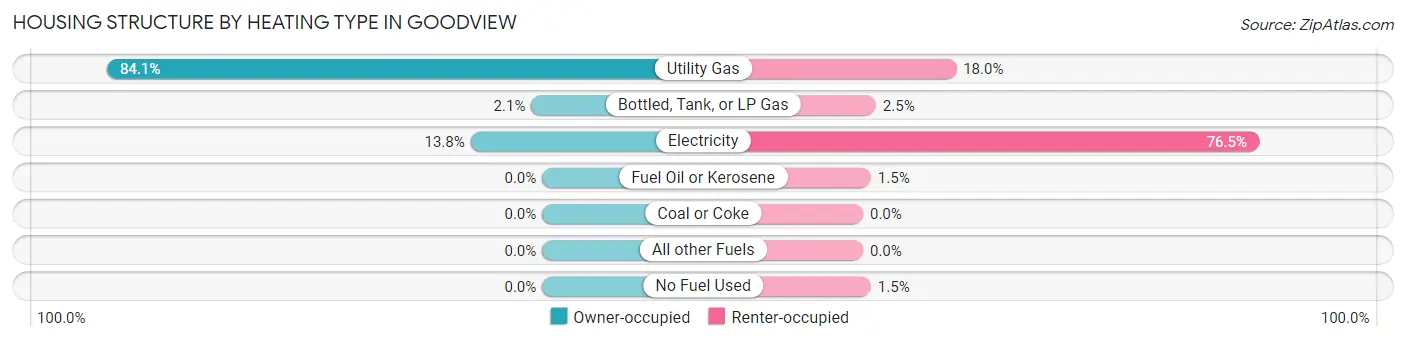
| Heating Type | Owner-occupied | Renter-occupied |
| Utility Gas | 1,003 (84.1%) | 130 (18.0%) |
| Bottled, Tank, or LP Gas | 25 (2.1%) | 18 (2.5%) |
| Electricity | 165 (13.8%) | 552 (76.4%) |
| Fuel Oil or Kerosene | 0 (0.0%) | 11 (1.5%) |
| Coal or Coke | 0 (0.0%) | 0 (0.0%) |
| All other Fuels | 0 (0.0%) | 0 (0.0%) |
| No Fuel Used | 0 (0.0%) | 11 (1.5%) |
| Total | 1,193 (100.0%) | 722 (100.0%) |
Household Vehicle Usage in Goodview
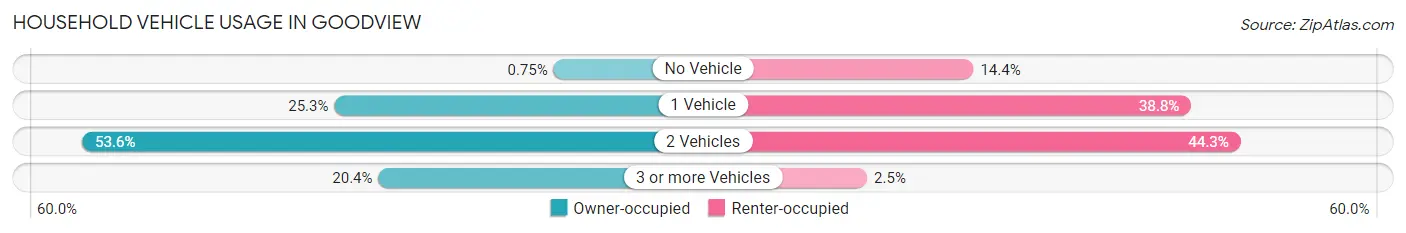
| Vehicles per Household | Owner-occupied | Renter-occupied |
| No Vehicle | 9 (0.7%) | 104 (14.4%) |
| 1 Vehicle | 302 (25.3%) | 280 (38.8%) |
| 2 Vehicles | 639 (53.6%) | 320 (44.3%) |
| 3 or more Vehicles | 243 (20.4%) | 18 (2.5%) |
| Total | 1,193 (100.0%) | 722 (100.0%) |
Real Estate & Mortgages in Goodview
Real Estate and Mortgage Overview in Goodview
| Characteristic | Without Mortgage | With Mortgage |
| Housing Units | 455 | 738 |
| Median Property Value | $143,800 | $210,800 |
| Median Household Income | $69,531 | $79 |
| Monthly Housing Costs | $483 | $16 |
| Real Estate Taxes | $1,515 | $12 |
Property Value by Mortgage Status in Goodview
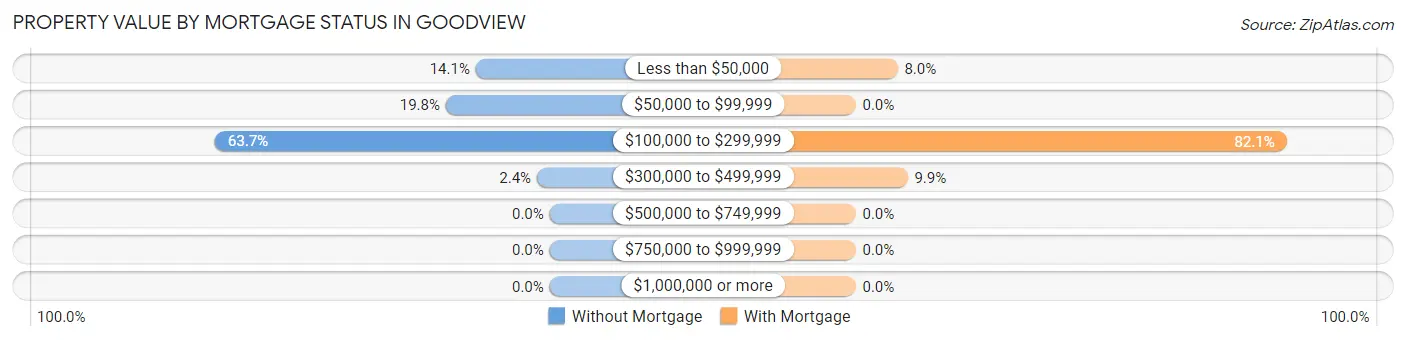
| Property Value | Without Mortgage | With Mortgage |
| Less than $50,000 | 64 (14.1%) | 59 (8.0%) |
| $50,000 to $99,999 | 90 (19.8%) | 0 (0.0%) |
| $100,000 to $299,999 | 290 (63.7%) | 606 (82.1%) |
| $300,000 to $499,999 | 11 (2.4%) | 73 (9.9%) |
| $500,000 to $749,999 | 0 (0.0%) | 0 (0.0%) |
| $750,000 to $999,999 | 0 (0.0%) | 0 (0.0%) |
| $1,000,000 or more | 0 (0.0%) | 0 (0.0%) |
| Total | 455 (100.0%) | 738 (100.0%) |
Household Income by Mortgage Status in Goodview
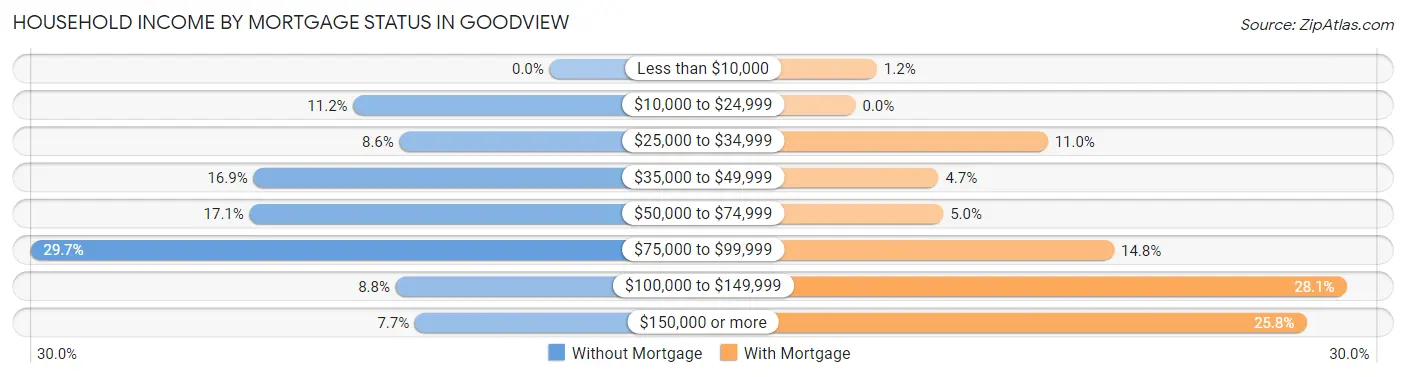
| Household Income | Without Mortgage | With Mortgage |
| Less than $10,000 | 0 (0.0%) | 9 (1.2%) |
| $10,000 to $24,999 | 51 (11.2%) | 0 (0.0%) |
| $25,000 to $34,999 | 39 (8.6%) | 81 (11.0%) |
| $35,000 to $49,999 | 77 (16.9%) | 35 (4.7%) |
| $50,000 to $74,999 | 78 (17.1%) | 37 (5.0%) |
| $75,000 to $99,999 | 135 (29.7%) | 109 (14.8%) |
| $100,000 to $149,999 | 40 (8.8%) | 207 (28.1%) |
| $150,000 or more | 35 (7.7%) | 190 (25.8%) |
| Total | 455 (100.0%) | 738 (100.0%) |
Property Value to Household Income Ratio in Goodview
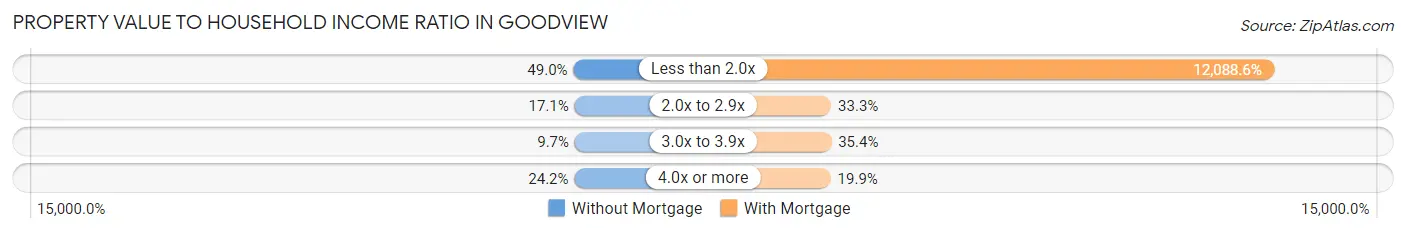
| Value-to-Income Ratio | Without Mortgage | With Mortgage |
| Less than 2.0x | 223 (49.0%) | 89,214 (12,088.6%) |
| 2.0x to 2.9x | 78 (17.1%) | 246 (33.3%) |
| 3.0x to 3.9x | 44 (9.7%) | 261 (35.4%) |
| 4.0x or more | 110 (24.2%) | 147 (19.9%) |
| Total | 455 (100.0%) | 738 (100.0%) |
Real Estate Taxes by Mortgage Status in Goodview
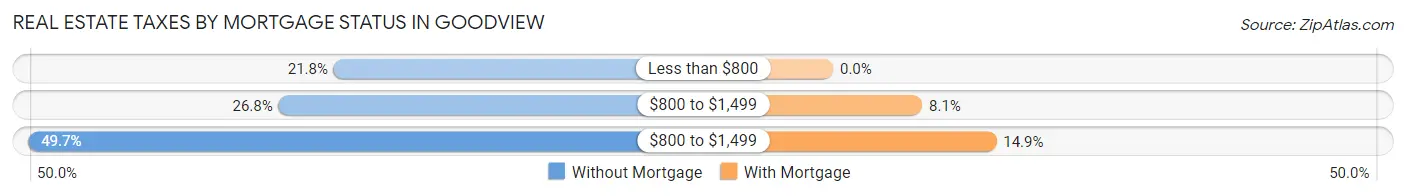
| Property Taxes | Without Mortgage | With Mortgage |
| Less than $800 | 99 (21.8%) | 0 (0.0%) |
| $800 to $1,499 | 122 (26.8%) | 60 (8.1%) |
| $800 to $1,499 | 226 (49.7%) | 110 (14.9%) |
| Total | 455 (100.0%) | 738 (100.0%) |
Health & Disability in Goodview
Health Insurance Coverage by Age in Goodview
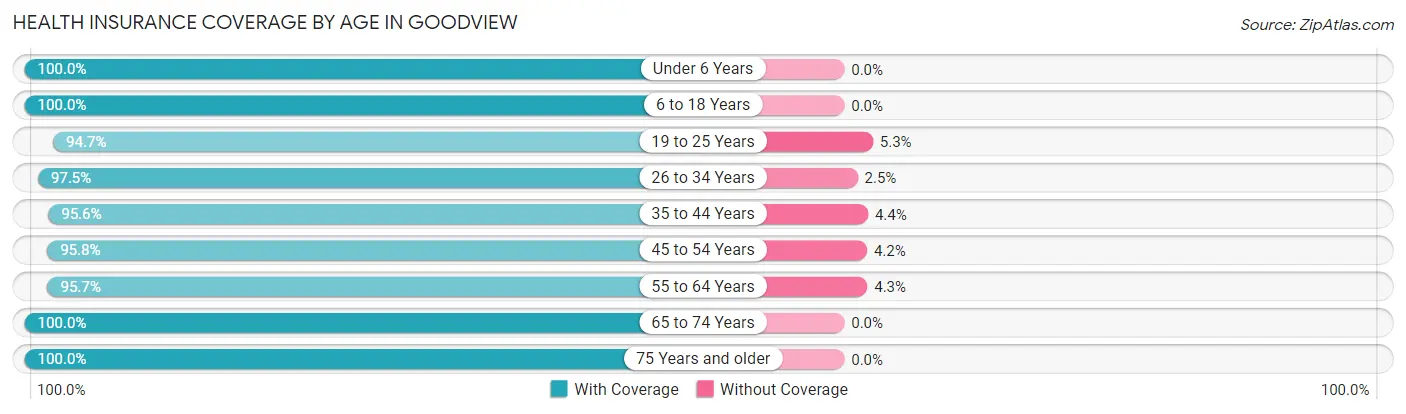
| Age Bracket | With Coverage | Without Coverage |
| Under 6 Years | 302 (100.0%) | 0 (0.0%) |
| 6 to 18 Years | 548 (100.0%) | 0 (0.0%) |
| 19 to 25 Years | 497 (94.7%) | 28 (5.3%) |
| 26 to 34 Years | 591 (97.5%) | 15 (2.5%) |
| 35 to 44 Years | 324 (95.6%) | 15 (4.4%) |
| 45 to 54 Years | 453 (95.8%) | 20 (4.2%) |
| 55 to 64 Years | 624 (95.7%) | 28 (4.3%) |
| 65 to 74 Years | 427 (100.0%) | 0 (0.0%) |
| 75 Years and older | 237 (100.0%) | 0 (0.0%) |
| Total | 4,003 (97.4%) | 106 (2.6%) |
Health Insurance Coverage by Citizenship Status in Goodview
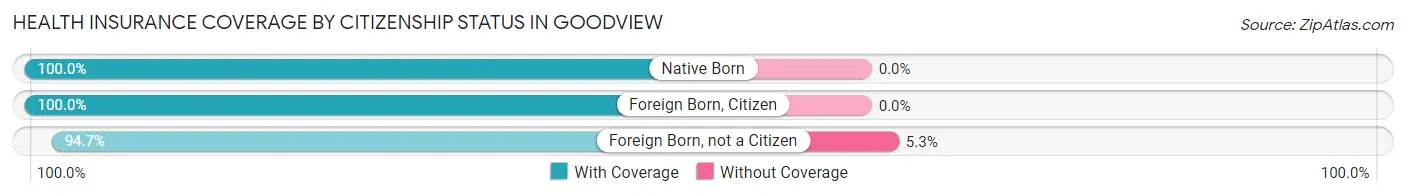
| Citizenship Status | With Coverage | Without Coverage |
| Native Born | 302 (100.0%) | 0 (0.0%) |
| Foreign Born, Citizen | 548 (100.0%) | 0 (0.0%) |
| Foreign Born, not a Citizen | 497 (94.7%) | 28 (5.3%) |
Health Insurance Coverage by Household Income in Goodview
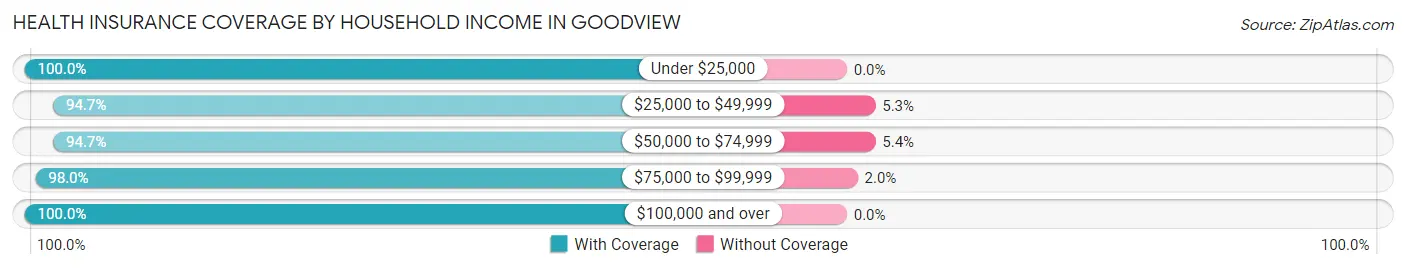
| Household Income | With Coverage | Without Coverage |
| Under $25,000 | 169 (100.0%) | 0 (0.0%) |
| $25,000 to $49,999 | 762 (94.7%) | 43 (5.3%) |
| $50,000 to $74,999 | 619 (94.7%) | 35 (5.3%) |
| $75,000 to $99,999 | 1,360 (98.0%) | 28 (2.0%) |
| $100,000 and over | 1,077 (100.0%) | 0 (0.0%) |
Public vs Private Health Insurance Coverage by Age in Goodview
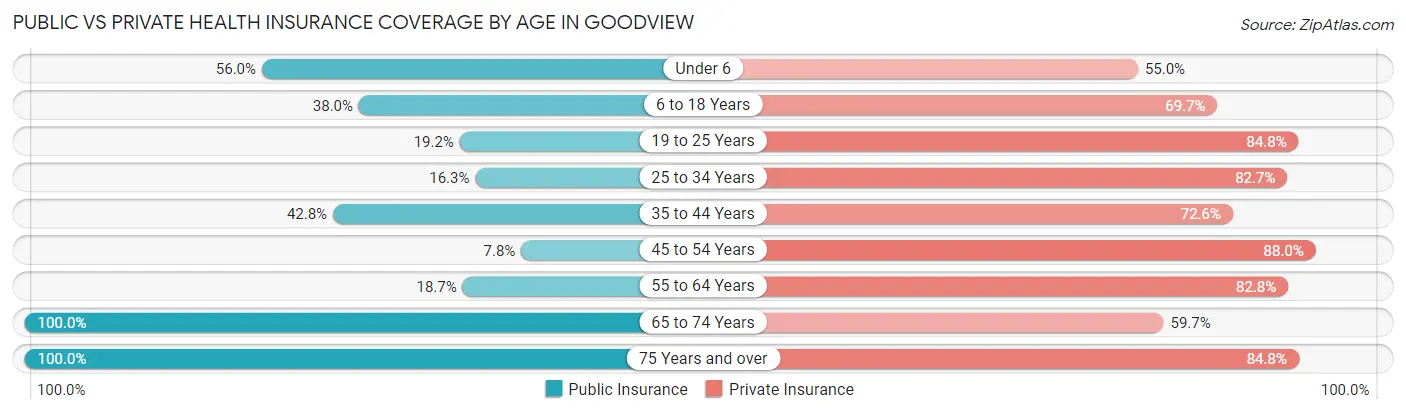
| Age Bracket | Public Insurance | Private Insurance |
| Under 6 | 169 (56.0%) | 166 (55.0%) |
| 6 to 18 Years | 208 (38.0%) | 382 (69.7%) |
| 19 to 25 Years | 101 (19.2%) | 445 (84.8%) |
| 25 to 34 Years | 99 (16.3%) | 501 (82.7%) |
| 35 to 44 Years | 145 (42.8%) | 246 (72.6%) |
| 45 to 54 Years | 37 (7.8%) | 416 (87.9%) |
| 55 to 64 Years | 122 (18.7%) | 540 (82.8%) |
| 65 to 74 Years | 427 (100.0%) | 255 (59.7%) |
| 75 Years and over | 237 (100.0%) | 201 (84.8%) |
| Total | 1,545 (37.6%) | 3,152 (76.7%) |
Disability Status by Sex by Age in Goodview
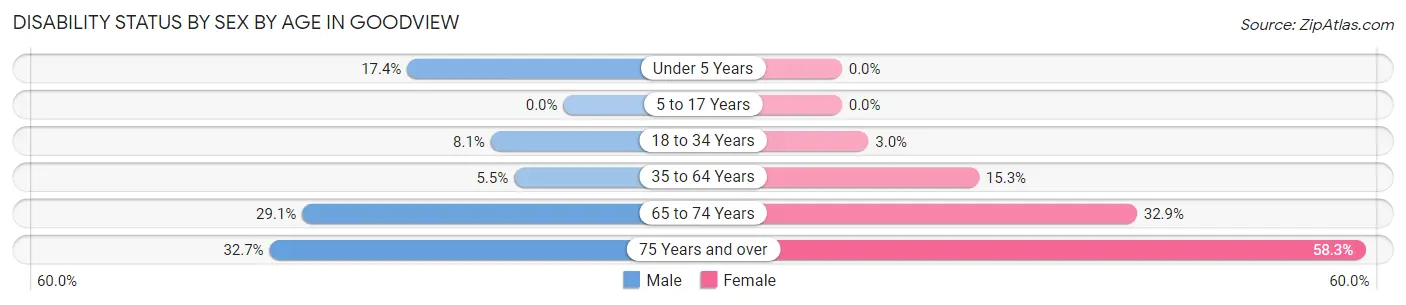
| Age Bracket | Male | Female |
| Under 5 Years | 12 (17.4%) | 0 (0.0%) |
| 5 to 17 Years | 0 (0.0%) | 0 (0.0%) |
| 18 to 34 Years | 55 (8.1%) | 15 (3.0%) |
| 35 to 64 Years | 39 (5.5%) | 115 (15.3%) |
| 65 to 74 Years | 64 (29.1%) | 68 (32.9%) |
| 75 Years and over | 36 (32.7%) | 74 (58.3%) |
Disability Class by Sex by Age in Goodview
Disability Class: Hearing Difficulty
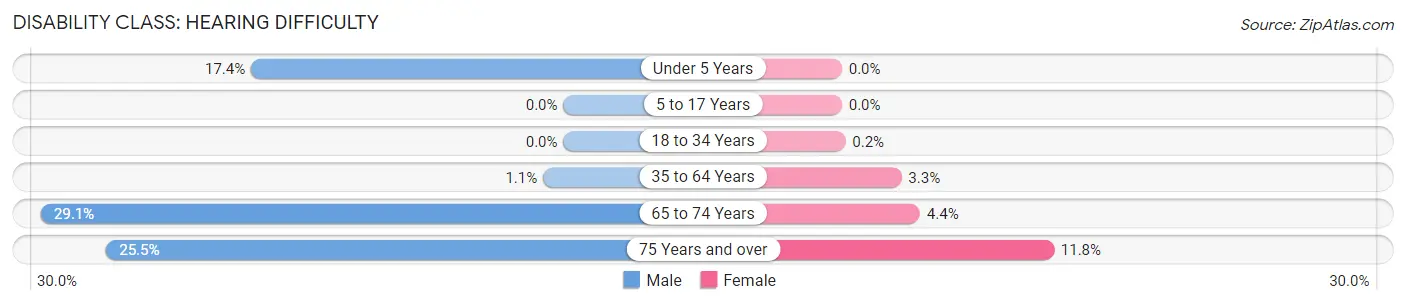
| Age Bracket | Male | Female |
| Under 5 Years | 12 (17.4%) | 0 (0.0%) |
| 5 to 17 Years | 0 (0.0%) | 0 (0.0%) |
| 18 to 34 Years | 0 (0.0%) | 1 (0.2%) |
| 35 to 64 Years | 8 (1.1%) | 25 (3.3%) |
| 65 to 74 Years | 64 (29.1%) | 9 (4.3%) |
| 75 Years and over | 28 (25.5%) | 15 (11.8%) |
Disability Class: Vision Difficulty
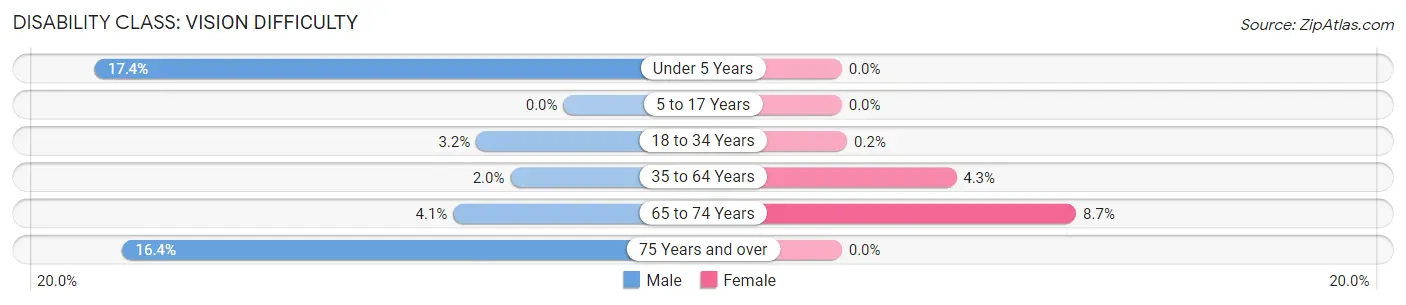
| Age Bracket | Male | Female |
| Under 5 Years | 12 (17.4%) | 0 (0.0%) |
| 5 to 17 Years | 0 (0.0%) | 0 (0.0%) |
| 18 to 34 Years | 22 (3.2%) | 1 (0.2%) |
| 35 to 64 Years | 14 (2.0%) | 32 (4.3%) |
| 65 to 74 Years | 9 (4.1%) | 18 (8.7%) |
| 75 Years and over | 18 (16.4%) | 0 (0.0%) |
Disability Class: Cognitive Difficulty
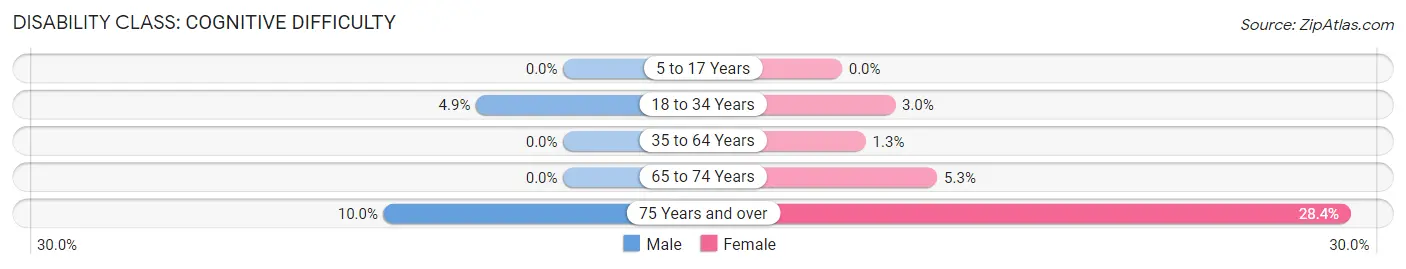
| Age Bracket | Male | Female |
| 5 to 17 Years | 0 (0.0%) | 0 (0.0%) |
| 18 to 34 Years | 33 (4.9%) | 15 (3.0%) |
| 35 to 64 Years | 0 (0.0%) | 10 (1.3%) |
| 65 to 74 Years | 0 (0.0%) | 11 (5.3%) |
| 75 Years and over | 11 (10.0%) | 36 (28.3%) |
Disability Class: Ambulatory Difficulty
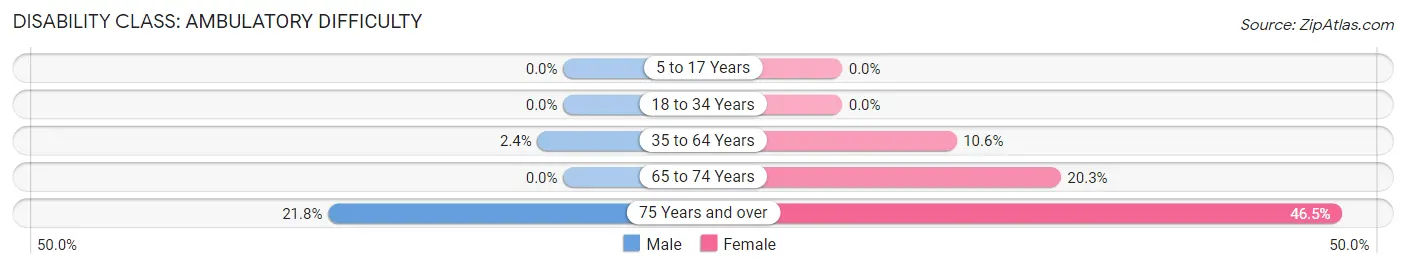
| Age Bracket | Male | Female |
| 5 to 17 Years | 0 (0.0%) | 0 (0.0%) |
| 18 to 34 Years | 0 (0.0%) | 0 (0.0%) |
| 35 to 64 Years | 17 (2.4%) | 80 (10.6%) |
| 65 to 74 Years | 0 (0.0%) | 42 (20.3%) |
| 75 Years and over | 24 (21.8%) | 59 (46.5%) |
Disability Class: Self-Care Difficulty
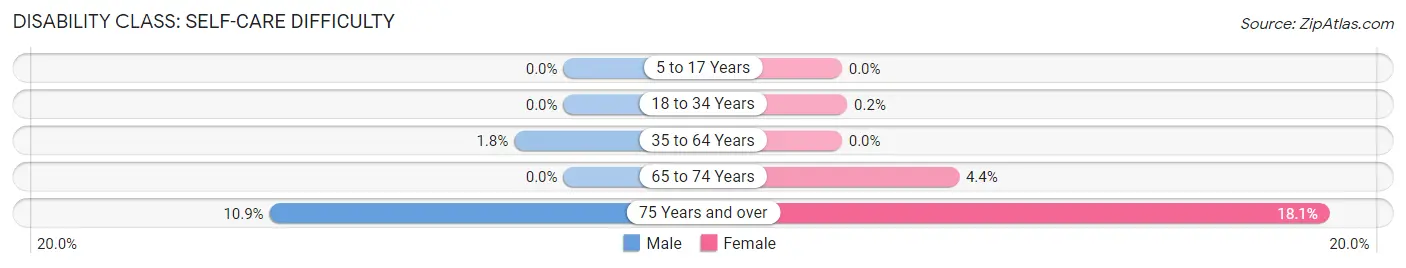
| Age Bracket | Male | Female |
| 5 to 17 Years | 0 (0.0%) | 0 (0.0%) |
| 18 to 34 Years | 0 (0.0%) | 1 (0.2%) |
| 35 to 64 Years | 13 (1.8%) | 0 (0.0%) |
| 65 to 74 Years | 0 (0.0%) | 9 (4.3%) |
| 75 Years and over | 12 (10.9%) | 23 (18.1%) |
Technology Access in Goodview
Computing Device Access in Goodview
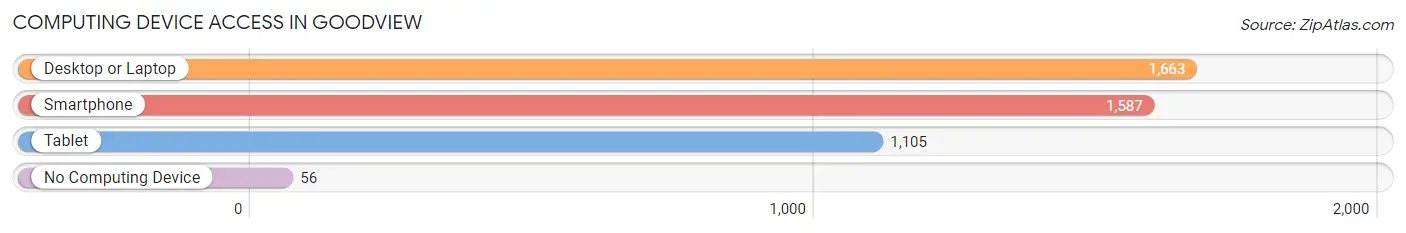
| Device Type | # Households | % Households |
| Desktop or Laptop | 1,663 | 86.8% |
| Smartphone | 1,587 | 82.9% |
| Tablet | 1,105 | 57.7% |
| No Computing Device | 56 | 2.9% |
| Total | 1,915 | 100.0% |
Internet Access in Goodview
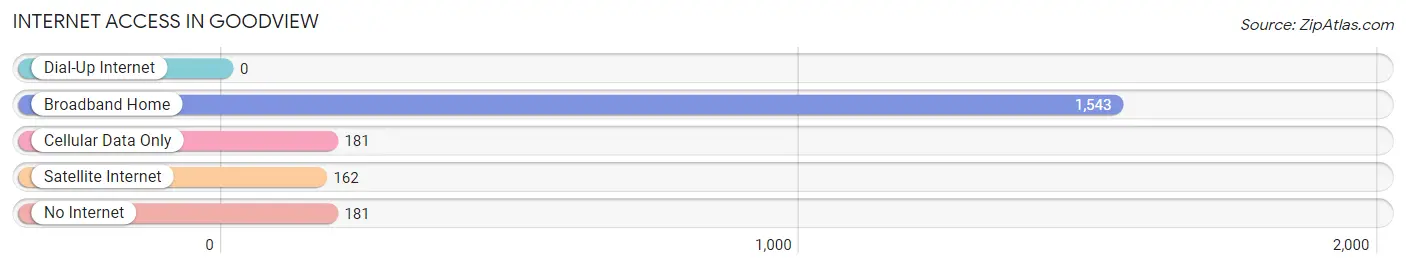
| Internet Type | # Households | % Households |
| Dial-Up Internet | 0 | 0.0% |
| Broadband Home | 1,543 | 80.6% |
| Cellular Data Only | 181 | 9.5% |
| Satellite Internet | 162 | 8.5% |
| No Internet | 181 | 9.5% |
| Total | 1,915 | 100.0% |
Goodview Summary
Goodview is a small city located in the southeastern corner of Minnesota, in Wabasha County. It is situated on the Mississippi River, just south of the city of Wabasha. The city has a population of 1,845 people, according to the 2010 census.
History
Goodview was founded in 1854 by a group of settlers from Wisconsin. The city was originally named “Goodview City”, but the name was shortened to Goodview in 1856. The city was incorporated in 1858.
Goodview was a thriving river town in the late 19th century, with a population of over 1,000 people. The city was home to a number of businesses, including a sawmill, a flour mill, a brickyard, and a number of stores. The city also had a number of churches, including the First Congregational Church, which was founded in 1858.
In the early 20th century, Goodview began to decline as the river trade shifted to larger cities. The city’s population dropped to just over 500 people by the 1950s. However, the city has seen a resurgence in recent years, with the population increasing to 1,845 people in 2010.
Geography
Goodview is located in southeastern Minnesota, in Wabasha County. The city is situated on the Mississippi River, just south of the city of Wabasha. The city is located at an elevation of 645 feet above sea level.
The city has a total area of 1.2 square miles, all of which is land. The city is located in a hilly region, with the highest point in the city being 845 feet above sea level.
Economy
Goodview’s economy is largely based on tourism and agriculture. The city is home to a number of tourist attractions, including the National Eagle Center, the Wabasha Street Caves, and the Goodview Historical Society Museum.
Agriculture is also an important part of the local economy. The city is home to a number of farms, which produce a variety of crops, including corn, soybeans, and hay.
Demographics
According to the 2010 census, Goodview has a population of 1,845 people. The city has a median household income of $45,000, and a median age of 44.7 years. The city is predominantly white, with 95.3% of the population identifying as white. The city also has a small Hispanic population, with 2.2% of the population identifying as Hispanic or Latino.
Conclusion
Goodview is a small city located in southeastern Minnesota, in Wabasha County. The city has a population of 1,845 people, and is largely based on tourism and agriculture. The city is predominantly white, with 95.3% of the population identifying as white. Goodview has a median household income of $45,000, and a median age of 44.7 years. The city is home to a number of tourist attractions, including the National Eagle Center, the Wabasha Street Caves, and the Goodview Historical Society Museum.
Common Questions
What is Per Capita Income in Goodview?
Per Capita income in Goodview is $34,649.
What is the Median Family Income in Goodview?
Median Family Income in Goodview is $86,856.
What is the Median Household income in Goodview?
Median Household Income in Goodview is $66,065.
What is Income or Wage Gap in Goodview?
Income or Wage Gap in Goodview is 6.1%.
Women in Goodview earn 93.9 cents for every dollar earned by a man.
What is Inequality or Gini Index in Goodview?
Inequality or Gini Index in Goodview is 0.33.
What is the Total Population of Goodview?
Total Population of Goodview is 4,109.
What is the Total Male Population of Goodview?
Total Male Population of Goodview is 2,193.
What is the Total Female Population of Goodview?
Total Female Population of Goodview is 1,916.
What is the Ratio of Males per 100 Females in Goodview?
There are 114.46 Males per 100 Females in Goodview.
What is the Ratio of Females per 100 Males in Goodview?
There are 87.37 Females per 100 Males in Goodview.
What is the Median Population Age in Goodview?
Median Population Age in Goodview is 36.1 Years.
What is the Average Family Size in Goodview
Average Family Size in Goodview is 2.9 People.
What is the Average Household Size in Goodview
Average Household Size in Goodview is 2.1 People.
How Large is the Labor Force in Goodview?
There are 2,472 People in the Labor Forcein in Goodview.
What is the Percentage of People in the Labor Force in Goodview?
73.4% of People are in the Labor Force in Goodview.
What is the Unemployment Rate in Goodview?
Unemployment Rate in Goodview is 4.5%.