Powhatan, VA Map & Demographics
Powhatan Map
Powhatan Overview
$42,865
PER CAPITA INCOME
$87,734
AVG FAMILY INCOME
$66,471
AVG HOUSEHOLD INCOME
61.4%
WAGE / INCOME GAP [ % ]
38.6¢/ $1
WAGE / INCOME GAP [ $ ]
0.37
INEQUALITY / GINI INDEX
473
TOTAL POPULATION
158
MALE POPULATION
315
FEMALE POPULATION
50.16
MALES / 100 FEMALES
199.37
FEMALES / 100 MALES
57.1
MEDIAN AGE
2.1
AVG FAMILY SIZE
1.9
AVG HOUSEHOLD SIZE
222
LABOR FORCE [ PEOPLE ]
49.8%
PERCENT IN LABOR FORCE
Powhatan Zip Codes
Powhatan Area Codes
Income in Powhatan
Income Overview in Powhatan
Per Capita Income in Powhatan is $42,865, while median incomes of families and households are $87,734 and $66,471 respectively.
| Characteristic | Number | Measure |
| Per Capita Income | 473 | $42,865 |
| Median Family Income | 199 | $87,734 |
| Mean Family Income | 199 | $104,989 |
| Median Household Income | 246 | $66,471 |
| Mean Household Income | 246 | $88,954 |
| Income Deficit | 199 | $0 |
| Wage / Income Gap (%) | 473 | 61.44% |
| Wage / Income Gap ($) | 473 | 38.56¢ per $1 |
| Gini / Inequality Index | 473 | 0.37 |
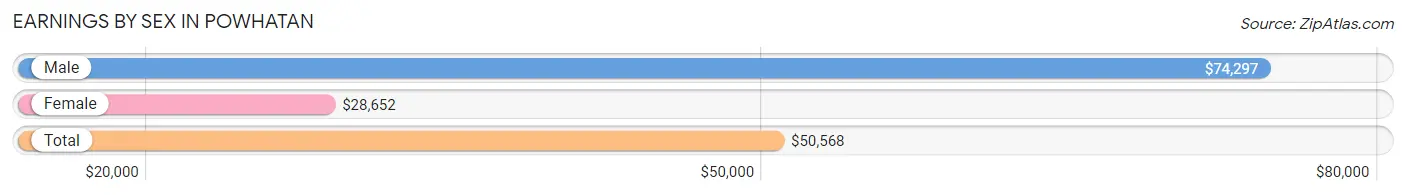
Earnings by Sex in Powhatan
Average Earnings in Powhatan are $50,568, $74,297 for men and $28,652 for women, a difference of 61.4%.
| Sex | Number | Average Earnings |
| Male | 121 (43.5%) | $74,297 |
| Female | 157 (56.5%) | $28,652 |
| Total | 278 (100.0%) | $50,568 |
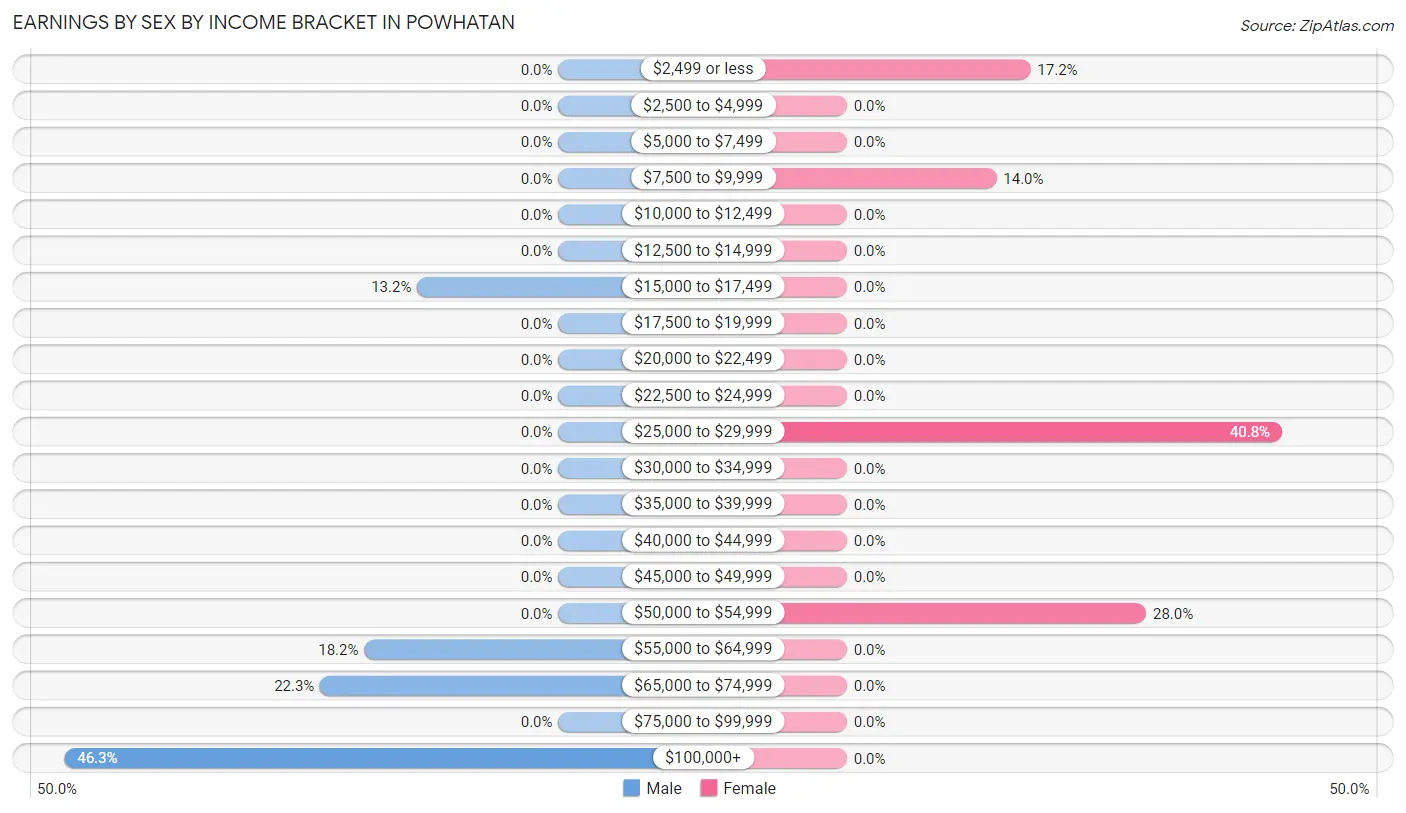
Earnings by Sex by Income Bracket in Powhatan
The most common earnings brackets in Powhatan are $100,000+ for men (56 | 46.3%) and $25,000 to $29,999 for women (64 | 40.8%).
| Income | Male | Female |
| $2,499 or less | 0 (0.0%) | 27 (17.2%) |
| $2,500 to $4,999 | 0 (0.0%) | 0 (0.0%) |
| $5,000 to $7,499 | 0 (0.0%) | 0 (0.0%) |
| $7,500 to $9,999 | 0 (0.0%) | 22 (14.0%) |
| $10,000 to $12,499 | 0 (0.0%) | 0 (0.0%) |
| $12,500 to $14,999 | 0 (0.0%) | 0 (0.0%) |
| $15,000 to $17,499 | 16 (13.2%) | 0 (0.0%) |
| $17,500 to $19,999 | 0 (0.0%) | 0 (0.0%) |
| $20,000 to $22,499 | 0 (0.0%) | 0 (0.0%) |
| $22,500 to $24,999 | 0 (0.0%) | 0 (0.0%) |
| $25,000 to $29,999 | 0 (0.0%) | 64 (40.8%) |
| $30,000 to $34,999 | 0 (0.0%) | 0 (0.0%) |
| $35,000 to $39,999 | 0 (0.0%) | 0 (0.0%) |
| $40,000 to $44,999 | 0 (0.0%) | 0 (0.0%) |
| $45,000 to $49,999 | 0 (0.0%) | 0 (0.0%) |
| $50,000 to $54,999 | 0 (0.0%) | 44 (28.0%) |
| $55,000 to $64,999 | 22 (18.2%) | 0 (0.0%) |
| $65,000 to $74,999 | 27 (22.3%) | 0 (0.0%) |
| $75,000 to $99,999 | 0 (0.0%) | 0 (0.0%) |
| $100,000+ | 56 (46.3%) | 0 (0.0%) |
| Total | 121 (100.0%) | 157 (100.0%) |
Earnings by Sex by Educational Attainment in Powhatan
| Educational Attainment | Male Income | Female Income |
| Less than High School | - | - |
| High School Diploma | - | - |
| College or Associate's Degree | - | - |
| Bachelor's Degree | - | - |
| Graduate Degree | - | - |
| Total | $74,297 | $29,180 |
Family Income in Powhatan
Family Income Brackets in Powhatan
According to the Powhatan family income data, there are 83 families falling into the $50,000 to $74,999 income range, which is the most common income bracket and makes up 41.7% of all families.
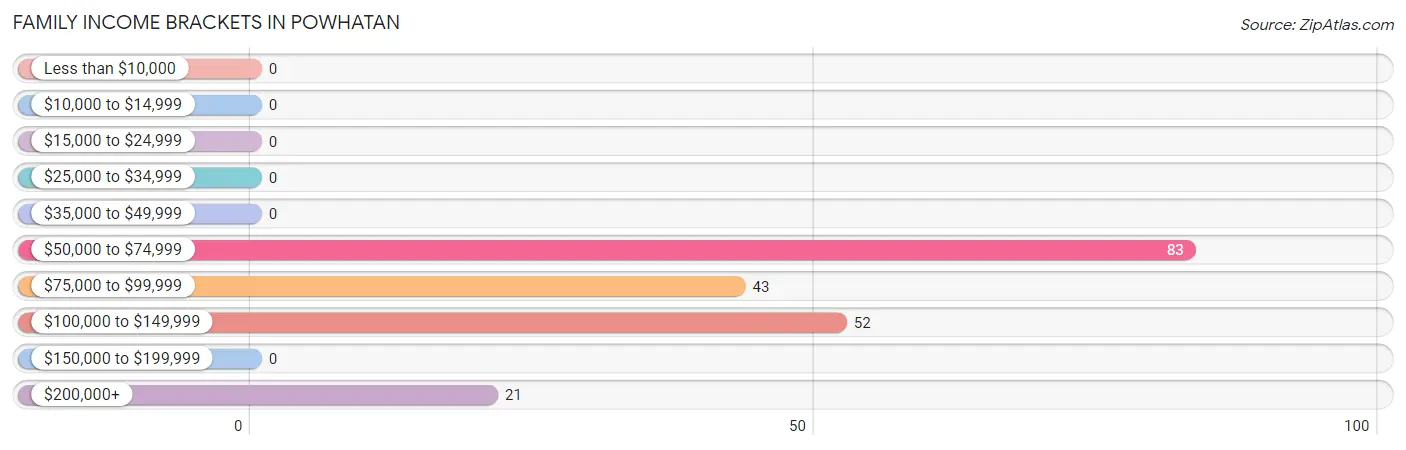
| Income Bracket | # Families | % Families |
| Less than $10,000 | 0 | 0.0% |
| $10,000 to $14,999 | 0 | 0.0% |
| $15,000 to $24,999 | 0 | 0.0% |
| $25,000 to $34,999 | 0 | 0.0% |
| $35,000 to $49,999 | 0 | 0.0% |
| $50,000 to $74,999 | 83 | 41.7% |
| $75,000 to $99,999 | 43 | 21.6% |
| $100,000 to $149,999 | 52 | 26.1% |
| $150,000 to $199,999 | 0 | 0.0% |
| $200,000+ | 21 | 10.6% |
Family Income by Famaliy Size in Powhatan
2-person families (143 | 71.9%) account for the highest median family income in Powhatan with $100,417 per family, while 2-person families (143 | 71.9%) have the highest median income of $50,208 per family member.
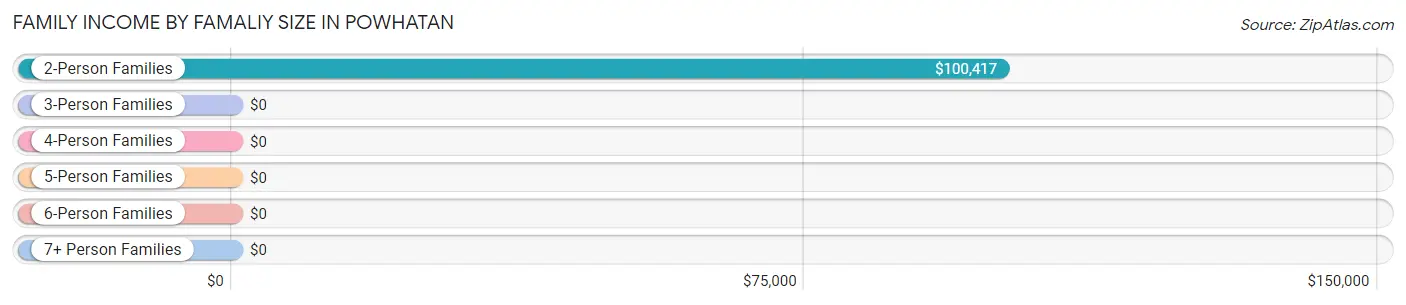
| Income Bracket | # Families | Median Income |
| 2-Person Families | 143 (71.9%) | $100,417 |
| 3-Person Families | 56 (28.1%) | $0 |
| 4-Person Families | 0 (0.0%) | $0 |
| 5-Person Families | 0 (0.0%) | $0 |
| 6-Person Families | 0 (0.0%) | $0 |
| 7+ Person Families | 0 (0.0%) | $0 |
| Total | 199 (100.0%) | $87,734 |
Family Income by Number of Earners in Powhatan
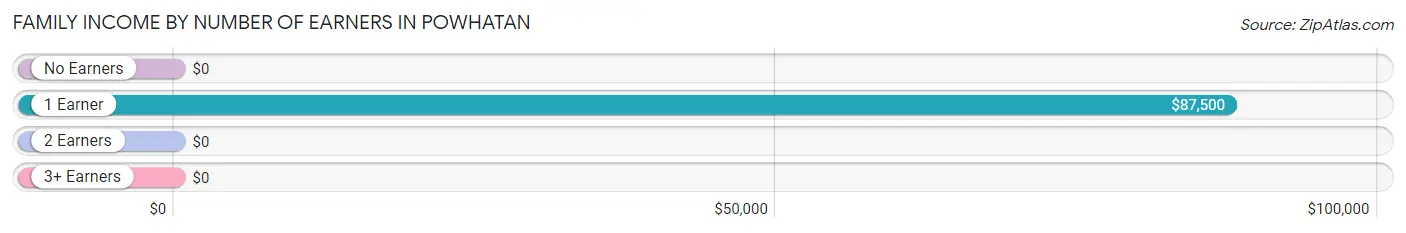
| Number of Earners | # Families | Median Income |
| No Earners | 26 (13.1%) | $0 |
| 1 Earner | 74 (37.2%) | $87,500 |
| 2 Earners | 99 (49.7%) | $0 |
| 3+ Earners | 0 (0.0%) | $0 |
| Total | 199 (100.0%) | $87,734 |
Household Income in Powhatan
Household Income Brackets in Powhatan
With 83 households falling in the category, the $50,000 to $74,999 income range is the most frequent in Powhatan, accounting for 33.7% of all households.
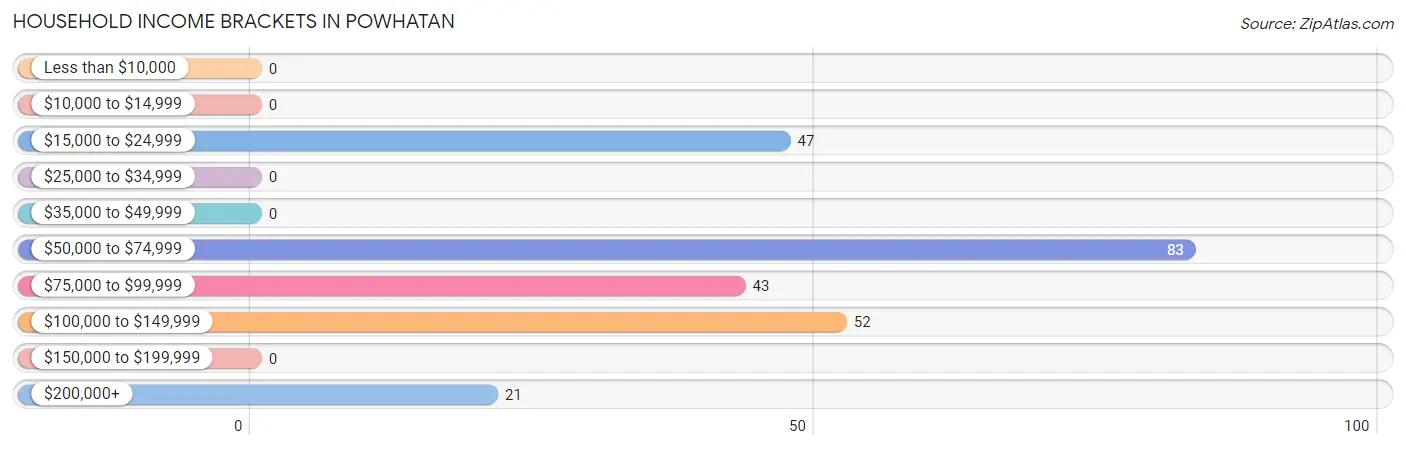
| Income Bracket | # Households | % Households |
| Less than $10,000 | 0 | 0.0% |
| $10,000 to $14,999 | 0 | 0.0% |
| $15,000 to $24,999 | 47 | 19.1% |
| $25,000 to $34,999 | 0 | 0.0% |
| $35,000 to $49,999 | 0 | 0.0% |
| $50,000 to $74,999 | 83 | 33.7% |
| $75,000 to $99,999 | 43 | 17.5% |
| $100,000 to $149,999 | 52 | 21.1% |
| $150,000 to $199,999 | 0 | 0.0% |
| $200,000+ | 21 | 8.5% |
Household Income by Householder Age in Powhatan
The median household income in Powhatan is $66,471, with the highest median household income of $98,125 found in the 45 to 64 years age bracket for the primary householder. A total of 104 households (42.3%) fall into this category.
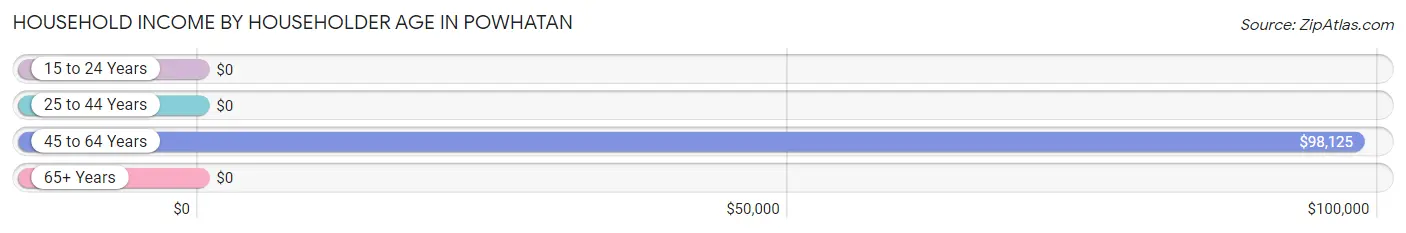
| Income Bracket | # Households | Median Income |
| 15 to 24 Years | 0 (0.0%) | $0 |
| 25 to 44 Years | 44 (17.9%) | $0 |
| 45 to 64 Years | 104 (42.3%) | $98,125 |
| 65+ Years | 98 (39.8%) | $0 |
| Total | 246 (100.0%) | $66,471 |
Poverty in Powhatan
Income Below Poverty by Sex and Age in Powhatan
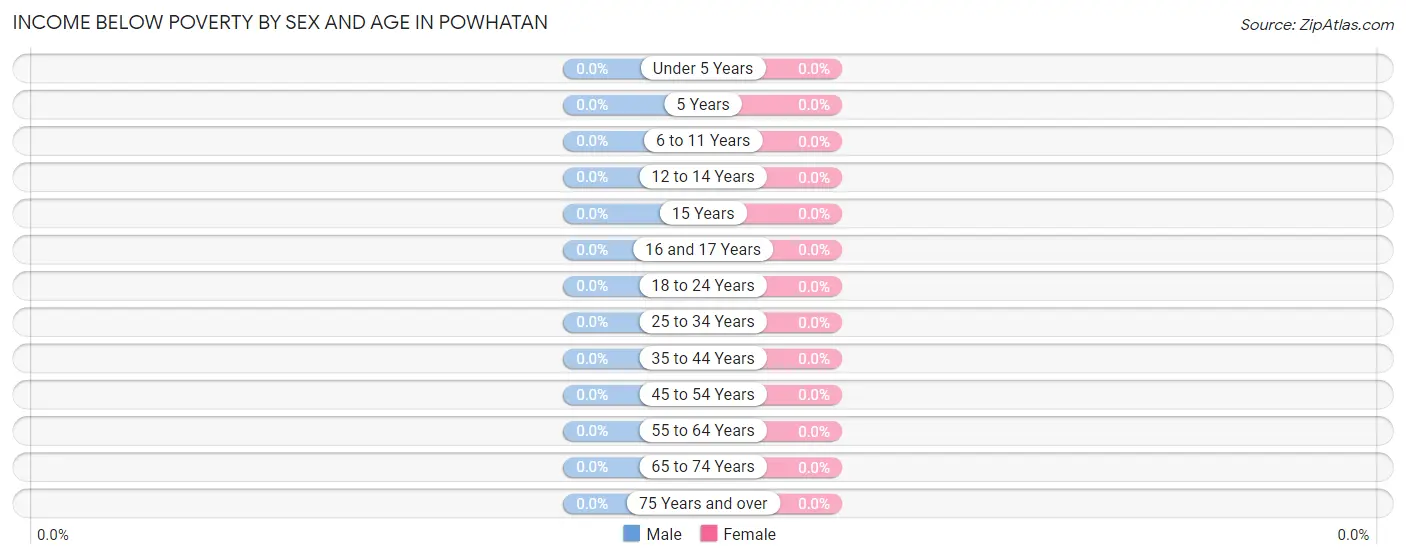
| Age Bracket | Male | Female |
| Under 5 Years | 0 (0.0%) | 0 (0.0%) |
| 5 Years | 0 (0.0%) | 0 (0.0%) |
| 6 to 11 Years | 0 (0.0%) | 0 (0.0%) |
| 12 to 14 Years | 0 (0.0%) | 0 (0.0%) |
| 15 Years | 0 (0.0%) | 0 (0.0%) |
| 16 and 17 Years | 0 (0.0%) | 0 (0.0%) |
| 18 to 24 Years | 0 (0.0%) | 0 (0.0%) |
| 25 to 34 Years | 0 (0.0%) | 0 (0.0%) |
| 35 to 44 Years | 0 (0.0%) | 0 (0.0%) |
| 45 to 54 Years | 0 (0.0%) | 0 (0.0%) |
| 55 to 64 Years | 0 (0.0%) | 0 (0.0%) |
| 65 to 74 Years | 0 (0.0%) | 0 (0.0%) |
| 75 Years and over | 0 (0.0%) | 0 (0.0%) |
| Total | 0 (0.0%) | 0 (0.0%) |
Income Above Poverty by Sex and Age in Powhatan
According to the poverty statistics in Powhatan, males aged 16 and 17 years and females aged 6 to 11 years are the age groups that are most secure financially, with 100.0% of males and 100.0% of females in these age groups living above the poverty line.
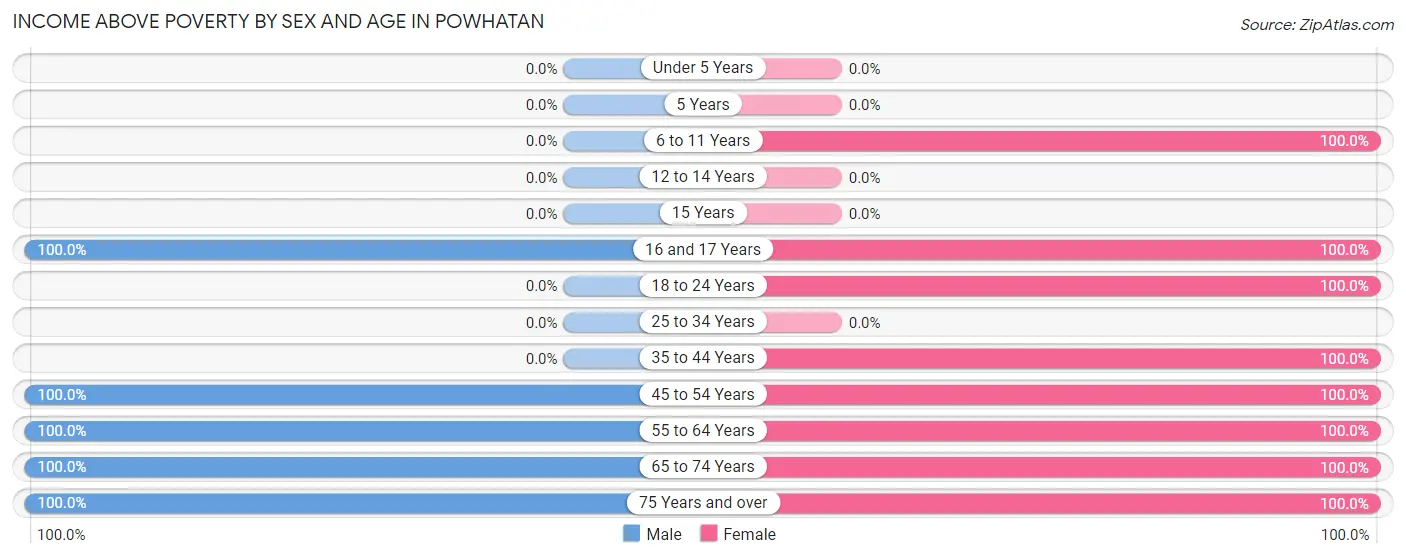
| Age Bracket | Male | Female |
| Under 5 Years | 0 (0.0%) | 0 (0.0%) |
| 5 Years | 0 (0.0%) | 0 (0.0%) |
| 6 to 11 Years | 0 (0.0%) | 27 (100.0%) |
| 12 to 14 Years | 0 (0.0%) | 0 (0.0%) |
| 15 Years | 0 (0.0%) | 0 (0.0%) |
| 16 and 17 Years | 10 (100.0%) | 27 (100.0%) |
| 18 to 24 Years | 0 (0.0%) | 29 (100.0%) |
| 25 to 34 Years | 0 (0.0%) | 0 (0.0%) |
| 35 to 44 Years | 0 (0.0%) | 44 (100.0%) |
| 45 to 54 Years | 33 (100.0%) | 12 (100.0%) |
| 55 to 64 Years | 59 (100.0%) | 79 (100.0%) |
| 65 to 74 Years | 22 (100.0%) | 52 (100.0%) |
| 75 Years and over | 34 (100.0%) | 45 (100.0%) |
| Total | 158 (100.0%) | 315 (100.0%) |
Income Below Poverty Among Married-Couple Families in Powhatan
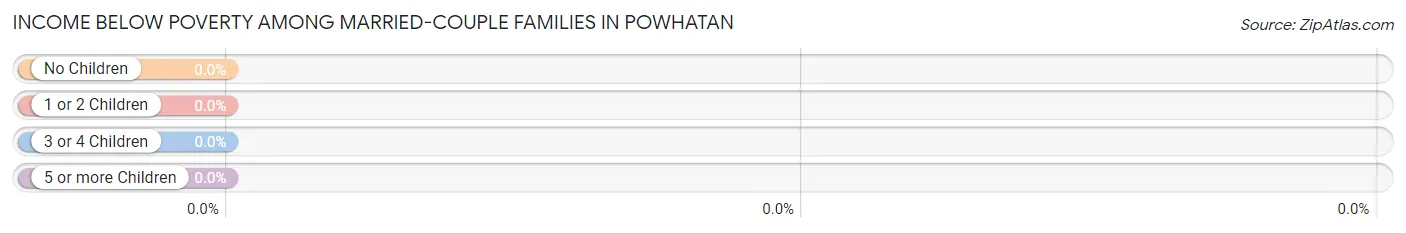
| Children | Above Poverty | Below Poverty |
| No Children | 133 (100.0%) | 0 (0.0%) |
| 1 or 2 Children | 0 (0.0%) | 0 (0.0%) |
| 3 or 4 Children | 0 (0.0%) | 0 (0.0%) |
| 5 or more Children | 0 (0.0%) | 0 (0.0%) |
| Total | 133 (100.0%) | 0 (0.0%) |
Income Below Poverty Among Single-Parent Households in Powhatan
| Children | Single Father | Single Mother |
| No Children | 0 (0.0%) | 0 (0.0%) |
| 1 or 2 Children | 0 (0.0%) | 0 (0.0%) |
| 3 or 4 Children | 0 (0.0%) | 0 (0.0%) |
| 5 or more Children | 0 (0.0%) | 0 (0.0%) |
| Total | 0 (0.0%) | 0 (0.0%) |
Income Below Poverty Among Married-Couple vs Single-Parent Households in Powhatan
| Children | Married-Couple Families | Single-Parent Households |
| No Children | 0 (0.0%) | 0 (0.0%) |
| 1 or 2 Children | 0 (0.0%) | 0 (0.0%) |
| 3 or 4 Children | 0 (0.0%) | 0 (0.0%) |
| 5 or more Children | 0 (0.0%) | 0 (0.0%) |
| Total | 0 (0.0%) | 0 (0.0%) |
Race in Powhatan
The most populous races in Powhatan are , and White / Caucasian (473 | 100.0%).
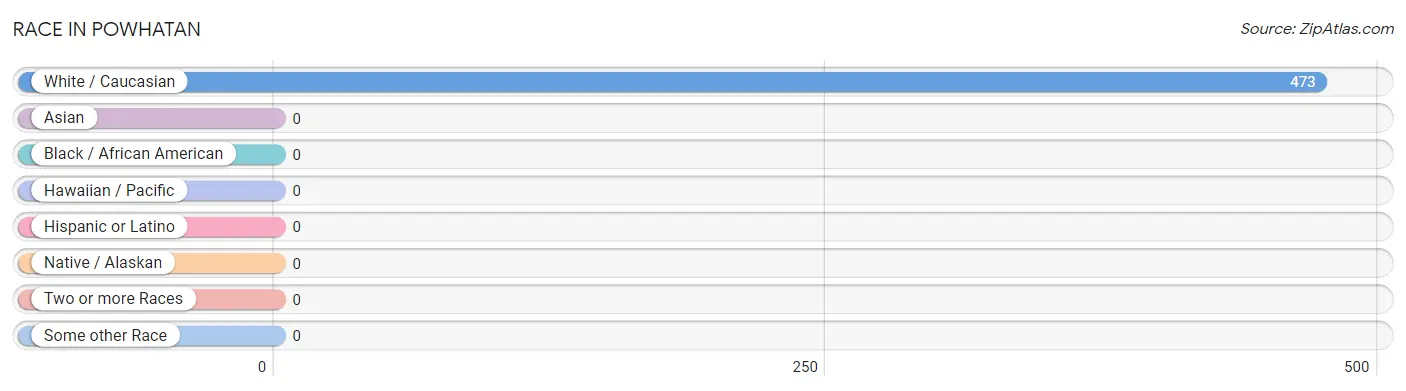
| Race | # Population | % Population |
| Asian | 0 | 0.0% |
| Black / African American | 0 | 0.0% |
| Hawaiian / Pacific | 0 | 0.0% |
| Hispanic or Latino | 0 | 0.0% |
| Native / Alaskan | 0 | 0.0% |
| White / Caucasian | 473 | 100.0% |
| Two or more Races | 0 | 0.0% |
| Some other Race | 0 | 0.0% |
| Total | 473 | 100.0% |
Ancestry in Powhatan
The most populous ancestries reported in Powhatan are German (240 | 50.7%), Irish (98 | 20.7%), English (68 | 14.4%), American (54 | 11.4%), and Scotch-Irish (35 | 7.4%), together accounting for 104.7% of all Powhatan residents.
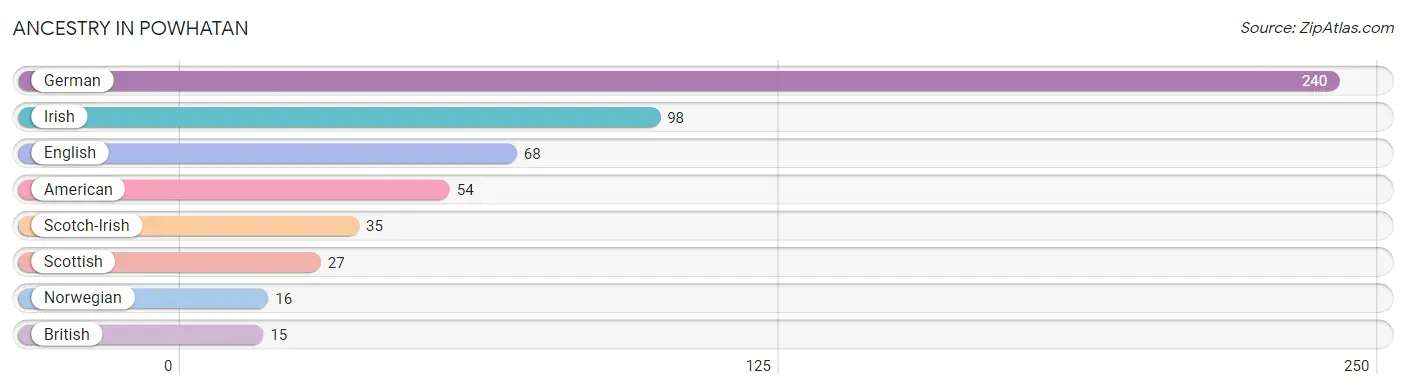
| Ancestry | # Population | % Population |
| American | 54 | 11.4% |
| British | 15 | 3.2% |
| English | 68 | 14.4% |
| German | 240 | 50.7% |
| Irish | 98 | 20.7% |
| Norwegian | 16 | 3.4% |
| Scotch-Irish | 35 | 7.4% |
| Scottish | 27 | 5.7% | View All 8 Rows |
Immigrants in Powhatan

| Immigration Origin | # Population | % Population | View All 0 Rows |
Sex and Age in Powhatan
Sex and Age in Powhatan
The most populous age groups in Powhatan are 55 to 59 Years (59 | 37.3%) for men and 55 to 59 Years (64 | 20.3%) for women.
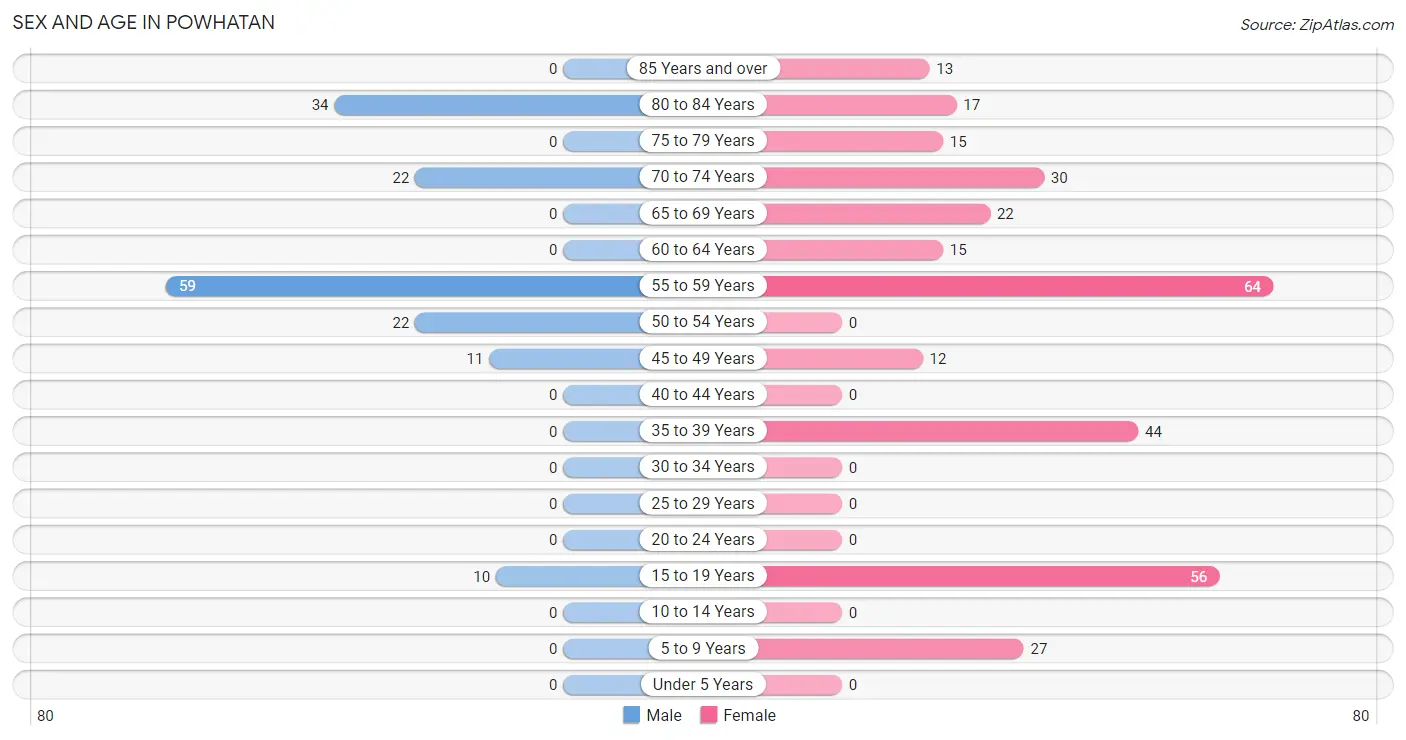
| Age Bracket | Male | Female |
| Under 5 Years | 0 (0.0%) | 0 (0.0%) |
| 5 to 9 Years | 0 (0.0%) | 27 (8.6%) |
| 10 to 14 Years | 0 (0.0%) | 0 (0.0%) |
| 15 to 19 Years | 10 (6.3%) | 56 (17.8%) |
| 20 to 24 Years | 0 (0.0%) | 0 (0.0%) |
| 25 to 29 Years | 0 (0.0%) | 0 (0.0%) |
| 30 to 34 Years | 0 (0.0%) | 0 (0.0%) |
| 35 to 39 Years | 0 (0.0%) | 44 (14.0%) |
| 40 to 44 Years | 0 (0.0%) | 0 (0.0%) |
| 45 to 49 Years | 11 (7.0%) | 12 (3.8%) |
| 50 to 54 Years | 22 (13.9%) | 0 (0.0%) |
| 55 to 59 Years | 59 (37.3%) | 64 (20.3%) |
| 60 to 64 Years | 0 (0.0%) | 15 (4.8%) |
| 65 to 69 Years | 0 (0.0%) | 22 (7.0%) |
| 70 to 74 Years | 22 (13.9%) | 30 (9.5%) |
| 75 to 79 Years | 0 (0.0%) | 15 (4.8%) |
| 80 to 84 Years | 34 (21.5%) | 17 (5.4%) |
| 85 Years and over | 0 (0.0%) | 13 (4.1%) |
| Total | 158 (100.0%) | 315 (100.0%) |
Families and Households in Powhatan
Median Family Size in Powhatan
The median family size in Powhatan is 2.14 persons per family, with married-couple families (133 | 66.8%) accounting for the largest median family size of 2.23 persons per family. On the other hand, single male/father families (22 | 11.1%) represent the smallest median family size with 1.45 persons per family.
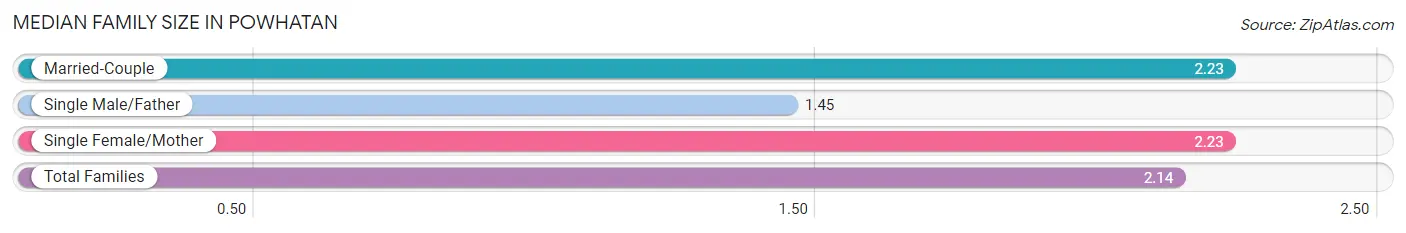
| Family Type | # Families | Family Size |
| Married-Couple | 133 (66.8%) | 2.23 |
| Single Male/Father | 22 (11.1%) | 1.45 |
| Single Female/Mother | 44 (22.1%) | 2.23 |
| Total Families | 199 (100.0%) | 2.14 |
Median Household Size in Powhatan
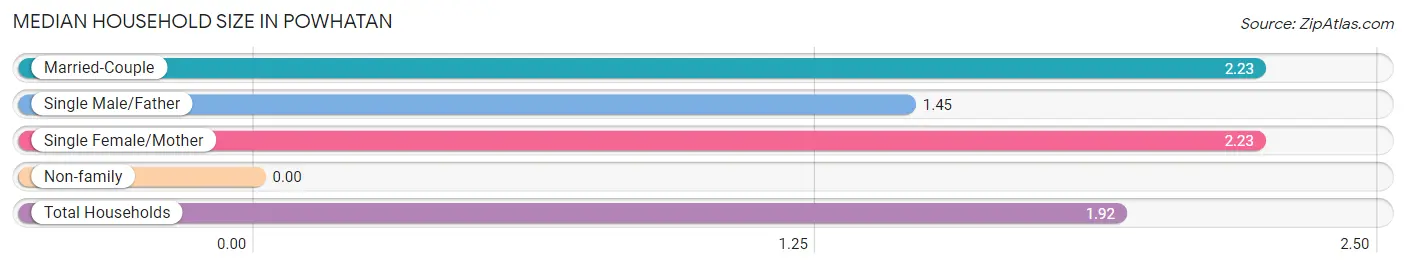
| Household Type | # Households | Household Size |
| Married-Couple | 133 (54.1%) | 2.23 |
| Single Male/Father | 22 (8.9%) | 1.45 |
| Single Female/Mother | 44 (17.9%) | 2.23 |
| Non-family | 47 (19.1%) | - |
| Total Households | 246 (100.0%) | 1.92 |
Household Size by Marriage Status in Powhatan
Out of a total of 246 households in Powhatan, 199 (80.9%) are family households, while 47 (19.1%) are nonfamily households. The most numerous type of family households are 2-person households, comprising 143, and the most common type of nonfamily households are 1-person households, comprising 47.
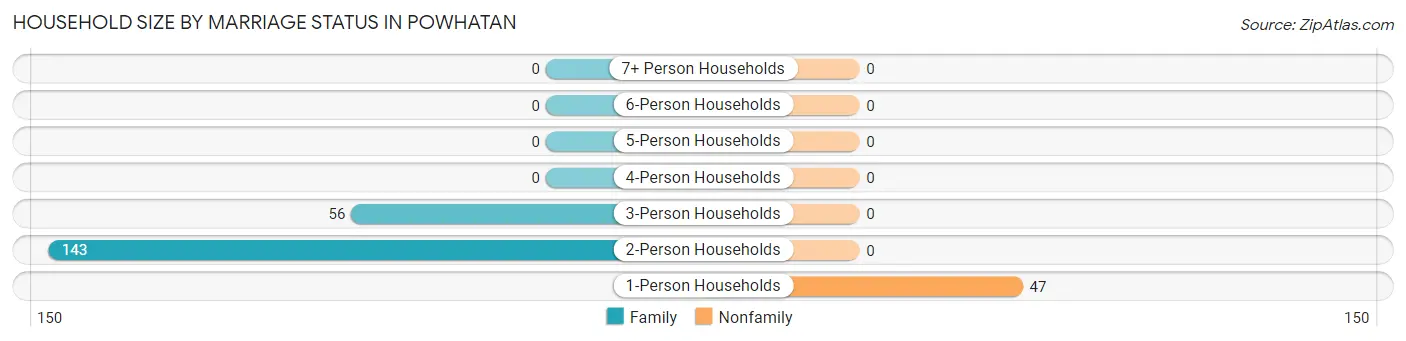
| Household Size | Family Households | Nonfamily Households |
| 1-Person Households | - | 47 (19.1%) |
| 2-Person Households | 143 (58.1%) | 0 (0.0%) |
| 3-Person Households | 56 (22.8%) | 0 (0.0%) |
| 4-Person Households | 0 (0.0%) | 0 (0.0%) |
| 5-Person Households | 0 (0.0%) | 0 (0.0%) |
| 6-Person Households | 0 (0.0%) | 0 (0.0%) |
| 7+ Person Households | 0 (0.0%) | 0 (0.0%) |
| Total | 199 (80.9%) | 47 (19.1%) |
Female Fertility in Powhatan
Fertility by Age in Powhatan
| Age Bracket | Women with Births | Births / 1,000 Women |
| 15 to 19 years | 0 (0.0%) | 0.0 |
| 20 to 34 years | 0 (0.0%) | 0.0 |
| 35 to 50 years | 0 (0.0%) | 0.0 |
| Total | 0 (0.0%) | 0.0 |
Fertility by Age by Marriage Status in Powhatan
| Age Bracket | Married | Unmarried |
| 15 to 19 years | 0 (0.0%) | 0 (0.0%) |
| 20 to 34 years | 0 (0.0%) | 0 (0.0%) |
| 35 to 50 years | 0 (0.0%) | 0 (0.0%) |
| Total | 0 (0.0%) | 0 (0.0%) |
Fertility by Education in Powhatan
| Educational Attainment | Women with Births | Births / 1,000 Women |
| Less than High School | 0 (0.0%) | 0.0 |
| High School Diploma | 0 (0.0%) | 0.0 |
| College or Associate's Degree | 0 (0.0%) | 0.0 |
| Bachelor's Degree | 0 (0.0%) | 0.0 |
| Graduate Degree | 0 (0.0%) | 0.0 |
| Total | 0 (0.0%) | 0.0 |
Fertility by Education by Marriage Status in Powhatan
| Educational Attainment | Married | Unmarried |
| Less than High School | 0 (0.0%) | 0 (0.0%) |
| High School Diploma | 0 (0.0%) | 0 (0.0%) |
| College or Associate's Degree | 0 (0.0%) | 0 (0.0%) |
| Bachelor's Degree | 0 (0.0%) | 0 (0.0%) |
| Graduate Degree | 0 (0.0%) | 0 (0.0%) |
| Total | 0 (0.0%) | 0 (0.0%) |
Employment Characteristics in Powhatan
Employment by Class of Employer in Powhatan
Among the 222 employed individuals in Powhatan, private company employees (75 | 33.8%), self-employed (not incorporated) (60 | 27.0%), and not-for-profit organizations (44 | 19.8%) make up the most common classes of employment.
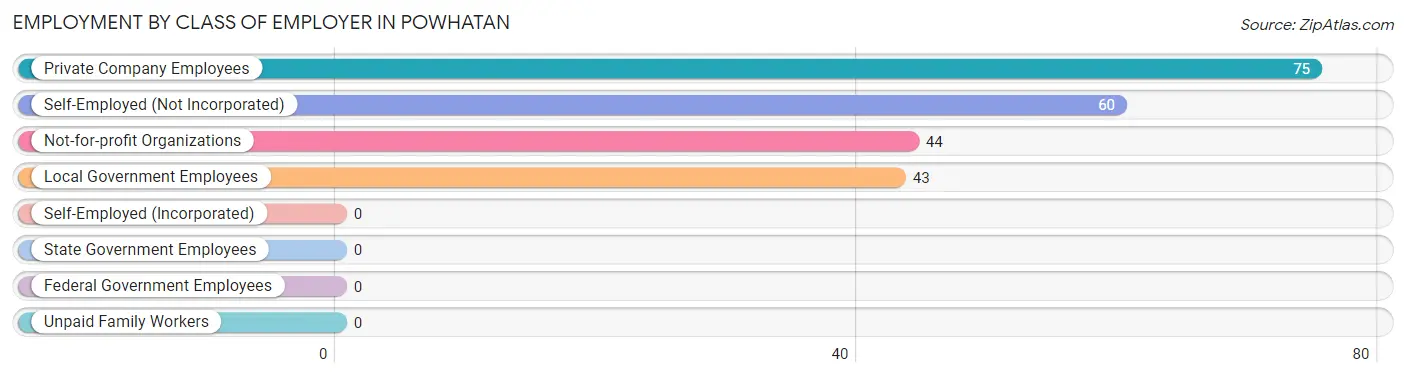
| Employer Class | # Employees | % Employees |
| Private Company Employees | 75 | 33.8% |
| Self-Employed (Incorporated) | 0 | 0.0% |
| Self-Employed (Not Incorporated) | 60 | 27.0% |
| Not-for-profit Organizations | 44 | 19.8% |
| Local Government Employees | 43 | 19.4% |
| State Government Employees | 0 | 0.0% |
| Federal Government Employees | 0 | 0.0% |
| Unpaid Family Workers | 0 | 0.0% |
| Total | 222 | 100.0% |
Employment Status by Age in Powhatan
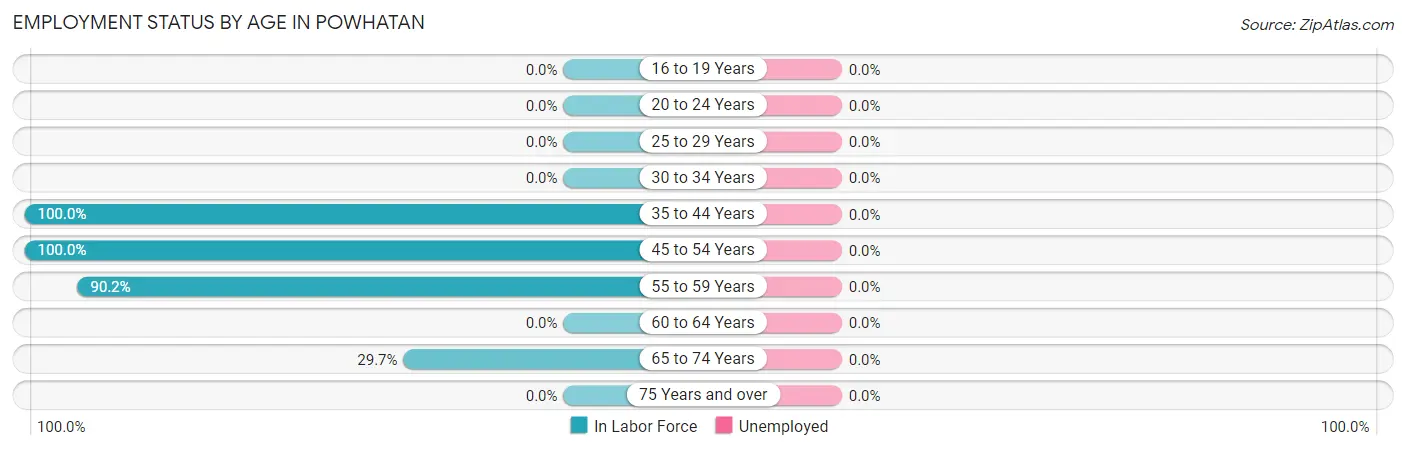
| Age Bracket | In Labor Force | Unemployed |
| 16 to 19 Years | 0 (0.0%) | 0 (0.0%) |
| 20 to 24 Years | 0 (0.0%) | 0 (0.0%) |
| 25 to 29 Years | 0 (0.0%) | 0 (0.0%) |
| 30 to 34 Years | 0 (0.0%) | 0 (0.0%) |
| 35 to 44 Years | 44 (100.0%) | 0 (0.0%) |
| 45 to 54 Years | 45 (100.0%) | 0 (0.0%) |
| 55 to 59 Years | 111 (90.2%) | 0 (0.0%) |
| 60 to 64 Years | 0 (0.0%) | 0 (0.0%) |
| 65 to 74 Years | 22 (29.7%) | 0 (0.0%) |
| 75 Years and over | 0 (0.0%) | 0 (0.0%) |
| Total | 222 (49.8%) | 0 (0.0%) |
Employment Status by Educational Attainment in Powhatan
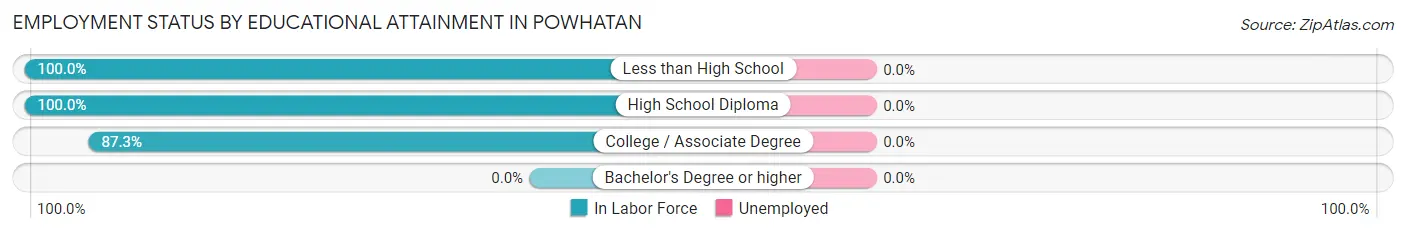
| Educational Attainment | In Labor Force | Unemployed |
| Less than High School | 52 (100.0%) | 0 (0.0%) |
| High School Diploma | 45 (100.0%) | 0 (0.0%) |
| College / Associate Degree | 103 (87.3%) | 0 (0.0%) |
| Bachelor's Degree or higher | 0 (0.0%) | 0 (0.0%) |
| Total | 200 (88.1%) | 0 (0.0%) |
Employment Occupations by Sex in Powhatan
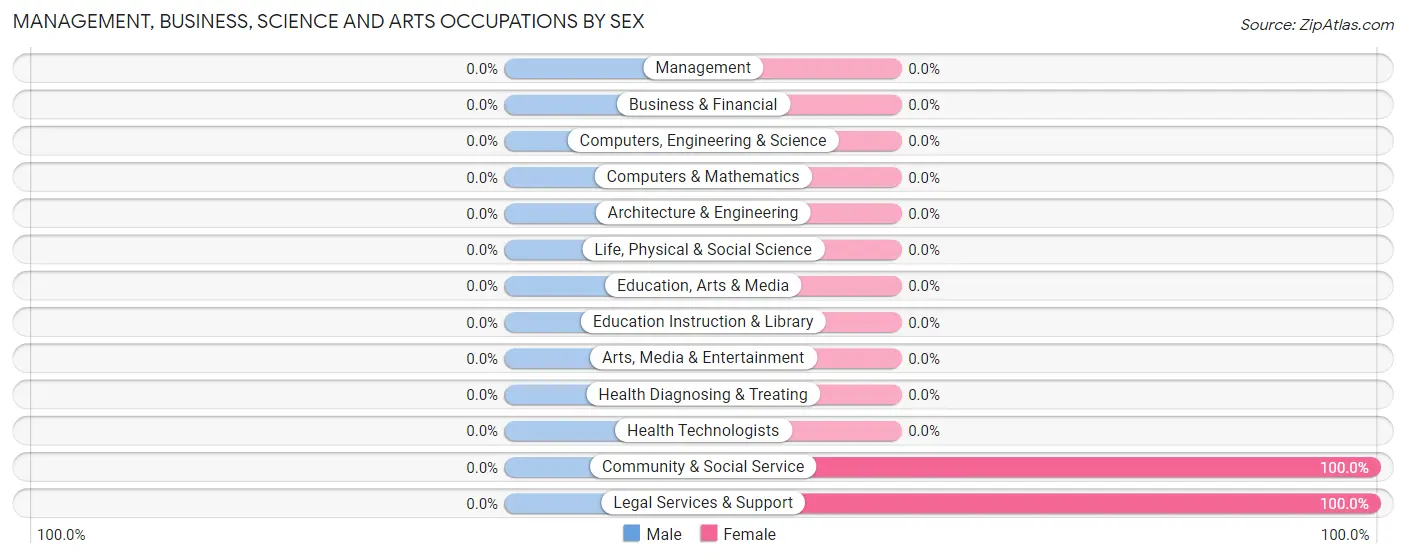
Management, Business, Science and Arts Occupations
The most common Management, Business, Science and Arts occupations in Powhatan are Community & Social Service (44 | 19.8%), and Legal Services & Support (44 | 19.8%).
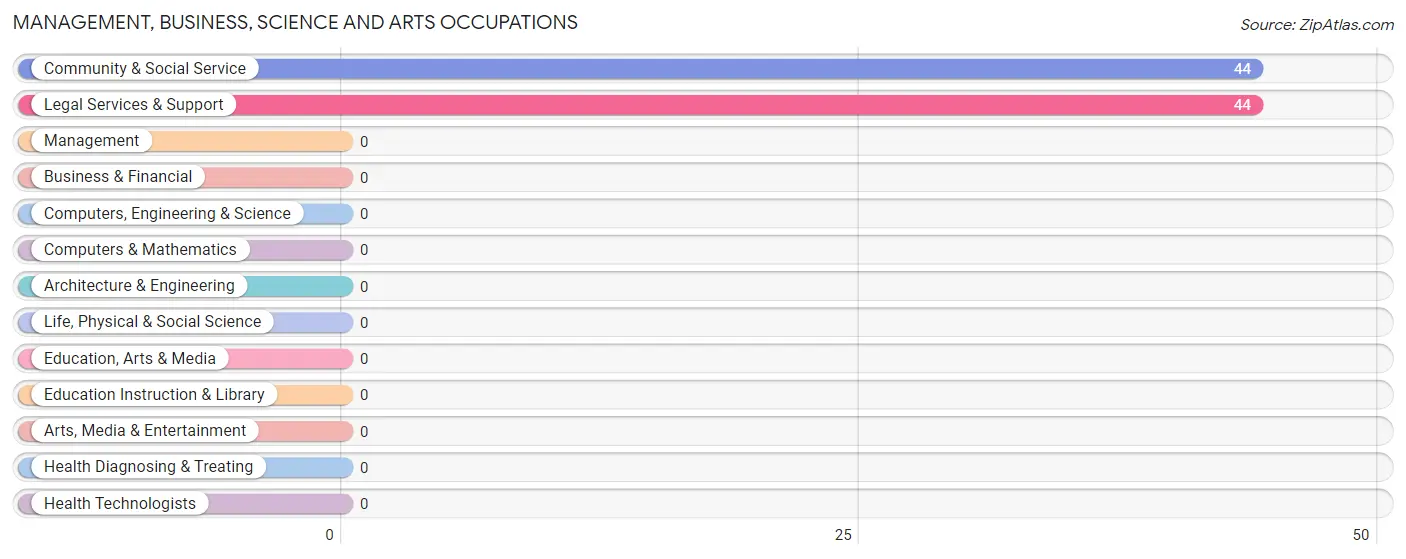
Management, Business, Science and Arts Occupations by Sex
| Occupation | Male | Female |
| Management | 0 (0.0%) | 0 (0.0%) |
| Business & Financial | 0 (0.0%) | 0 (0.0%) |
| Computers, Engineering & Science | 0 (0.0%) | 0 (0.0%) |
| Computers & Mathematics | 0 (0.0%) | 0 (0.0%) |
| Architecture & Engineering | 0 (0.0%) | 0 (0.0%) |
| Life, Physical & Social Science | 0 (0.0%) | 0 (0.0%) |
| Community & Social Service | 0 (0.0%) | 44 (100.0%) |
| Education, Arts & Media | 0 (0.0%) | 0 (0.0%) |
| Legal Services & Support | 0 (0.0%) | 44 (100.0%) |
| Education Instruction & Library | 0 (0.0%) | 0 (0.0%) |
| Arts, Media & Entertainment | 0 (0.0%) | 0 (0.0%) |
| Health Diagnosing & Treating | 0 (0.0%) | 0 (0.0%) |
| Health Technologists | 0 (0.0%) | 0 (0.0%) |
| Total (Category) | 0 (0.0%) | 44 (100.0%) |
| Total (Overall) | 92 (41.4%) | 130 (58.6%) |
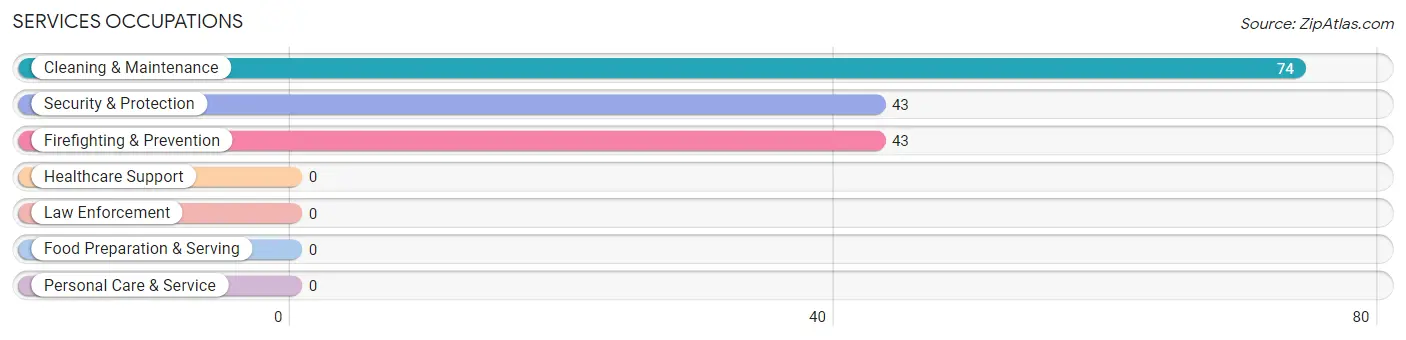
Services Occupations
The most common Services occupations in Powhatan are Cleaning & Maintenance (74 | 33.3%), Security & Protection (43 | 19.4%), and Firefighting & Prevention (43 | 19.4%).
Services Occupations by Sex
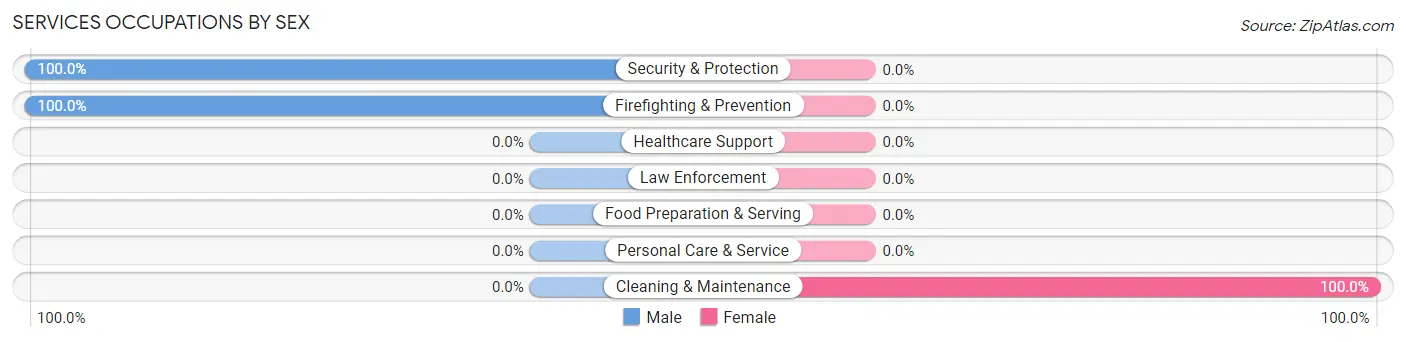
| Occupation | Male | Female |
| Healthcare Support | 0 (0.0%) | 0 (0.0%) |
| Security & Protection | 43 (100.0%) | 0 (0.0%) |
| Firefighting & Prevention | 43 (100.0%) | 0 (0.0%) |
| Law Enforcement | 0 (0.0%) | 0 (0.0%) |
| Food Preparation & Serving | 0 (0.0%) | 0 (0.0%) |
| Cleaning & Maintenance | 0 (0.0%) | 74 (100.0%) |
| Personal Care & Service | 0 (0.0%) | 0 (0.0%) |
| Total (Category) | 43 (36.7%) | 74 (63.2%) |
| Total (Overall) | 92 (41.4%) | 130 (58.6%) |
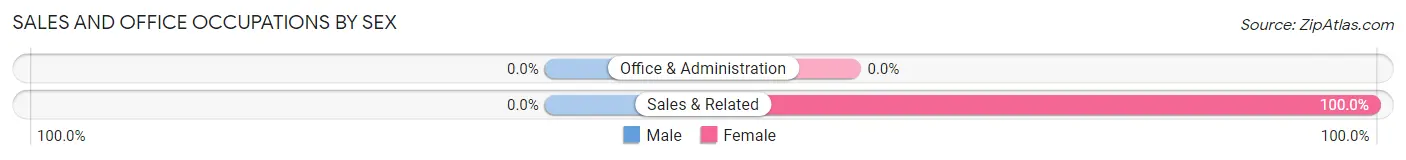
Sales and Office Occupations
The most common Sales and Office occupations in Powhatan are , and Sales & Related (12 | 5.4%).
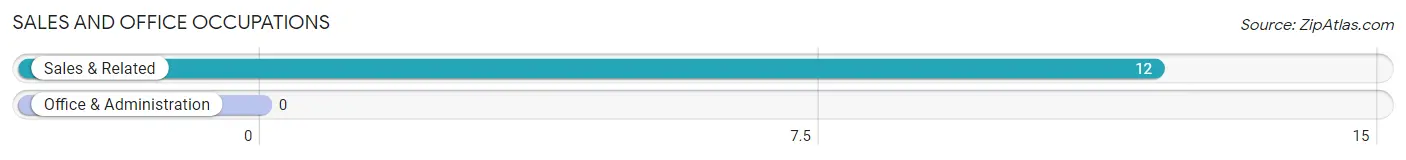
Sales and Office Occupations by Sex
| Occupation | Male | Female |
| Sales & Related | 0 (0.0%) | 12 (100.0%) |
| Office & Administration | 0 (0.0%) | 0 (0.0%) |
| Total (Category) | 0 (0.0%) | 12 (100.0%) |
| Total (Overall) | 92 (41.4%) | 130 (58.6%) |
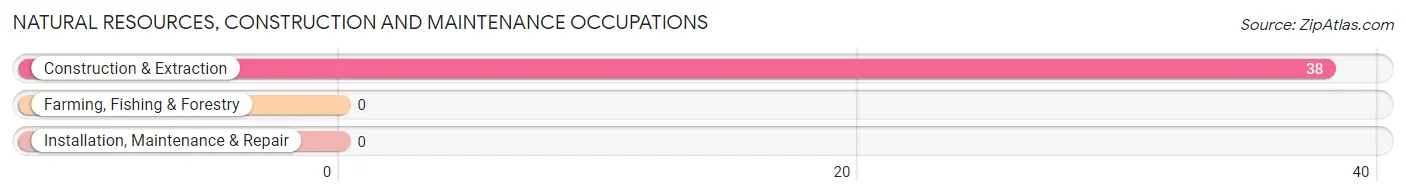
Natural Resources, Construction and Maintenance Occupations
The most common Natural Resources, Construction and Maintenance occupations in Powhatan are , and Construction & Extraction (38 | 17.1%).
Natural Resources, Construction and Maintenance Occupations by Sex
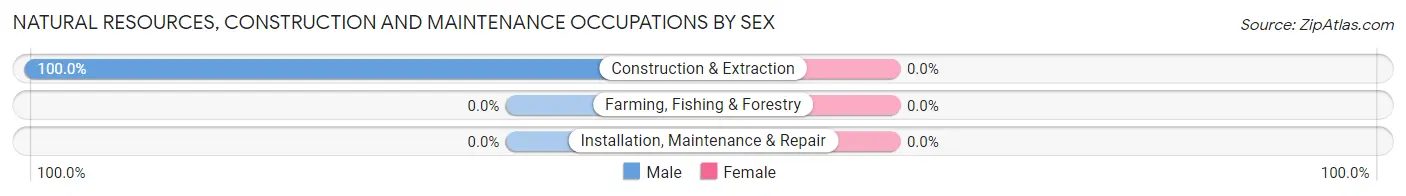
| Occupation | Male | Female |
| Farming, Fishing & Forestry | 0 (0.0%) | 0 (0.0%) |
| Construction & Extraction | 38 (100.0%) | 0 (0.0%) |
| Installation, Maintenance & Repair | 0 (0.0%) | 0 (0.0%) |
| Total (Category) | 38 (100.0%) | 0 (0.0%) |
| Total (Overall) | 92 (41.4%) | 130 (58.6%) |
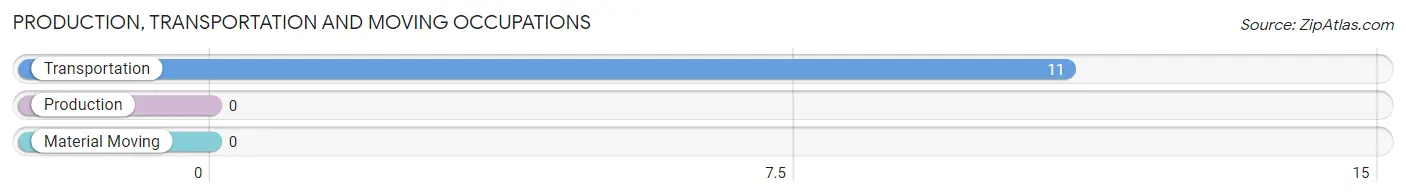
Production, Transportation and Moving Occupations
The most common Production, Transportation and Moving occupations in Powhatan are , and Transportation (11 | 5.0%).
Production, Transportation and Moving Occupations by Sex
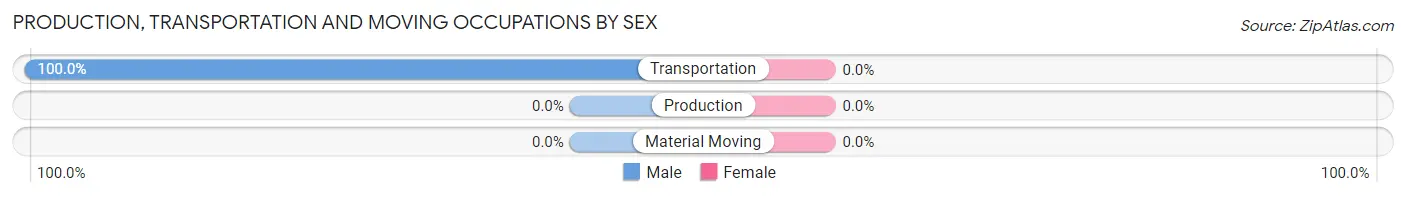
| Occupation | Male | Female |
| Production | 0 (0.0%) | 0 (0.0%) |
| Transportation | 11 (100.0%) | 0 (0.0%) |
| Material Moving | 0 (0.0%) | 0 (0.0%) |
| Total (Category) | 11 (100.0%) | 0 (0.0%) |
| Total (Overall) | 92 (41.4%) | 130 (58.6%) |
Employment Industries by Sex in Powhatan
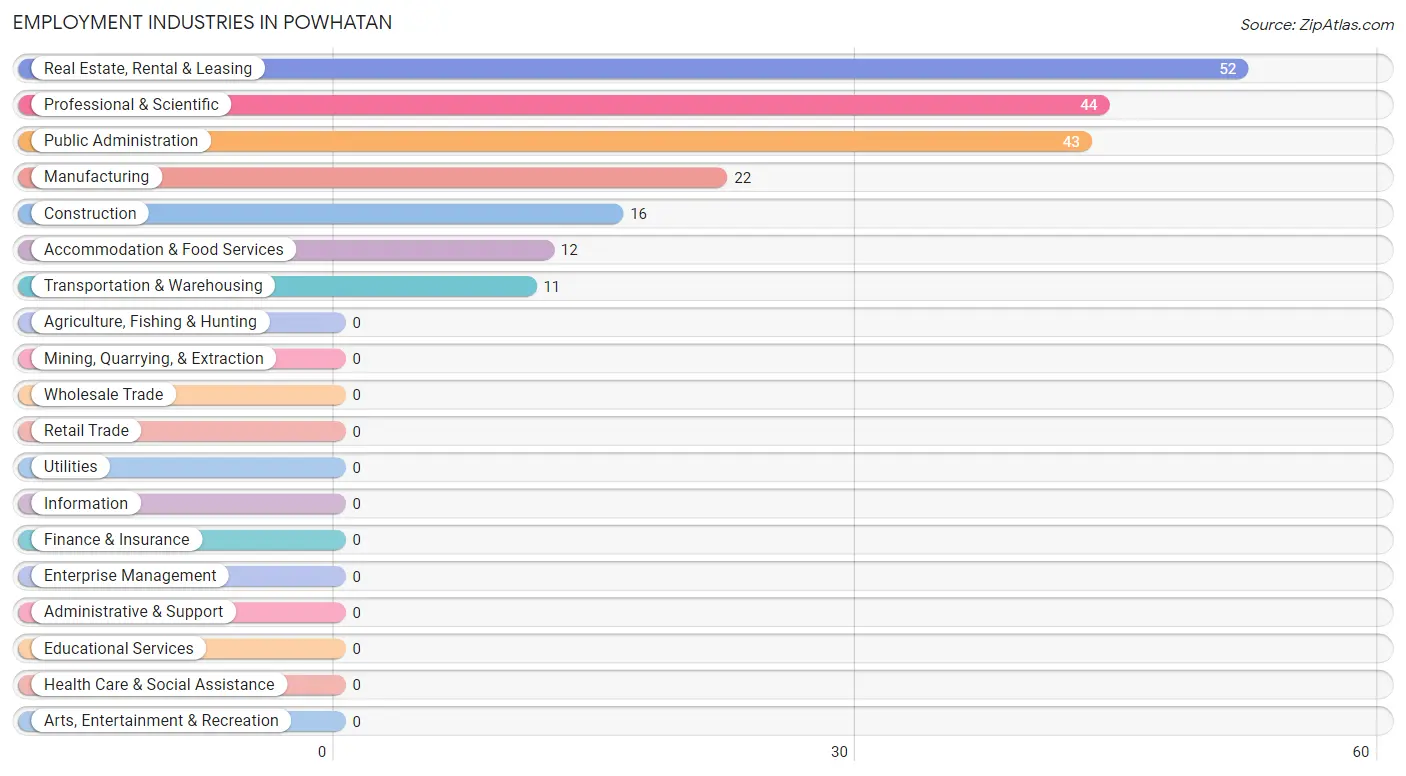
Employment Industries in Powhatan
The major employment industries in Powhatan include Real Estate, Rental & Leasing (52 | 23.4%), Professional & Scientific (44 | 19.8%), Public Administration (43 | 19.4%), Manufacturing (22 | 9.9%), and Construction (16 | 7.2%).
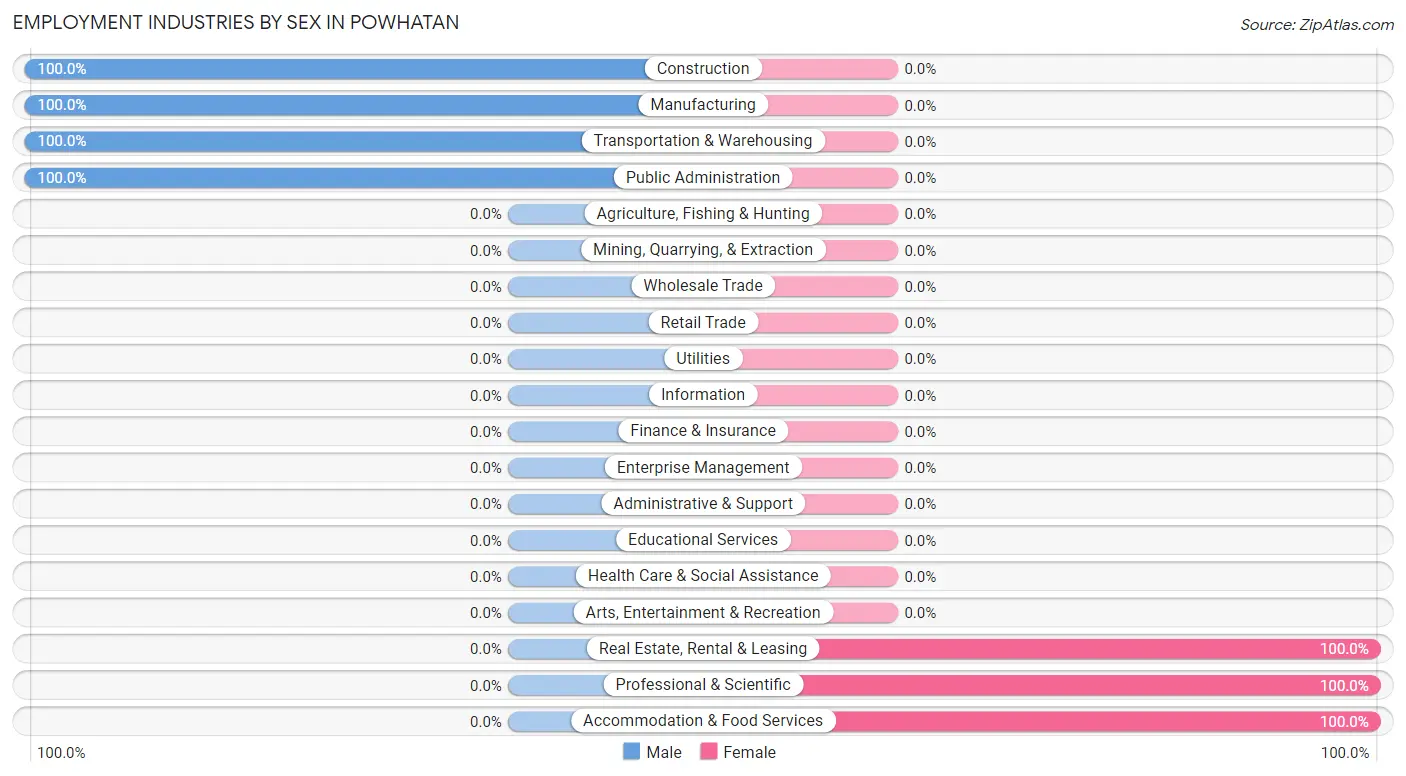
Employment Industries by Sex in Powhatan
The Powhatan industries that see more men than women are Construction (100.0%), Manufacturing (100.0%), and Transportation & Warehousing (100.0%), whereas the industries that tend to have a higher number of women are Real Estate, Rental & Leasing (100.0%), Professional & Scientific (100.0%), and Accommodation & Food Services (100.0%).
| Industry | Male | Female |
| Agriculture, Fishing & Hunting | 0 (0.0%) | 0 (0.0%) |
| Mining, Quarrying, & Extraction | 0 (0.0%) | 0 (0.0%) |
| Construction | 16 (100.0%) | 0 (0.0%) |
| Manufacturing | 22 (100.0%) | 0 (0.0%) |
| Wholesale Trade | 0 (0.0%) | 0 (0.0%) |
| Retail Trade | 0 (0.0%) | 0 (0.0%) |
| Transportation & Warehousing | 11 (100.0%) | 0 (0.0%) |
| Utilities | 0 (0.0%) | 0 (0.0%) |
| Information | 0 (0.0%) | 0 (0.0%) |
| Finance & Insurance | 0 (0.0%) | 0 (0.0%) |
| Real Estate, Rental & Leasing | 0 (0.0%) | 52 (100.0%) |
| Professional & Scientific | 0 (0.0%) | 44 (100.0%) |
| Enterprise Management | 0 (0.0%) | 0 (0.0%) |
| Administrative & Support | 0 (0.0%) | 0 (0.0%) |
| Educational Services | 0 (0.0%) | 0 (0.0%) |
| Health Care & Social Assistance | 0 (0.0%) | 0 (0.0%) |
| Arts, Entertainment & Recreation | 0 (0.0%) | 0 (0.0%) |
| Accommodation & Food Services | 0 (0.0%) | 12 (100.0%) |
| Public Administration | 43 (100.0%) | 0 (0.0%) |
| Total | 92 (41.4%) | 130 (58.6%) |
Education in Powhatan
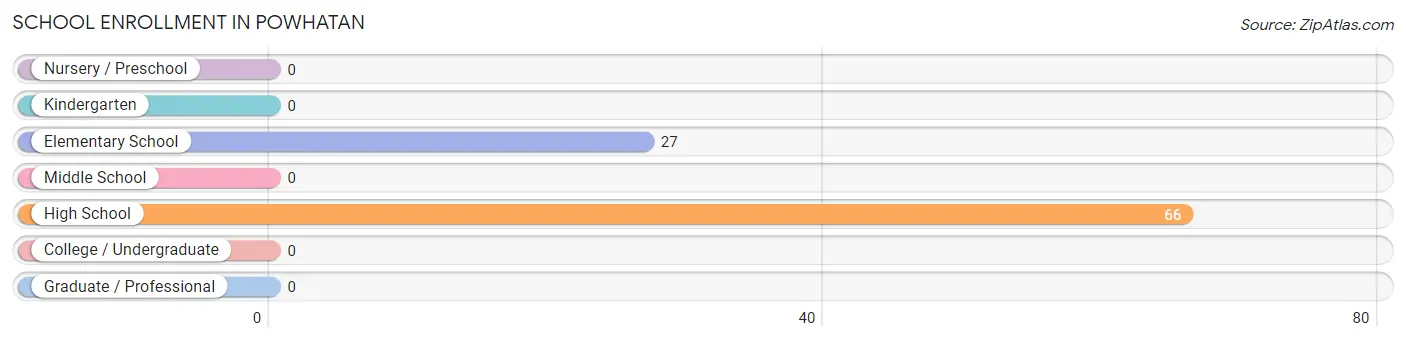
School Enrollment in Powhatan
The most common levels of schooling among the 93 students in Powhatan are high school (66 | 71.0%), and elementary school (27 | 29.0%).
| School Level | # Students | % Students |
| Nursery / Preschool | 0 | 0.0% |
| Kindergarten | 0 | 0.0% |
| Elementary School | 27 | 29.0% |
| Middle School | 0 | 0.0% |
| High School | 66 | 71.0% |
| College / Undergraduate | 0 | 0.0% |
| Graduate / Professional | 0 | 0.0% |
| Total | 93 | 100.0% |
School Enrollment by Age by Funding Source in Powhatan
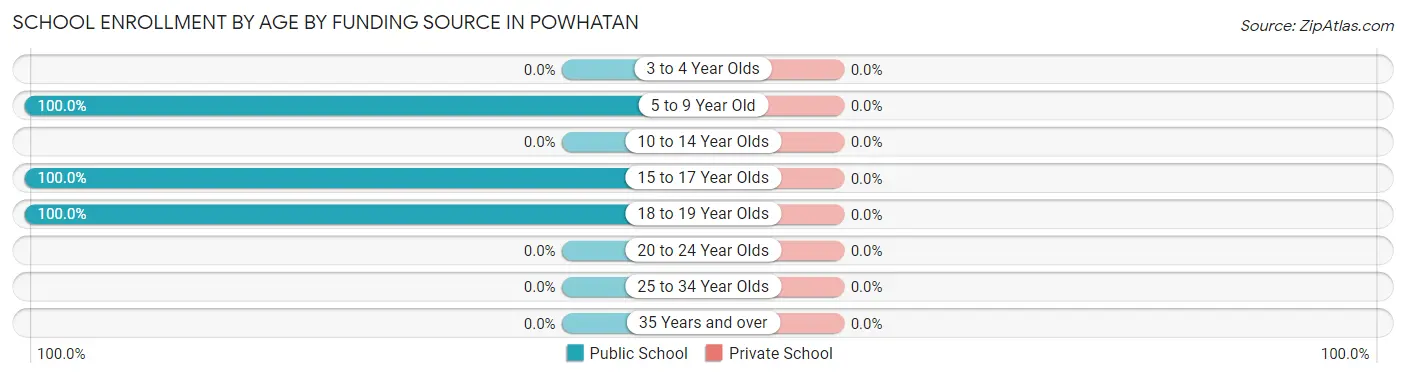
| Age Bracket | Public School | Private School |
| 3 to 4 Year Olds | 0 (0.0%) | 0 (0.0%) |
| 5 to 9 Year Old | 27 (100.0%) | 0 (0.0%) |
| 10 to 14 Year Olds | 0 (0.0%) | 0 (0.0%) |
| 15 to 17 Year Olds | 37 (100.0%) | 0 (0.0%) |
| 18 to 19 Year Olds | 29 (100.0%) | 0 (0.0%) |
| 20 to 24 Year Olds | 0 (0.0%) | 0 (0.0%) |
| 25 to 34 Year Olds | 0 (0.0%) | 0 (0.0%) |
| 35 Years and over | 0 (0.0%) | 0 (0.0%) |
| Total | 93 (100.0%) | 0 (0.0%) |
Educational Attainment by Field of Study in Powhatan
Education (33 | 34.4%), business (29 | 30.2%), physical & health sciences (17 | 17.7%), and science & technology (17 | 17.7%) are the most common fields of study among 96 individuals in Powhatan who have obtained a bachelor's degree or higher.
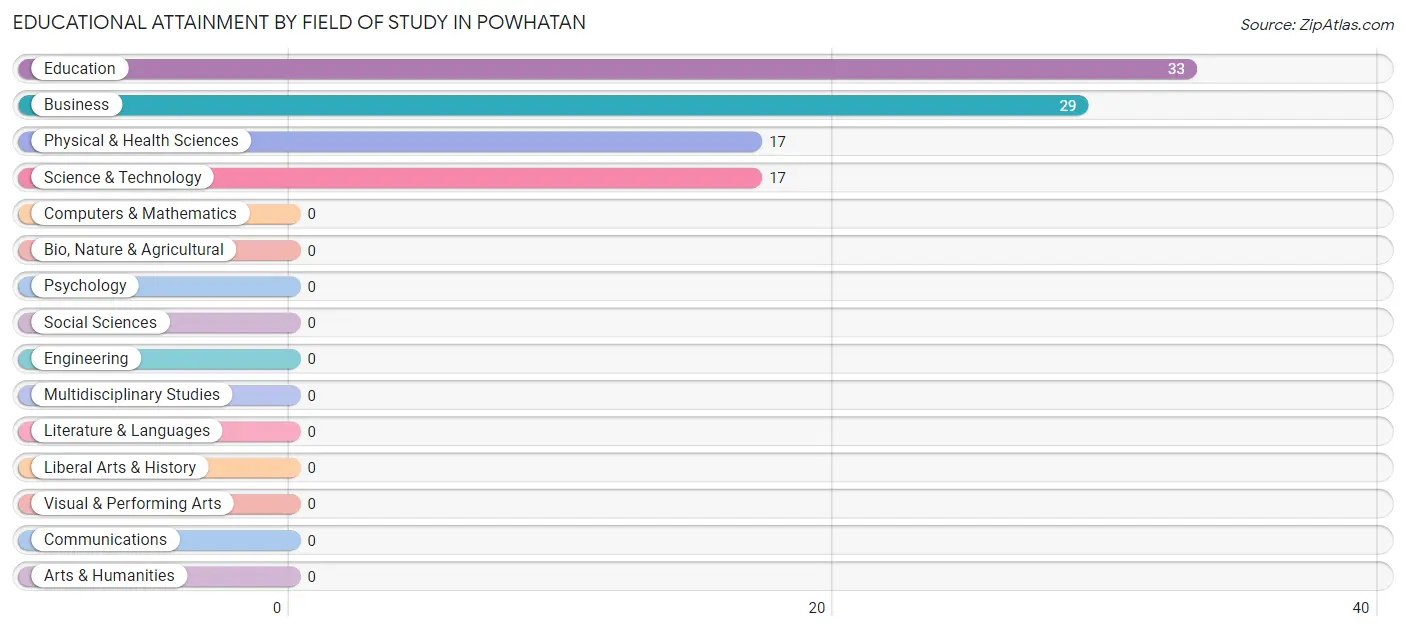
| Field of Study | # Graduates | % Graduates |
| Computers & Mathematics | 0 | 0.0% |
| Bio, Nature & Agricultural | 0 | 0.0% |
| Physical & Health Sciences | 17 | 17.7% |
| Psychology | 0 | 0.0% |
| Social Sciences | 0 | 0.0% |
| Engineering | 0 | 0.0% |
| Multidisciplinary Studies | 0 | 0.0% |
| Science & Technology | 17 | 17.7% |
| Business | 29 | 30.2% |
| Education | 33 | 34.4% |
| Literature & Languages | 0 | 0.0% |
| Liberal Arts & History | 0 | 0.0% |
| Visual & Performing Arts | 0 | 0.0% |
| Communications | 0 | 0.0% |
| Arts & Humanities | 0 | 0.0% |
| Total | 96 | 100.0% |
Transportation & Commute in Powhatan
Vehicle Availability by Sex in Powhatan
The most prevalent vehicle ownership categories in Powhatan are males with 3 vehicles (49, accounting for 53.3%) and females with 3 vehicles (12, making up 37.7%).
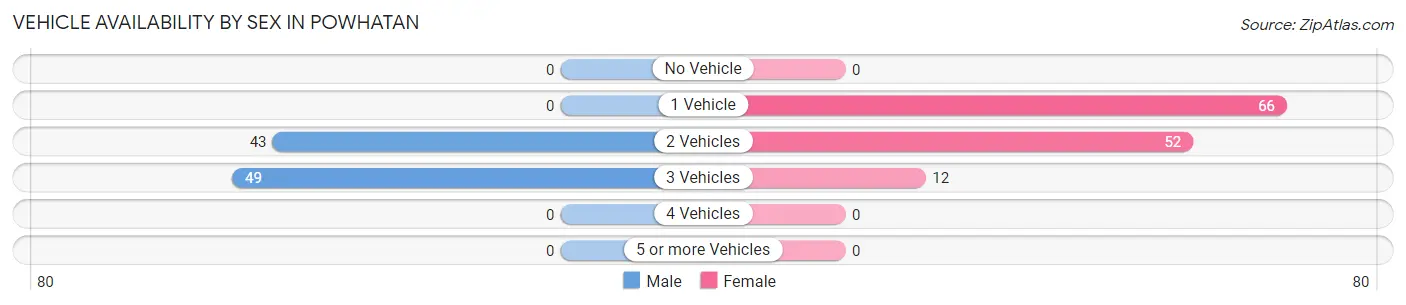
| Vehicles Available | Male | Female |
| No Vehicle | 0 (0.0%) | 0 (0.0%) |
| 1 Vehicle | 0 (0.0%) | 66 (50.8%) |
| 2 Vehicles | 43 (46.7%) | 52 (40.0%) |
| 3 Vehicles | 49 (53.3%) | 12 (9.2%) |
| 4 Vehicles | 0 (0.0%) | 0 (0.0%) |
| 5 or more Vehicles | 0 (0.0%) | 0 (0.0%) |
| Total | 92 (100.0%) | 130 (100.0%) |
Commute Time in Powhatan
The most frequently occuring commute durations in Powhatan are 40 to 44 minutes (59 commuters, 26.6%), 30 to 34 minutes (56 commuters, 25.2%), and 10 to 14 minutes (52 commuters, 23.4%).
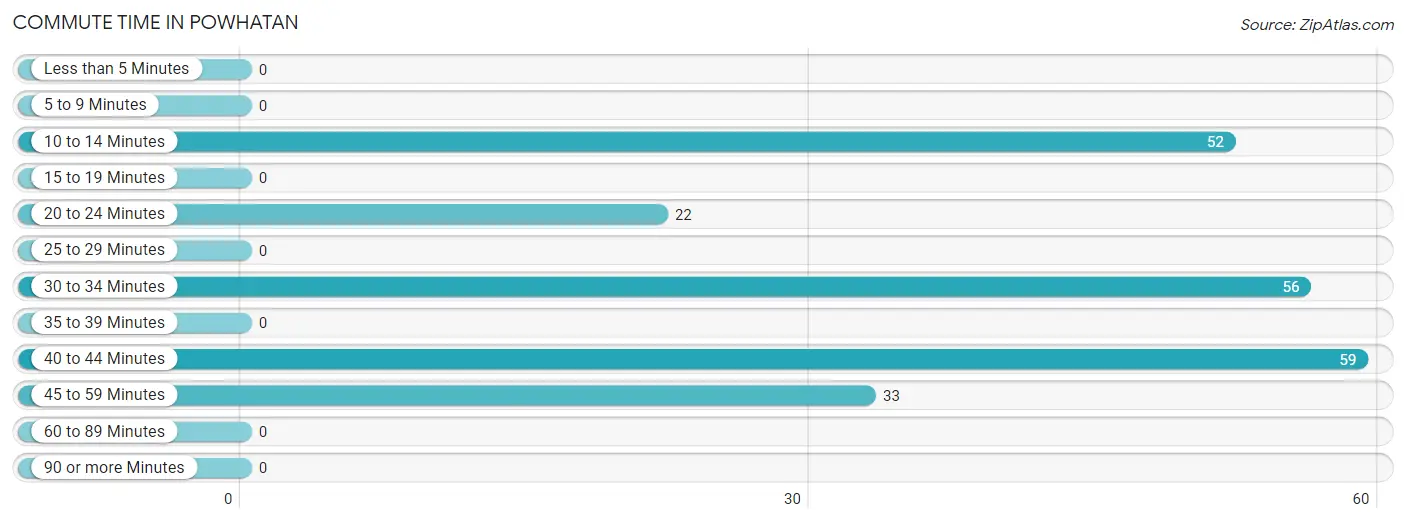
| Commute Time | # Commuters | % Commuters |
| Less than 5 Minutes | 0 | 0.0% |
| 5 to 9 Minutes | 0 | 0.0% |
| 10 to 14 Minutes | 52 | 23.4% |
| 15 to 19 Minutes | 0 | 0.0% |
| 20 to 24 Minutes | 22 | 9.9% |
| 25 to 29 Minutes | 0 | 0.0% |
| 30 to 34 Minutes | 56 | 25.2% |
| 35 to 39 Minutes | 0 | 0.0% |
| 40 to 44 Minutes | 59 | 26.6% |
| 45 to 59 Minutes | 33 | 14.9% |
| 60 to 89 Minutes | 0 | 0.0% |
| 90 or more Minutes | 0 | 0.0% |
Commute Time by Sex in Powhatan
The most common commute times in Powhatan are 40 to 44 minutes (59 commuters, 64.1%) for males and 30 to 34 minutes (56 commuters, 43.1%) for females.
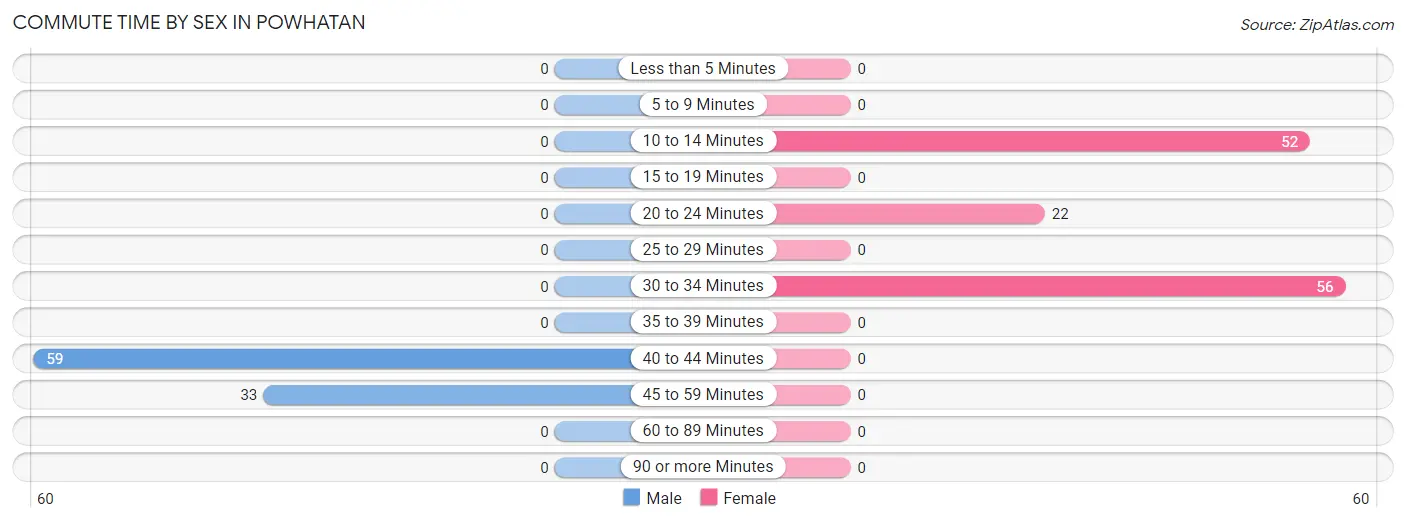
| Commute Time | Male | Female |
| Less than 5 Minutes | 0 (0.0%) | 0 (0.0%) |
| 5 to 9 Minutes | 0 (0.0%) | 0 (0.0%) |
| 10 to 14 Minutes | 0 (0.0%) | 52 (40.0%) |
| 15 to 19 Minutes | 0 (0.0%) | 0 (0.0%) |
| 20 to 24 Minutes | 0 (0.0%) | 22 (16.9%) |
| 25 to 29 Minutes | 0 (0.0%) | 0 (0.0%) |
| 30 to 34 Minutes | 0 (0.0%) | 56 (43.1%) |
| 35 to 39 Minutes | 0 (0.0%) | 0 (0.0%) |
| 40 to 44 Minutes | 59 (64.1%) | 0 (0.0%) |
| 45 to 59 Minutes | 33 (35.9%) | 0 (0.0%) |
| 60 to 89 Minutes | 0 (0.0%) | 0 (0.0%) |
| 90 or more Minutes | 0 (0.0%) | 0 (0.0%) |
Time of Departure to Work by Sex in Powhatan
The most frequent times of departure to work in Powhatan are 5:00 AM to 5:29 AM (43, 46.7%) for males and 6:00 AM to 6:29 AM (52, 40.0%) for females.
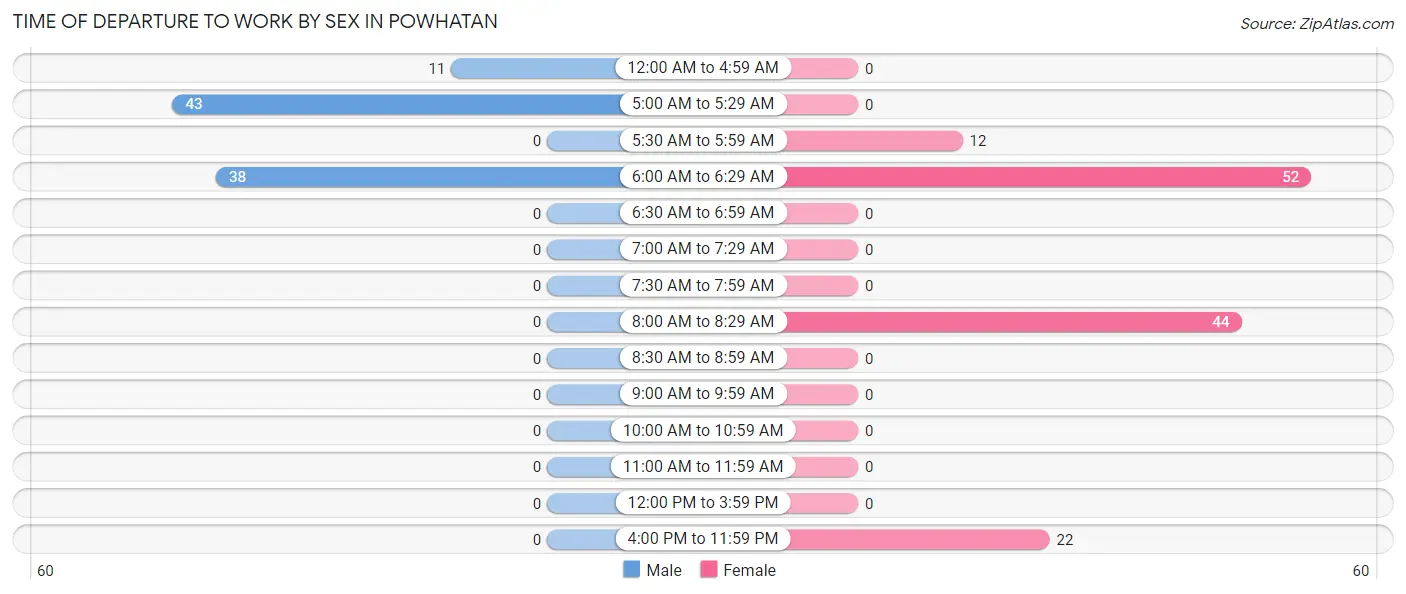
| Time of Departure | Male | Female |
| 12:00 AM to 4:59 AM | 11 (12.0%) | 0 (0.0%) |
| 5:00 AM to 5:29 AM | 43 (46.7%) | 0 (0.0%) |
| 5:30 AM to 5:59 AM | 0 (0.0%) | 12 (9.2%) |
| 6:00 AM to 6:29 AM | 38 (41.3%) | 52 (40.0%) |
| 6:30 AM to 6:59 AM | 0 (0.0%) | 0 (0.0%) |
| 7:00 AM to 7:29 AM | 0 (0.0%) | 0 (0.0%) |
| 7:30 AM to 7:59 AM | 0 (0.0%) | 0 (0.0%) |
| 8:00 AM to 8:29 AM | 0 (0.0%) | 44 (33.9%) |
| 8:30 AM to 8:59 AM | 0 (0.0%) | 0 (0.0%) |
| 9:00 AM to 9:59 AM | 0 (0.0%) | 0 (0.0%) |
| 10:00 AM to 10:59 AM | 0 (0.0%) | 0 (0.0%) |
| 11:00 AM to 11:59 AM | 0 (0.0%) | 0 (0.0%) |
| 12:00 PM to 3:59 PM | 0 (0.0%) | 0 (0.0%) |
| 4:00 PM to 11:59 PM | 0 (0.0%) | 22 (16.9%) |
| Total | 92 (100.0%) | 130 (100.0%) |
Housing Occupancy in Powhatan
Occupancy by Ownership in Powhatan
Of the total 246 dwellings in Powhatan, owner-occupied units account for 168 (68.3%), while renter-occupied units make up 78 (31.7%).
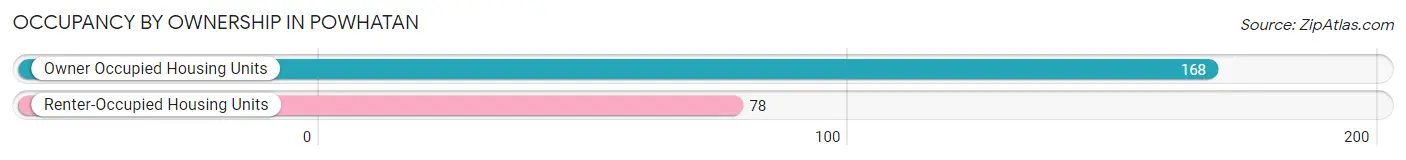
| Occupancy | # Housing Units | % Housing Units |
| Owner Occupied Housing Units | 168 | 68.3% |
| Renter-Occupied Housing Units | 78 | 31.7% |
| Total Occupied Housing Units | 246 | 100.0% |
Occupancy by Household Size in Powhatan
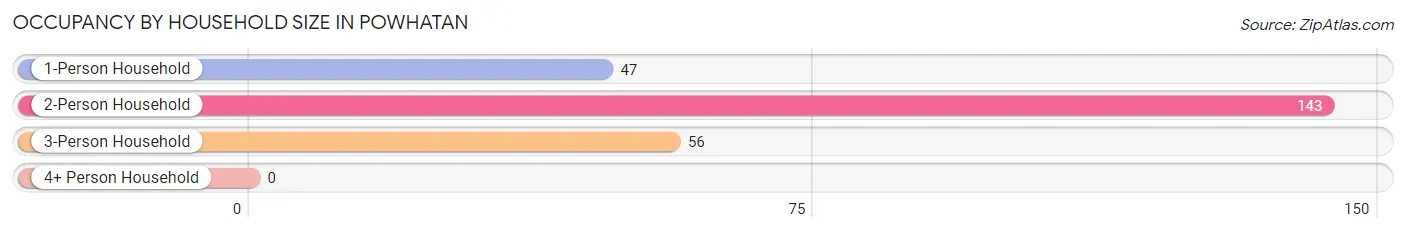
| Household Size | # Housing Units | % Housing Units |
| 1-Person Household | 47 | 19.1% |
| 2-Person Household | 143 | 58.1% |
| 3-Person Household | 56 | 22.8% |
| 4+ Person Household | 0 | 0.0% |
| Total Housing Units | 246 | 100.0% |
Occupancy by Ownership by Household Size in Powhatan
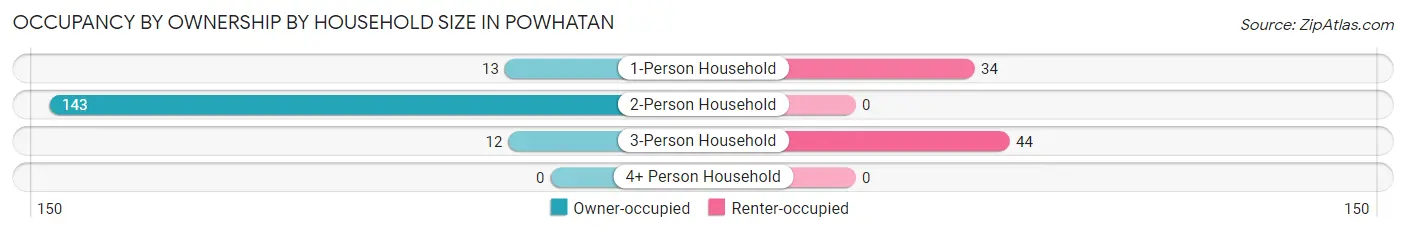
| Household Size | Owner-occupied | Renter-occupied |
| 1-Person Household | 13 (27.7%) | 34 (72.3%) |
| 2-Person Household | 143 (100.0%) | 0 (0.0%) |
| 3-Person Household | 12 (21.4%) | 44 (78.6%) |
| 4+ Person Household | 0 (0.0%) | 0 (0.0%) |
| Total Housing Units | 168 (68.3%) | 78 (31.7%) |
Occupancy by Educational Attainment in Powhatan
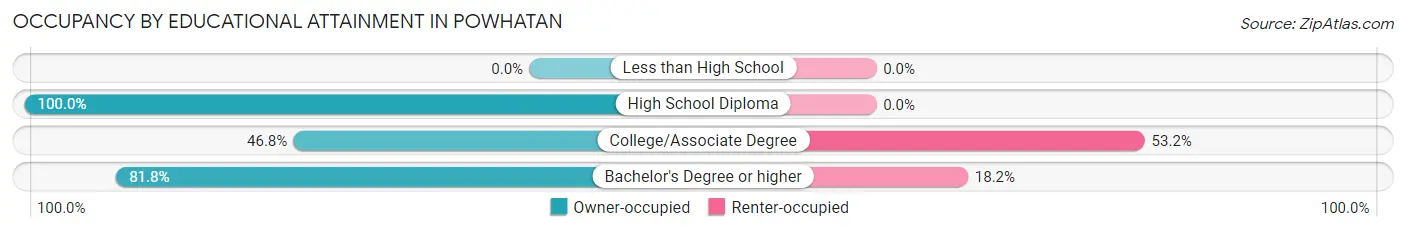
| Household Size | Owner-occupied | Renter-occupied |
| Less than High School | 0 (0.0%) | 0 (0.0%) |
| High School Diploma | 56 (100.0%) | 0 (0.0%) |
| College/Associate Degree | 58 (46.8%) | 66 (53.2%) |
| Bachelor's Degree or higher | 54 (81.8%) | 12 (18.2%) |
Occupancy by Age of Householder in Powhatan
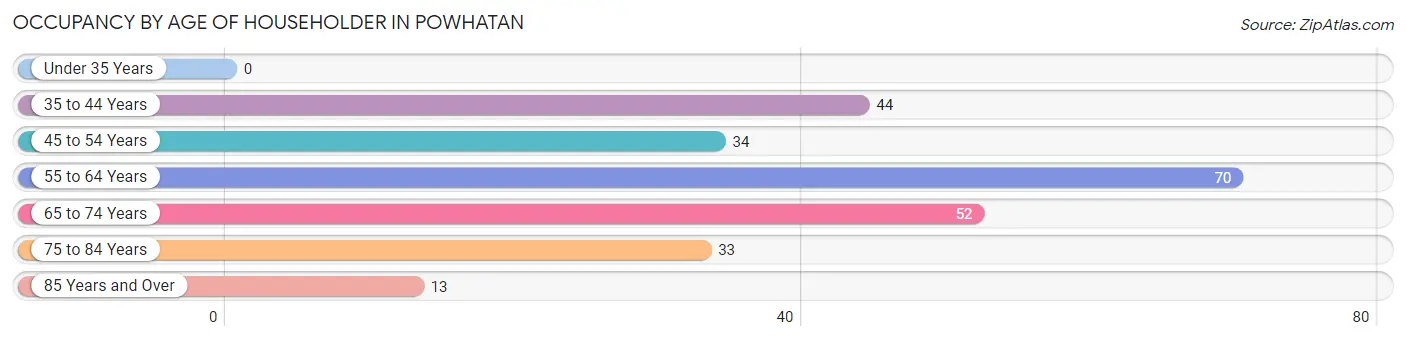
| Age Bracket | # Households | % Households |
| Under 35 Years | 0 | 0.0% |
| 35 to 44 Years | 44 | 17.9% |
| 45 to 54 Years | 34 | 13.8% |
| 55 to 64 Years | 70 | 28.5% |
| 65 to 74 Years | 52 | 21.1% |
| 75 to 84 Years | 33 | 13.4% |
| 85 Years and Over | 13 | 5.3% |
| Total | 246 | 100.0% |
Housing Finances in Powhatan
Median Income by Occupancy in Powhatan
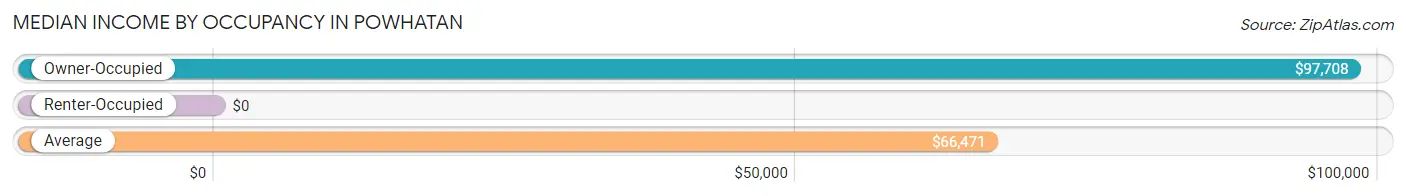
| Occupancy Type | # Households | Median Income |
| Owner-Occupied | 168 (68.3%) | $97,708 |
| Renter-Occupied | 78 (31.7%) | $0 |
| Average | 246 (100.0%) | $66,471 |
Occupancy by Householder Income Bracket in Powhatan
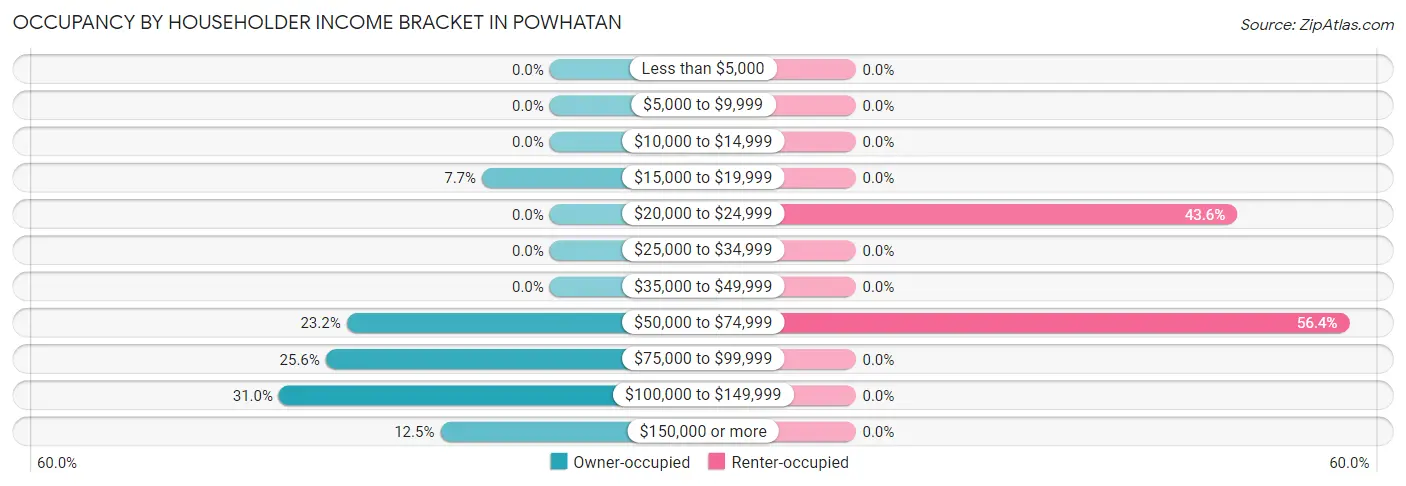
| Income Bracket | Owner-occupied | Renter-occupied |
| Less than $5,000 | 0 (0.0%) | 0 (0.0%) |
| $5,000 to $9,999 | 0 (0.0%) | 0 (0.0%) |
| $10,000 to $14,999 | 0 (0.0%) | 0 (0.0%) |
| $15,000 to $19,999 | 13 (7.7%) | 0 (0.0%) |
| $20,000 to $24,999 | 0 (0.0%) | 34 (43.6%) |
| $25,000 to $34,999 | 0 (0.0%) | 0 (0.0%) |
| $35,000 to $49,999 | 0 (0.0%) | 0 (0.0%) |
| $50,000 to $74,999 | 39 (23.2%) | 44 (56.4%) |
| $75,000 to $99,999 | 43 (25.6%) | 0 (0.0%) |
| $100,000 to $149,999 | 52 (30.9%) | 0 (0.0%) |
| $150,000 or more | 21 (12.5%) | 0 (0.0%) |
| Total | 168 (100.0%) | 78 (100.0%) |
Monthly Housing Cost Tiers in Powhatan
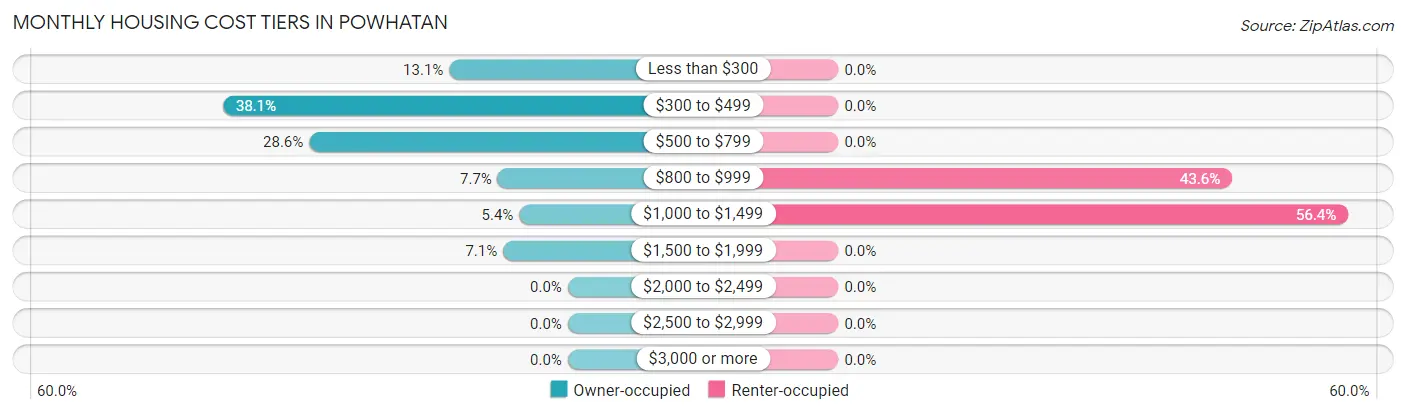
| Monthly Cost | Owner-occupied | Renter-occupied |
| Less than $300 | 22 (13.1%) | 0 (0.0%) |
| $300 to $499 | 64 (38.1%) | 0 (0.0%) |
| $500 to $799 | 48 (28.6%) | 0 (0.0%) |
| $800 to $999 | 13 (7.7%) | 34 (43.6%) |
| $1,000 to $1,499 | 9 (5.4%) | 44 (56.4%) |
| $1,500 to $1,999 | 12 (7.1%) | 0 (0.0%) |
| $2,000 to $2,499 | 0 (0.0%) | 0 (0.0%) |
| $2,500 to $2,999 | 0 (0.0%) | 0 (0.0%) |
| $3,000 or more | 0 (0.0%) | 0 (0.0%) |
| Total | 168 (100.0%) | 78 (100.0%) |
Physical Housing Characteristics in Powhatan
Housing Structures in Powhatan
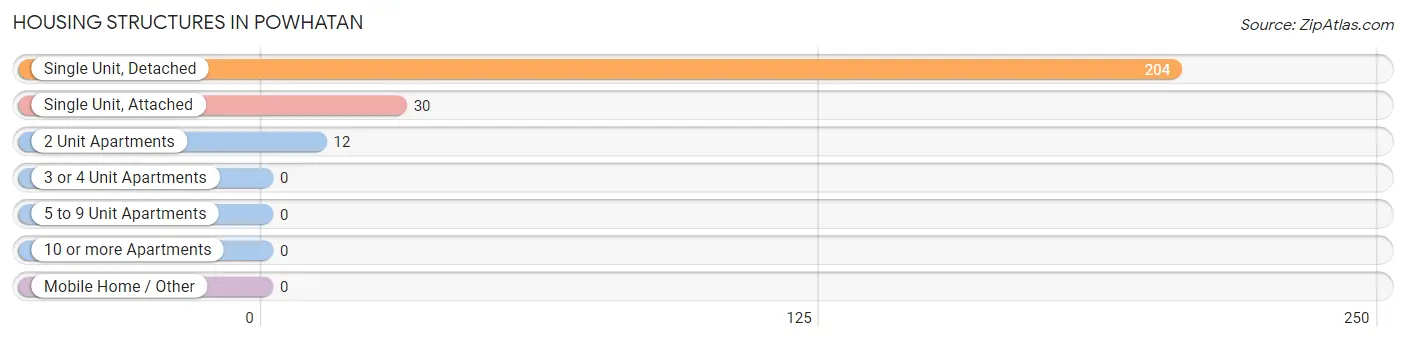
| Structure Type | # Housing Units | % Housing Units |
| Single Unit, Detached | 204 | 82.9% |
| Single Unit, Attached | 30 | 12.2% |
| 2 Unit Apartments | 12 | 4.9% |
| 3 or 4 Unit Apartments | 0 | 0.0% |
| 5 to 9 Unit Apartments | 0 | 0.0% |
| 10 or more Apartments | 0 | 0.0% |
| Mobile Home / Other | 0 | 0.0% |
| Total | 246 | 100.0% |
Housing Structures by Occupancy in Powhatan
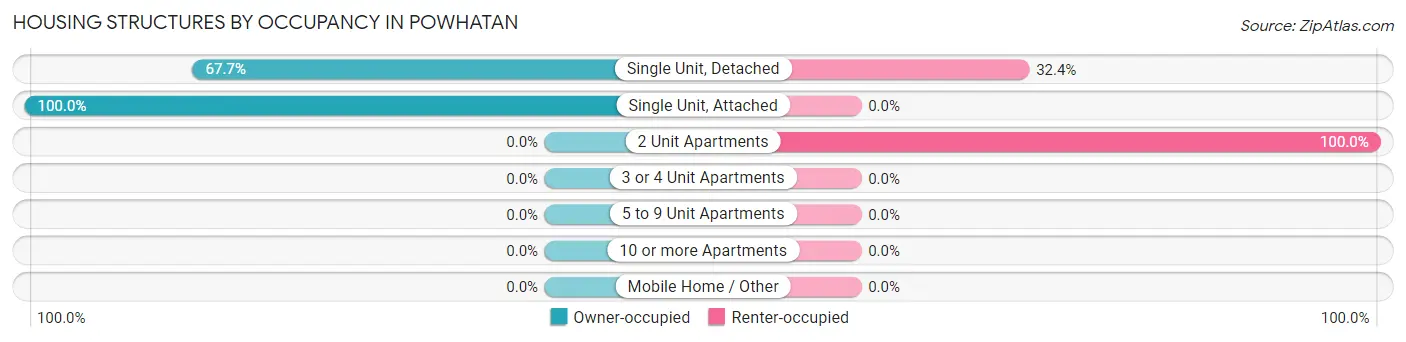
| Structure Type | Owner-occupied | Renter-occupied |
| Single Unit, Detached | 138 (67.6%) | 66 (32.4%) |
| Single Unit, Attached | 30 (100.0%) | 0 (0.0%) |
| 2 Unit Apartments | 0 (0.0%) | 12 (100.0%) |
| 3 or 4 Unit Apartments | 0 (0.0%) | 0 (0.0%) |
| 5 to 9 Unit Apartments | 0 (0.0%) | 0 (0.0%) |
| 10 or more Apartments | 0 (0.0%) | 0 (0.0%) |
| Mobile Home / Other | 0 (0.0%) | 0 (0.0%) |
| Total | 168 (68.3%) | 78 (31.7%) |
Housing Structures by Number of Rooms in Powhatan
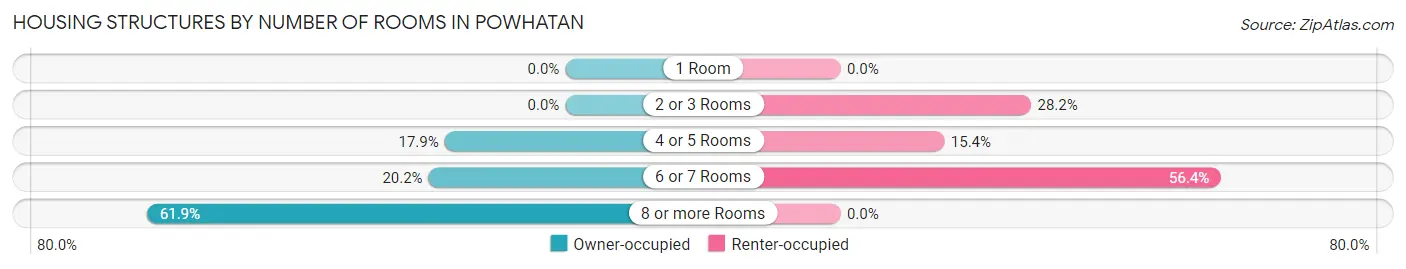
| Number of Rooms | Owner-occupied | Renter-occupied |
| 1 Room | 0 (0.0%) | 0 (0.0%) |
| 2 or 3 Rooms | 0 (0.0%) | 22 (28.2%) |
| 4 or 5 Rooms | 30 (17.9%) | 12 (15.4%) |
| 6 or 7 Rooms | 34 (20.2%) | 44 (56.4%) |
| 8 or more Rooms | 104 (61.9%) | 0 (0.0%) |
| Total | 168 (100.0%) | 78 (100.0%) |
Housing Structure by Heating Type in Powhatan
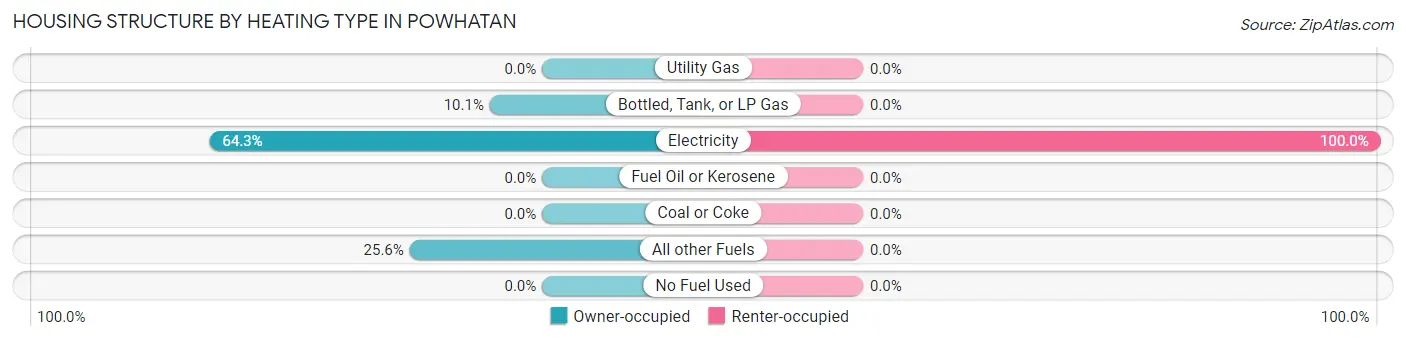
| Heating Type | Owner-occupied | Renter-occupied |
| Utility Gas | 0 (0.0%) | 0 (0.0%) |
| Bottled, Tank, or LP Gas | 17 (10.1%) | 0 (0.0%) |
| Electricity | 108 (64.3%) | 78 (100.0%) |
| Fuel Oil or Kerosene | 0 (0.0%) | 0 (0.0%) |
| Coal or Coke | 0 (0.0%) | 0 (0.0%) |
| All other Fuels | 43 (25.6%) | 0 (0.0%) |
| No Fuel Used | 0 (0.0%) | 0 (0.0%) |
| Total | 168 (100.0%) | 78 (100.0%) |
Household Vehicle Usage in Powhatan
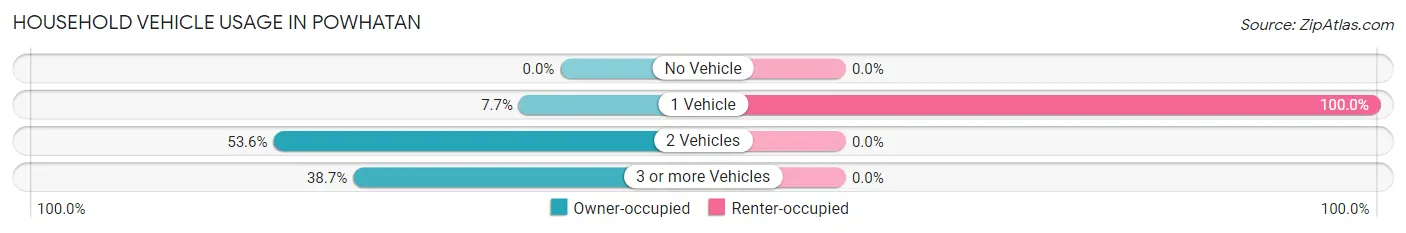
| Vehicles per Household | Owner-occupied | Renter-occupied |
| No Vehicle | 0 (0.0%) | 0 (0.0%) |
| 1 Vehicle | 13 (7.7%) | 78 (100.0%) |
| 2 Vehicles | 90 (53.6%) | 0 (0.0%) |
| 3 or more Vehicles | 65 (38.7%) | 0 (0.0%) |
| Total | 168 (100.0%) | 78 (100.0%) |
Real Estate & Mortgages in Powhatan
Real Estate and Mortgage Overview in Powhatan
| Characteristic | Without Mortgage | With Mortgage |
| Housing Units | 134 | 34 |
| Median Property Value | $311,800 | $0 |
| Median Household Income | - | - |
| Monthly Housing Costs | $410 | $0 |
| Real Estate Taxes | $2,095 | $0 |
Property Value by Mortgage Status in Powhatan
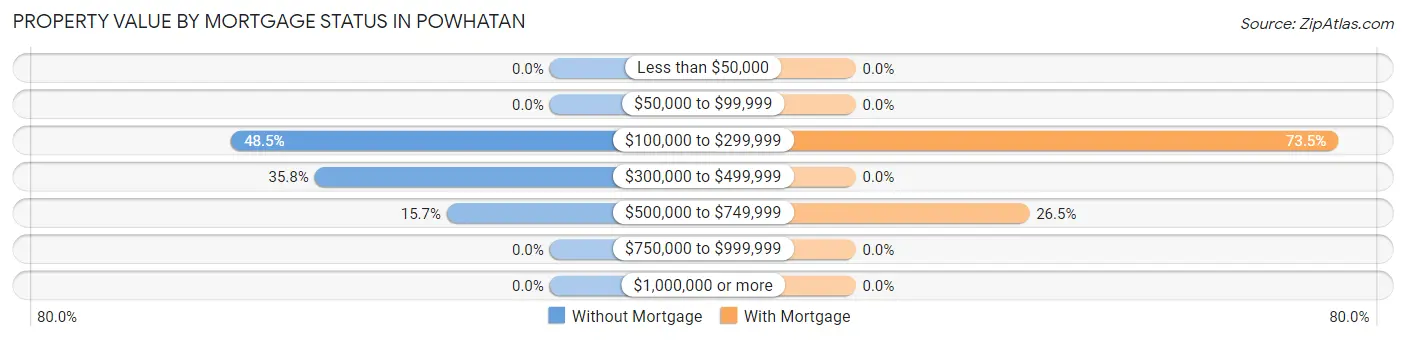
| Property Value | Without Mortgage | With Mortgage |
| Less than $50,000 | 0 (0.0%) | 0 (0.0%) |
| $50,000 to $99,999 | 0 (0.0%) | 0 (0.0%) |
| $100,000 to $299,999 | 65 (48.5%) | 25 (73.5%) |
| $300,000 to $499,999 | 48 (35.8%) | 0 (0.0%) |
| $500,000 to $749,999 | 21 (15.7%) | 9 (26.5%) |
| $750,000 to $999,999 | 0 (0.0%) | 0 (0.0%) |
| $1,000,000 or more | 0 (0.0%) | 0 (0.0%) |
| Total | 134 (100.0%) | 34 (100.0%) |
Household Income by Mortgage Status in Powhatan
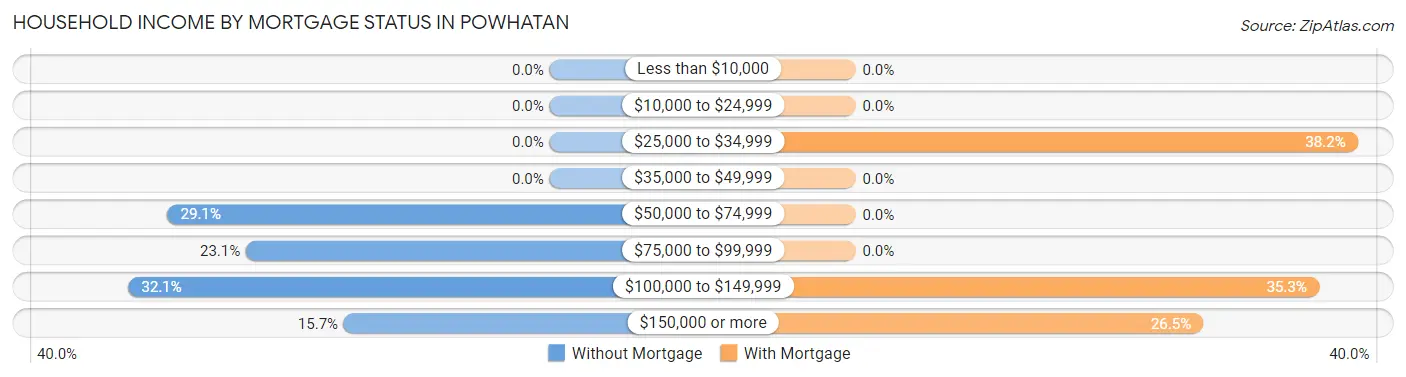
| Household Income | Without Mortgage | With Mortgage |
| Less than $10,000 | 0 (0.0%) | 0 (0.0%) |
| $10,000 to $24,999 | 0 (0.0%) | 0 (0.0%) |
| $25,000 to $34,999 | 0 (0.0%) | 13 (38.2%) |
| $35,000 to $49,999 | 0 (0.0%) | 0 (0.0%) |
| $50,000 to $74,999 | 39 (29.1%) | 0 (0.0%) |
| $75,000 to $99,999 | 31 (23.1%) | 0 (0.0%) |
| $100,000 to $149,999 | 43 (32.1%) | 12 (35.3%) |
| $150,000 or more | 21 (15.7%) | 9 (26.5%) |
| Total | 134 (100.0%) | 34 (100.0%) |
Property Value to Household Income Ratio in Powhatan
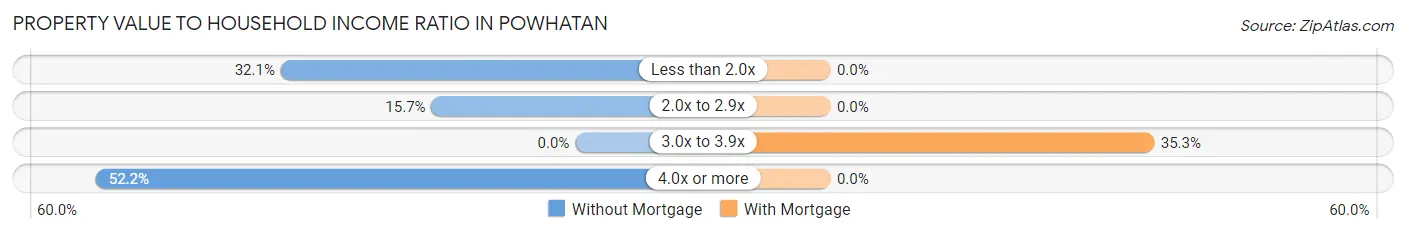
| Value-to-Income Ratio | Without Mortgage | With Mortgage |
| Less than 2.0x | 43 (32.1%) | 0 (0.0%) |
| 2.0x to 2.9x | 21 (15.7%) | 0 (0.0%) |
| 3.0x to 3.9x | 0 (0.0%) | 12 (35.3%) |
| 4.0x or more | 70 (52.2%) | 0 (0.0%) |
| Total | 134 (100.0%) | 34 (100.0%) |
Real Estate Taxes by Mortgage Status in Powhatan
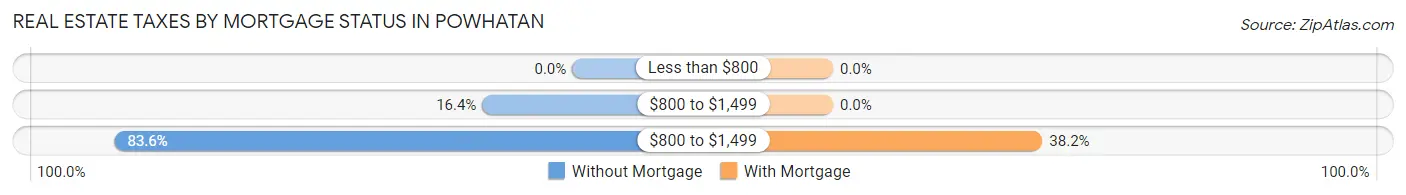
| Property Taxes | Without Mortgage | With Mortgage |
| Less than $800 | 0 (0.0%) | 0 (0.0%) |
| $800 to $1,499 | 22 (16.4%) | 0 (0.0%) |
| $800 to $1,499 | 112 (83.6%) | 13 (38.2%) |
| Total | 134 (100.0%) | 34 (100.0%) |
Health & Disability in Powhatan
Health Insurance Coverage by Age in Powhatan
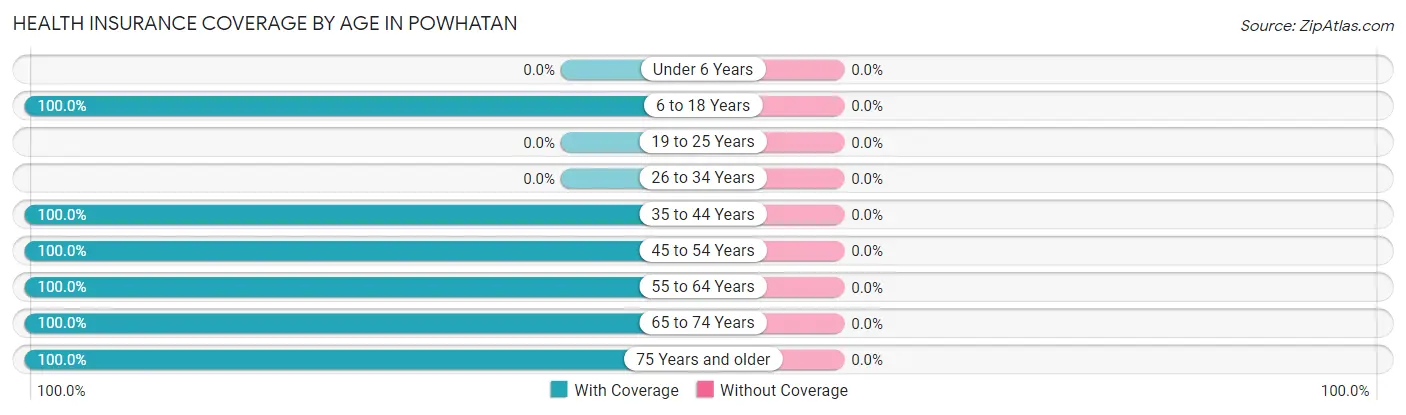
| Age Bracket | With Coverage | Without Coverage |
| Under 6 Years | 0 (0.0%) | 0 (0.0%) |
| 6 to 18 Years | 93 (100.0%) | 0 (0.0%) |
| 19 to 25 Years | 0 (0.0%) | 0 (0.0%) |
| 26 to 34 Years | 0 (0.0%) | 0 (0.0%) |
| 35 to 44 Years | 44 (100.0%) | 0 (0.0%) |
| 45 to 54 Years | 45 (100.0%) | 0 (0.0%) |
| 55 to 64 Years | 138 (100.0%) | 0 (0.0%) |
| 65 to 74 Years | 74 (100.0%) | 0 (0.0%) |
| 75 Years and older | 79 (100.0%) | 0 (0.0%) |
| Total | 473 (100.0%) | 0 (0.0%) |
Health Insurance Coverage by Citizenship Status in Powhatan
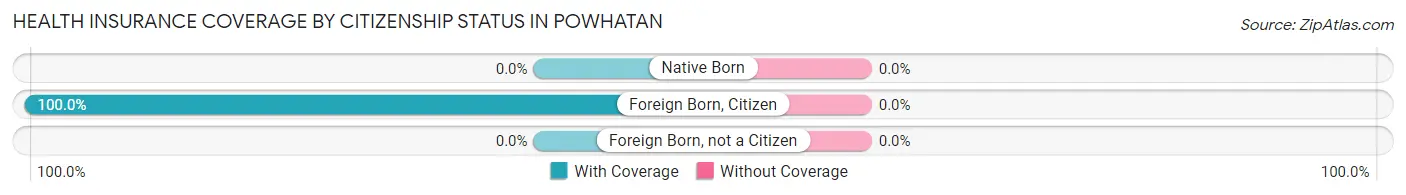
| Citizenship Status | With Coverage | Without Coverage |
| Native Born | 0 (0.0%) | 0 (0.0%) |
| Foreign Born, Citizen | 93 (100.0%) | 0 (0.0%) |
| Foreign Born, not a Citizen | 0 (0.0%) | 0 (0.0%) |
Health Insurance Coverage by Household Income in Powhatan
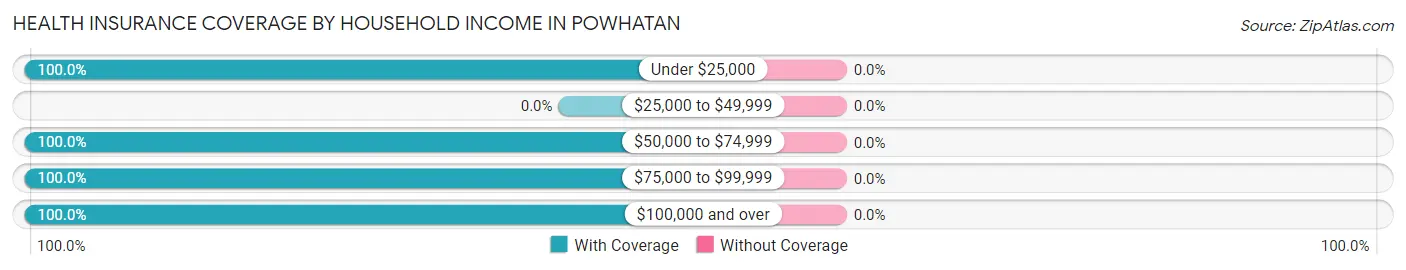
| Household Income | With Coverage | Without Coverage |
| Under $25,000 | 47 (100.0%) | 0 (0.0%) |
| $25,000 to $49,999 | 0 (0.0%) | 0 (0.0%) |
| $50,000 to $74,999 | 165 (100.0%) | 0 (0.0%) |
| $75,000 to $99,999 | 114 (100.0%) | 0 (0.0%) |
| $100,000 and over | 147 (100.0%) | 0 (0.0%) |
Public vs Private Health Insurance Coverage by Age in Powhatan
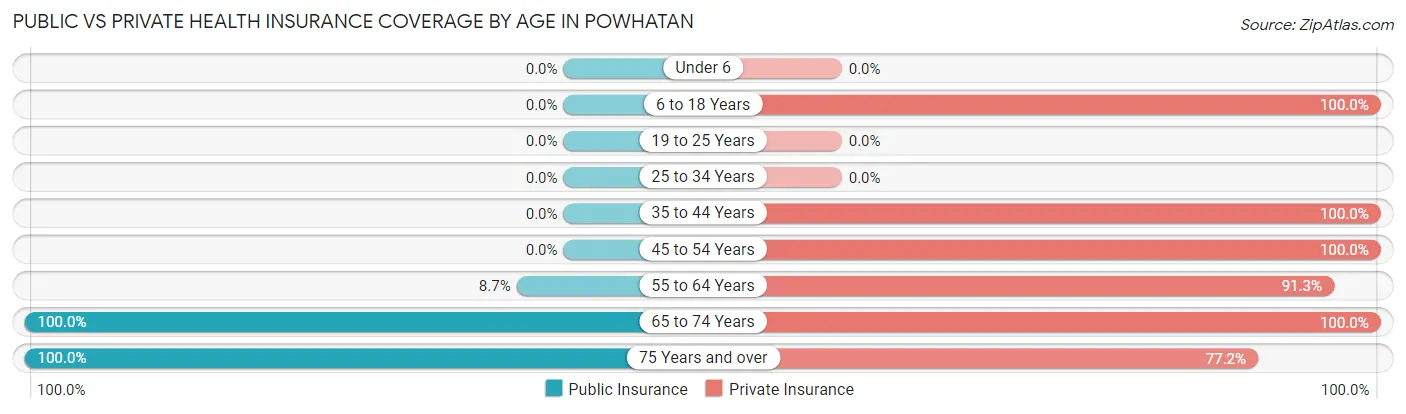
| Age Bracket | Public Insurance | Private Insurance |
| Under 6 | 0 (0.0%) | 0 (0.0%) |
| 6 to 18 Years | 0 (0.0%) | 93 (100.0%) |
| 19 to 25 Years | 0 (0.0%) | 0 (0.0%) |
| 25 to 34 Years | 0 (0.0%) | 0 (0.0%) |
| 35 to 44 Years | 0 (0.0%) | 44 (100.0%) |
| 45 to 54 Years | 0 (0.0%) | 45 (100.0%) |
| 55 to 64 Years | 12 (8.7%) | 126 (91.3%) |
| 65 to 74 Years | 74 (100.0%) | 74 (100.0%) |
| 75 Years and over | 79 (100.0%) | 61 (77.2%) |
| Total | 165 (34.9%) | 443 (93.7%) |
Disability Status by Sex by Age in Powhatan
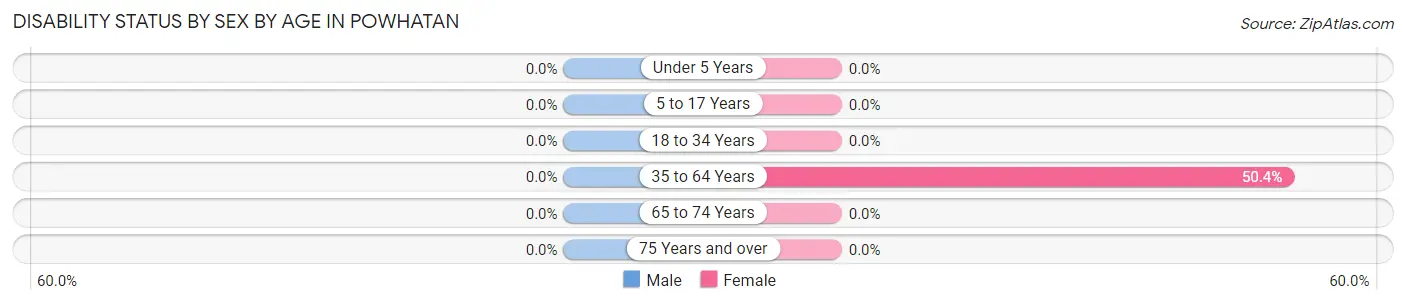
| Age Bracket | Male | Female |
| Under 5 Years | 0 (0.0%) | 0 (0.0%) |
| 5 to 17 Years | 0 (0.0%) | 0 (0.0%) |
| 18 to 34 Years | 0 (0.0%) | 0 (0.0%) |
| 35 to 64 Years | 0 (0.0%) | 68 (50.4%) |
| 65 to 74 Years | 0 (0.0%) | 0 (0.0%) |
| 75 Years and over | 0 (0.0%) | 0 (0.0%) |
Disability Class by Sex by Age in Powhatan
Disability Class: Hearing Difficulty
| Age Bracket | Male | Female |
| Under 5 Years | 0 (0.0%) | 0 (0.0%) |
| 5 to 17 Years | 0 (0.0%) | 0 (0.0%) |
| 18 to 34 Years | 0 (0.0%) | 0 (0.0%) |
| 35 to 64 Years | 0 (0.0%) | 0 (0.0%) |
| 65 to 74 Years | 0 (0.0%) | 0 (0.0%) |
| 75 Years and over | 0 (0.0%) | 0 (0.0%) |
Disability Class: Vision Difficulty
| Age Bracket | Male | Female |
| Under 5 Years | 0 (0.0%) | 0 (0.0%) |
| 5 to 17 Years | 0 (0.0%) | 0 (0.0%) |
| 18 to 34 Years | 0 (0.0%) | 0 (0.0%) |
| 35 to 64 Years | 0 (0.0%) | 0 (0.0%) |
| 65 to 74 Years | 0 (0.0%) | 0 (0.0%) |
| 75 Years and over | 0 (0.0%) | 0 (0.0%) |
Disability Class: Cognitive Difficulty
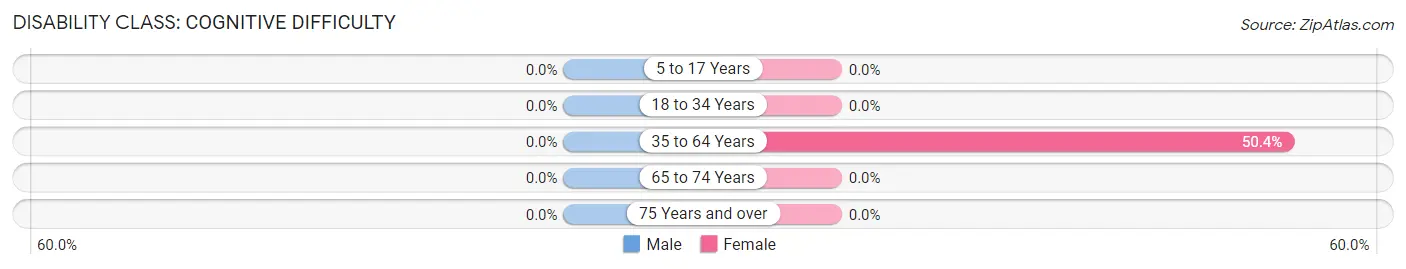
| Age Bracket | Male | Female |
| 5 to 17 Years | 0 (0.0%) | 0 (0.0%) |
| 18 to 34 Years | 0 (0.0%) | 0 (0.0%) |
| 35 to 64 Years | 0 (0.0%) | 68 (50.4%) |
| 65 to 74 Years | 0 (0.0%) | 0 (0.0%) |
| 75 Years and over | 0 (0.0%) | 0 (0.0%) |
Disability Class: Ambulatory Difficulty
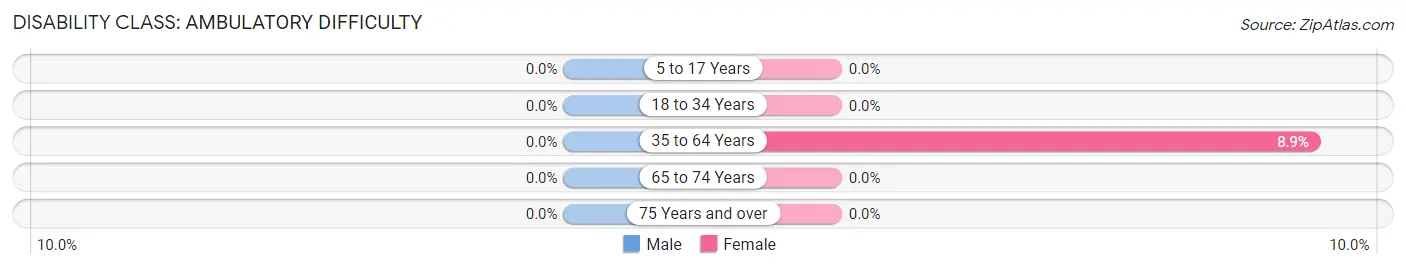
| Age Bracket | Male | Female |
| 5 to 17 Years | 0 (0.0%) | 0 (0.0%) |
| 18 to 34 Years | 0 (0.0%) | 0 (0.0%) |
| 35 to 64 Years | 0 (0.0%) | 12 (8.9%) |
| 65 to 74 Years | 0 (0.0%) | 0 (0.0%) |
| 75 Years and over | 0 (0.0%) | 0 (0.0%) |
Disability Class: Self-Care Difficulty
| Age Bracket | Male | Female |
| 5 to 17 Years | 0 (0.0%) | 0 (0.0%) |
| 18 to 34 Years | 0 (0.0%) | 0 (0.0%) |
| 35 to 64 Years | 0 (0.0%) | 0 (0.0%) |
| 65 to 74 Years | 0 (0.0%) | 0 (0.0%) |
| 75 Years and over | 0 (0.0%) | 0 (0.0%) |
Technology Access in Powhatan
Computing Device Access in Powhatan
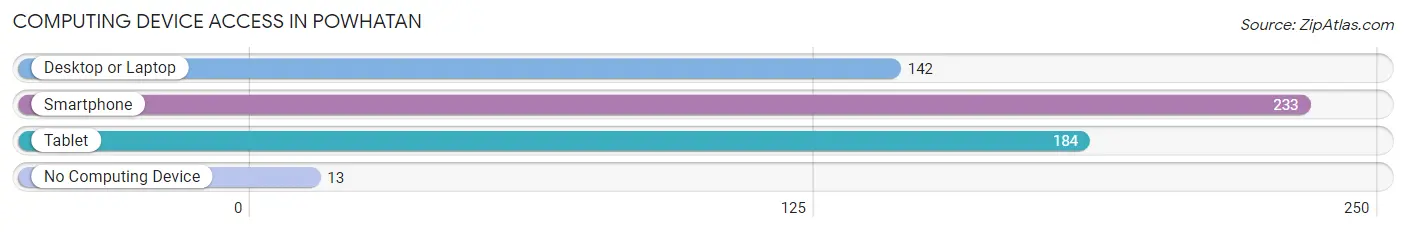
| Device Type | # Households | % Households |
| Desktop or Laptop | 142 | 57.7% |
| Smartphone | 233 | 94.7% |
| Tablet | 184 | 74.8% |
| No Computing Device | 13 | 5.3% |
| Total | 246 | 100.0% |
Internet Access in Powhatan
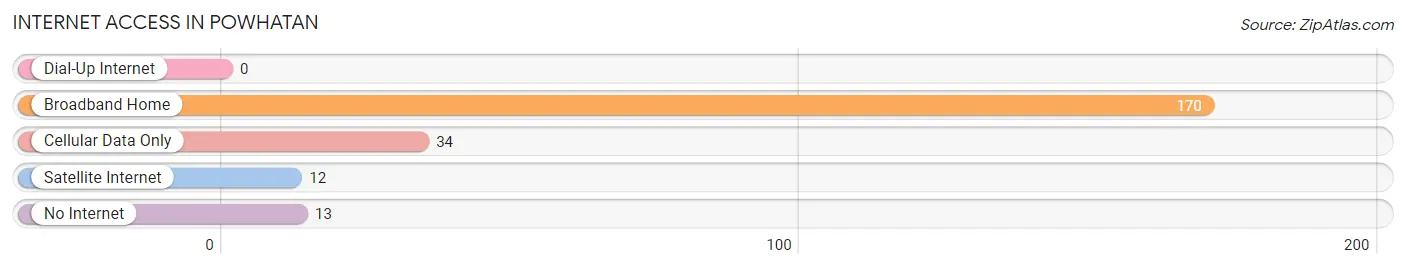
| Internet Type | # Households | % Households |
| Dial-Up Internet | 0 | 0.0% |
| Broadband Home | 170 | 69.1% |
| Cellular Data Only | 34 | 13.8% |
| Satellite Internet | 12 | 4.9% |
| No Internet | 13 | 5.3% |
| Total | 246 | 100.0% |
Powhatan Summary
Powhatan, Virginia is a small town located in the central part of the state, about 25 miles west of Richmond. It is part of the Richmond-Petersburg metropolitan area and is the county seat of Powhatan County. The town has a population of approximately 2,500 people and is known for its rural charm and small-town atmosphere.
History
Powhatan was first settled in the early 1700s by English colonists. The town was named after the powerful Powhatan Indian chief, who was the father of Pocahontas. The town was officially established in 1777 and was the county seat of Powhatan County. The town was an important trading center during the early 19th century and was home to several prominent families.
During the Civil War, Powhatan was the site of several battles, including the Battle of Powhatan Court House in 1864. The town was also the site of the first Confederate victory in the war. After the war, the town experienced a period of growth and prosperity, with the construction of several new buildings, including the Powhatan County Courthouse.
Geography
Powhatan is located in the central part of Virginia, about 25 miles west of Richmond. The town is situated in the Piedmont region of the state, which is characterized by rolling hills and lush forests. The town is located on the banks of the James River, which provides a scenic backdrop for the town.
The climate in Powhatan is mild and humid, with hot summers and cold winters. The average annual temperature is around 60 degrees Fahrenheit. The town receives an average of 45 inches of precipitation per year, with most of it falling in the spring and summer months.
Economy
Powhatan’s economy is largely based on agriculture and tourism. The town is home to several farms, which produce a variety of crops, including corn, soybeans, and wheat. The town is also home to several wineries, which produce a variety of wines.
Tourism is an important part of the local economy, with visitors coming to the town to enjoy its rural charm and small-town atmosphere. The town is home to several historic sites, including the Powhatan County Courthouse and the Powhatan Historic District. The town also hosts several annual festivals and events, including the Powhatan Festival of the Arts and the Powhatan County Fair.
Demographics
As of the 2010 census, the population of Powhatan was 2,377. The racial makeup of the town was 90.3% White, 6.2% African American, 0.7% Native American, 0.4% Asian, 0.1% Pacific Islander, and 1.3% from other races. The median household income was $50,945, and the median family income was $60,917. The per capita income was $25,945.
Powhatan is a small town with a rich history and a unique atmosphere. The town is home to several farms and wineries, and is a popular destination for tourists. The town is also home to several historic sites and hosts several annual festivals and events. The town has a diverse population and a strong economy, making it an ideal place to live and work.
Common Questions
What is Per Capita Income in Powhatan?
Per Capita income in Powhatan is $42,865.
What is the Median Family Income in Powhatan?
Median Family Income in Powhatan is $87,734.
What is the Median Household income in Powhatan?
Median Household Income in Powhatan is $66,471.
What is Income or Wage Gap in Powhatan?
Income or Wage Gap in Powhatan is 61.4%.
Women in Powhatan earn 38.6 cents for every dollar earned by a man.
What is Inequality or Gini Index in Powhatan?
Inequality or Gini Index in Powhatan is 0.37.
What is the Total Population of Powhatan?
Total Population of Powhatan is 473.
What is the Total Male Population of Powhatan?
Total Male Population of Powhatan is 158.
What is the Total Female Population of Powhatan?
Total Female Population of Powhatan is 315.
What is the Ratio of Males per 100 Females in Powhatan?
There are 50.16 Males per 100 Females in Powhatan.
What is the Ratio of Females per 100 Males in Powhatan?
There are 199.37 Females per 100 Males in Powhatan.
What is the Median Population Age in Powhatan?
Median Population Age in Powhatan is 57.1 Years.
What is the Average Family Size in Powhatan
Average Family Size in Powhatan is 2.1 People.
What is the Average Household Size in Powhatan
Average Household Size in Powhatan is 1.9 People.
How Large is the Labor Force in Powhatan?
There are 222 People in the Labor Forcein in Powhatan.
What is the Percentage of People in the Labor Force in Powhatan?
49.8% of People are in the Labor Force in Powhatan.