Mason Neck, VA Map & Demographics
Mason Neck Map
Mason Neck Overview
$82,007
PER CAPITA INCOME
$180,625
AVG FAMILY INCOME
$164,625
AVG HOUSEHOLD INCOME
21.3%
WAGE / INCOME GAP [ % ]
78.7¢/ $1
WAGE / INCOME GAP [ $ ]
0.47
INEQUALITY / GINI INDEX
1,932
TOTAL POPULATION
1,028
MALE POPULATION
904
FEMALE POPULATION
113.72
MALES / 100 FEMALES
87.94
FEMALES / 100 MALES
50.9
MEDIAN AGE
3.2
AVG FAMILY SIZE
2.8
AVG HOUSEHOLD SIZE
1,049
LABOR FORCE [ PEOPLE ]
64.7%
PERCENT IN LABOR FORCE
4.9%
UNEMPLOYMENT RATE
Income in Mason Neck
Income Overview in Mason Neck
Per Capita Income in Mason Neck is $82,007, while median incomes of families and households are $180,625 and $164,625 respectively.
| Characteristic | Number | Measure |
| Per Capita Income | 1,932 | $82,007 |
| Median Family Income | 542 | $180,625 |
| Mean Family Income | 542 | $222,080 |
| Median Household Income | 685 | $164,625 |
| Mean Household Income | 685 | $222,071 |
| Income Deficit | 542 | $0 |
| Wage / Income Gap (%) | 1,932 | 21.26% |
| Wage / Income Gap ($) | 1,932 | 78.74¢ per $1 |
| Gini / Inequality Index | 1,932 | 0.47 |
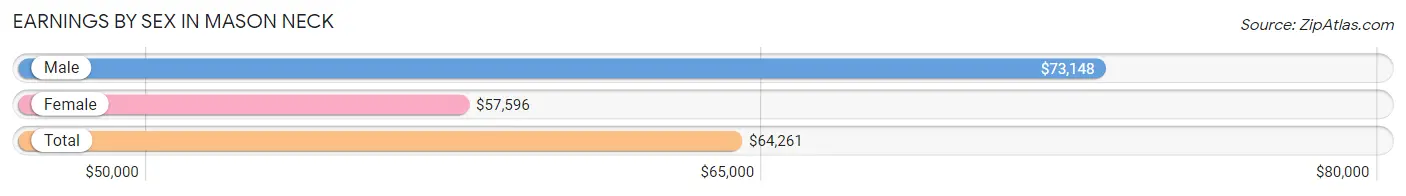
Earnings by Sex in Mason Neck
Average Earnings in Mason Neck are $64,261, $73,148 for men and $57,596 for women, a difference of 21.3%.
| Sex | Number | Average Earnings |
| Male | 616 (57.5%) | $73,148 |
| Female | 455 (42.5%) | $57,596 |
| Total | 1,071 (100.0%) | $64,261 |
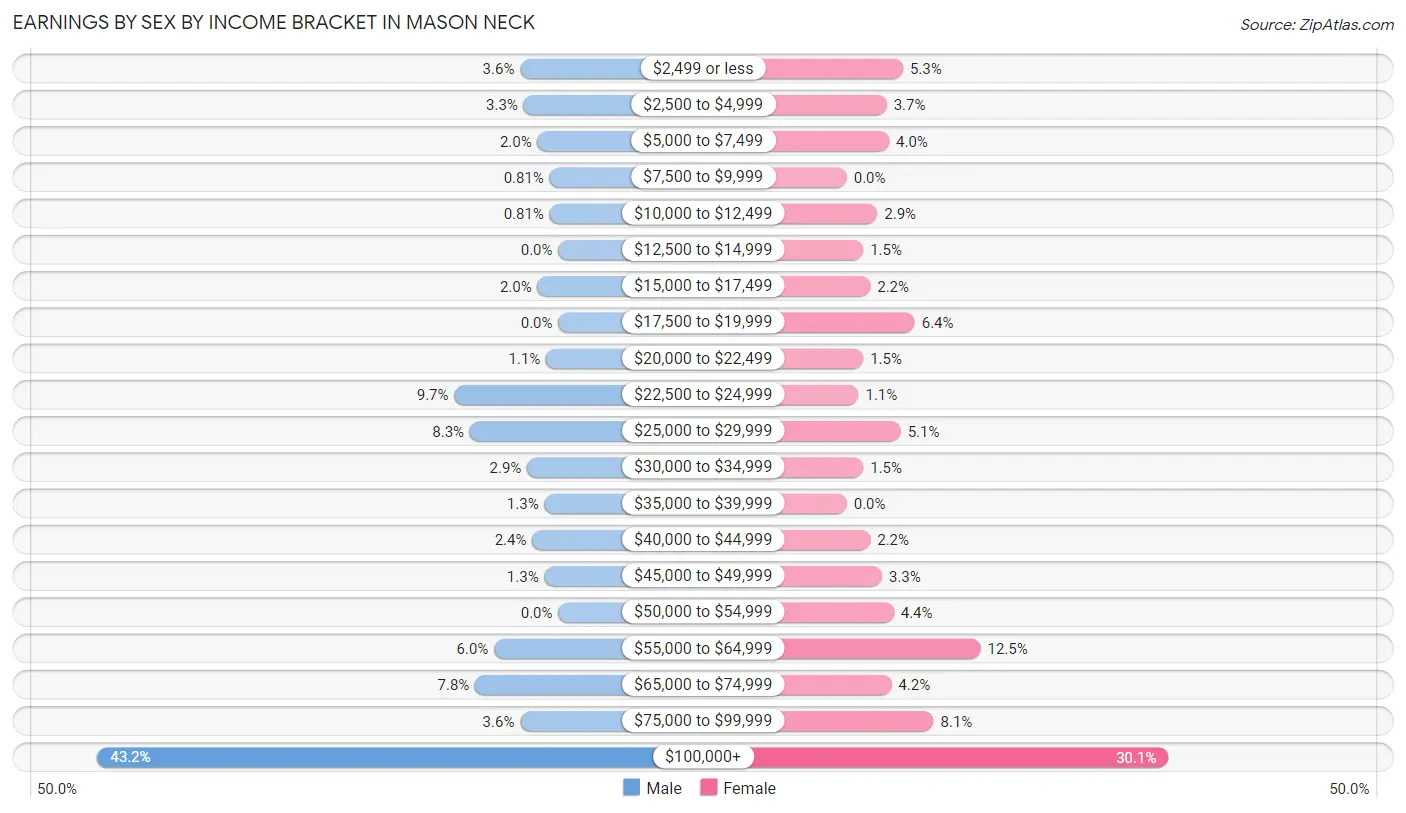
Earnings by Sex by Income Bracket in Mason Neck
The most common earnings brackets in Mason Neck are $100,000+ for men (266 | 43.2%) and $100,000+ for women (137 | 30.1%).
| Income | Male | Female |
| $2,499 or less | 22 (3.6%) | 24 (5.3%) |
| $2,500 to $4,999 | 20 (3.3%) | 17 (3.7%) |
| $5,000 to $7,499 | 12 (1.9%) | 18 (4.0%) |
| $7,500 to $9,999 | 5 (0.8%) | 0 (0.0%) |
| $10,000 to $12,499 | 5 (0.8%) | 13 (2.9%) |
| $12,500 to $14,999 | 0 (0.0%) | 7 (1.5%) |
| $15,000 to $17,499 | 12 (1.9%) | 10 (2.2%) |
| $17,500 to $19,999 | 0 (0.0%) | 29 (6.4%) |
| $20,000 to $22,499 | 7 (1.1%) | 7 (1.5%) |
| $22,500 to $24,999 | 60 (9.7%) | 5 (1.1%) |
| $25,000 to $29,999 | 51 (8.3%) | 23 (5.1%) |
| $30,000 to $34,999 | 18 (2.9%) | 7 (1.5%) |
| $35,000 to $39,999 | 8 (1.3%) | 0 (0.0%) |
| $40,000 to $44,999 | 15 (2.4%) | 10 (2.2%) |
| $45,000 to $49,999 | 8 (1.3%) | 15 (3.3%) |
| $50,000 to $54,999 | 0 (0.0%) | 20 (4.4%) |
| $55,000 to $64,999 | 37 (6.0%) | 57 (12.5%) |
| $65,000 to $74,999 | 48 (7.8%) | 19 (4.2%) |
| $75,000 to $99,999 | 22 (3.6%) | 37 (8.1%) |
| $100,000+ | 266 (43.2%) | 137 (30.1%) |
| Total | 616 (100.0%) | 455 (100.0%) |
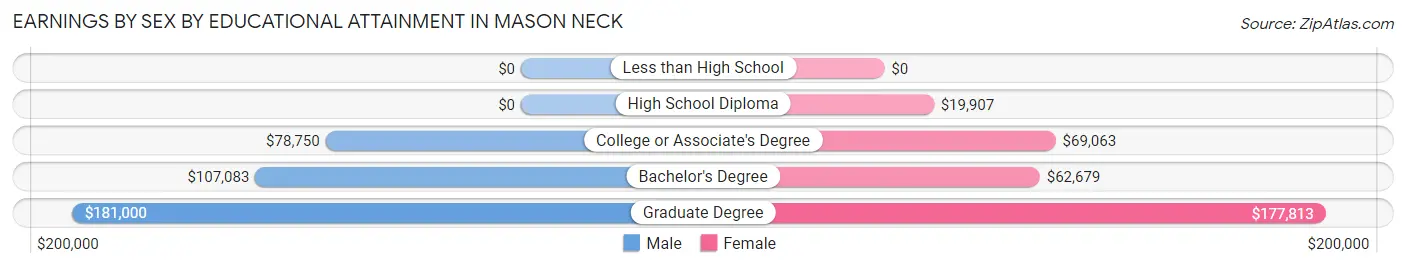
Earnings by Sex by Educational Attainment in Mason Neck
Average earnings in Mason Neck are $91,375 for men and $64,926 for women, a difference of 28.9%. Men with an educational attainment of graduate degree enjoy the highest average annual earnings of $181,000, while those with college or associate's degree education earn the least with $78,750. Women with an educational attainment of graduate degree earn the most with the average annual earnings of $177,813, while those with high school diploma education have the smallest earnings of $19,907.
| Educational Attainment | Male Income | Female Income |
| Less than High School | - | - |
| High School Diploma | - | - |
| College or Associate's Degree | $78,750 | $69,063 |
| Bachelor's Degree | $107,083 | $62,679 |
| Graduate Degree | $181,000 | $177,813 |
| Total | $91,375 | $64,926 |
Family Income in Mason Neck
Family Income Brackets in Mason Neck
According to the Mason Neck family income data, there are 227 families falling into the $200,000+ income range, which is the most common income bracket and makes up 41.9% of all families.
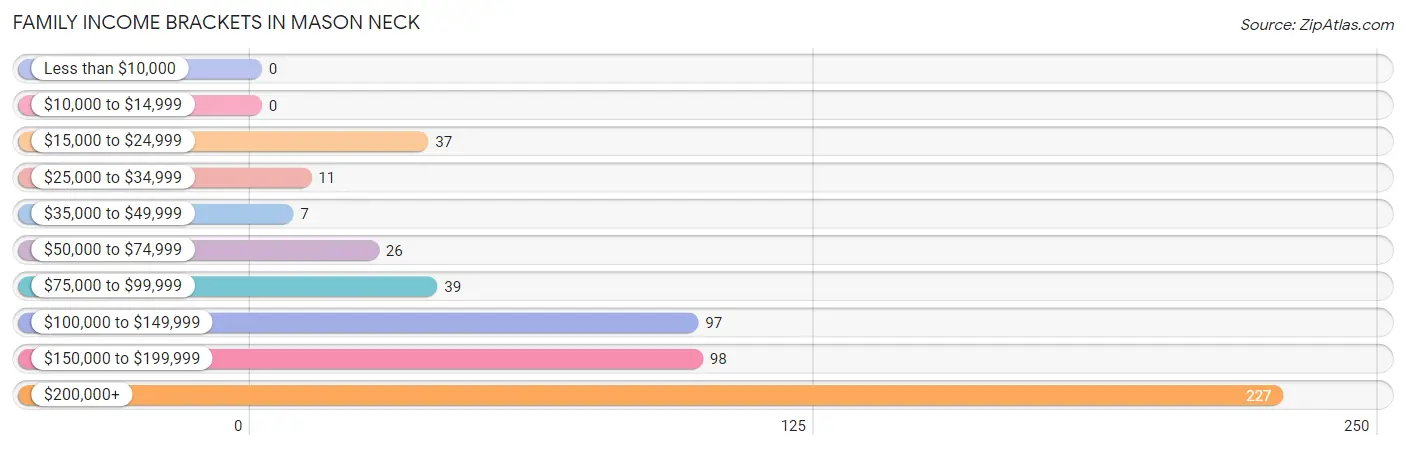
| Income Bracket | # Families | % Families |
| Less than $10,000 | 0 | 0.0% |
| $10,000 to $14,999 | 0 | 0.0% |
| $15,000 to $24,999 | 37 | 6.8% |
| $25,000 to $34,999 | 11 | 2.0% |
| $35,000 to $49,999 | 7 | 1.3% |
| $50,000 to $74,999 | 26 | 4.8% |
| $75,000 to $99,999 | 39 | 7.2% |
| $100,000 to $149,999 | 97 | 17.9% |
| $150,000 to $199,999 | 98 | 18.1% |
| $200,000+ | 227 | 41.9% |
Family Income by Famaliy Size in Mason Neck
5-person families (36 | 6.6%) account for the highest median family income in Mason Neck with $250,001 per family, while 2-person families (252 | 46.5%) have the highest median income of $73,182 per family member.
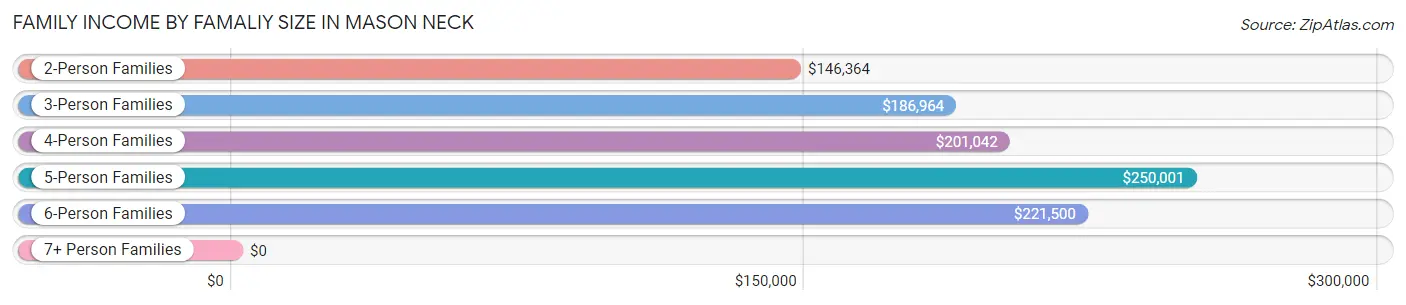
| Income Bracket | # Families | Median Income |
| 2-Person Families | 252 (46.5%) | $146,364 |
| 3-Person Families | 145 (26.8%) | $186,964 |
| 4-Person Families | 75 (13.8%) | $201,042 |
| 5-Person Families | 36 (6.6%) | $250,001 |
| 6-Person Families | 28 (5.2%) | $221,500 |
| 7+ Person Families | 6 (1.1%) | $0 |
| Total | 542 (100.0%) | $180,625 |
Family Income by Number of Earners in Mason Neck
The median family income in Mason Neck is $180,625, with families comprising 3+ earners (111) having the highest median family income of $213,906, while families with no earners (104) have the lowest median family income of $118,333, accounting for 20.5% and 19.2% of families, respectively.
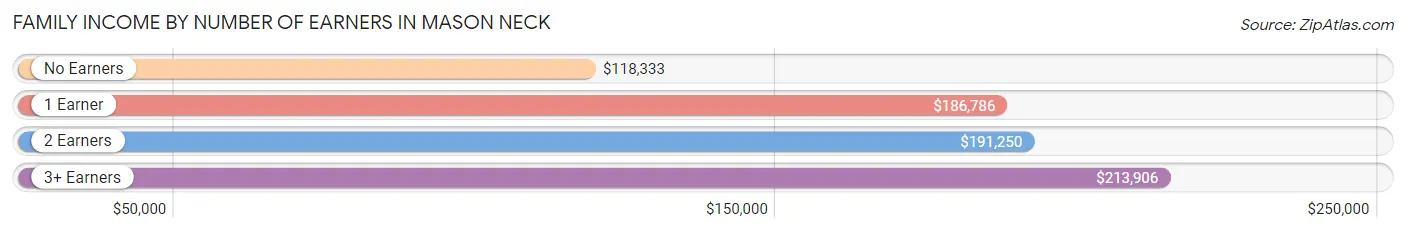
| Number of Earners | # Families | Median Income |
| No Earners | 104 (19.2%) | $118,333 |
| 1 Earner | 138 (25.5%) | $186,786 |
| 2 Earners | 189 (34.9%) | $191,250 |
| 3+ Earners | 111 (20.5%) | $213,906 |
| Total | 542 (100.0%) | $180,625 |
Household Income in Mason Neck
Household Income Brackets in Mason Neck
With 277 households falling in the category, the $200,000+ income range is the most frequent in Mason Neck, accounting for 40.4% of all households.
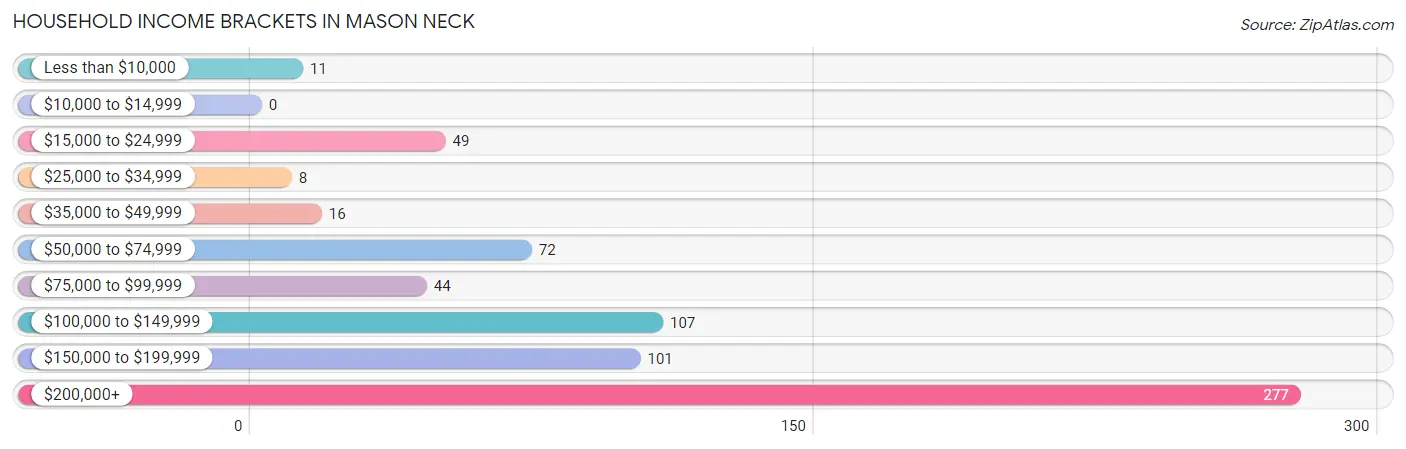
| Income Bracket | # Households | % Households |
| Less than $10,000 | 11 | 1.6% |
| $10,000 to $14,999 | 0 | 0.0% |
| $15,000 to $24,999 | 49 | 7.2% |
| $25,000 to $34,999 | 8 | 1.2% |
| $35,000 to $49,999 | 16 | 2.3% |
| $50,000 to $74,999 | 72 | 10.5% |
| $75,000 to $99,999 | 44 | 6.4% |
| $100,000 to $149,999 | 107 | 15.6% |
| $150,000 to $199,999 | 101 | 14.7% |
| $200,000+ | 277 | 40.4% |
Household Income by Householder Age in Mason Neck
The median household income in Mason Neck is $164,625, with the highest median household income of $186,477 found in the 45 to 64 years age bracket for the primary householder. A total of 375 households (54.7%) fall into this category.
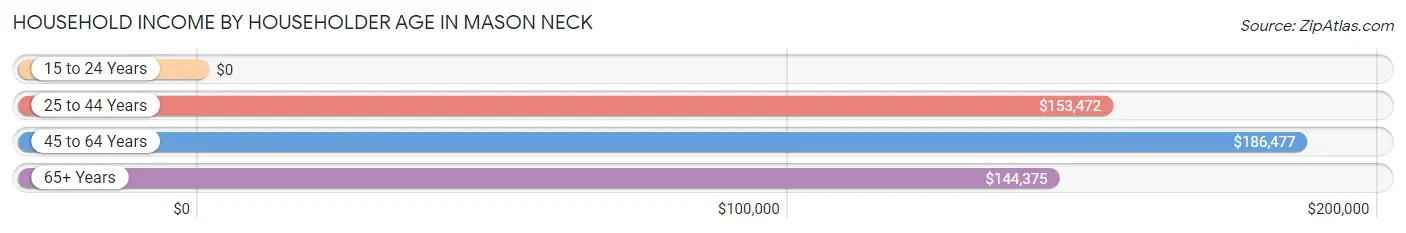
| Income Bracket | # Households | Median Income |
| 15 to 24 Years | 0 (0.0%) | $0 |
| 25 to 44 Years | 75 (11.0%) | $153,472 |
| 45 to 64 Years | 375 (54.7%) | $186,477 |
| 65+ Years | 235 (34.3%) | $144,375 |
| Total | 685 (100.0%) | $164,625 |
Poverty in Mason Neck
Income Below Poverty by Sex and Age in Mason Neck
With 4.0% poverty level for males and 5.1% for females among the residents of Mason Neck, 12 to 14 year old males and 6 to 11 year old females are the most vulnerable to poverty, with 13 males (17.1%) and 9 females (25.0%) in their respective age groups living below the poverty level.
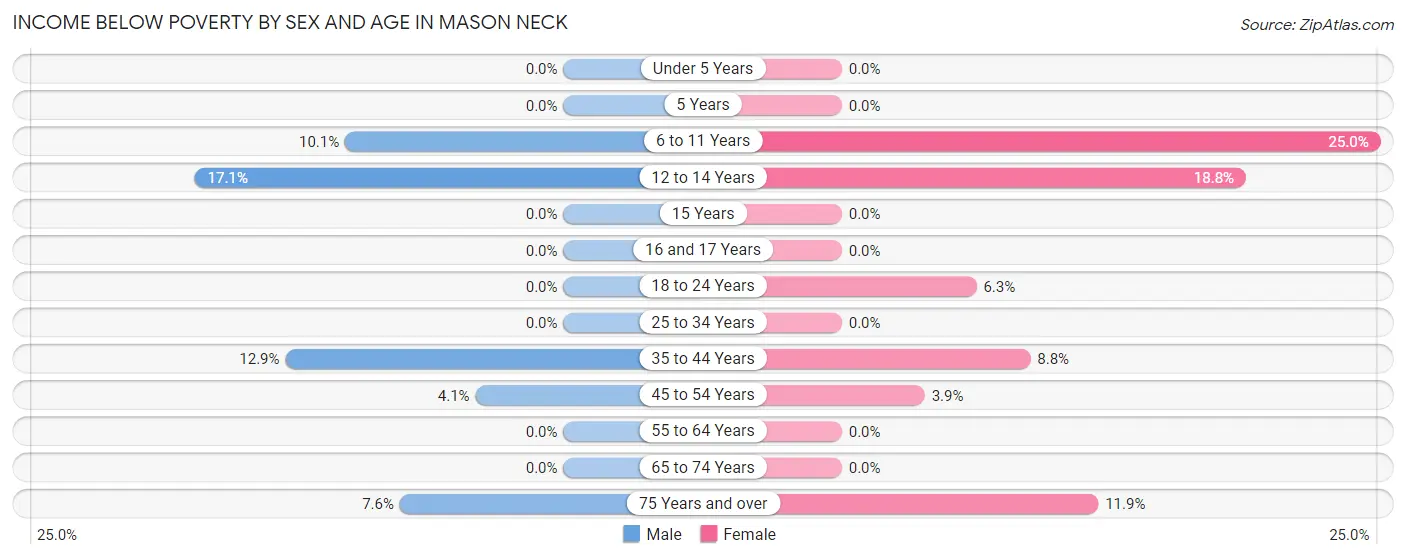
| Age Bracket | Male | Female |
| Under 5 Years | 0 (0.0%) | 0 (0.0%) |
| 5 Years | 0 (0.0%) | 0 (0.0%) |
| 6 to 11 Years | 8 (10.1%) | 9 (25.0%) |
| 12 to 14 Years | 13 (17.1%) | 9 (18.8%) |
| 15 Years | 0 (0.0%) | 0 (0.0%) |
| 16 and 17 Years | 0 (0.0%) | 0 (0.0%) |
| 18 to 24 Years | 0 (0.0%) | 5 (6.2%) |
| 25 to 34 Years | 0 (0.0%) | 0 (0.0%) |
| 35 to 44 Years | 8 (12.9%) | 7 (8.7%) |
| 45 to 54 Years | 6 (4.1%) | 6 (3.8%) |
| 55 to 64 Years | 0 (0.0%) | 0 (0.0%) |
| 65 to 74 Years | 0 (0.0%) | 0 (0.0%) |
| 75 Years and over | 6 (7.6%) | 10 (11.9%) |
| Total | 41 (4.0%) | 46 (5.1%) |
Income Above Poverty by Sex and Age in Mason Neck
According to the poverty statistics in Mason Neck, males aged under 5 years and females aged under 5 years are the age groups that are most secure financially, with 100.0% of males and 100.0% of females in these age groups living above the poverty line.
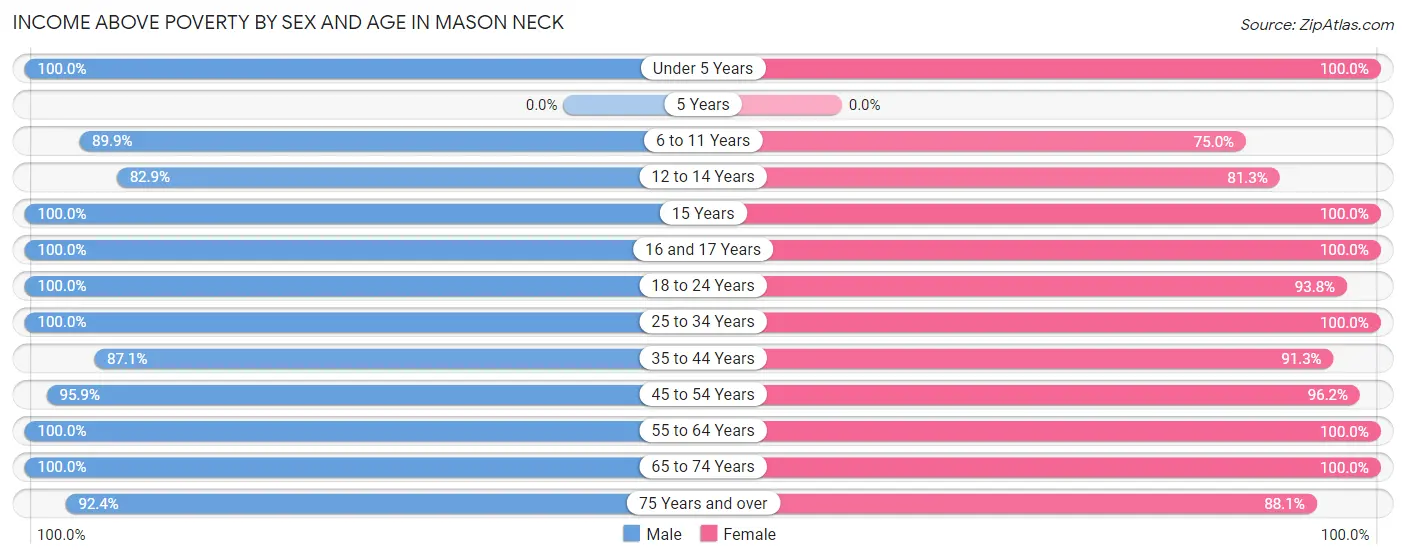
| Age Bracket | Male | Female |
| Under 5 Years | 7 (100.0%) | 35 (100.0%) |
| 5 Years | 0 (0.0%) | 0 (0.0%) |
| 6 to 11 Years | 71 (89.9%) | 27 (75.0%) |
| 12 to 14 Years | 63 (82.9%) | 39 (81.2%) |
| 15 Years | 21 (100.0%) | 9 (100.0%) |
| 16 and 17 Years | 33 (100.0%) | 40 (100.0%) |
| 18 to 24 Years | 84 (100.0%) | 75 (93.8%) |
| 25 to 34 Years | 70 (100.0%) | 33 (100.0%) |
| 35 to 44 Years | 54 (87.1%) | 73 (91.2%) |
| 45 to 54 Years | 141 (95.9%) | 150 (96.2%) |
| 55 to 64 Years | 272 (100.0%) | 195 (100.0%) |
| 65 to 74 Years | 98 (100.0%) | 108 (100.0%) |
| 75 Years and over | 73 (92.4%) | 74 (88.1%) |
| Total | 987 (96.0%) | 858 (94.9%) |
Income Below Poverty Among Married-Couple Families in Mason Neck
The poverty statistics for married-couple families in Mason Neck show that 2.7% or 13 of the total 487 families live below the poverty line. Families with 3 or 4 children have the highest poverty rate of 21.6%, comprising of 8 families. On the other hand, families with no children have the lowest poverty rate of 0.0%, which includes 0 families.
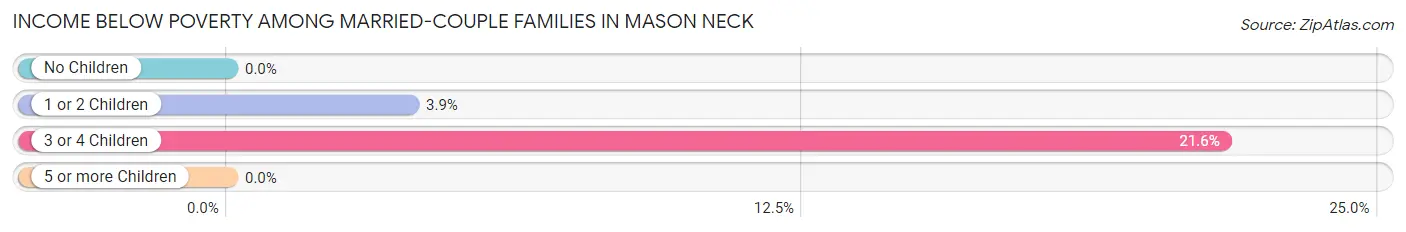
| Children | Above Poverty | Below Poverty |
| No Children | 323 (100.0%) | 0 (0.0%) |
| 1 or 2 Children | 122 (96.1%) | 5 (3.9%) |
| 3 or 4 Children | 29 (78.4%) | 8 (21.6%) |
| 5 or more Children | 0 (0.0%) | 0 (0.0%) |
| Total | 474 (97.3%) | 13 (2.7%) |
Income Below Poverty Among Single-Parent Households in Mason Neck
| Children | Single Father | Single Mother |
| No Children | 0 (0.0%) | 0 (0.0%) |
| 1 or 2 Children | 0 (0.0%) | 0 (0.0%) |
| 3 or 4 Children | 0 (0.0%) | 0 (0.0%) |
| 5 or more Children | 0 (0.0%) | 0 (0.0%) |
| Total | 0 (0.0%) | 0 (0.0%) |
Income Below Poverty Among Married-Couple vs Single-Parent Households in Mason Neck
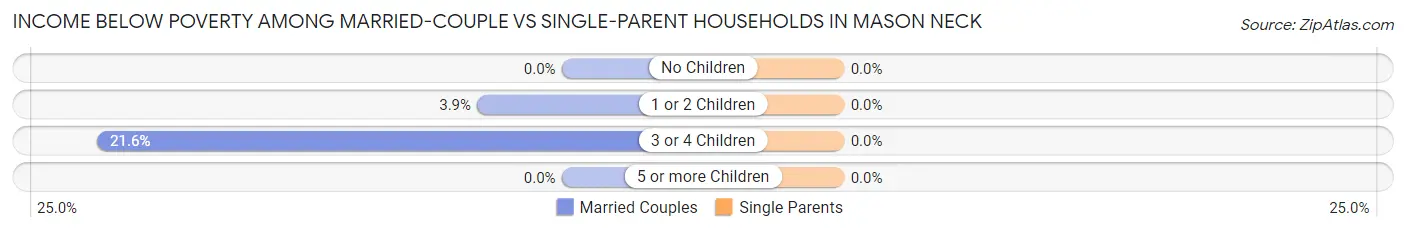
| Children | Married-Couple Families | Single-Parent Households |
| No Children | 0 (0.0%) | 0 (0.0%) |
| 1 or 2 Children | 5 (3.9%) | 0 (0.0%) |
| 3 or 4 Children | 8 (21.6%) | 0 (0.0%) |
| 5 or more Children | 0 (0.0%) | 0 (0.0%) |
| Total | 13 (2.7%) | 0 (0.0%) |
Race in Mason Neck
The most populous races in Mason Neck are White / Caucasian (1,547 | 80.1%), Hispanic or Latino (227 | 11.7%), and Two or more Races (180 | 9.3%).
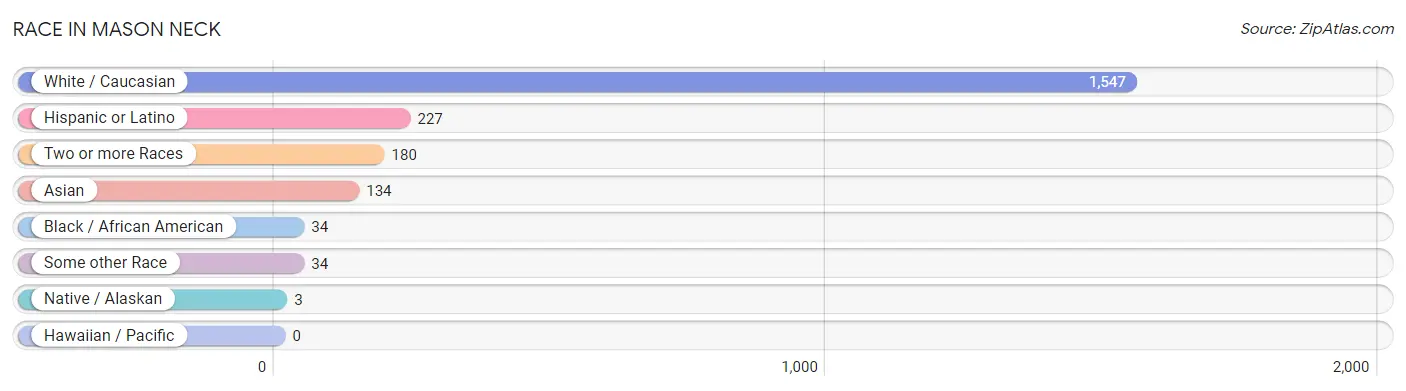
| Race | # Population | % Population |
| Asian | 134 | 6.9% |
| Black / African American | 34 | 1.8% |
| Hawaiian / Pacific | 0 | 0.0% |
| Hispanic or Latino | 227 | 11.7% |
| Native / Alaskan | 3 | 0.2% |
| White / Caucasian | 1,547 | 80.1% |
| Two or more Races | 180 | 9.3% |
| Some other Race | 34 | 1.8% |
| Total | 1,932 | 100.0% |
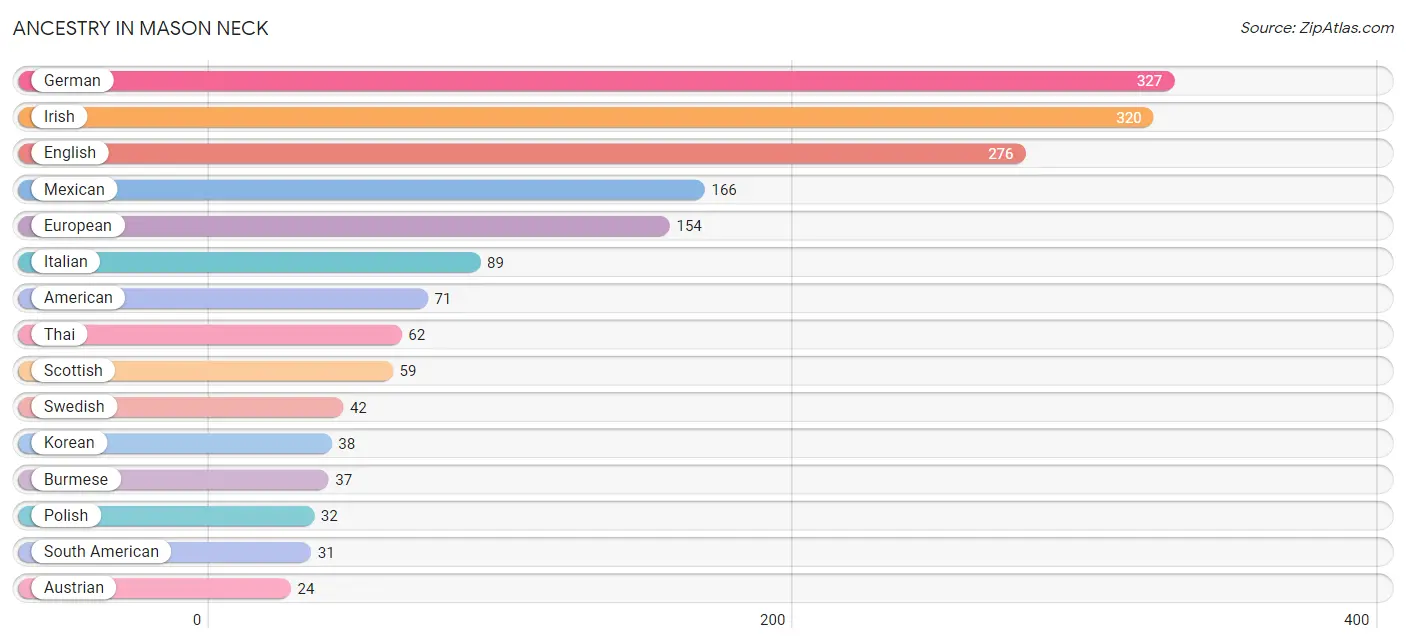
Ancestry in Mason Neck
The most populous ancestries reported in Mason Neck are German (327 | 16.9%), Irish (320 | 16.6%), English (276 | 14.3%), Mexican (166 | 8.6%), and European (154 | 8.0%), together accounting for 64.3% of all Mason Neck residents.
| Ancestry | # Population | % Population |
| African | 8 | 0.4% |
| American | 71 | 3.7% |
| Arab | 10 | 0.5% |
| Argentinean | 13 | 0.7% |
| Austrian | 24 | 1.2% |
| Brazilian | 3 | 0.2% |
| British | 1 | 0.1% |
| Burmese | 37 | 1.9% |
| Central American | 3 | 0.2% |
| Central American Indian | 3 | 0.2% |
| Chilean | 8 | 0.4% |
| Cuban | 5 | 0.3% |
| Cypriot | 7 | 0.4% |
| Czech | 15 | 0.8% |
| Dominican | 6 | 0.3% |
| Dutch | 6 | 0.3% |
| Eastern European | 15 | 0.8% |
| English | 276 | 14.3% |
| European | 154 | 8.0% |
| Finnish | 5 | 0.3% |
| French | 23 | 1.2% |
| French Canadian | 6 | 0.3% |
| German | 327 | 16.9% |
| Greek | 18 | 0.9% |
| Guatemalan | 3 | 0.2% |
| Haitian | 18 | 0.9% |
| Hungarian | 15 | 0.8% |
| Indian (Asian) | 11 | 0.6% |
| Irish | 320 | 16.6% |
| Italian | 89 | 4.6% |
| Korean | 38 | 2.0% |
| Lithuanian | 6 | 0.3% |
| Mexican | 166 | 8.6% |
| Northern European | 19 | 1.0% |
| Palestinian | 10 | 0.5% |
| Pennsylvania German | 11 | 0.6% |
| Peruvian | 10 | 0.5% |
| Polish | 32 | 1.7% |
| Puerto Rican | 9 | 0.5% |
| Russian | 11 | 0.6% |
| Scandinavian | 4 | 0.2% |
| Scotch-Irish | 5 | 0.3% |
| Scottish | 59 | 3.0% |
| South African | 6 | 0.3% |
| South American | 31 | 1.6% |
| Spaniard | 7 | 0.4% |
| Subsaharan African | 14 | 0.7% |
| Swedish | 42 | 2.2% |
| Swiss | 13 | 0.7% |
| Thai | 62 | 3.2% |
| Ukrainian | 5 | 0.3% |
| Welsh | 11 | 0.6% | View All 52 Rows |
Immigrants in Mason Neck
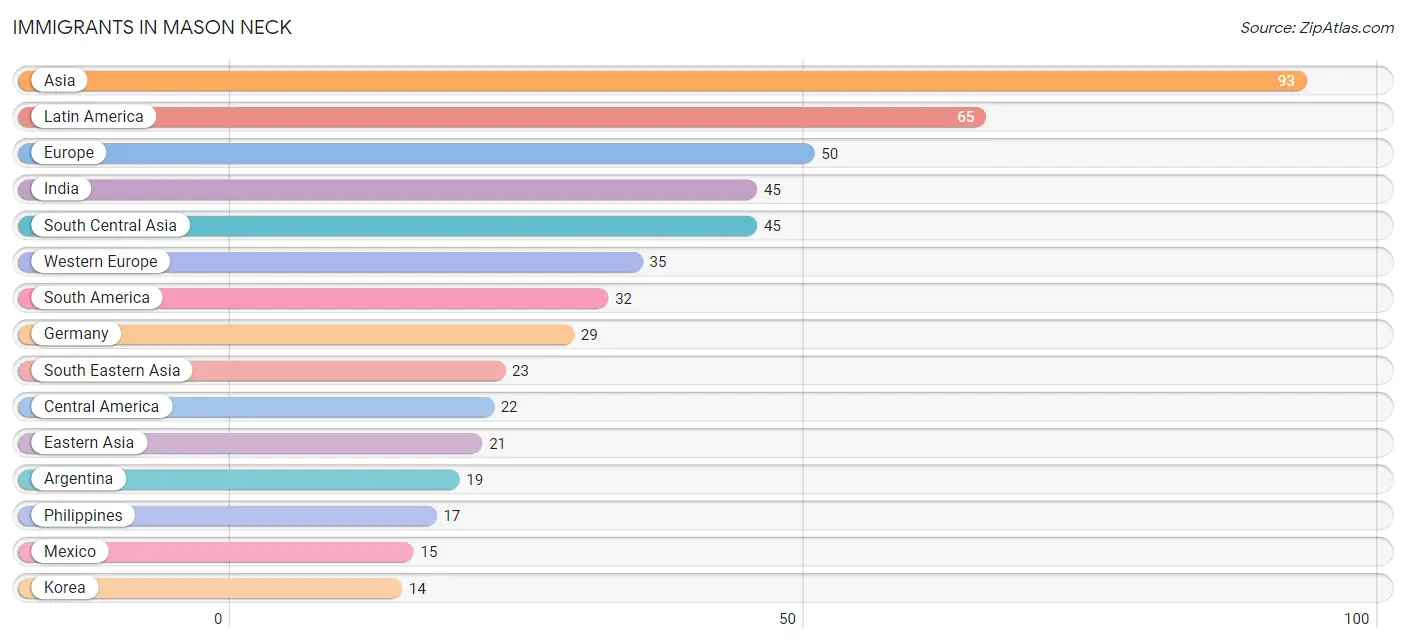
The most numerous immigrant groups reported in Mason Neck came from Asia (93 | 4.8%), Latin America (65 | 3.4%), Europe (50 | 2.6%), India (45 | 2.3%), and South Central Asia (45 | 2.3%), together accounting for 15.4% of all Mason Neck residents.
| Immigration Origin | # Population | % Population |
| Africa | 8 | 0.4% |
| Argentina | 19 | 1.0% |
| Asia | 93 | 4.8% |
| Caribbean | 11 | 0.6% |
| Central America | 22 | 1.1% |
| Chile | 8 | 0.4% |
| China | 5 | 0.3% |
| Cuba | 5 | 0.3% |
| Eastern Asia | 21 | 1.1% |
| Eastern Europe | 5 | 0.3% |
| El Salvador | 4 | 0.2% |
| England | 10 | 0.5% |
| Europe | 50 | 2.6% |
| Germany | 29 | 1.5% |
| Guatemala | 3 | 0.2% |
| Haiti | 6 | 0.3% |
| India | 45 | 2.3% |
| Japan | 2 | 0.1% |
| Korea | 14 | 0.7% |
| Latin America | 65 | 3.4% |
| Mexico | 15 | 0.8% |
| Netherlands | 6 | 0.3% |
| Northern Europe | 10 | 0.5% |
| Peru | 5 | 0.3% |
| Philippines | 17 | 0.9% |
| South America | 32 | 1.7% |
| South Central Asia | 45 | 2.3% |
| South Eastern Asia | 23 | 1.2% |
| Ukraine | 5 | 0.3% |
| Vietnam | 6 | 0.3% |
| Western Asia | 4 | 0.2% |
| Western Europe | 35 | 1.8% | View All 32 Rows |
Sex and Age in Mason Neck
Sex and Age in Mason Neck
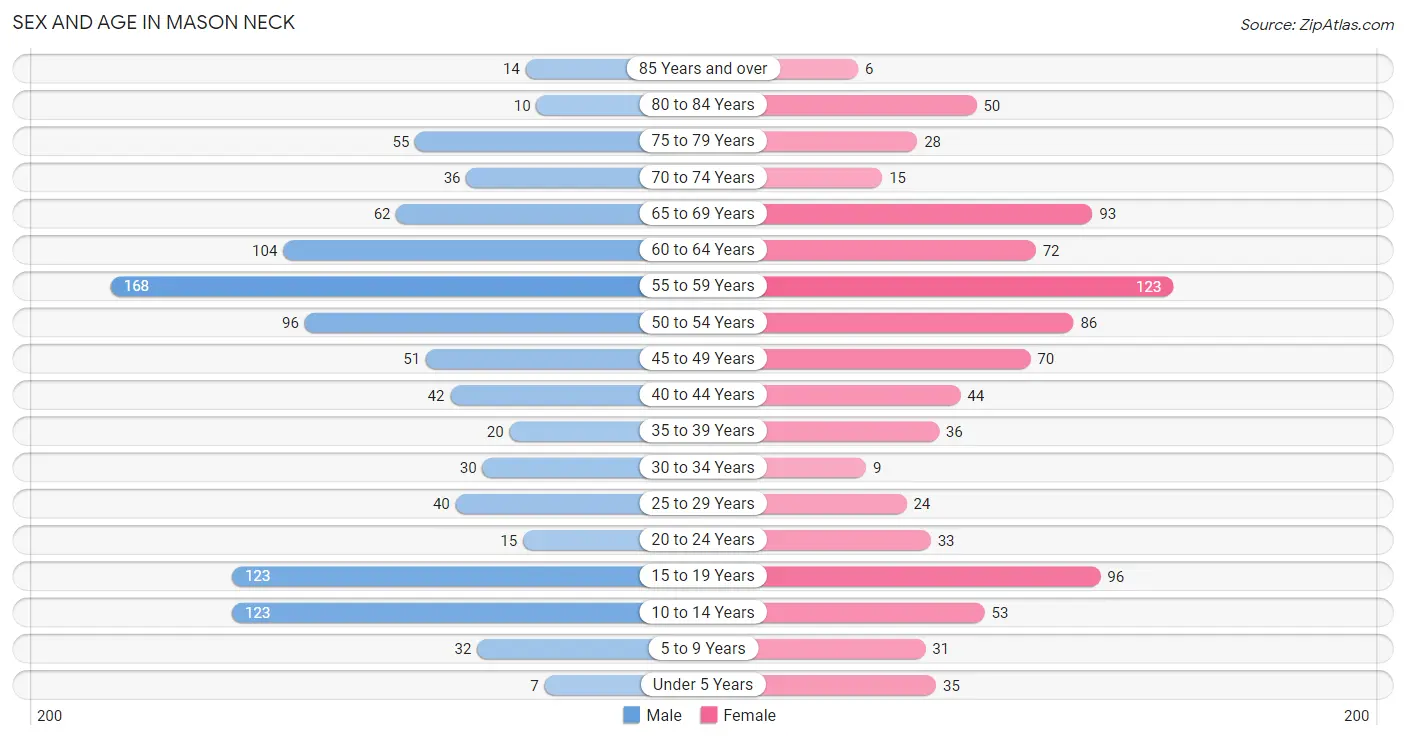
The most populous age groups in Mason Neck are 55 to 59 Years (168 | 16.3%) for men and 55 to 59 Years (123 | 13.6%) for women.
| Age Bracket | Male | Female |
| Under 5 Years | 7 (0.7%) | 35 (3.9%) |
| 5 to 9 Years | 32 (3.1%) | 31 (3.4%) |
| 10 to 14 Years | 123 (12.0%) | 53 (5.9%) |
| 15 to 19 Years | 123 (12.0%) | 96 (10.6%) |
| 20 to 24 Years | 15 (1.5%) | 33 (3.6%) |
| 25 to 29 Years | 40 (3.9%) | 24 (2.6%) |
| 30 to 34 Years | 30 (2.9%) | 9 (1.0%) |
| 35 to 39 Years | 20 (1.9%) | 36 (4.0%) |
| 40 to 44 Years | 42 (4.1%) | 44 (4.9%) |
| 45 to 49 Years | 51 (5.0%) | 70 (7.7%) |
| 50 to 54 Years | 96 (9.3%) | 86 (9.5%) |
| 55 to 59 Years | 168 (16.3%) | 123 (13.6%) |
| 60 to 64 Years | 104 (10.1%) | 72 (8.0%) |
| 65 to 69 Years | 62 (6.0%) | 93 (10.3%) |
| 70 to 74 Years | 36 (3.5%) | 15 (1.7%) |
| 75 to 79 Years | 55 (5.3%) | 28 (3.1%) |
| 80 to 84 Years | 10 (1.0%) | 50 (5.5%) |
| 85 Years and over | 14 (1.4%) | 6 (0.7%) |
| Total | 1,028 (100.0%) | 904 (100.0%) |
Families and Households in Mason Neck
Median Family Size in Mason Neck
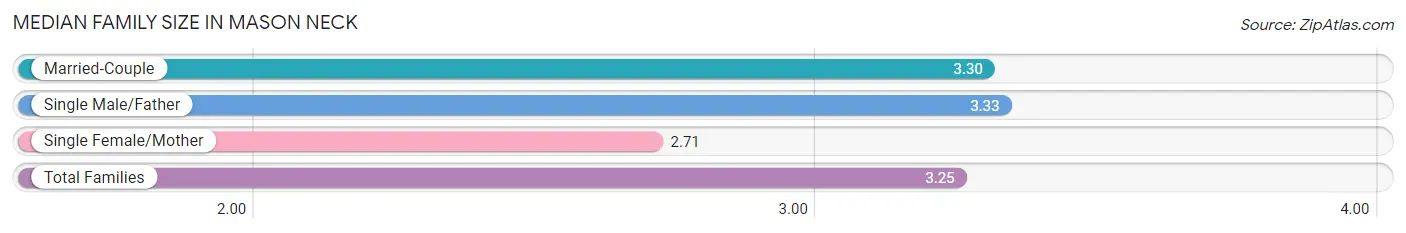
The median family size in Mason Neck is 3.25 persons per family, with single male/father families (3 | 0.5%) accounting for the largest median family size of 3.33 persons per family. On the other hand, single female/mother families (52 | 9.6%) represent the smallest median family size with 2.71 persons per family.
| Family Type | # Families | Family Size |
| Married-Couple | 487 (89.8%) | 3.30 |
| Single Male/Father | 3 (0.5%) | 3.33 |
| Single Female/Mother | 52 (9.6%) | 2.71 |
| Total Families | 542 (100.0%) | 3.25 |
Median Household Size in Mason Neck
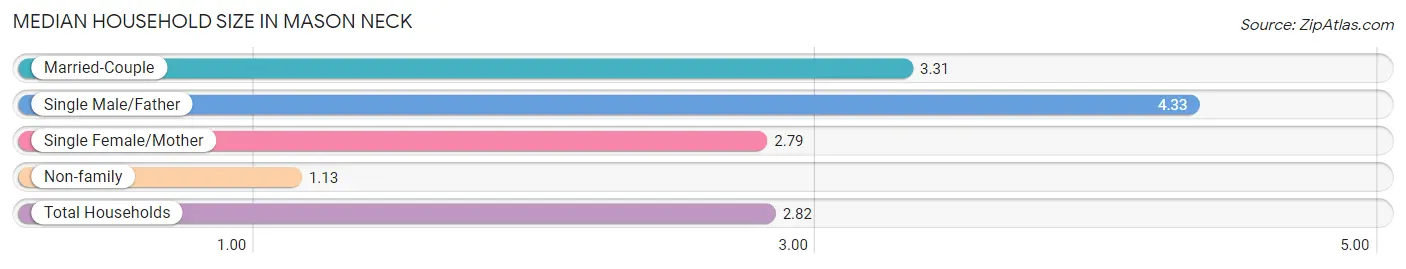
The median household size in Mason Neck is 2.82 persons per household, with single male/father households (3 | 0.4%) accounting for the largest median household size of 4.33 persons per household. non-family households (143 | 20.9%) represent the smallest median household size with 1.13 persons per household.
| Household Type | # Households | Household Size |
| Married-Couple | 487 (71.1%) | 3.31 |
| Single Male/Father | 3 (0.4%) | 4.33 |
| Single Female/Mother | 52 (7.6%) | 2.79 |
| Non-family | 143 (20.9%) | 1.13 |
| Total Households | 685 (100.0%) | 2.82 |
Household Size by Marriage Status in Mason Neck
Out of a total of 685 households in Mason Neck, 542 (79.1%) are family households, while 143 (20.9%) are nonfamily households. The most numerous type of family households are 2-person households, comprising 249, and the most common type of nonfamily households are 1-person households, comprising 126.
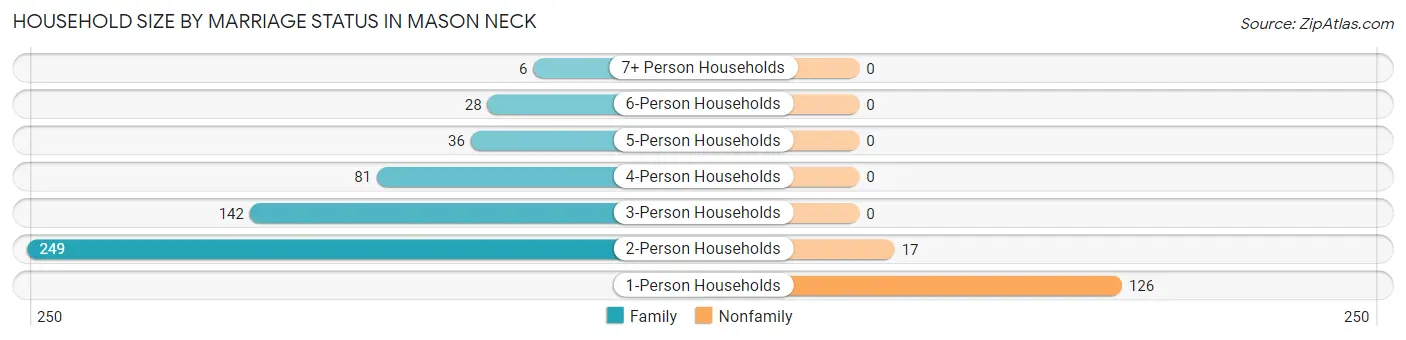
| Household Size | Family Households | Nonfamily Households |
| 1-Person Households | - | 126 (18.4%) |
| 2-Person Households | 249 (36.3%) | 17 (2.5%) |
| 3-Person Households | 142 (20.7%) | 0 (0.0%) |
| 4-Person Households | 81 (11.8%) | 0 (0.0%) |
| 5-Person Households | 36 (5.3%) | 0 (0.0%) |
| 6-Person Households | 28 (4.1%) | 0 (0.0%) |
| 7+ Person Households | 6 (0.9%) | 0 (0.0%) |
| Total | 542 (79.1%) | 143 (20.9%) |
Female Fertility in Mason Neck
Fertility by Age in Mason Neck
Average fertility rate in Mason Neck is 38.0 births per 1,000 women. Women in the age bracket of 20 to 34 years have the highest fertility rate with 91.0 births per 1,000 women. Women in the age bracket of 35 to 50 years acount for 53.8% of all women with births.
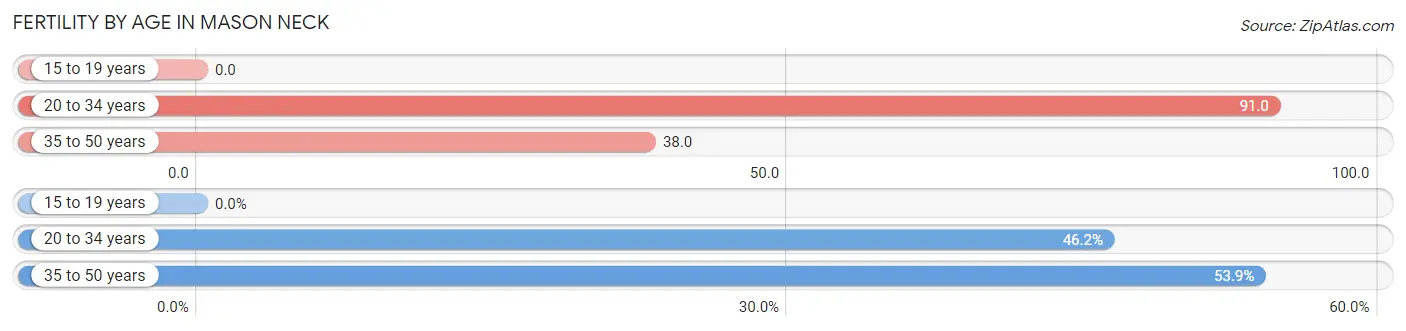
| Age Bracket | Women with Births | Births / 1,000 Women |
| 15 to 19 years | 0 (0.0%) | 0.0 |
| 20 to 34 years | 6 (46.2%) | 91.0 |
| 35 to 50 years | 7 (53.8%) | 38.0 |
| Total | 13 (100.0%) | 38.0 |
Fertility by Age by Marriage Status in Mason Neck
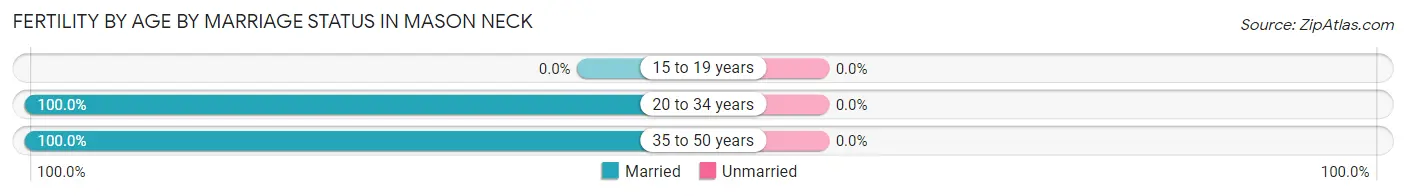
| Age Bracket | Married | Unmarried |
| 15 to 19 years | 0 (0.0%) | 0 (0.0%) |
| 20 to 34 years | 6 (100.0%) | 0 (0.0%) |
| 35 to 50 years | 7 (100.0%) | 0 (0.0%) |
| Total | 13 (100.0%) | 0 (0.0%) |
Fertility by Education in Mason Neck
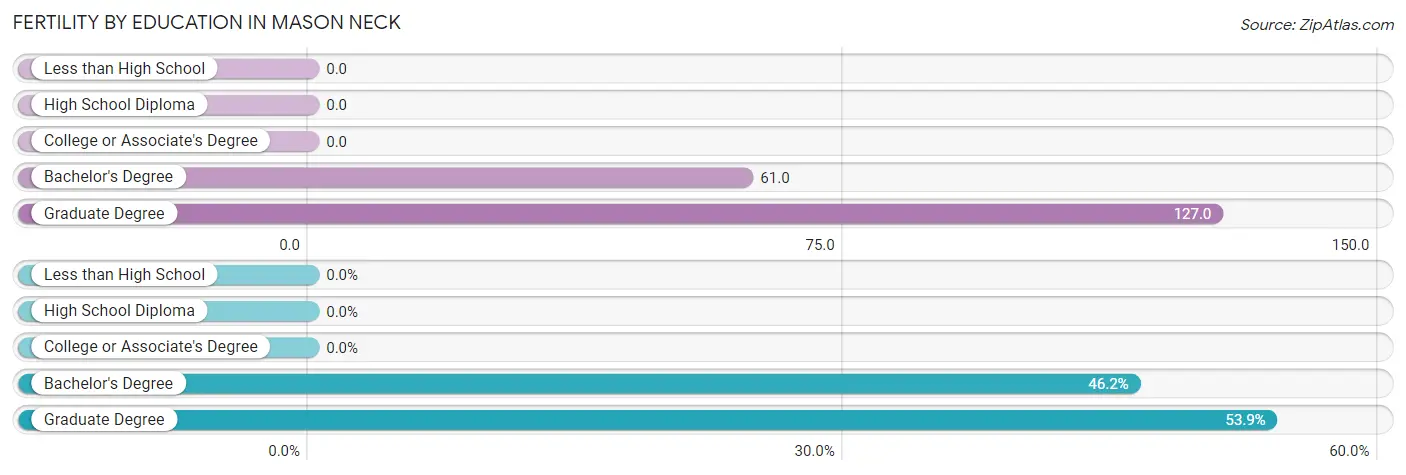
| Educational Attainment | Women with Births | Births / 1,000 Women |
| Less than High School | 0 (0.0%) | 0.0 |
| High School Diploma | 0 (0.0%) | 0.0 |
| College or Associate's Degree | 0 (0.0%) | 0.0 |
| Bachelor's Degree | 6 (46.2%) | 61.0 |
| Graduate Degree | 7 (53.8%) | 127.0 |
| Total | 13 (100.0%) | 38.0 |
Fertility by Education by Marriage Status in Mason Neck
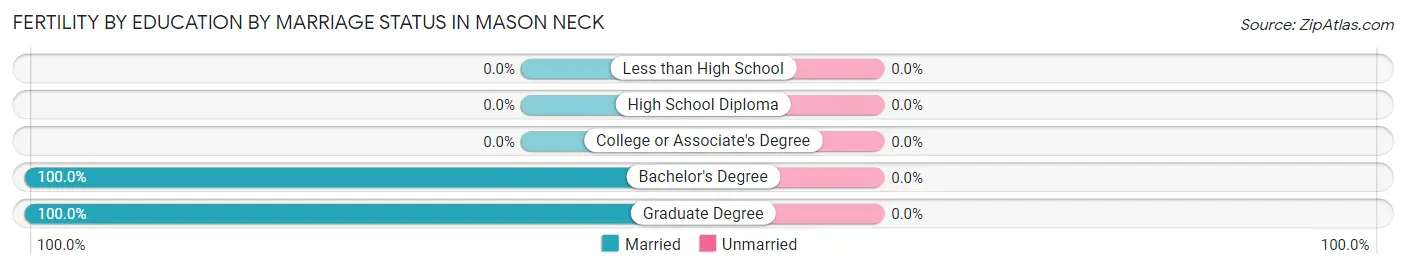
| Educational Attainment | Married | Unmarried |
| Less than High School | 0 (0.0%) | 0 (0.0%) |
| High School Diploma | 0 (0.0%) | 0 (0.0%) |
| College or Associate's Degree | 0 (0.0%) | 0 (0.0%) |
| Bachelor's Degree | 6 (100.0%) | 0 (0.0%) |
| Graduate Degree | 7 (100.0%) | 0 (0.0%) |
| Total | 13 (100.0%) | 0 (0.0%) |
Employment Characteristics in Mason Neck
Employment by Class of Employer in Mason Neck
Among the 982 employed individuals in Mason Neck, private company employees (573 | 58.4%), federal government employees (121 | 12.3%), and local government employees (107 | 10.9%) make up the most common classes of employment.
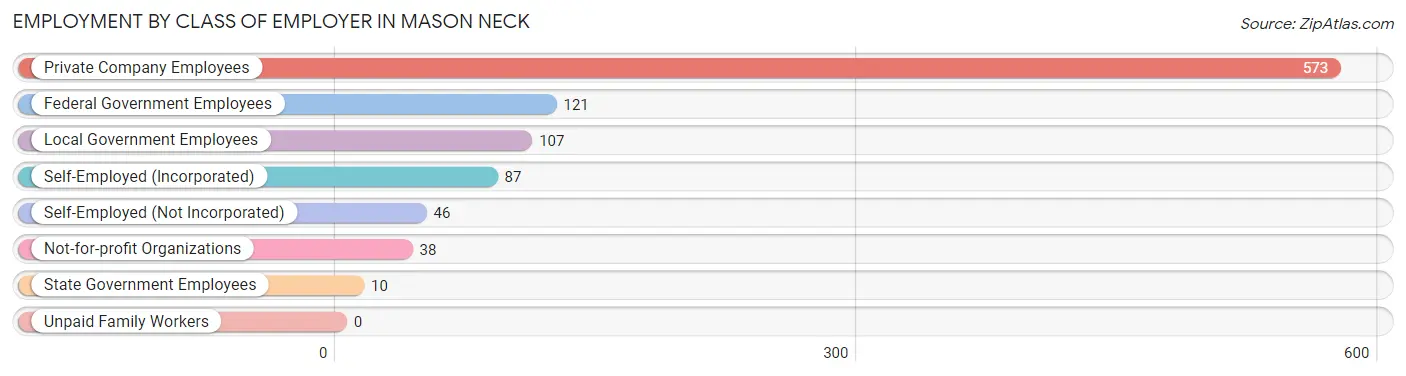
| Employer Class | # Employees | % Employees |
| Private Company Employees | 573 | 58.4% |
| Self-Employed (Incorporated) | 87 | 8.9% |
| Self-Employed (Not Incorporated) | 46 | 4.7% |
| Not-for-profit Organizations | 38 | 3.9% |
| Local Government Employees | 107 | 10.9% |
| State Government Employees | 10 | 1.0% |
| Federal Government Employees | 121 | 12.3% |
| Unpaid Family Workers | 0 | 0.0% |
| Total | 982 | 100.0% |
Employment Status by Age in Mason Neck
According to the labor force statistics for Mason Neck, out of the total population over 16 years of age (1,621), 64.7% or 1,049 individuals are in the labor force, with 4.9% or 51 of them unemployed. The age group with the highest labor force participation rate is 55 to 59 years, with 92.8% or 270 individuals in the labor force. Within the labor force, the 16 to 19 years age range has the highest percentage of unemployed individuals, with 17.1% or 13 of them being unemployed.
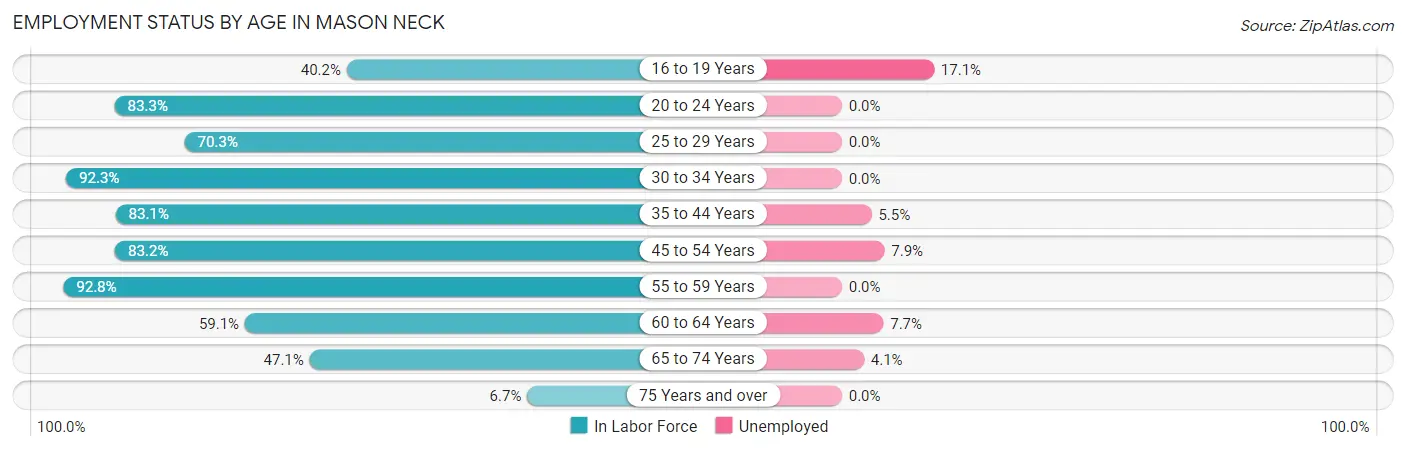
| Age Bracket | In Labor Force | Unemployed |
| 16 to 19 Years | 76 (40.2%) | 13 (17.1%) |
| 20 to 24 Years | 40 (83.3%) | 0 (0.0%) |
| 25 to 29 Years | 45 (70.3%) | 0 (0.0%) |
| 30 to 34 Years | 36 (92.3%) | 0 (0.0%) |
| 35 to 44 Years | 118 (83.1%) | 6 (5.5%) |
| 45 to 54 Years | 252 (83.2%) | 20 (7.9%) |
| 55 to 59 Years | 270 (92.8%) | 0 (0.0%) |
| 60 to 64 Years | 104 (59.1%) | 8 (7.7%) |
| 65 to 74 Years | 97 (47.1%) | 4 (4.1%) |
| 75 Years and over | 11 (6.7%) | 0 (0.0%) |
| Total | 1,049 (64.7%) | 51 (4.9%) |
Employment Status by Educational Attainment in Mason Neck
According to labor force statistics for Mason Neck, 81.3% of individuals (825) out of the total population between 25 and 64 years of age (1,015) are in the labor force, with 4.1% or 34 of them being unemployed. The group with the highest labor force participation rate are those with the educational attainment of high school diploma, with 85.7% or 191 individuals in the labor force. Within the labor force, individuals with college / associate degree education have the highest percentage of unemployment, with 12.2% or 23 of them being unemployed.
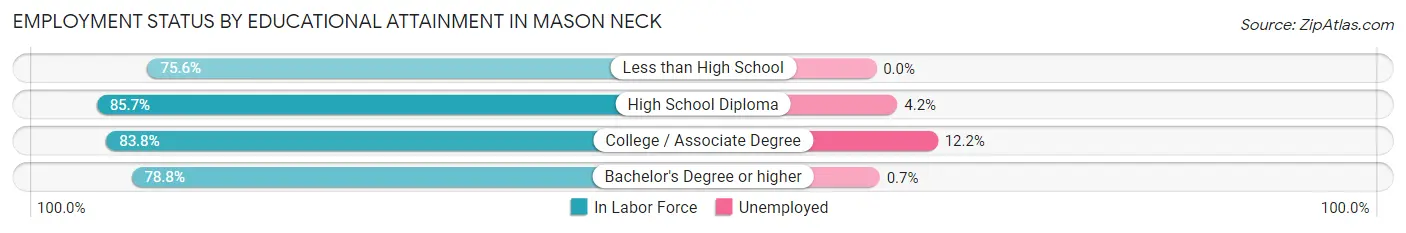
| Educational Attainment | In Labor Force | Unemployed |
| Less than High School | 31 (75.6%) | 0 (0.0%) |
| High School Diploma | 191 (85.7%) | 9 (4.2%) |
| College / Associate Degree | 186 (83.8%) | 27 (12.2%) |
| Bachelor's Degree or higher | 417 (78.8%) | 4 (0.7%) |
| Total | 825 (81.3%) | 42 (4.1%) |
Employment Occupations by Sex in Mason Neck
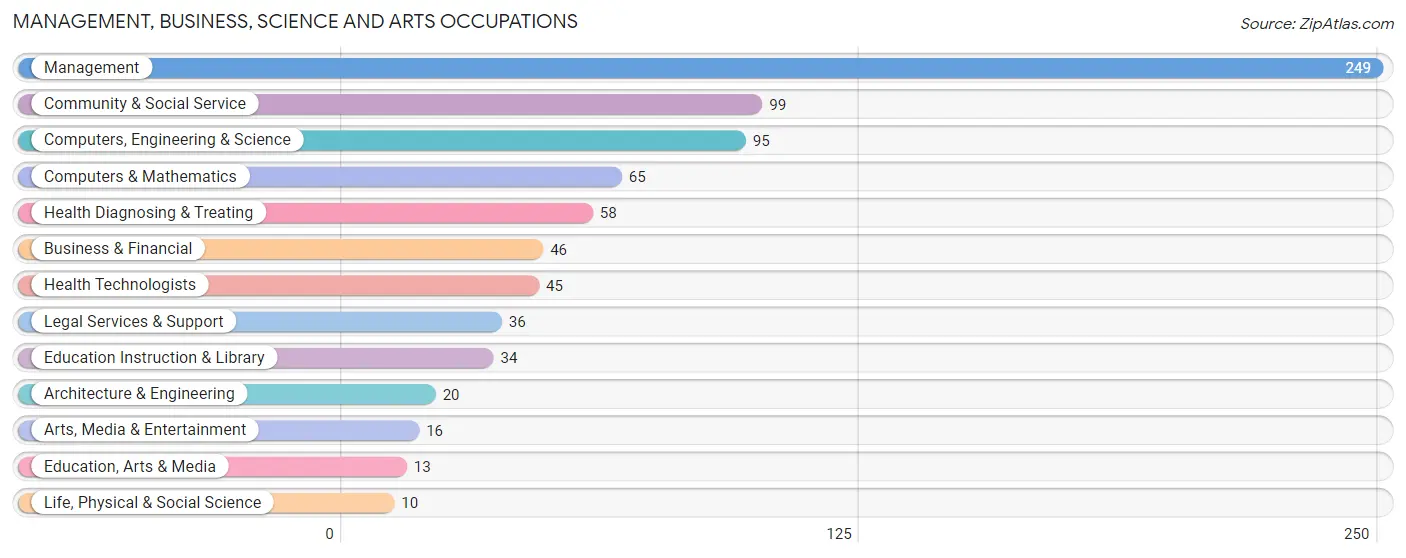
Management, Business, Science and Arts Occupations
The most common Management, Business, Science and Arts occupations in Mason Neck are Management (249 | 25.4%), Community & Social Service (99 | 10.1%), Computers, Engineering & Science (95 | 9.7%), Computers & Mathematics (65 | 6.6%), and Health Diagnosing & Treating (58 | 5.9%).
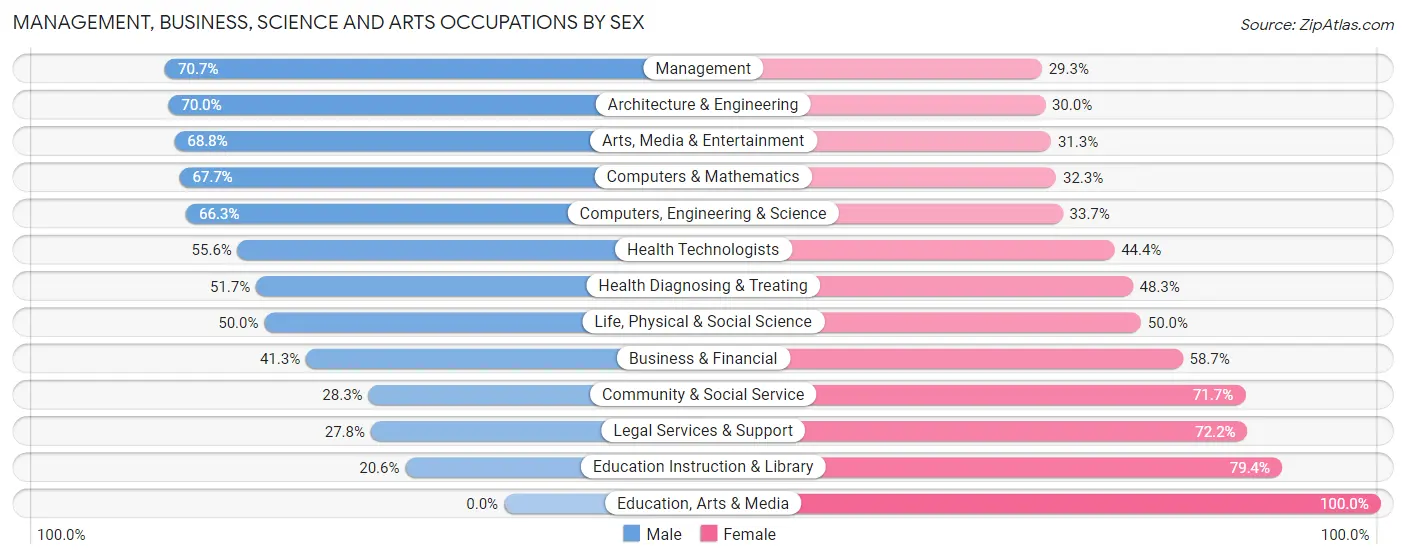
Management, Business, Science and Arts Occupations by Sex
Within the Management, Business, Science and Arts occupations in Mason Neck, the most male-oriented occupations are Management (70.7%), Architecture & Engineering (70.0%), and Arts, Media & Entertainment (68.8%), while the most female-oriented occupations are Education, Arts & Media (100.0%), Education Instruction & Library (79.4%), and Legal Services & Support (72.2%).
| Occupation | Male | Female |
| Management | 176 (70.7%) | 73 (29.3%) |
| Business & Financial | 19 (41.3%) | 27 (58.7%) |
| Computers, Engineering & Science | 63 (66.3%) | 32 (33.7%) |
| Computers & Mathematics | 44 (67.7%) | 21 (32.3%) |
| Architecture & Engineering | 14 (70.0%) | 6 (30.0%) |
| Life, Physical & Social Science | 5 (50.0%) | 5 (50.0%) |
| Community & Social Service | 28 (28.3%) | 71 (71.7%) |
| Education, Arts & Media | 0 (0.0%) | 13 (100.0%) |
| Legal Services & Support | 10 (27.8%) | 26 (72.2%) |
| Education Instruction & Library | 7 (20.6%) | 27 (79.4%) |
| Arts, Media & Entertainment | 11 (68.8%) | 5 (31.2%) |
| Health Diagnosing & Treating | 30 (51.7%) | 28 (48.3%) |
| Health Technologists | 25 (55.6%) | 20 (44.4%) |
| Total (Category) | 316 (57.8%) | 231 (42.2%) |
| Total (Overall) | 573 (58.5%) | 406 (41.5%) |
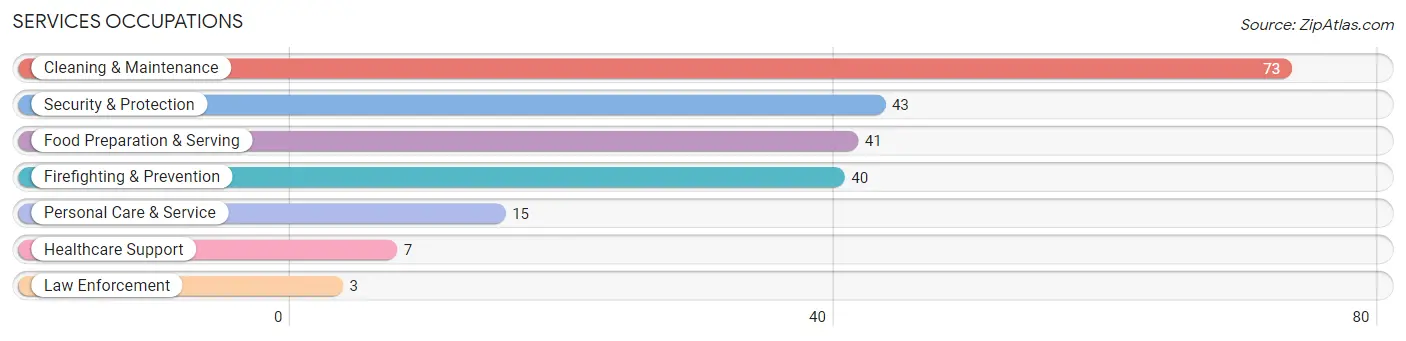
Services Occupations
The most common Services occupations in Mason Neck are Cleaning & Maintenance (73 | 7.5%), Security & Protection (43 | 4.4%), Food Preparation & Serving (41 | 4.2%), Firefighting & Prevention (40 | 4.1%), and Personal Care & Service (15 | 1.5%).
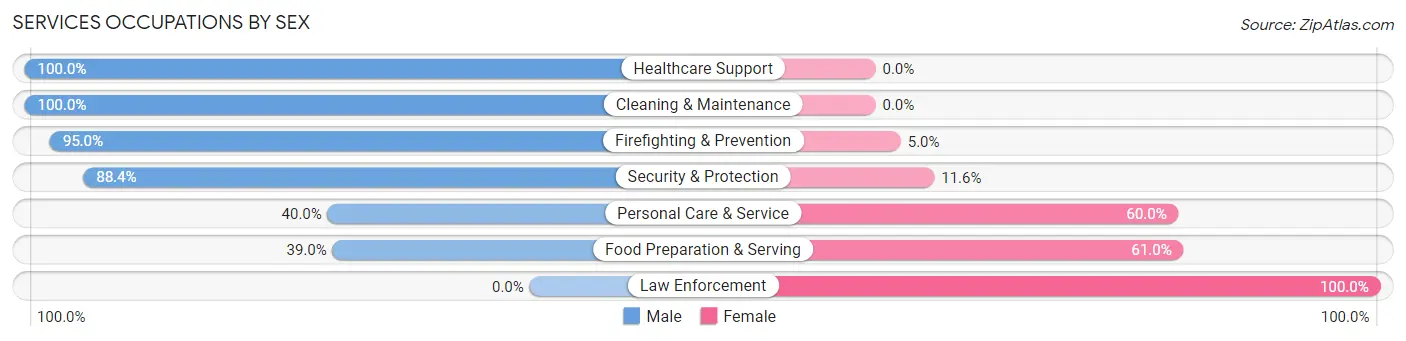
Services Occupations by Sex
Within the Services occupations in Mason Neck, the most male-oriented occupations are Healthcare Support (100.0%), Cleaning & Maintenance (100.0%), and Firefighting & Prevention (95.0%), while the most female-oriented occupations are Law Enforcement (100.0%), Food Preparation & Serving (61.0%), and Personal Care & Service (60.0%).
| Occupation | Male | Female |
| Healthcare Support | 7 (100.0%) | 0 (0.0%) |
| Security & Protection | 38 (88.4%) | 5 (11.6%) |
| Firefighting & Prevention | 38 (95.0%) | 2 (5.0%) |
| Law Enforcement | 0 (0.0%) | 3 (100.0%) |
| Food Preparation & Serving | 16 (39.0%) | 25 (61.0%) |
| Cleaning & Maintenance | 73 (100.0%) | 0 (0.0%) |
| Personal Care & Service | 6 (40.0%) | 9 (60.0%) |
| Total (Category) | 140 (78.2%) | 39 (21.8%) |
| Total (Overall) | 573 (58.5%) | 406 (41.5%) |
Sales and Office Occupations
The most common Sales and Office occupations in Mason Neck are Office & Administration (84 | 8.6%), and Sales & Related (35 | 3.6%).

Sales and Office Occupations by Sex
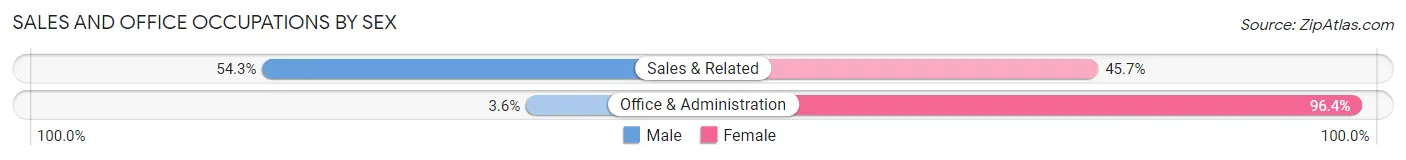
| Occupation | Male | Female |
| Sales & Related | 19 (54.3%) | 16 (45.7%) |
| Office & Administration | 3 (3.6%) | 81 (96.4%) |
| Total (Category) | 22 (18.5%) | 97 (81.5%) |
| Total (Overall) | 573 (58.5%) | 406 (41.5%) |
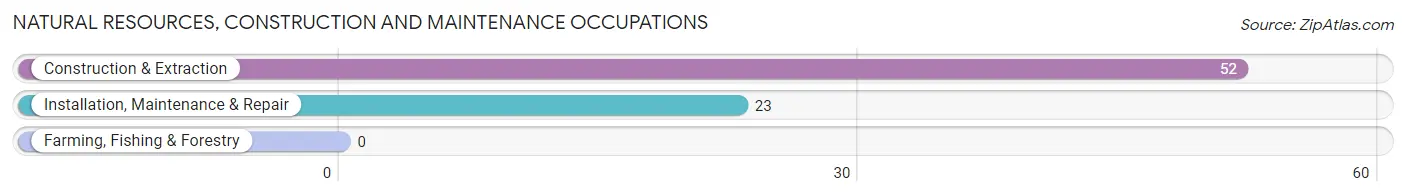
Natural Resources, Construction and Maintenance Occupations
The most common Natural Resources, Construction and Maintenance occupations in Mason Neck are Construction & Extraction (52 | 5.3%), and Installation, Maintenance & Repair (23 | 2.4%).
Natural Resources, Construction and Maintenance Occupations by Sex
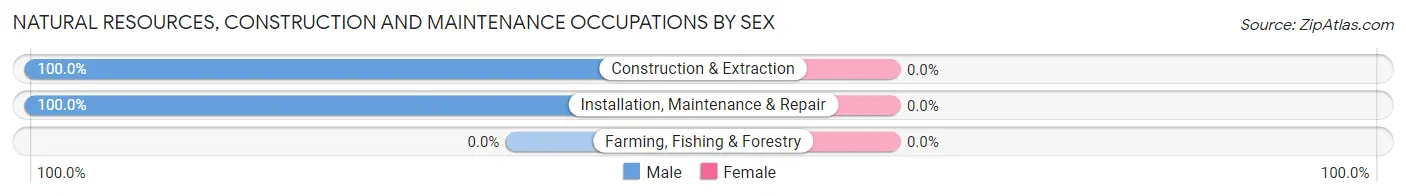
| Occupation | Male | Female |
| Farming, Fishing & Forestry | 0 (0.0%) | 0 (0.0%) |
| Construction & Extraction | 52 (100.0%) | 0 (0.0%) |
| Installation, Maintenance & Repair | 23 (100.0%) | 0 (0.0%) |
| Total (Category) | 75 (100.0%) | 0 (0.0%) |
| Total (Overall) | 573 (58.5%) | 406 (41.5%) |
Production, Transportation and Moving Occupations
The most common Production, Transportation and Moving occupations in Mason Neck are Transportation (40 | 4.1%), and Production (19 | 1.9%).
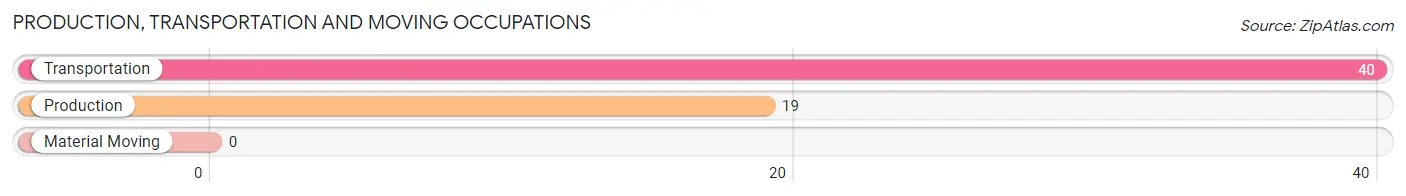
Production, Transportation and Moving Occupations by Sex
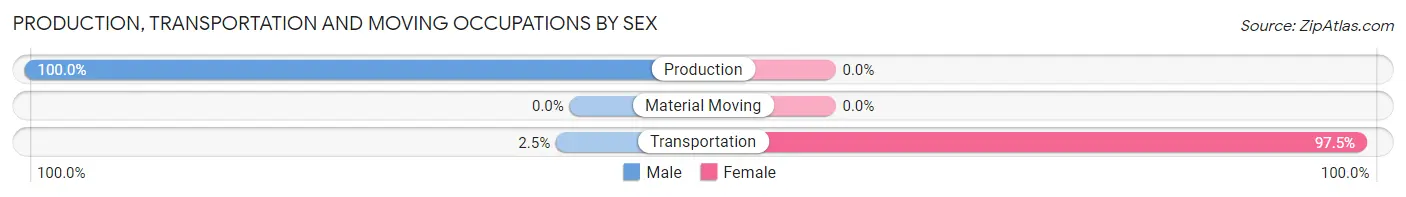
| Occupation | Male | Female |
| Production | 19 (100.0%) | 0 (0.0%) |
| Transportation | 1 (2.5%) | 39 (97.5%) |
| Material Moving | 0 (0.0%) | 0 (0.0%) |
| Total (Category) | 20 (33.9%) | 39 (66.1%) |
| Total (Overall) | 573 (58.5%) | 406 (41.5%) |
Employment Industries by Sex in Mason Neck
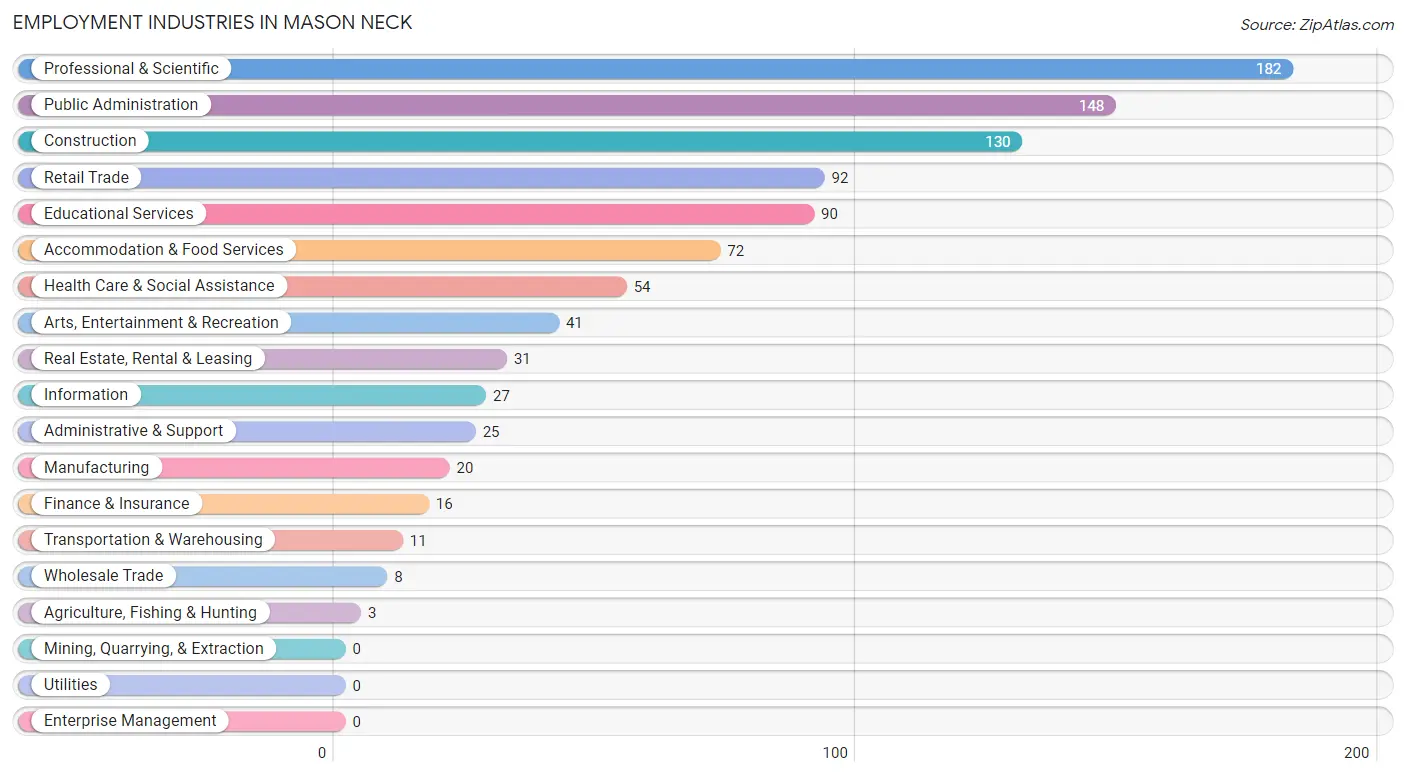
Employment Industries in Mason Neck
The major employment industries in Mason Neck include Professional & Scientific (182 | 18.6%), Public Administration (148 | 15.1%), Construction (130 | 13.3%), Retail Trade (92 | 9.4%), and Educational Services (90 | 9.2%).
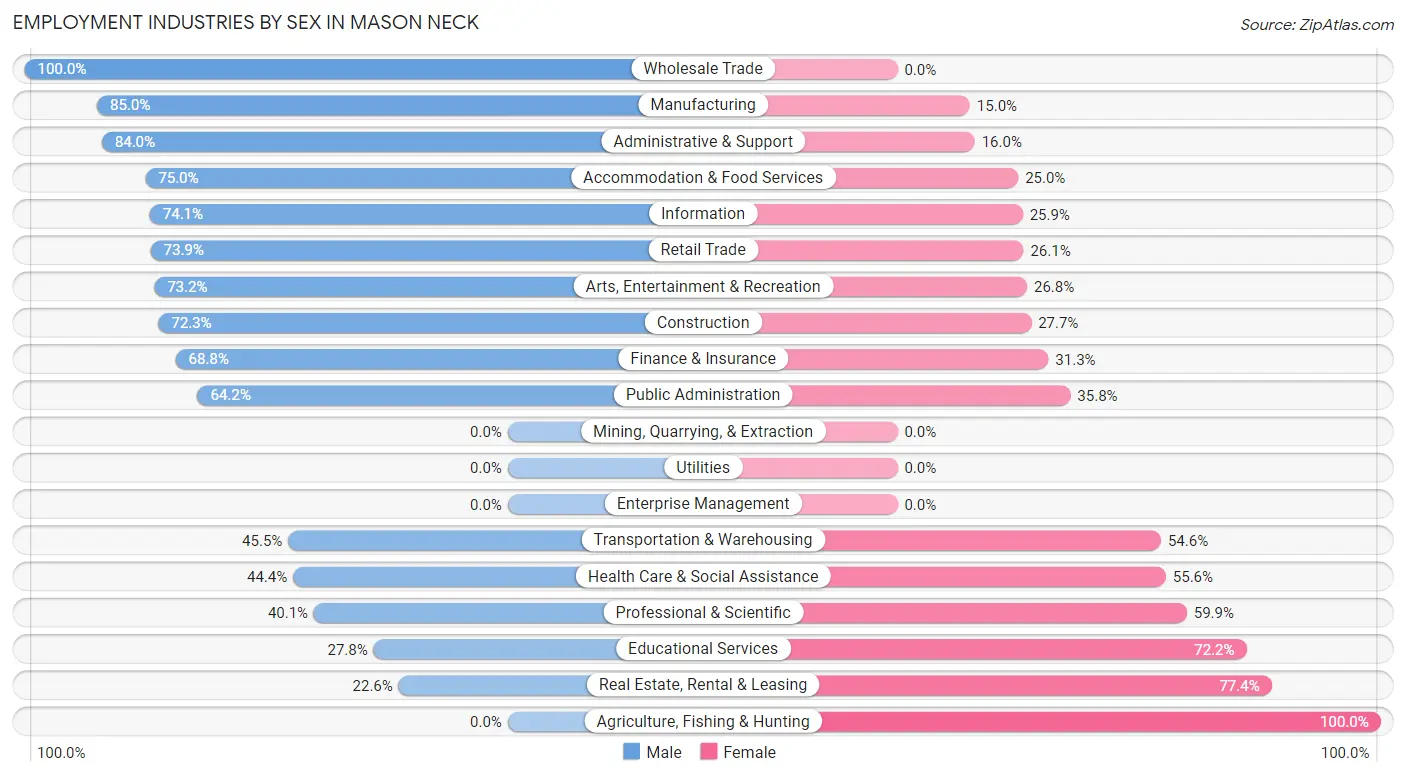
Employment Industries by Sex in Mason Neck
The Mason Neck industries that see more men than women are Wholesale Trade (100.0%), Manufacturing (85.0%), and Administrative & Support (84.0%), whereas the industries that tend to have a higher number of women are Agriculture, Fishing & Hunting (100.0%), Real Estate, Rental & Leasing (77.4%), and Educational Services (72.2%).
| Industry | Male | Female |
| Agriculture, Fishing & Hunting | 0 (0.0%) | 3 (100.0%) |
| Mining, Quarrying, & Extraction | 0 (0.0%) | 0 (0.0%) |
| Construction | 94 (72.3%) | 36 (27.7%) |
| Manufacturing | 17 (85.0%) | 3 (15.0%) |
| Wholesale Trade | 8 (100.0%) | 0 (0.0%) |
| Retail Trade | 68 (73.9%) | 24 (26.1%) |
| Transportation & Warehousing | 5 (45.5%) | 6 (54.5%) |
| Utilities | 0 (0.0%) | 0 (0.0%) |
| Information | 20 (74.1%) | 7 (25.9%) |
| Finance & Insurance | 11 (68.8%) | 5 (31.2%) |
| Real Estate, Rental & Leasing | 7 (22.6%) | 24 (77.4%) |
| Professional & Scientific | 73 (40.1%) | 109 (59.9%) |
| Enterprise Management | 0 (0.0%) | 0 (0.0%) |
| Administrative & Support | 21 (84.0%) | 4 (16.0%) |
| Educational Services | 25 (27.8%) | 65 (72.2%) |
| Health Care & Social Assistance | 24 (44.4%) | 30 (55.6%) |
| Arts, Entertainment & Recreation | 30 (73.2%) | 11 (26.8%) |
| Accommodation & Food Services | 54 (75.0%) | 18 (25.0%) |
| Public Administration | 95 (64.2%) | 53 (35.8%) |
| Total | 573 (58.5%) | 406 (41.5%) |
Education in Mason Neck
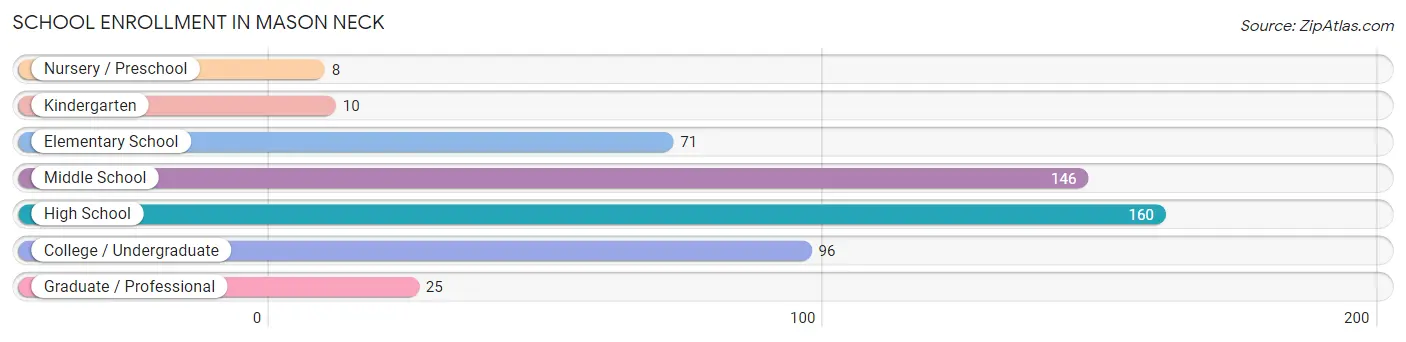
School Enrollment in Mason Neck
The most common levels of schooling among the 516 students in Mason Neck are high school (160 | 31.0%), middle school (146 | 28.3%), and college / undergraduate (96 | 18.6%).
| School Level | # Students | % Students |
| Nursery / Preschool | 8 | 1.5% |
| Kindergarten | 10 | 1.9% |
| Elementary School | 71 | 13.8% |
| Middle School | 146 | 28.3% |
| High School | 160 | 31.0% |
| College / Undergraduate | 96 | 18.6% |
| Graduate / Professional | 25 | 4.8% |
| Total | 516 | 100.0% |
School Enrollment by Age by Funding Source in Mason Neck
Out of a total of 516 students who are enrolled in schools in Mason Neck, 116 (22.5%) attend a private institution, while the remaining 400 (77.5%) are enrolled in public schools. The age group of 3 to 4 year olds has the highest likelihood of being enrolled in private schools, with 8 (100.0% in the age bracket) enrolled. Conversely, the age group of 20 to 24 year olds has the lowest likelihood of being enrolled in a private school, with 21 (100.0% in the age bracket) attending a public institution.
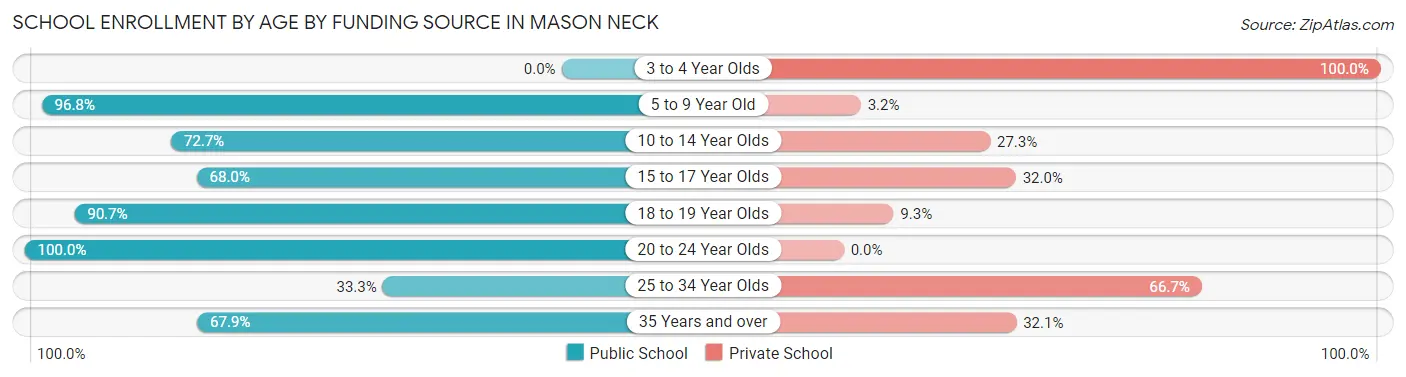
| Age Bracket | Public School | Private School |
| 3 to 4 Year Olds | 0 (0.0%) | 8 (100.0%) |
| 5 to 9 Year Old | 61 (96.8%) | 2 (3.2%) |
| 10 to 14 Year Olds | 128 (72.7%) | 48 (27.3%) |
| 15 to 17 Year Olds | 70 (68.0%) | 33 (32.0%) |
| 18 to 19 Year Olds | 98 (90.7%) | 10 (9.3%) |
| 20 to 24 Year Olds | 21 (100.0%) | 0 (0.0%) |
| 25 to 34 Year Olds | 3 (33.3%) | 6 (66.7%) |
| 35 Years and over | 19 (67.9%) | 9 (32.1%) |
| Total | 400 (77.5%) | 116 (22.5%) |
Educational Attainment by Field of Study in Mason Neck
Business (155 | 18.6%), engineering (111 | 13.3%), social sciences (110 | 13.2%), liberal arts & history (70 | 8.4%), and education (60 | 7.2%) are the most common fields of study among 833 individuals in Mason Neck who have obtained a bachelor's degree or higher.
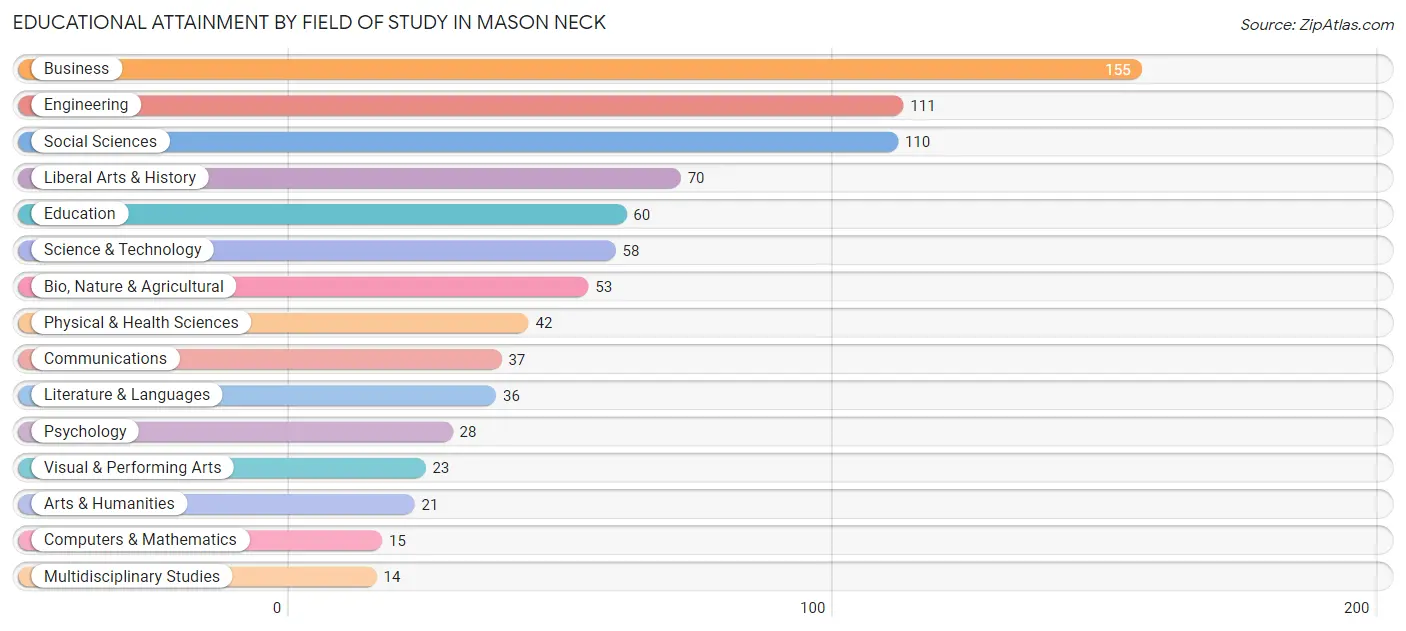
| Field of Study | # Graduates | % Graduates |
| Computers & Mathematics | 15 | 1.8% |
| Bio, Nature & Agricultural | 53 | 6.4% |
| Physical & Health Sciences | 42 | 5.0% |
| Psychology | 28 | 3.4% |
| Social Sciences | 110 | 13.2% |
| Engineering | 111 | 13.3% |
| Multidisciplinary Studies | 14 | 1.7% |
| Science & Technology | 58 | 7.0% |
| Business | 155 | 18.6% |
| Education | 60 | 7.2% |
| Literature & Languages | 36 | 4.3% |
| Liberal Arts & History | 70 | 8.4% |
| Visual & Performing Arts | 23 | 2.8% |
| Communications | 37 | 4.4% |
| Arts & Humanities | 21 | 2.5% |
| Total | 833 | 100.0% |
Transportation & Commute in Mason Neck
Vehicle Availability by Sex in Mason Neck
The most prevalent vehicle ownership categories in Mason Neck are males with 2 vehicles (233, accounting for 39.3%) and females with 2 vehicles (144, making up 59.9%).
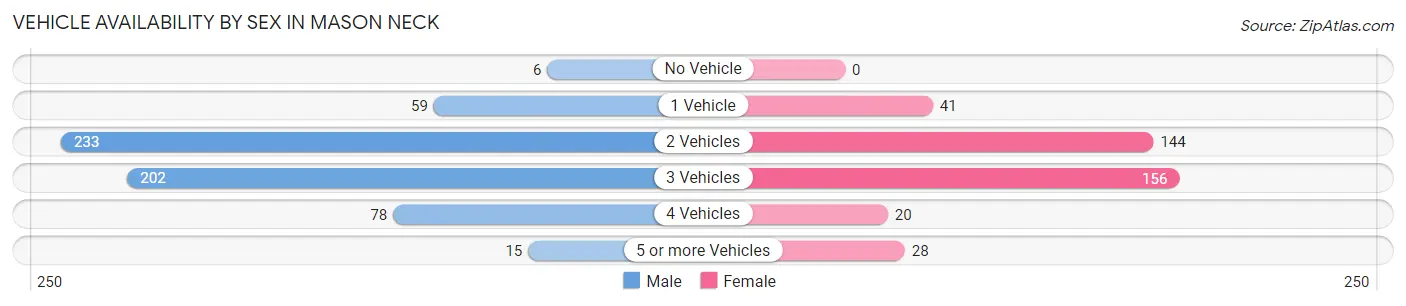
| Vehicles Available | Male | Female |
| No Vehicle | 6 (1.0%) | 0 (0.0%) |
| 1 Vehicle | 59 (10.0%) | 41 (10.5%) |
| 2 Vehicles | 233 (39.3%) | 144 (37.0%) |
| 3 Vehicles | 202 (34.1%) | 156 (40.1%) |
| 4 Vehicles | 78 (13.2%) | 20 (5.1%) |
| 5 or more Vehicles | 15 (2.5%) | 28 (7.2%) |
| Total | 593 (100.0%) | 389 (100.0%) |
Commute Time in Mason Neck
The most frequently occuring commute durations in Mason Neck are 45 to 59 minutes (213 commuters, 25.5%), 20 to 24 minutes (113 commuters, 13.5%), and 25 to 29 minutes (101 commuters, 12.1%).
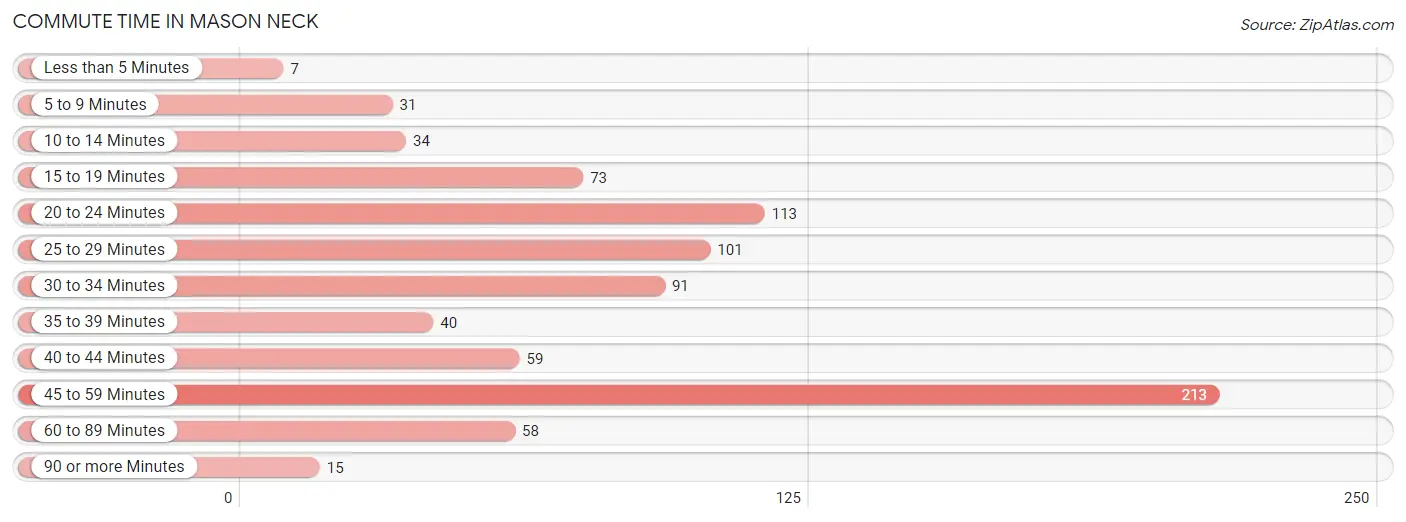
| Commute Time | # Commuters | % Commuters |
| Less than 5 Minutes | 7 | 0.8% |
| 5 to 9 Minutes | 31 | 3.7% |
| 10 to 14 Minutes | 34 | 4.1% |
| 15 to 19 Minutes | 73 | 8.7% |
| 20 to 24 Minutes | 113 | 13.5% |
| 25 to 29 Minutes | 101 | 12.1% |
| 30 to 34 Minutes | 91 | 10.9% |
| 35 to 39 Minutes | 40 | 4.8% |
| 40 to 44 Minutes | 59 | 7.1% |
| 45 to 59 Minutes | 213 | 25.5% |
| 60 to 89 Minutes | 58 | 7.0% |
| 90 or more Minutes | 15 | 1.8% |
Commute Time by Sex in Mason Neck
The most common commute times in Mason Neck are 45 to 59 minutes (162 commuters, 30.6%) for males and 45 to 59 minutes (51 commuters, 16.7%) for females.
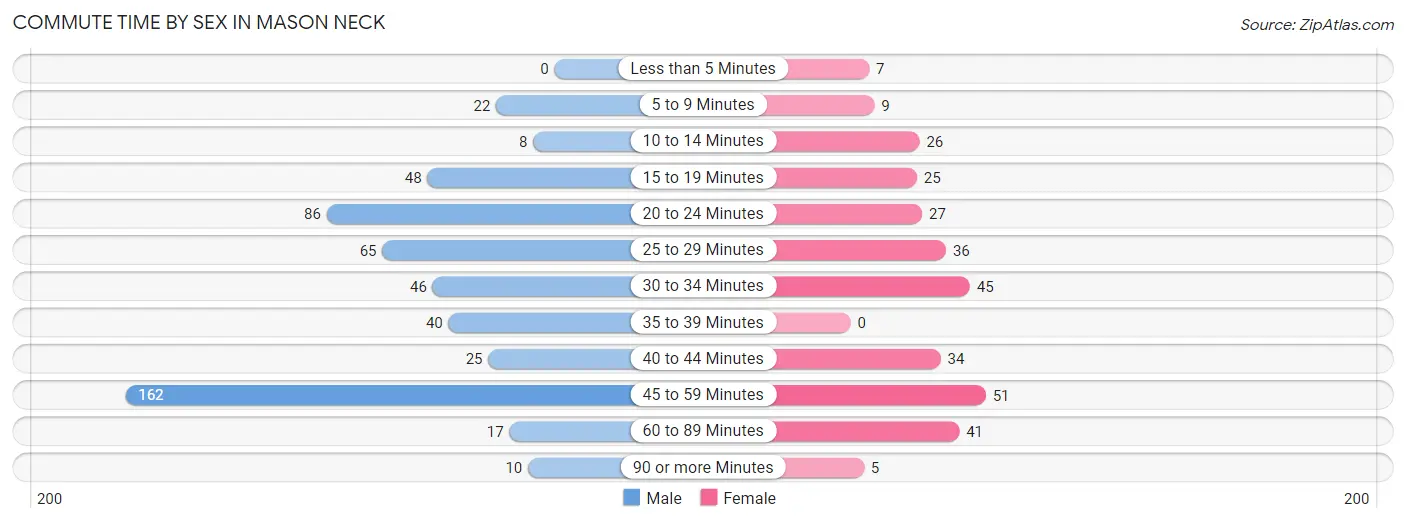
| Commute Time | Male | Female |
| Less than 5 Minutes | 0 (0.0%) | 7 (2.3%) |
| 5 to 9 Minutes | 22 (4.2%) | 9 (2.9%) |
| 10 to 14 Minutes | 8 (1.5%) | 26 (8.5%) |
| 15 to 19 Minutes | 48 (9.1%) | 25 (8.2%) |
| 20 to 24 Minutes | 86 (16.3%) | 27 (8.8%) |
| 25 to 29 Minutes | 65 (12.3%) | 36 (11.8%) |
| 30 to 34 Minutes | 46 (8.7%) | 45 (14.7%) |
| 35 to 39 Minutes | 40 (7.6%) | 0 (0.0%) |
| 40 to 44 Minutes | 25 (4.7%) | 34 (11.1%) |
| 45 to 59 Minutes | 162 (30.6%) | 51 (16.7%) |
| 60 to 89 Minutes | 17 (3.2%) | 41 (13.4%) |
| 90 or more Minutes | 10 (1.9%) | 5 (1.6%) |
Time of Departure to Work by Sex in Mason Neck
The most frequent times of departure to work in Mason Neck are 9:00 AM to 9:59 AM (104, 19.7%) for males and 7:00 AM to 7:29 AM (69, 22.6%) for females.
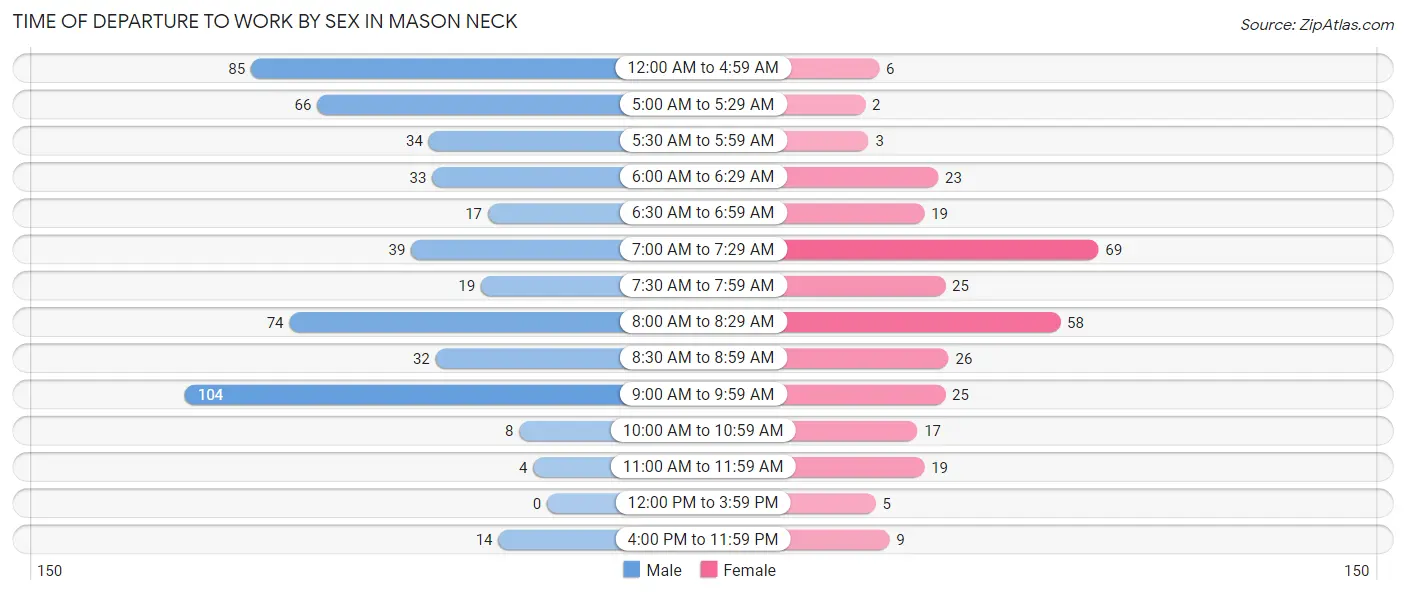
| Time of Departure | Male | Female |
| 12:00 AM to 4:59 AM | 85 (16.1%) | 6 (2.0%) |
| 5:00 AM to 5:29 AM | 66 (12.5%) | 2 (0.6%) |
| 5:30 AM to 5:59 AM | 34 (6.4%) | 3 (1.0%) |
| 6:00 AM to 6:29 AM | 33 (6.2%) | 23 (7.5%) |
| 6:30 AM to 6:59 AM | 17 (3.2%) | 19 (6.2%) |
| 7:00 AM to 7:29 AM | 39 (7.4%) | 69 (22.6%) |
| 7:30 AM to 7:59 AM | 19 (3.6%) | 25 (8.2%) |
| 8:00 AM to 8:29 AM | 74 (14.0%) | 58 (19.0%) |
| 8:30 AM to 8:59 AM | 32 (6.0%) | 26 (8.5%) |
| 9:00 AM to 9:59 AM | 104 (19.7%) | 25 (8.2%) |
| 10:00 AM to 10:59 AM | 8 (1.5%) | 17 (5.6%) |
| 11:00 AM to 11:59 AM | 4 (0.8%) | 19 (6.2%) |
| 12:00 PM to 3:59 PM | 0 (0.0%) | 5 (1.6%) |
| 4:00 PM to 11:59 PM | 14 (2.6%) | 9 (2.9%) |
| Total | 529 (100.0%) | 306 (100.0%) |
Housing Occupancy in Mason Neck
Occupancy by Ownership in Mason Neck
Of the total 685 dwellings in Mason Neck, owner-occupied units account for 634 (92.5%), while renter-occupied units make up 51 (7.4%).
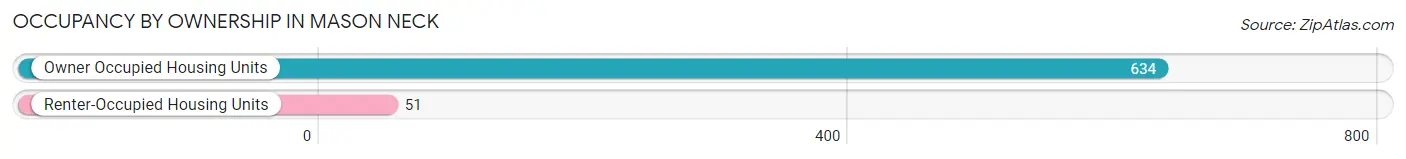
| Occupancy | # Housing Units | % Housing Units |
| Owner Occupied Housing Units | 634 | 92.5% |
| Renter-Occupied Housing Units | 51 | 7.4% |
| Total Occupied Housing Units | 685 | 100.0% |
Occupancy by Household Size in Mason Neck
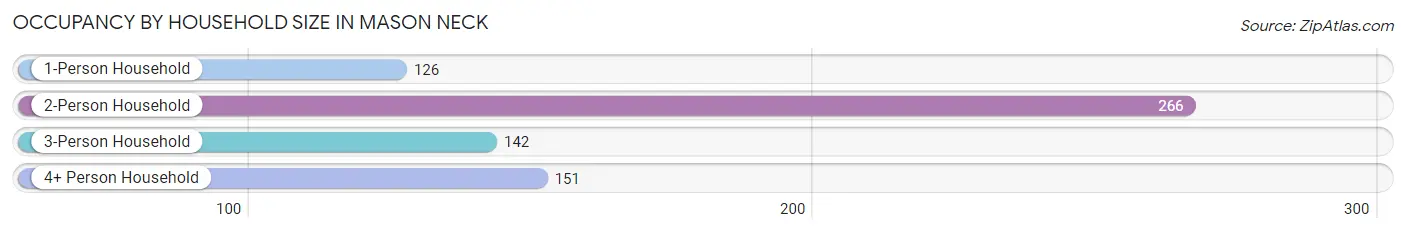
| Household Size | # Housing Units | % Housing Units |
| 1-Person Household | 126 | 18.4% |
| 2-Person Household | 266 | 38.8% |
| 3-Person Household | 142 | 20.7% |
| 4+ Person Household | 151 | 22.0% |
| Total Housing Units | 685 | 100.0% |
Occupancy by Ownership by Household Size in Mason Neck
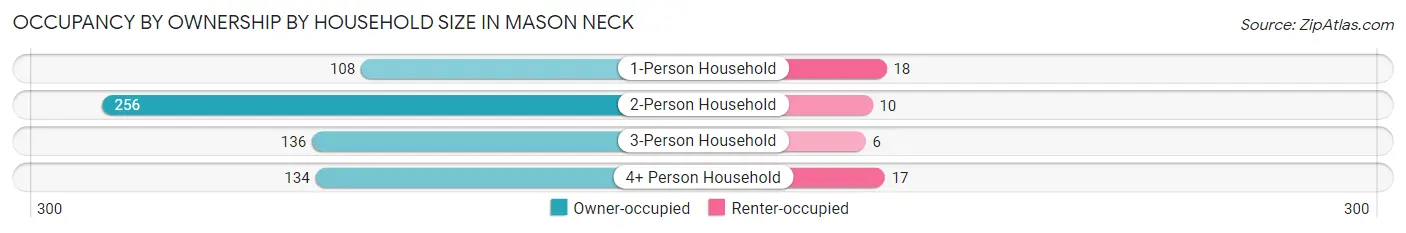
| Household Size | Owner-occupied | Renter-occupied |
| 1-Person Household | 108 (85.7%) | 18 (14.3%) |
| 2-Person Household | 256 (96.2%) | 10 (3.8%) |
| 3-Person Household | 136 (95.8%) | 6 (4.2%) |
| 4+ Person Household | 134 (88.7%) | 17 (11.3%) |
| Total Housing Units | 634 (92.5%) | 51 (7.4%) |
Occupancy by Educational Attainment in Mason Neck
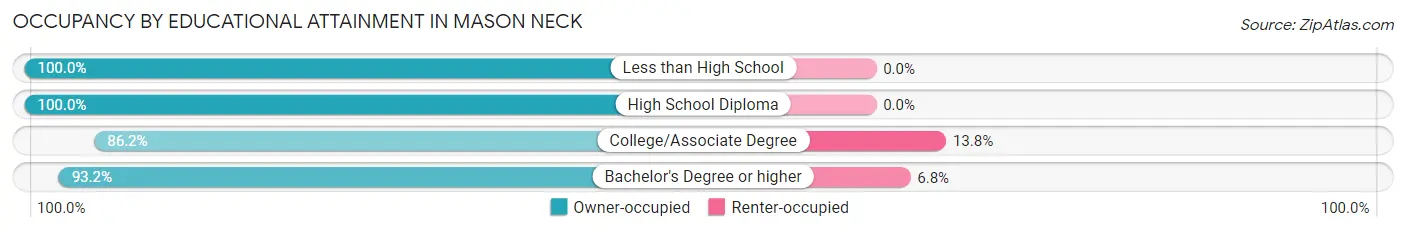
| Household Size | Owner-occupied | Renter-occupied |
| Less than High School | 18 (100.0%) | 0 (0.0%) |
| High School Diploma | 80 (100.0%) | 0 (0.0%) |
| College/Associate Degree | 137 (86.2%) | 22 (13.8%) |
| Bachelor's Degree or higher | 399 (93.2%) | 29 (6.8%) |
Occupancy by Age of Householder in Mason Neck
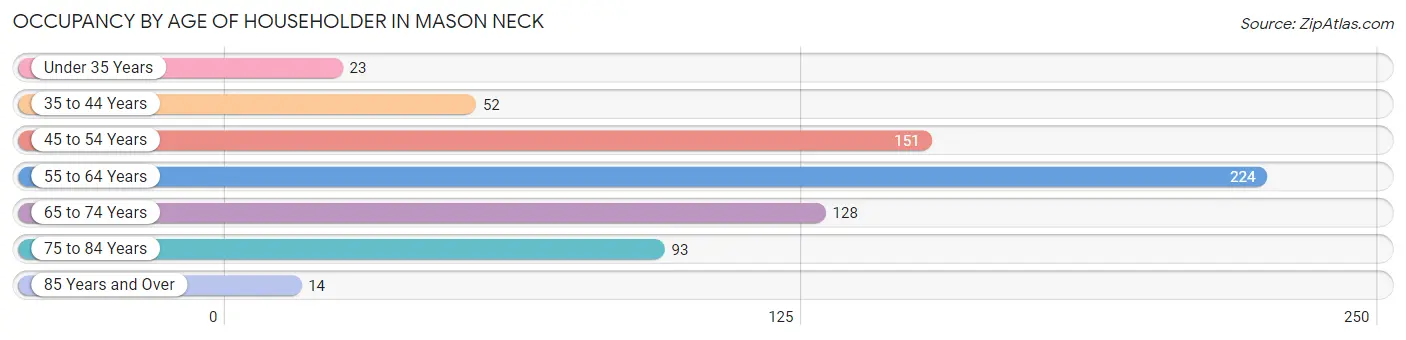
| Age Bracket | # Households | % Households |
| Under 35 Years | 23 | 3.4% |
| 35 to 44 Years | 52 | 7.6% |
| 45 to 54 Years | 151 | 22.0% |
| 55 to 64 Years | 224 | 32.7% |
| 65 to 74 Years | 128 | 18.7% |
| 75 to 84 Years | 93 | 13.6% |
| 85 Years and Over | 14 | 2.0% |
| Total | 685 | 100.0% |
Housing Finances in Mason Neck
Median Income by Occupancy in Mason Neck
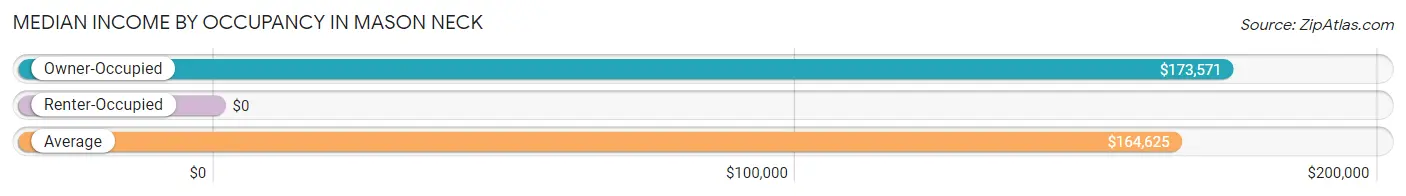
| Occupancy Type | # Households | Median Income |
| Owner-Occupied | 634 (92.5%) | $173,571 |
| Renter-Occupied | 51 (7.4%) | $0 |
| Average | 685 (100.0%) | $164,625 |
Occupancy by Householder Income Bracket in Mason Neck
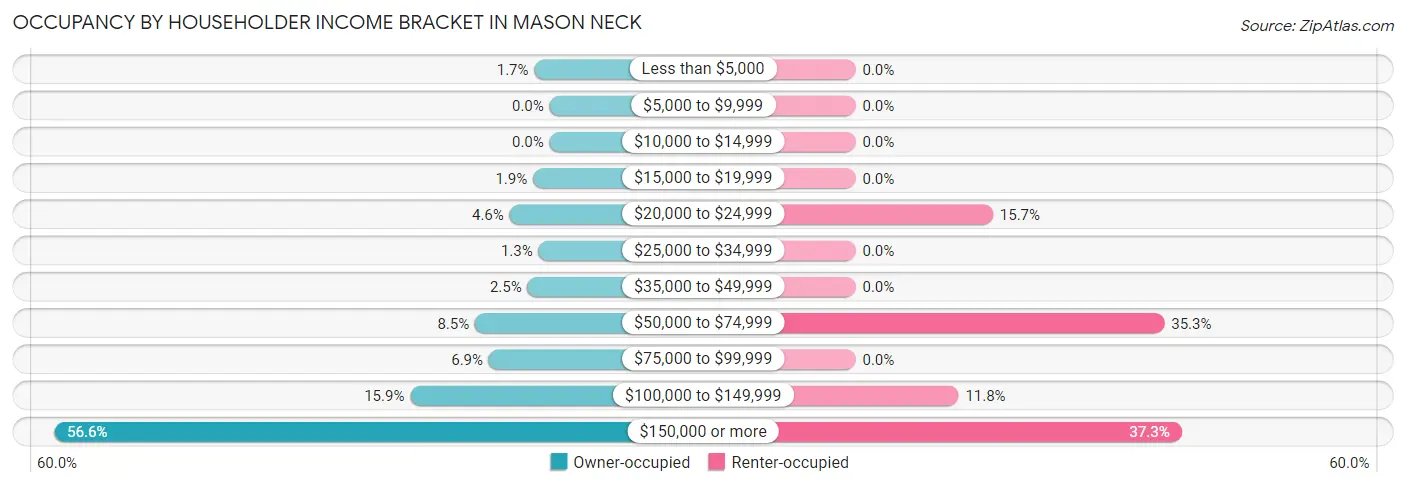
| Income Bracket | Owner-occupied | Renter-occupied |
| Less than $5,000 | 11 (1.7%) | 0 (0.0%) |
| $5,000 to $9,999 | 0 (0.0%) | 0 (0.0%) |
| $10,000 to $14,999 | 0 (0.0%) | 0 (0.0%) |
| $15,000 to $19,999 | 12 (1.9%) | 0 (0.0%) |
| $20,000 to $24,999 | 29 (4.6%) | 8 (15.7%) |
| $25,000 to $34,999 | 8 (1.3%) | 0 (0.0%) |
| $35,000 to $49,999 | 16 (2.5%) | 0 (0.0%) |
| $50,000 to $74,999 | 54 (8.5%) | 18 (35.3%) |
| $75,000 to $99,999 | 44 (6.9%) | 0 (0.0%) |
| $100,000 to $149,999 | 101 (15.9%) | 6 (11.8%) |
| $150,000 or more | 359 (56.6%) | 19 (37.2%) |
| Total | 634 (100.0%) | 51 (100.0%) |
Monthly Housing Cost Tiers in Mason Neck
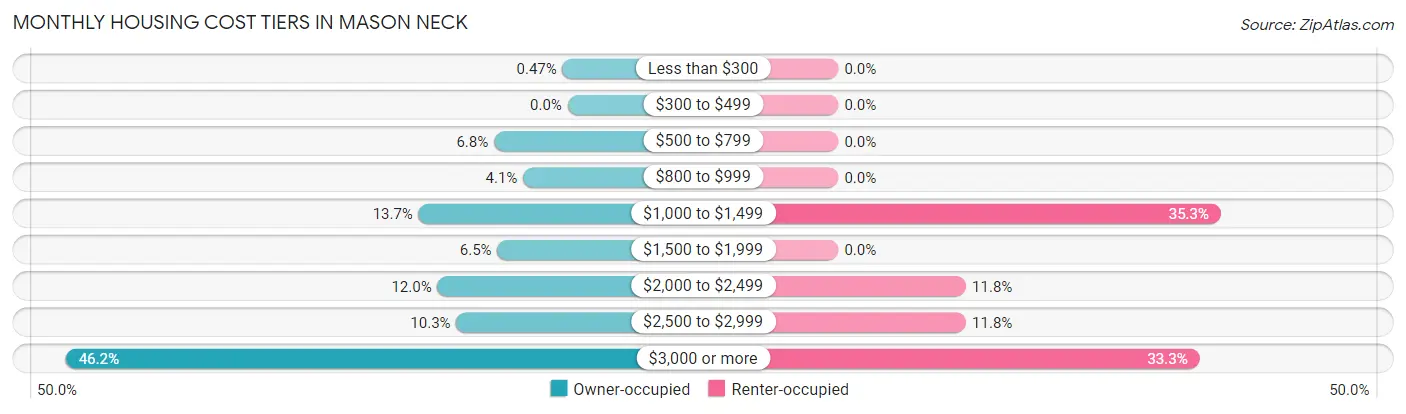
| Monthly Cost | Owner-occupied | Renter-occupied |
| Less than $300 | 3 (0.5%) | 0 (0.0%) |
| $300 to $499 | 0 (0.0%) | 0 (0.0%) |
| $500 to $799 | 43 (6.8%) | 0 (0.0%) |
| $800 to $999 | 26 (4.1%) | 0 (0.0%) |
| $1,000 to $1,499 | 87 (13.7%) | 18 (35.3%) |
| $1,500 to $1,999 | 41 (6.5%) | 0 (0.0%) |
| $2,000 to $2,499 | 76 (12.0%) | 6 (11.8%) |
| $2,500 to $2,999 | 65 (10.2%) | 6 (11.8%) |
| $3,000 or more | 293 (46.2%) | 17 (33.3%) |
| Total | 634 (100.0%) | 51 (100.0%) |
Physical Housing Characteristics in Mason Neck
Housing Structures in Mason Neck
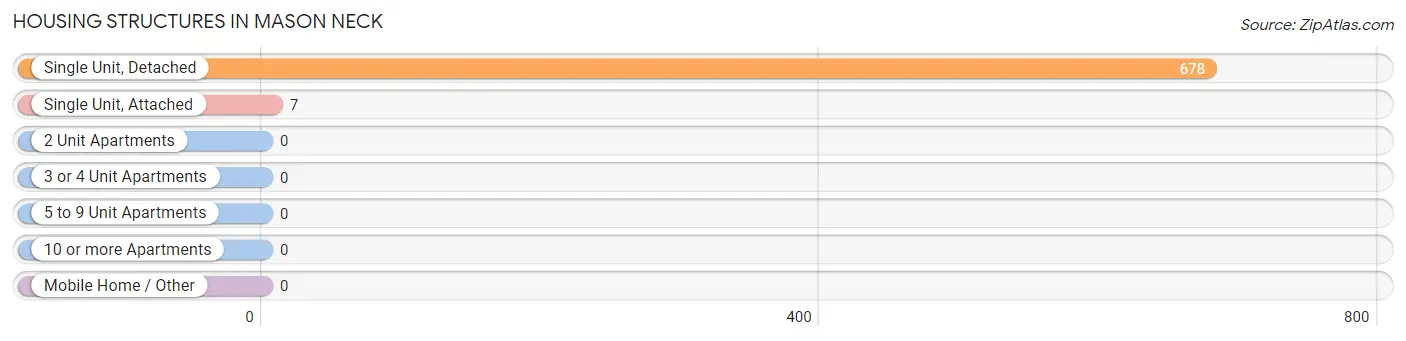
| Structure Type | # Housing Units | % Housing Units |
| Single Unit, Detached | 678 | 99.0% |
| Single Unit, Attached | 7 | 1.0% |
| 2 Unit Apartments | 0 | 0.0% |
| 3 or 4 Unit Apartments | 0 | 0.0% |
| 5 to 9 Unit Apartments | 0 | 0.0% |
| 10 or more Apartments | 0 | 0.0% |
| Mobile Home / Other | 0 | 0.0% |
| Total | 685 | 100.0% |
Housing Structures by Occupancy in Mason Neck
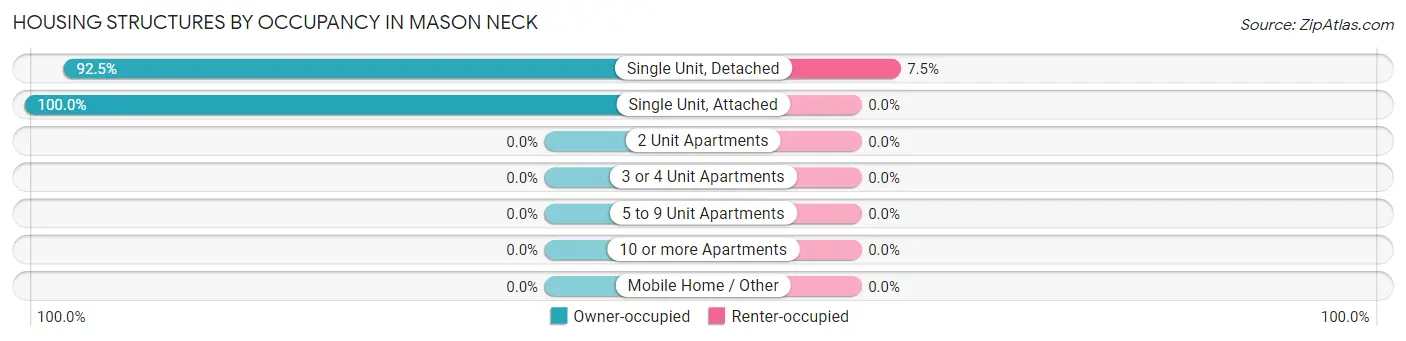
| Structure Type | Owner-occupied | Renter-occupied |
| Single Unit, Detached | 627 (92.5%) | 51 (7.5%) |
| Single Unit, Attached | 7 (100.0%) | 0 (0.0%) |
| 2 Unit Apartments | 0 (0.0%) | 0 (0.0%) |
| 3 or 4 Unit Apartments | 0 (0.0%) | 0 (0.0%) |
| 5 to 9 Unit Apartments | 0 (0.0%) | 0 (0.0%) |
| 10 or more Apartments | 0 (0.0%) | 0 (0.0%) |
| Mobile Home / Other | 0 (0.0%) | 0 (0.0%) |
| Total | 634 (92.5%) | 51 (7.4%) |
Housing Structures by Number of Rooms in Mason Neck
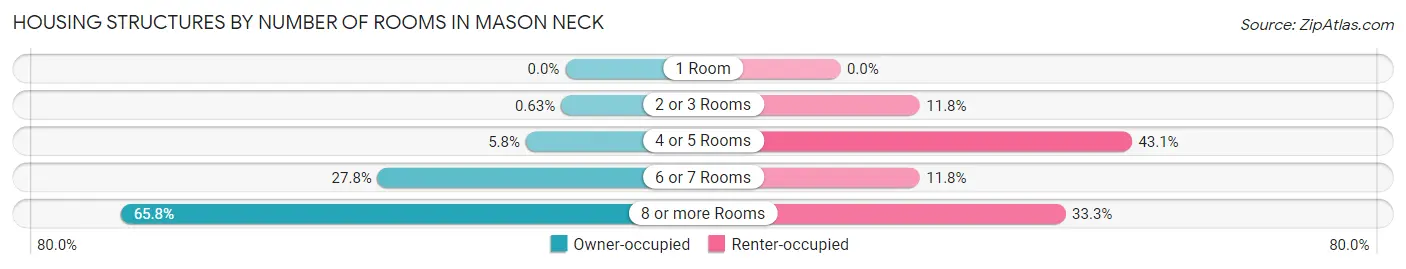
| Number of Rooms | Owner-occupied | Renter-occupied |
| 1 Room | 0 (0.0%) | 0 (0.0%) |
| 2 or 3 Rooms | 4 (0.6%) | 6 (11.8%) |
| 4 or 5 Rooms | 37 (5.8%) | 22 (43.1%) |
| 6 or 7 Rooms | 176 (27.8%) | 6 (11.8%) |
| 8 or more Rooms | 417 (65.8%) | 17 (33.3%) |
| Total | 634 (100.0%) | 51 (100.0%) |
Housing Structure by Heating Type in Mason Neck
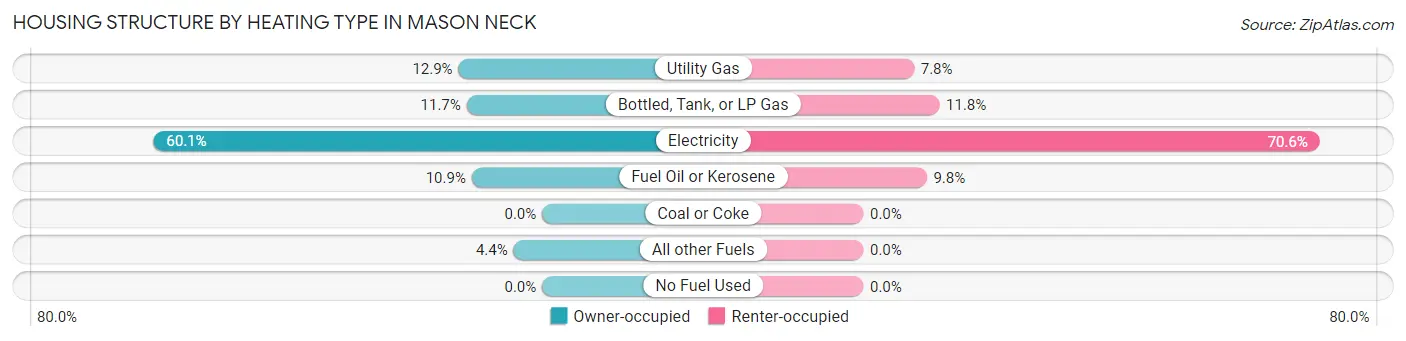
| Heating Type | Owner-occupied | Renter-occupied |
| Utility Gas | 82 (12.9%) | 4 (7.8%) |
| Bottled, Tank, or LP Gas | 74 (11.7%) | 6 (11.8%) |
| Electricity | 381 (60.1%) | 36 (70.6%) |
| Fuel Oil or Kerosene | 69 (10.9%) | 5 (9.8%) |
| Coal or Coke | 0 (0.0%) | 0 (0.0%) |
| All other Fuels | 28 (4.4%) | 0 (0.0%) |
| No Fuel Used | 0 (0.0%) | 0 (0.0%) |
| Total | 634 (100.0%) | 51 (100.0%) |
Household Vehicle Usage in Mason Neck
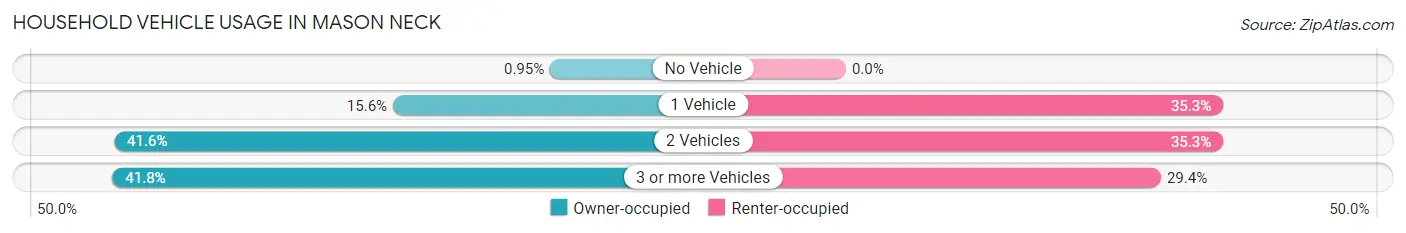
| Vehicles per Household | Owner-occupied | Renter-occupied |
| No Vehicle | 6 (0.9%) | 0 (0.0%) |
| 1 Vehicle | 99 (15.6%) | 18 (35.3%) |
| 2 Vehicles | 264 (41.6%) | 18 (35.3%) |
| 3 or more Vehicles | 265 (41.8%) | 15 (29.4%) |
| Total | 634 (100.0%) | 51 (100.0%) |
Real Estate & Mortgages in Mason Neck
Real Estate and Mortgage Overview in Mason Neck
| Characteristic | Without Mortgage | With Mortgage |
| Housing Units | 158 | 476 |
| Median Property Value | $711,500 | $801,900 |
| Median Household Income | $81,250 | $314 |
| Monthly Housing Costs | $1,035 | $293 |
| Real Estate Taxes | $7,672 | $6 |
Property Value by Mortgage Status in Mason Neck
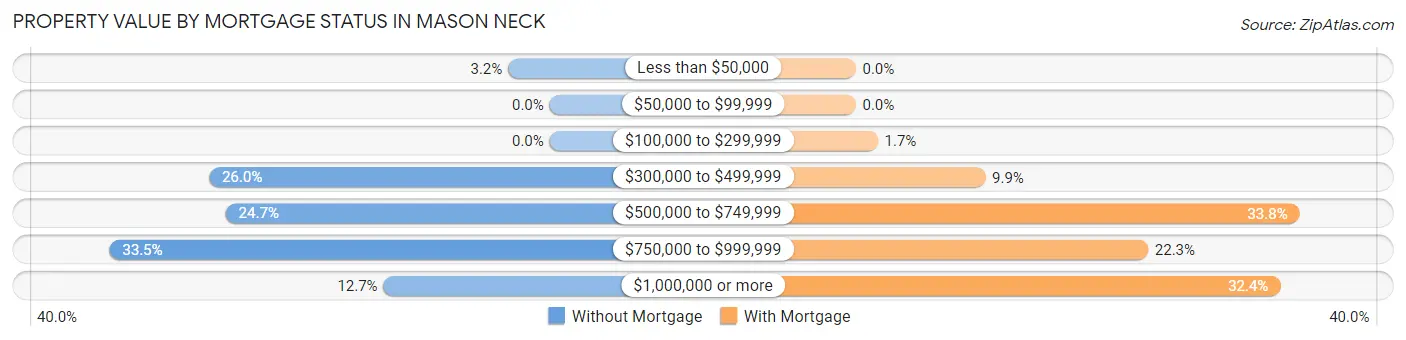
| Property Value | Without Mortgage | With Mortgage |
| Less than $50,000 | 5 (3.2%) | 0 (0.0%) |
| $50,000 to $99,999 | 0 (0.0%) | 0 (0.0%) |
| $100,000 to $299,999 | 0 (0.0%) | 8 (1.7%) |
| $300,000 to $499,999 | 41 (26.0%) | 47 (9.9%) |
| $500,000 to $749,999 | 39 (24.7%) | 161 (33.8%) |
| $750,000 to $999,999 | 53 (33.5%) | 106 (22.3%) |
| $1,000,000 or more | 20 (12.7%) | 154 (32.4%) |
| Total | 158 (100.0%) | 476 (100.0%) |
Household Income by Mortgage Status in Mason Neck
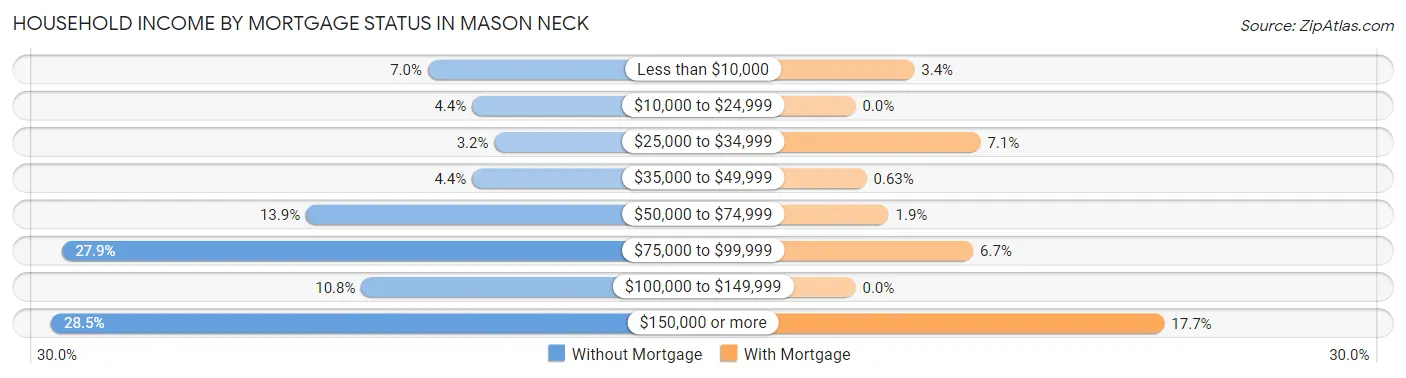
| Household Income | Without Mortgage | With Mortgage |
| Less than $10,000 | 11 (7.0%) | 16 (3.4%) |
| $10,000 to $24,999 | 7 (4.4%) | 0 (0.0%) |
| $25,000 to $34,999 | 5 (3.2%) | 34 (7.1%) |
| $35,000 to $49,999 | 7 (4.4%) | 3 (0.6%) |
| $50,000 to $74,999 | 22 (13.9%) | 9 (1.9%) |
| $75,000 to $99,999 | 44 (27.9%) | 32 (6.7%) |
| $100,000 to $149,999 | 17 (10.8%) | 0 (0.0%) |
| $150,000 or more | 45 (28.5%) | 84 (17.6%) |
| Total | 158 (100.0%) | 476 (100.0%) |
Property Value to Household Income Ratio in Mason Neck
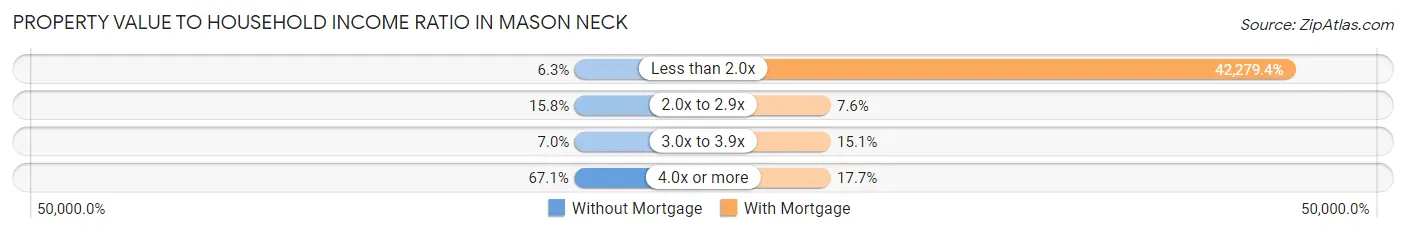
| Value-to-Income Ratio | Without Mortgage | With Mortgage |
| Less than 2.0x | 10 (6.3%) | 201,250 (42,279.4%) |
| 2.0x to 2.9x | 25 (15.8%) | 36 (7.6%) |
| 3.0x to 3.9x | 11 (7.0%) | 72 (15.1%) |
| 4.0x or more | 106 (67.1%) | 84 (17.6%) |
| Total | 158 (100.0%) | 476 (100.0%) |
Real Estate Taxes by Mortgage Status in Mason Neck
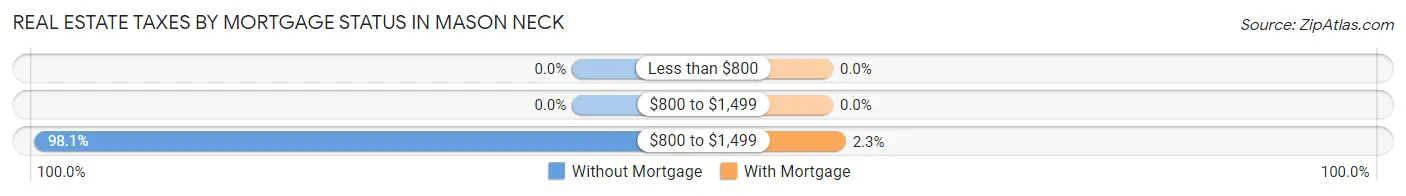
| Property Taxes | Without Mortgage | With Mortgage |
| Less than $800 | 0 (0.0%) | 0 (0.0%) |
| $800 to $1,499 | 0 (0.0%) | 0 (0.0%) |
| $800 to $1,499 | 155 (98.1%) | 11 (2.3%) |
| Total | 158 (100.0%) | 476 (100.0%) |
Health & Disability in Mason Neck
Health Insurance Coverage by Age in Mason Neck
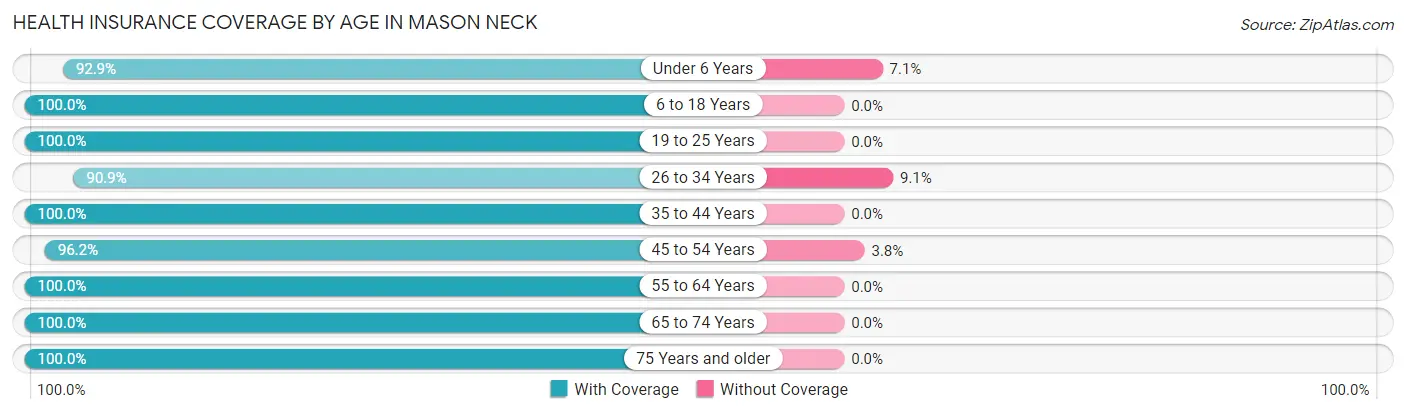
| Age Bracket | With Coverage | Without Coverage |
| Under 6 Years | 39 (92.9%) | 3 (7.1%) |
| 6 to 18 Years | 392 (100.0%) | 0 (0.0%) |
| 19 to 25 Years | 140 (100.0%) | 0 (0.0%) |
| 26 to 34 Years | 70 (90.9%) | 7 (9.1%) |
| 35 to 44 Years | 133 (100.0%) | 0 (0.0%) |
| 45 to 54 Years | 281 (96.2%) | 11 (3.8%) |
| 55 to 64 Years | 467 (100.0%) | 0 (0.0%) |
| 65 to 74 Years | 206 (100.0%) | 0 (0.0%) |
| 75 Years and older | 163 (100.0%) | 0 (0.0%) |
| Total | 1,891 (98.9%) | 21 (1.1%) |
Health Insurance Coverage by Citizenship Status in Mason Neck
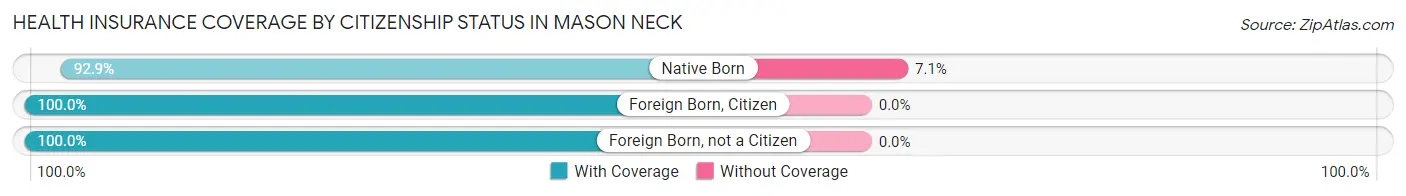
| Citizenship Status | With Coverage | Without Coverage |
| Native Born | 39 (92.9%) | 3 (7.1%) |
| Foreign Born, Citizen | 392 (100.0%) | 0 (0.0%) |
| Foreign Born, not a Citizen | 140 (100.0%) | 0 (0.0%) |
Health Insurance Coverage by Household Income in Mason Neck
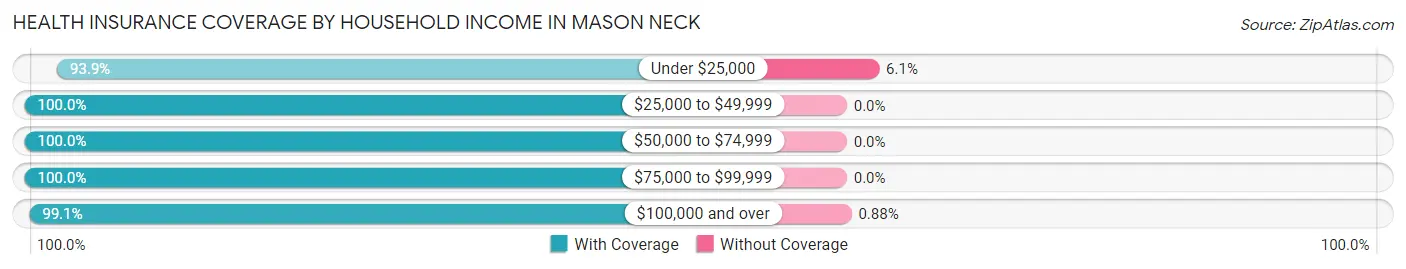
| Household Income | With Coverage | Without Coverage |
| Under $25,000 | 124 (93.9%) | 8 (6.1%) |
| $25,000 to $49,999 | 53 (100.0%) | 0 (0.0%) |
| $50,000 to $74,999 | 118 (100.0%) | 0 (0.0%) |
| $75,000 to $99,999 | 134 (100.0%) | 0 (0.0%) |
| $100,000 and over | 1,462 (99.1%) | 13 (0.9%) |
Public vs Private Health Insurance Coverage by Age in Mason Neck
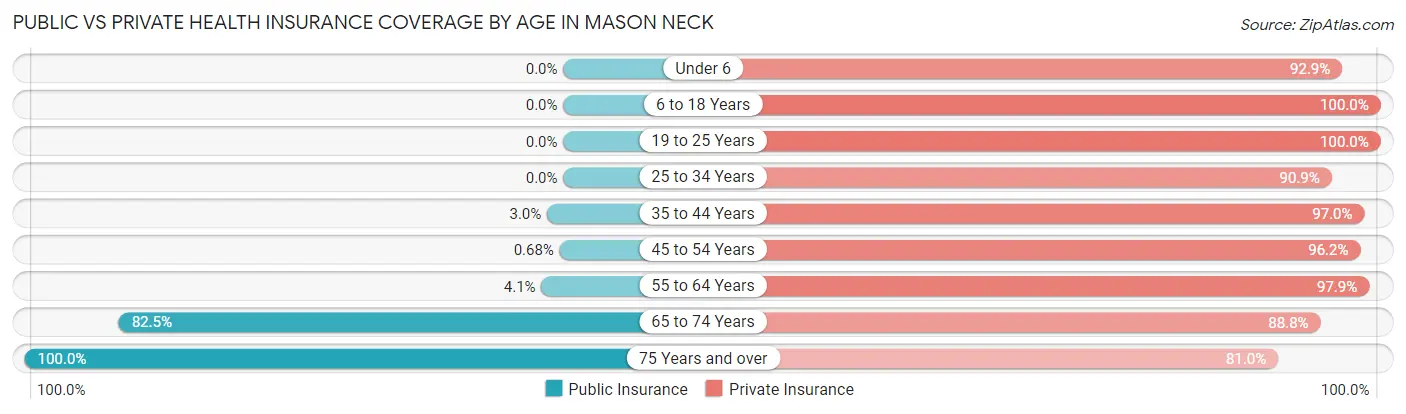
| Age Bracket | Public Insurance | Private Insurance |
| Under 6 | 0 (0.0%) | 39 (92.9%) |
| 6 to 18 Years | 0 (0.0%) | 392 (100.0%) |
| 19 to 25 Years | 0 (0.0%) | 140 (100.0%) |
| 25 to 34 Years | 0 (0.0%) | 70 (90.9%) |
| 35 to 44 Years | 4 (3.0%) | 129 (97.0%) |
| 45 to 54 Years | 2 (0.7%) | 281 (96.2%) |
| 55 to 64 Years | 19 (4.1%) | 457 (97.9%) |
| 65 to 74 Years | 170 (82.5%) | 183 (88.8%) |
| 75 Years and over | 163 (100.0%) | 132 (81.0%) |
| Total | 358 (18.7%) | 1,823 (95.4%) |
Disability Status by Sex by Age in Mason Neck
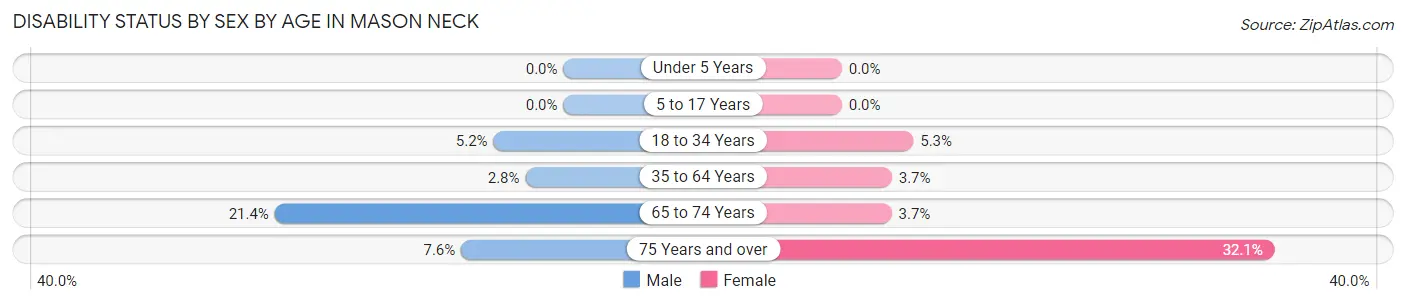
| Age Bracket | Male | Female |
| Under 5 Years | 0 (0.0%) | 0 (0.0%) |
| 5 to 17 Years | 0 (0.0%) | 0 (0.0%) |
| 18 to 34 Years | 8 (5.2%) | 6 (5.3%) |
| 35 to 64 Years | 13 (2.8%) | 16 (3.7%) |
| 65 to 74 Years | 21 (21.4%) | 4 (3.7%) |
| 75 Years and over | 6 (7.6%) | 27 (32.1%) |
Disability Class by Sex by Age in Mason Neck
Disability Class: Hearing Difficulty
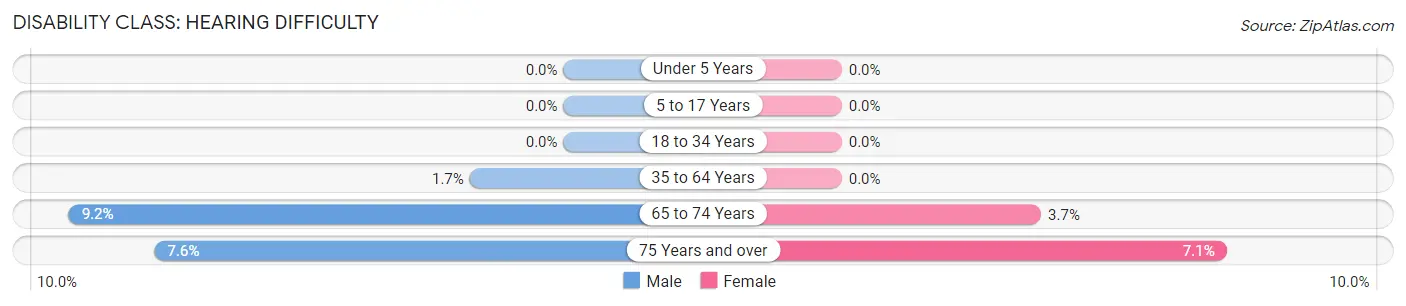
| Age Bracket | Male | Female |
| Under 5 Years | 0 (0.0%) | 0 (0.0%) |
| 5 to 17 Years | 0 (0.0%) | 0 (0.0%) |
| 18 to 34 Years | 0 (0.0%) | 0 (0.0%) |
| 35 to 64 Years | 8 (1.7%) | 0 (0.0%) |
| 65 to 74 Years | 9 (9.2%) | 4 (3.7%) |
| 75 Years and over | 6 (7.6%) | 6 (7.1%) |
Disability Class: Vision Difficulty
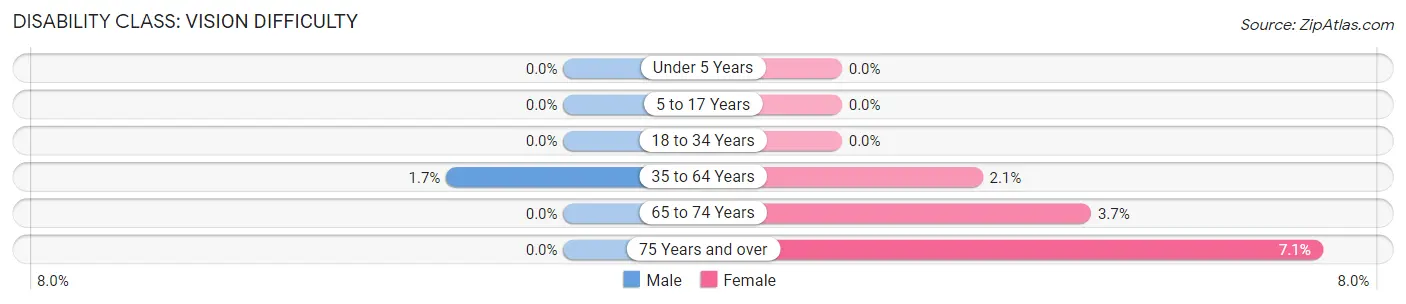
| Age Bracket | Male | Female |
| Under 5 Years | 0 (0.0%) | 0 (0.0%) |
| 5 to 17 Years | 0 (0.0%) | 0 (0.0%) |
| 18 to 34 Years | 0 (0.0%) | 0 (0.0%) |
| 35 to 64 Years | 8 (1.7%) | 9 (2.1%) |
| 65 to 74 Years | 0 (0.0%) | 4 (3.7%) |
| 75 Years and over | 0 (0.0%) | 6 (7.1%) |
Disability Class: Cognitive Difficulty
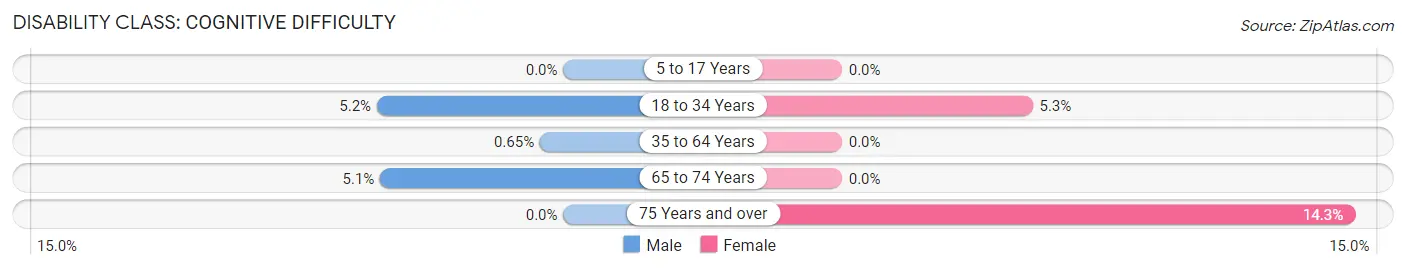
| Age Bracket | Male | Female |
| 5 to 17 Years | 0 (0.0%) | 0 (0.0%) |
| 18 to 34 Years | 8 (5.2%) | 6 (5.3%) |
| 35 to 64 Years | 3 (0.6%) | 0 (0.0%) |
| 65 to 74 Years | 5 (5.1%) | 0 (0.0%) |
| 75 Years and over | 0 (0.0%) | 12 (14.3%) |
Disability Class: Ambulatory Difficulty
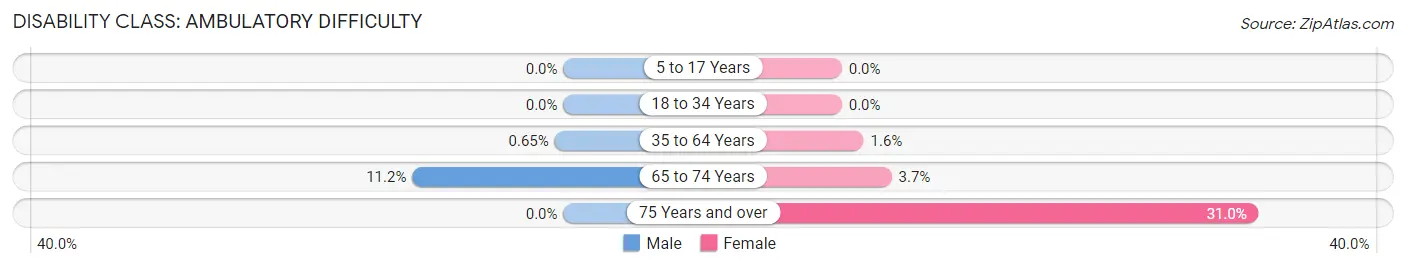
| Age Bracket | Male | Female |
| 5 to 17 Years | 0 (0.0%) | 0 (0.0%) |
| 18 to 34 Years | 0 (0.0%) | 0 (0.0%) |
| 35 to 64 Years | 3 (0.6%) | 7 (1.6%) |
| 65 to 74 Years | 11 (11.2%) | 4 (3.7%) |
| 75 Years and over | 0 (0.0%) | 26 (30.9%) |
Disability Class: Self-Care Difficulty
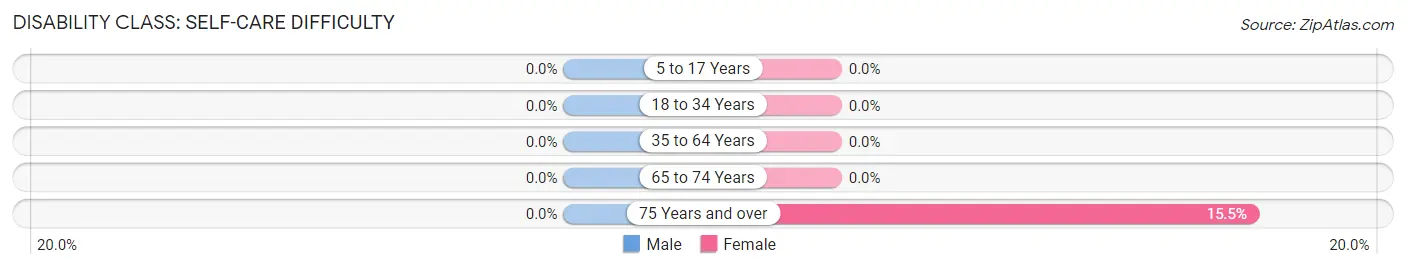
| Age Bracket | Male | Female |
| 5 to 17 Years | 0 (0.0%) | 0 (0.0%) |
| 18 to 34 Years | 0 (0.0%) | 0 (0.0%) |
| 35 to 64 Years | 0 (0.0%) | 0 (0.0%) |
| 65 to 74 Years | 0 (0.0%) | 0 (0.0%) |
| 75 Years and over | 0 (0.0%) | 13 (15.5%) |
Technology Access in Mason Neck
Computing Device Access in Mason Neck
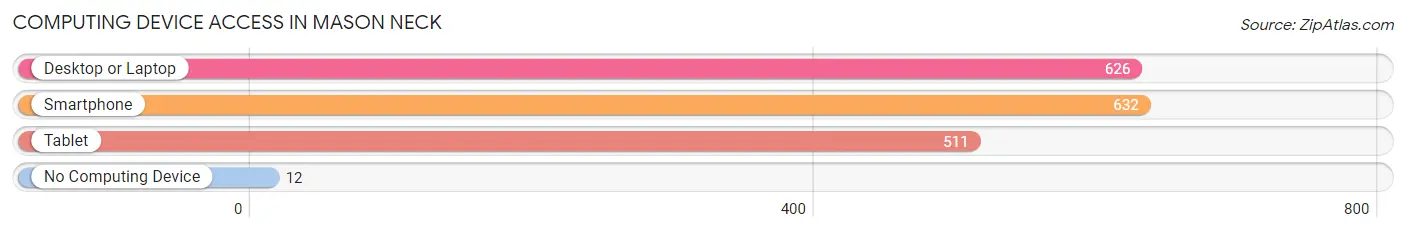
| Device Type | # Households | % Households |
| Desktop or Laptop | 626 | 91.4% |
| Smartphone | 632 | 92.3% |
| Tablet | 511 | 74.6% |
| No Computing Device | 12 | 1.8% |
| Total | 685 | 100.0% |
Internet Access in Mason Neck
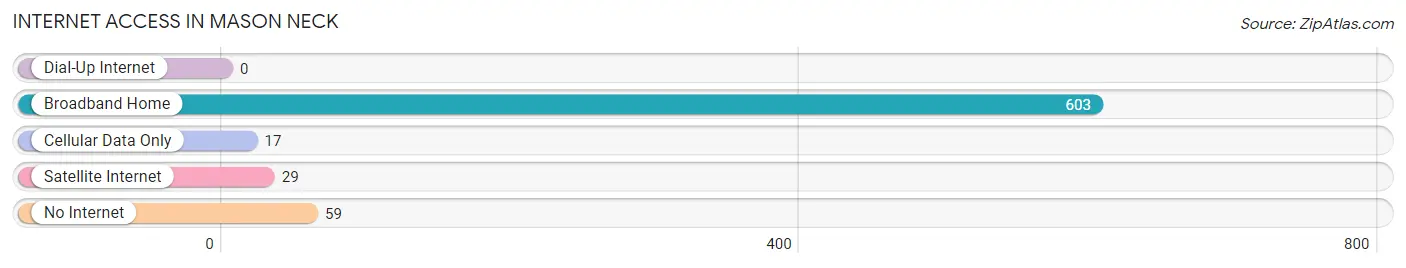
| Internet Type | # Households | % Households |
| Dial-Up Internet | 0 | 0.0% |
| Broadband Home | 603 | 88.0% |
| Cellular Data Only | 17 | 2.5% |
| Satellite Internet | 29 | 4.2% |
| No Internet | 59 | 8.6% |
| Total | 685 | 100.0% |
Mason Neck Summary
Mason Neck is a census-designated place (CDP) located in Fairfax County, Virginia. It is situated on the Potomac River, approximately 25 miles south of Washington, D.C. The area is known for its natural beauty, with a variety of wildlife, including bald eagles, ospreys, and great blue herons. Mason Neck is home to several parks, including Mason Neck State Park, which offers hiking, biking, and kayaking opportunities.
History
Mason Neck was first settled in the early 1700s by the Mason family, who were among the first settlers in the area. The Masons were Quakers who had come to the area from England. The Masons established a plantation on the neck of land that is now Mason Neck. The plantation was known as Mason’s Neck Plantation and was home to the Mason family for many years.
In the late 1700s, the Mason family sold the plantation to the Fairfax family. The Fairfax family owned the plantation until the early 1900s, when it was sold to the United States government. The government used the land for military purposes, including a naval air station and a military base.
In the 1950s, the government began to sell off the land to developers. The developers built homes and businesses in the area, and Mason Neck began to grow. Today, Mason Neck is a thriving community with a population of over 5,000 people.
Geography
Mason Neck is located in Fairfax County, Virginia. It is situated on the Potomac River, approximately 25 miles south of Washington, D.C. The area is known for its natural beauty, with a variety of wildlife, including bald eagles, ospreys, and great blue herons. Mason Neck is home to several parks, including Mason Neck State Park, which offers hiking, biking, and kayaking opportunities.
The area is also home to several historic sites, including the Mason Neck National Wildlife Refuge, which was established in 1969 to protect the area’s wildlife and natural resources. The refuge is home to a variety of wildlife, including bald eagles, ospreys, and great blue herons.
Economy
Mason Neck’s economy is largely based on tourism and recreation. The area is home to several parks, including Mason Neck State Park, which offers hiking, biking, and kayaking opportunities. The area is also home to several historic sites, including the Mason Neck National Wildlife Refuge, which was established in 1969 to protect the area’s wildlife and natural resources.
The area is also home to several businesses, including restaurants, retail stores, and marinas. The area is also home to several government agencies, including the National Park Service, the U.S. Fish and Wildlife Service, and the U.S. Coast Guard.
Demographics
As of the 2010 census, Mason Neck had a population of 5,093 people. The racial makeup of the area was 79.3% White, 11.2% African American, 0.3% Native American, 4.2% Asian, 0.1% Pacific Islander, and 4.9% from other races. The median household income was $107,917, and the median family income was $118,917.
Mason Neck is a diverse community, with a variety of religious backgrounds. The area is home to several churches, including the Mason Neck Baptist Church, the Mason Neck United Methodist Church, and the Mason Neck Presbyterian Church.
Conclusion
Mason Neck is a census-designated place located in Fairfax County, Virginia. It is situated on the Potomac River, approximately 25 miles south of Washington, D.C. The area is known for its natural beauty, with a variety of wildlife, including bald eagles, ospreys, and great blue herons. Mason Neck is home to several parks, including Mason Neck State Park, which offers hiking, biking, and kayaking opportunities. The area is also home to several historic sites, including the Mason Neck National Wildlife Refuge, which was established in 1969 to protect the area’s wildlife and natural resources. The area’s economy is largely based on tourism and recreation, and the area is home to several businesses, including restaurants, retail stores, and marinas. As of the 2010 census, Mason Neck had a population of 5,093 people. The area is a diverse community, with a variety of religious backgrounds.
Common Questions
What is Per Capita Income in Mason Neck?
Per Capita income in Mason Neck is $82,007.
What is the Median Family Income in Mason Neck?
Median Family Income in Mason Neck is $180,625.
What is the Median Household income in Mason Neck?
Median Household Income in Mason Neck is $164,625.
What is Income or Wage Gap in Mason Neck?
Income or Wage Gap in Mason Neck is 21.3%.
Women in Mason Neck earn 78.7 cents for every dollar earned by a man.
What is Inequality or Gini Index in Mason Neck?
Inequality or Gini Index in Mason Neck is 0.47.
What is the Total Population of Mason Neck?
Total Population of Mason Neck is 1,932.
What is the Total Male Population of Mason Neck?
Total Male Population of Mason Neck is 1,028.
What is the Total Female Population of Mason Neck?
Total Female Population of Mason Neck is 904.
What is the Ratio of Males per 100 Females in Mason Neck?
There are 113.72 Males per 100 Females in Mason Neck.
What is the Ratio of Females per 100 Males in Mason Neck?
There are 87.94 Females per 100 Males in Mason Neck.
What is the Median Population Age in Mason Neck?
Median Population Age in Mason Neck is 50.9 Years.
What is the Average Family Size in Mason Neck
Average Family Size in Mason Neck is 3.2 People.
What is the Average Household Size in Mason Neck
Average Household Size in Mason Neck is 2.8 People.
How Large is the Labor Force in Mason Neck?
There are 1,049 People in the Labor Forcein in Mason Neck.
What is the Percentage of People in the Labor Force in Mason Neck?
64.7% of People are in the Labor Force in Mason Neck.
What is the Unemployment Rate in Mason Neck?
Unemployment Rate in Mason Neck is 4.9%.