Fairlawn, VA Map & Demographics
Fairlawn Map
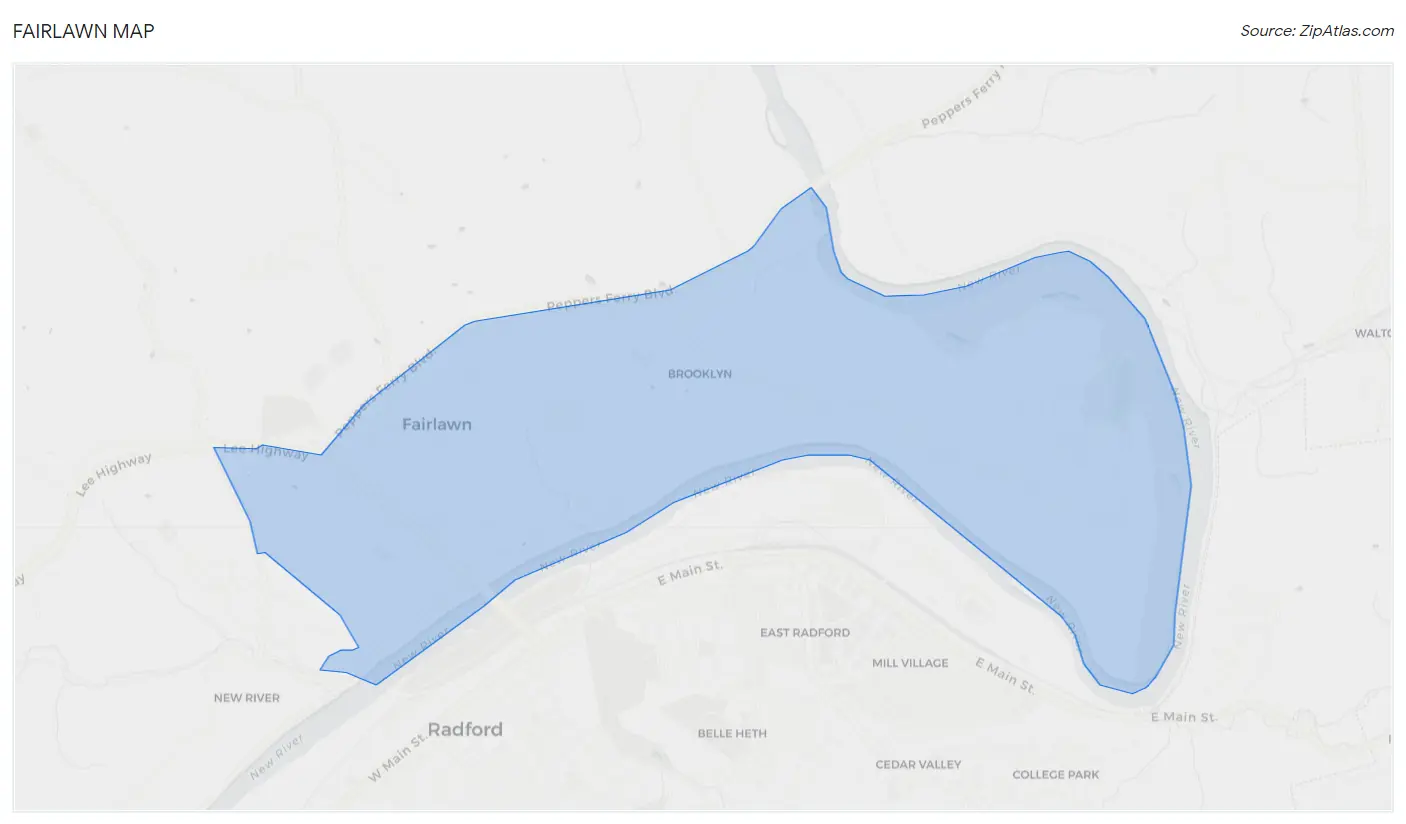
Fairlawn Overview
$40,038
PER CAPITA INCOME
$79,545
AVG FAMILY INCOME
$65,426
AVG HOUSEHOLD INCOME
28.0%
WAGE / INCOME GAP [ % ]
72.0¢/ $1
WAGE / INCOME GAP [ $ ]
0.49
INEQUALITY / GINI INDEX
2,400
TOTAL POPULATION
1,179
MALE POPULATION
1,221
FEMALE POPULATION
96.56
MALES / 100 FEMALES
103.56
FEMALES / 100 MALES
49.8
MEDIAN AGE
2.7
AVG FAMILY SIZE
2.0
AVG HOUSEHOLD SIZE
1,075
LABOR FORCE [ PEOPLE ]
54.5%
PERCENT IN LABOR FORCE
3.2%
UNEMPLOYMENT RATE
Fairlawn Area Codes
Income in Fairlawn
Income Overview in Fairlawn
Per Capita Income in Fairlawn is $40,038, while median incomes of families and households are $79,545 and $65,426 respectively.
| Characteristic | Number | Measure |
| Per Capita Income | 2,400 | $40,038 |
| Median Family Income | 686 | $79,545 |
| Mean Family Income | 686 | $122,047 |
| Median Household Income | 1,189 | $65,426 |
| Mean Household Income | 1,189 | $83,938 |
| Income Deficit | 686 | $0 |
| Wage / Income Gap (%) | 2,400 | 27.97% |
| Wage / Income Gap ($) | 2,400 | 72.03¢ per $1 |
| Gini / Inequality Index | 2,400 | 0.49 |
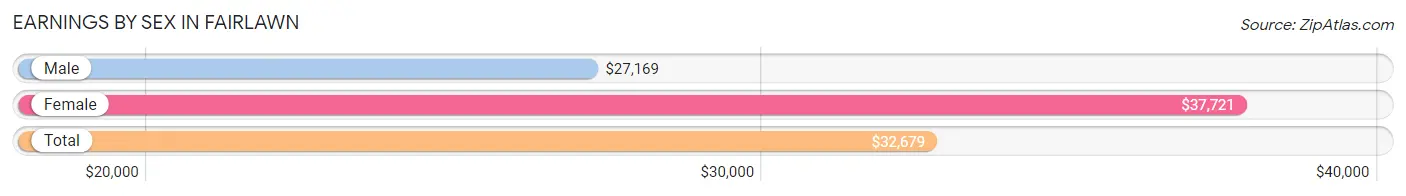
Earnings by Sex in Fairlawn
Average Earnings in Fairlawn are $32,679, $27,169 for men and $37,721 for women, a difference of 28.0%.
| Sex | Number | Average Earnings |
| Male | 661 (60.3%) | $27,169 |
| Female | 435 (39.7%) | $37,721 |
| Total | 1,096 (100.0%) | $32,679 |
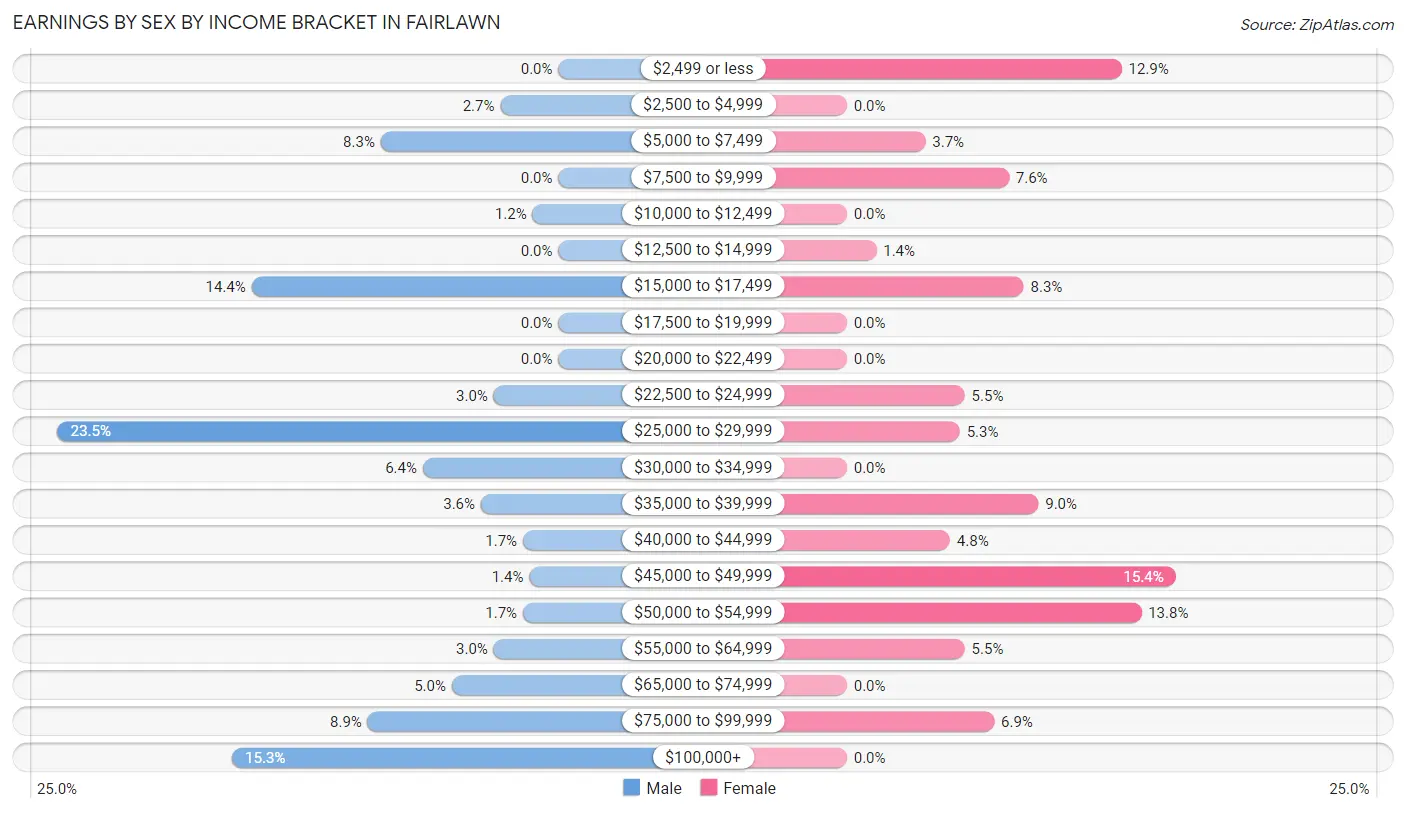
Earnings by Sex by Income Bracket in Fairlawn
The most common earnings brackets in Fairlawn are $25,000 to $29,999 for men (155 | 23.4%) and $45,000 to $49,999 for women (67 | 15.4%).
| Income | Male | Female |
| $2,499 or less | 0 (0.0%) | 56 (12.9%) |
| $2,500 to $4,999 | 18 (2.7%) | 0 (0.0%) |
| $5,000 to $7,499 | 55 (8.3%) | 16 (3.7%) |
| $7,500 to $9,999 | 0 (0.0%) | 33 (7.6%) |
| $10,000 to $12,499 | 8 (1.2%) | 0 (0.0%) |
| $12,500 to $14,999 | 0 (0.0%) | 6 (1.4%) |
| $15,000 to $17,499 | 95 (14.4%) | 36 (8.3%) |
| $17,500 to $19,999 | 0 (0.0%) | 0 (0.0%) |
| $20,000 to $22,499 | 0 (0.0%) | 0 (0.0%) |
| $22,500 to $24,999 | 20 (3.0%) | 24 (5.5%) |
| $25,000 to $29,999 | 155 (23.4%) | 23 (5.3%) |
| $30,000 to $34,999 | 42 (6.4%) | 0 (0.0%) |
| $35,000 to $39,999 | 24 (3.6%) | 39 (9.0%) |
| $40,000 to $44,999 | 11 (1.7%) | 21 (4.8%) |
| $45,000 to $49,999 | 9 (1.4%) | 67 (15.4%) |
| $50,000 to $54,999 | 11 (1.7%) | 60 (13.8%) |
| $55,000 to $64,999 | 20 (3.0%) | 24 (5.5%) |
| $65,000 to $74,999 | 33 (5.0%) | 0 (0.0%) |
| $75,000 to $99,999 | 59 (8.9%) | 30 (6.9%) |
| $100,000+ | 101 (15.3%) | 0 (0.0%) |
| Total | 661 (100.0%) | 435 (100.0%) |
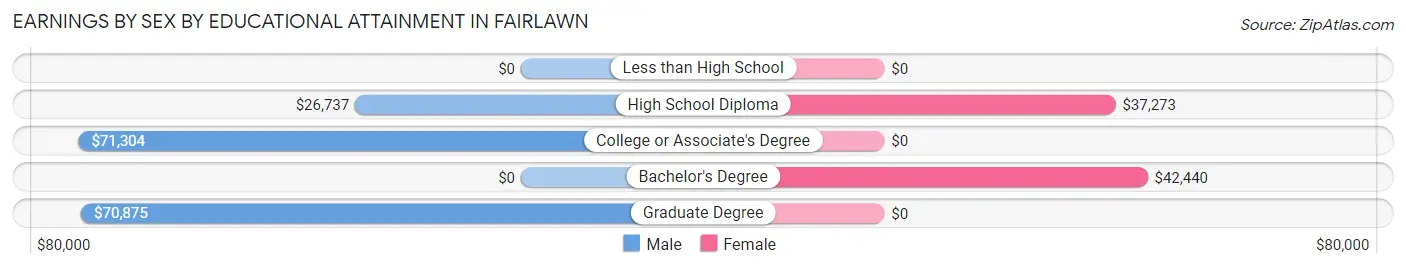
Earnings by Sex by Educational Attainment in Fairlawn
Average earnings in Fairlawn are $27,403 for men and $38,456 for women, a difference of 28.7%. Men with an educational attainment of college or associate's degree enjoy the highest average annual earnings of $71,304, while those with high school diploma education earn the least with $26,737. Women with an educational attainment of bachelor's degree earn the most with the average annual earnings of $42,440, while those with high school diploma education have the smallest earnings of $37,273.
| Educational Attainment | Male Income | Female Income |
| Less than High School | - | - |
| High School Diploma | $26,737 | $37,273 |
| College or Associate's Degree | $71,304 | $0 |
| Bachelor's Degree | - | - |
| Graduate Degree | $70,875 | $0 |
| Total | $27,403 | $38,456 |
Family Income in Fairlawn
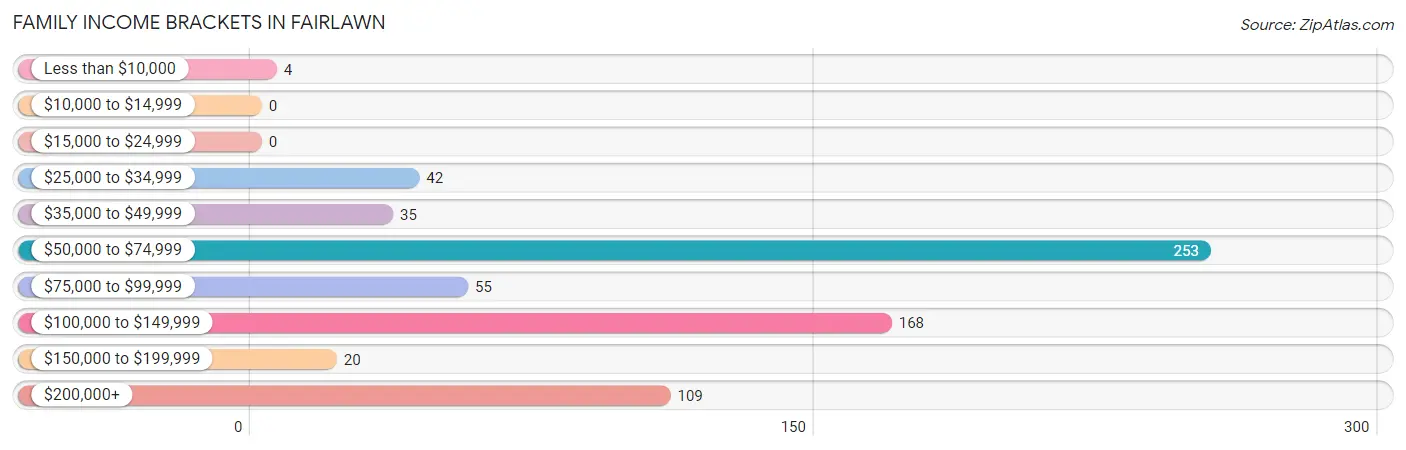
Family Income Brackets in Fairlawn
According to the Fairlawn family income data, there are 253 families falling into the $50,000 to $74,999 income range, which is the most common income bracket and makes up 36.9% of all families.
| Income Bracket | # Families | % Families |
| Less than $10,000 | 4 | 0.6% |
| $10,000 to $14,999 | 0 | 0.0% |
| $15,000 to $24,999 | 0 | 0.0% |
| $25,000 to $34,999 | 42 | 6.1% |
| $35,000 to $49,999 | 35 | 5.1% |
| $50,000 to $74,999 | 253 | 36.9% |
| $75,000 to $99,999 | 55 | 8.0% |
| $100,000 to $149,999 | 168 | 24.5% |
| $150,000 to $199,999 | 20 | 2.9% |
| $200,000+ | 109 | 15.9% |
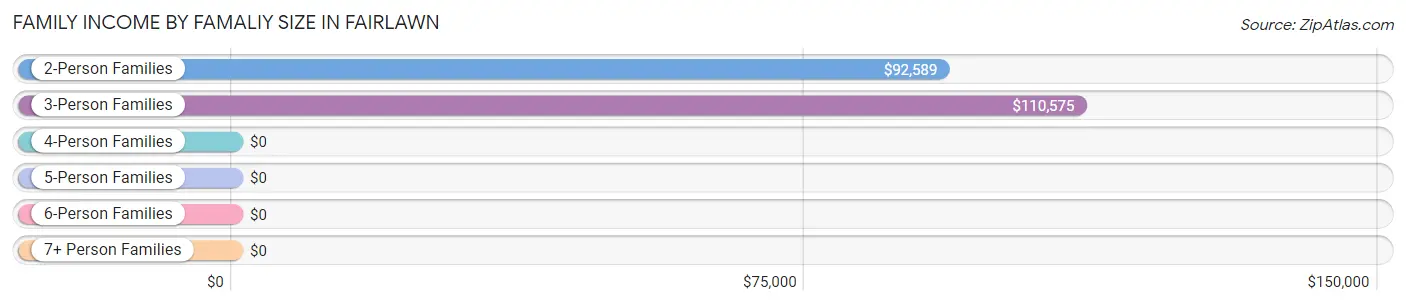
Family Income by Famaliy Size in Fairlawn
3-person families (99 | 14.4%) account for the highest median family income in Fairlawn with $110,575 per family, while 2-person families (397 | 57.9%) have the highest median income of $46,294 per family member.
| Income Bracket | # Families | Median Income |
| 2-Person Families | 397 (57.9%) | $92,589 |
| 3-Person Families | 99 (14.4%) | $110,575 |
| 4-Person Families | 84 (12.2%) | $0 |
| 5-Person Families | 106 (15.4%) | $0 |
| 6-Person Families | 0 (0.0%) | $0 |
| 7+ Person Families | 0 (0.0%) | $0 |
| Total | 686 (100.0%) | $79,545 |
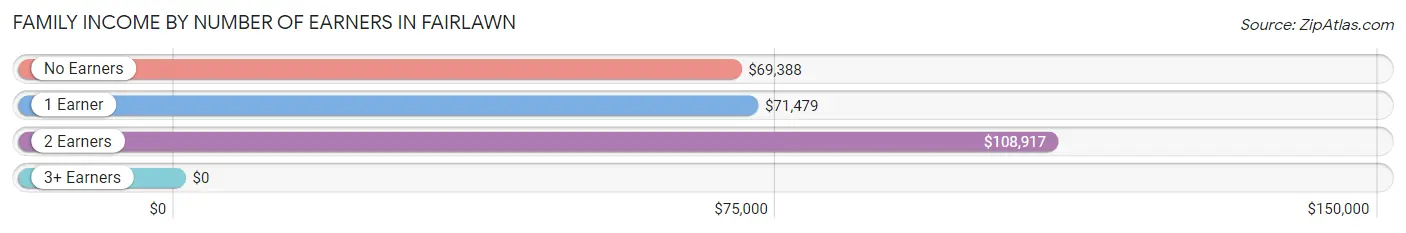
Family Income by Number of Earners in Fairlawn
| Number of Earners | # Families | Median Income |
| No Earners | 192 (28.0%) | $69,388 |
| 1 Earner | 213 (31.0%) | $71,479 |
| 2 Earners | 257 (37.5%) | $108,917 |
| 3+ Earners | 24 (3.5%) | $0 |
| Total | 686 (100.0%) | $79,545 |
Household Income in Fairlawn
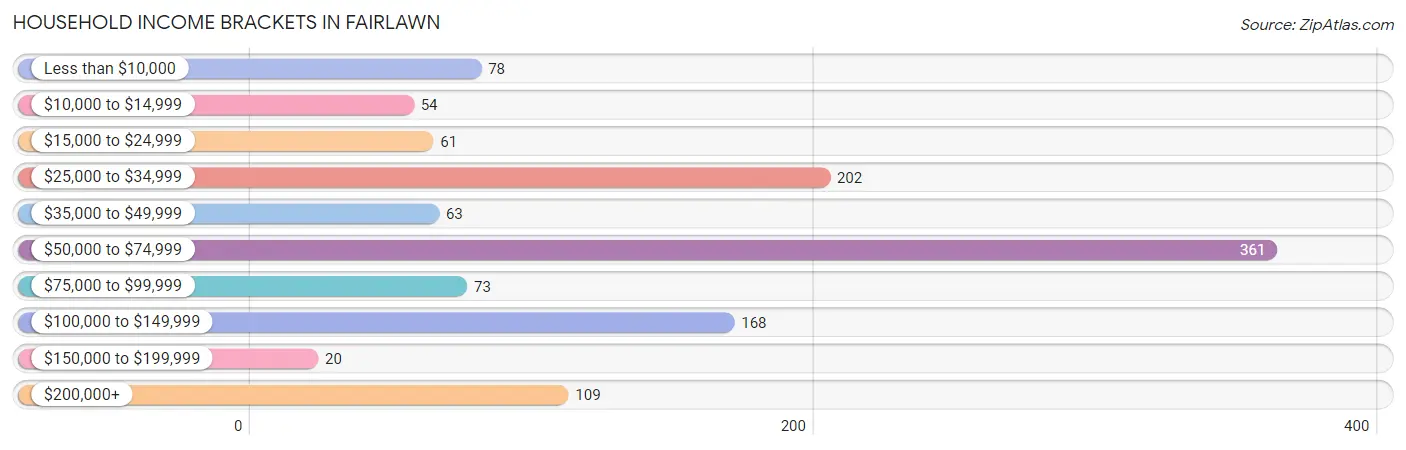
Household Income Brackets in Fairlawn
With 361 households falling in the category, the $50,000 to $74,999 income range is the most frequent in Fairlawn, accounting for 30.4% of all households. In contrast, only 20 households (1.7%) fall into the $150,000 to $199,999 income bracket, making it the least populous group.
| Income Bracket | # Households | % Households |
| Less than $10,000 | 78 | 6.6% |
| $10,000 to $14,999 | 54 | 4.5% |
| $15,000 to $24,999 | 61 | 5.1% |
| $25,000 to $34,999 | 202 | 17.0% |
| $35,000 to $49,999 | 63 | 5.3% |
| $50,000 to $74,999 | 361 | 30.4% |
| $75,000 to $99,999 | 73 | 6.1% |
| $100,000 to $149,999 | 168 | 14.1% |
| $150,000 to $199,999 | 20 | 1.7% |
| $200,000+ | 109 | 9.2% |
Household Income by Householder Age in Fairlawn
The median household income in Fairlawn is $65,426, with the highest median household income of $71,341 found in the 25 to 44 years age bracket for the primary householder. A total of 256 households (21.5%) fall into this category. Meanwhile, the 45 to 64 years age bracket for the primary householder has the lowest median household income of $0, with 485 households (40.8%) in this group.
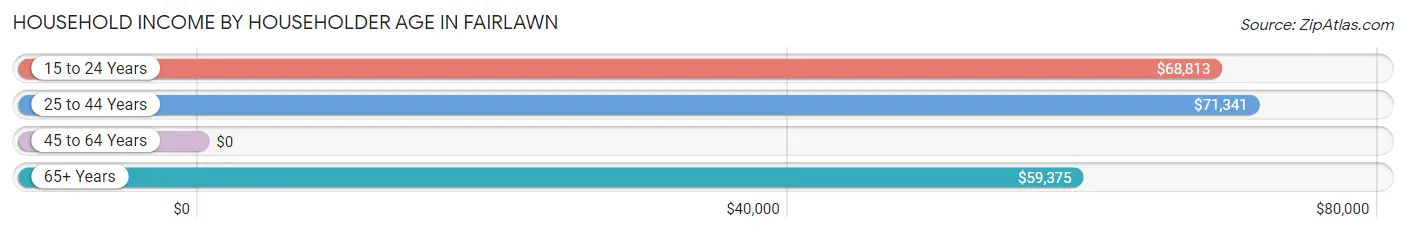
| Income Bracket | # Households | Median Income |
| 15 to 24 Years | 29 (2.4%) | $68,813 |
| 25 to 44 Years | 256 (21.5%) | $71,341 |
| 45 to 64 Years | 485 (40.8%) | $0 |
| 65+ Years | 419 (35.2%) | $59,375 |
| Total | 1,189 (100.0%) | $65,426 |
Poverty in Fairlawn
Income Below Poverty by Sex and Age in Fairlawn
With 4.1% poverty level for males and 8.1% for females among the residents of Fairlawn, under 5 year old males and 75 year old and over females are the most vulnerable to poverty, with 7 males (100.0%) and 48 females (18.9%) in their respective age groups living below the poverty level.
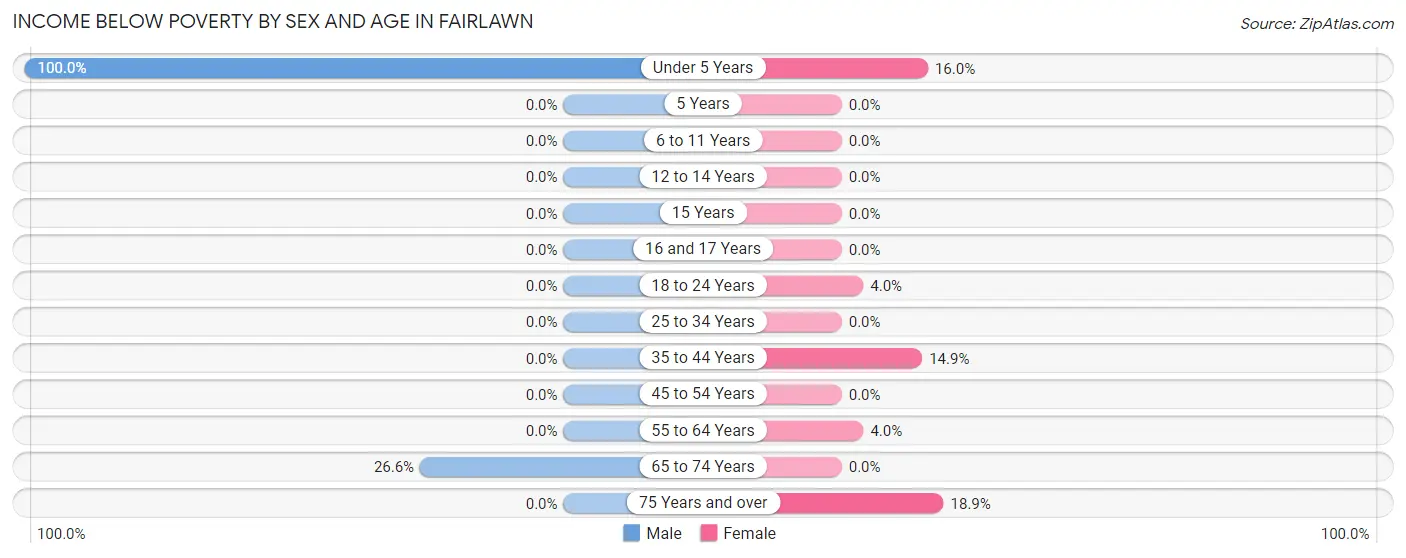
| Age Bracket | Male | Female |
| Under 5 Years | 7 (100.0%) | 8 (16.0%) |
| 5 Years | 0 (0.0%) | 0 (0.0%) |
| 6 to 11 Years | 0 (0.0%) | 0 (0.0%) |
| 12 to 14 Years | 0 (0.0%) | 0 (0.0%) |
| 15 Years | 0 (0.0%) | 0 (0.0%) |
| 16 and 17 Years | 0 (0.0%) | 0 (0.0%) |
| 18 to 24 Years | 0 (0.0%) | 4 (4.0%) |
| 25 to 34 Years | 0 (0.0%) | 0 (0.0%) |
| 35 to 44 Years | 0 (0.0%) | 33 (14.9%) |
| 45 to 54 Years | 0 (0.0%) | 0 (0.0%) |
| 55 to 64 Years | 0 (0.0%) | 6 (4.0%) |
| 65 to 74 Years | 41 (26.6%) | 0 (0.0%) |
| 75 Years and over | 0 (0.0%) | 48 (18.9%) |
| Total | 48 (4.1%) | 99 (8.1%) |
Income Above Poverty by Sex and Age in Fairlawn
According to the poverty statistics in Fairlawn, males aged 5 years and females aged 6 to 11 years are the age groups that are most secure financially, with 100.0% of males and 100.0% of females in these age groups living above the poverty line.
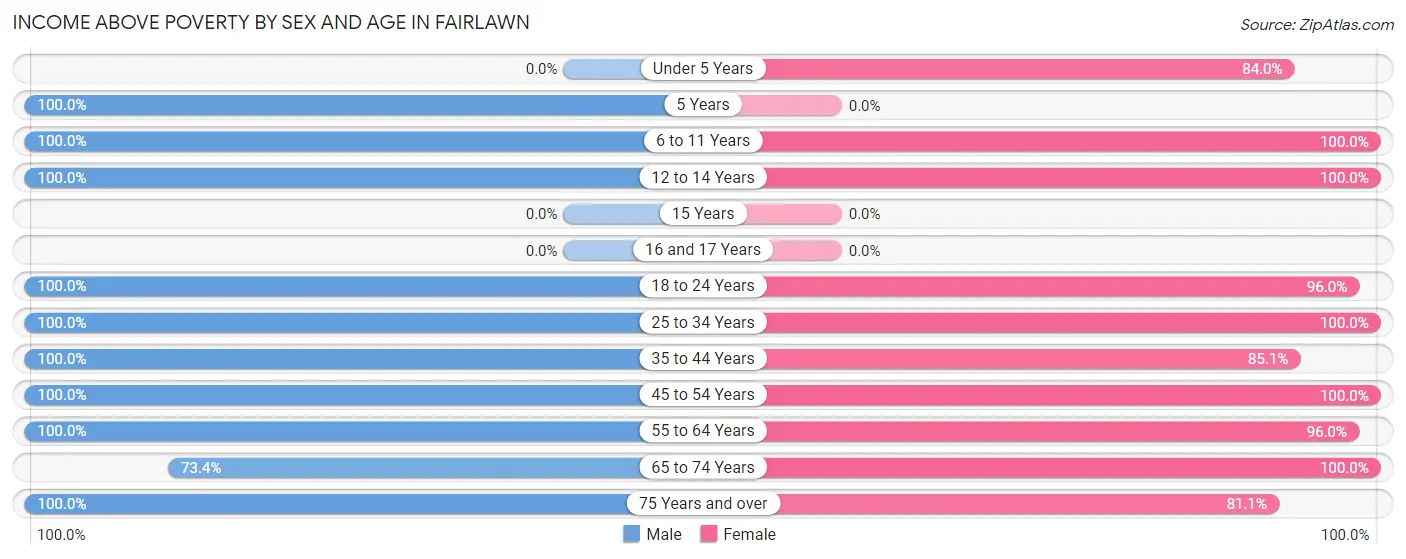
| Age Bracket | Male | Female |
| Under 5 Years | 0 (0.0%) | 42 (84.0%) |
| 5 Years | 15 (100.0%) | 0 (0.0%) |
| 6 to 11 Years | 50 (100.0%) | 118 (100.0%) |
| 12 to 14 Years | 157 (100.0%) | 31 (100.0%) |
| 15 Years | 0 (0.0%) | 0 (0.0%) |
| 16 and 17 Years | 0 (0.0%) | 0 (0.0%) |
| 18 to 24 Years | 63 (100.0%) | 96 (96.0%) |
| 25 to 34 Years | 87 (100.0%) | 63 (100.0%) |
| 35 to 44 Years | 110 (100.0%) | 188 (85.1%) |
| 45 to 54 Years | 215 (100.0%) | 122 (100.0%) |
| 55 to 64 Years | 195 (100.0%) | 143 (96.0%) |
| 65 to 74 Years | 113 (73.4%) | 113 (100.0%) |
| 75 Years and over | 126 (100.0%) | 206 (81.1%) |
| Total | 1,131 (95.9%) | 1,122 (91.9%) |
Income Below Poverty Among Married-Couple Families in Fairlawn
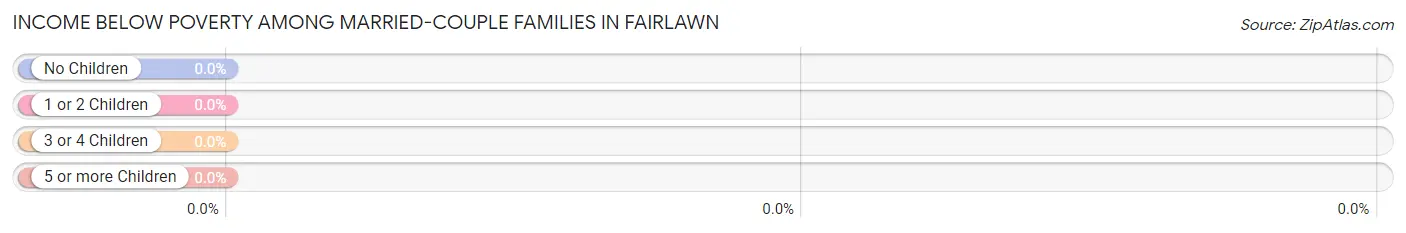
| Children | Above Poverty | Below Poverty |
| No Children | 436 (100.0%) | 0 (0.0%) |
| 1 or 2 Children | 120 (100.0%) | 0 (0.0%) |
| 3 or 4 Children | 82 (100.0%) | 0 (0.0%) |
| 5 or more Children | 0 (0.0%) | 0 (0.0%) |
| Total | 638 (100.0%) | 0 (0.0%) |
Income Below Poverty Among Single-Parent Households in Fairlawn
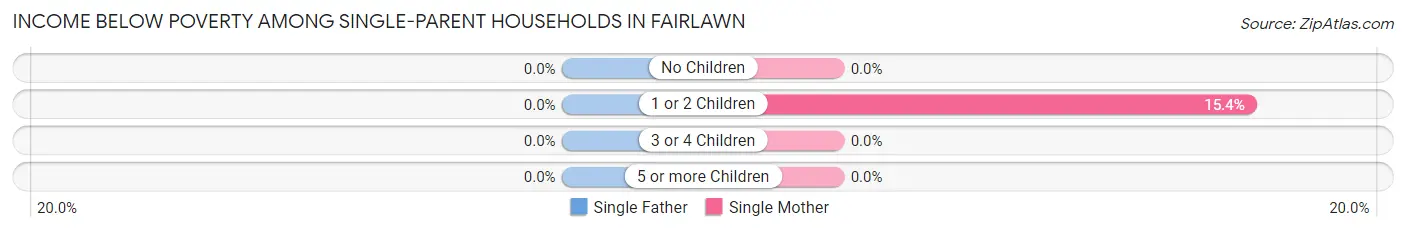
| Children | Single Father | Single Mother |
| No Children | 0 (0.0%) | 0 (0.0%) |
| 1 or 2 Children | 0 (0.0%) | 4 (15.4%) |
| 3 or 4 Children | 0 (0.0%) | 0 (0.0%) |
| 5 or more Children | 0 (0.0%) | 0 (0.0%) |
| Total | 0 (0.0%) | 4 (15.4%) |
Income Below Poverty Among Married-Couple vs Single-Parent Households in Fairlawn
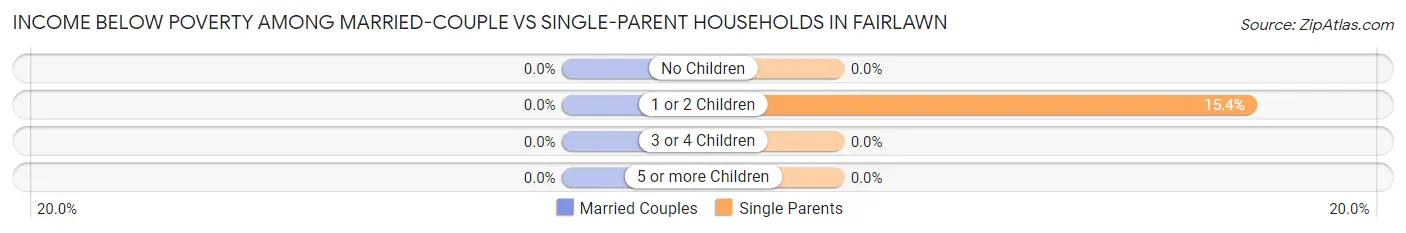
| Children | Married-Couple Families | Single-Parent Households |
| No Children | 0 (0.0%) | 0 (0.0%) |
| 1 or 2 Children | 0 (0.0%) | 4 (15.4%) |
| 3 or 4 Children | 0 (0.0%) | 0 (0.0%) |
| 5 or more Children | 0 (0.0%) | 0 (0.0%) |
| Total | 0 (0.0%) | 4 (8.3%) |
Race in Fairlawn
The most populous races in Fairlawn are White / Caucasian (2,206 | 91.9%), Hispanic or Latino (154 | 6.4%), and Black / African American (106 | 4.4%).
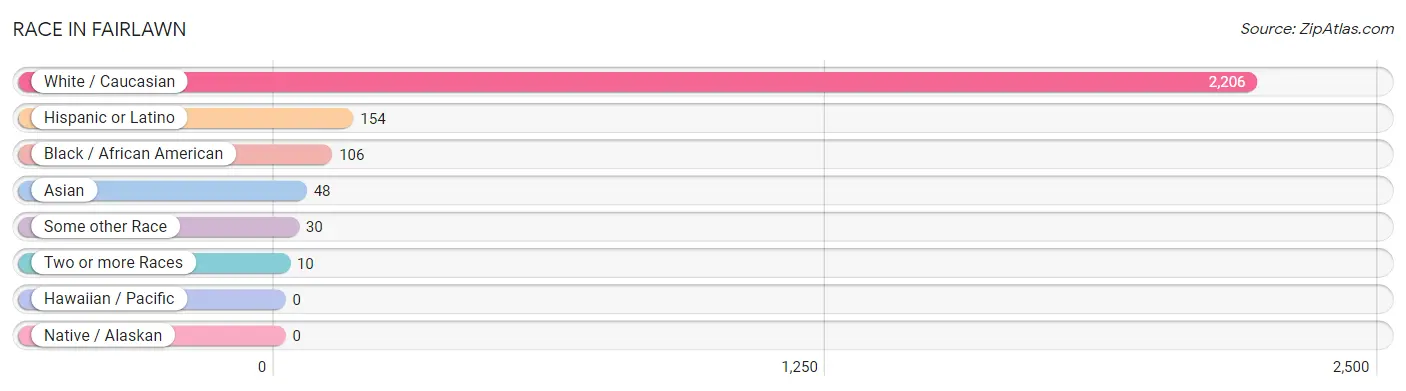
| Race | # Population | % Population |
| Asian | 48 | 2.0% |
| Black / African American | 106 | 4.4% |
| Hawaiian / Pacific | 0 | 0.0% |
| Hispanic or Latino | 154 | 6.4% |
| Native / Alaskan | 0 | 0.0% |
| White / Caucasian | 2,206 | 91.9% |
| Two or more Races | 10 | 0.4% |
| Some other Race | 30 | 1.3% |
| Total | 2,400 | 100.0% |
Ancestry in Fairlawn
The most populous ancestries reported in Fairlawn are English (976 | 40.7%), German (296 | 12.3%), American (244 | 10.2%), Scottish (178 | 7.4%), and Mexican (134 | 5.6%), together accounting for 76.2% of all Fairlawn residents.
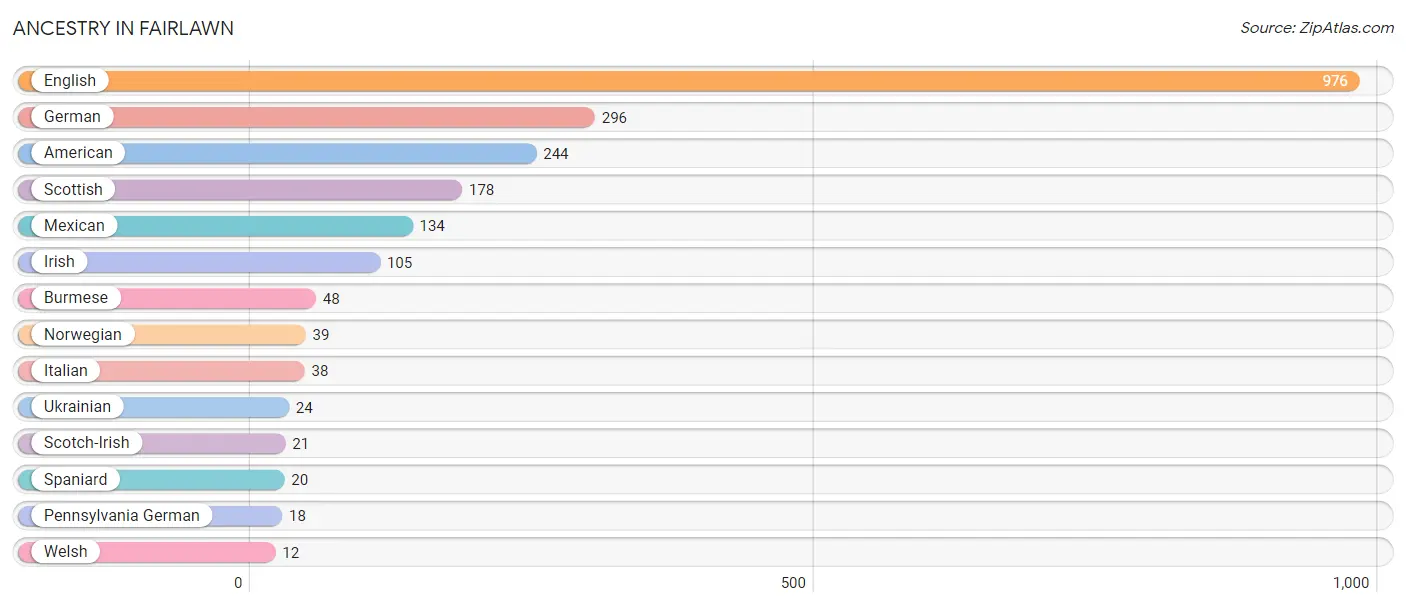
| Ancestry | # Population | % Population |
| American | 244 | 10.2% |
| Burmese | 48 | 2.0% |
| English | 976 | 40.7% |
| German | 296 | 12.3% |
| Irish | 105 | 4.4% |
| Italian | 38 | 1.6% |
| Mexican | 134 | 5.6% |
| Norwegian | 39 | 1.6% |
| Pennsylvania German | 18 | 0.7% |
| Scotch-Irish | 21 | 0.9% |
| Scottish | 178 | 7.4% |
| Spaniard | 20 | 0.8% |
| Ukrainian | 24 | 1.0% |
| Welsh | 12 | 0.5% | View All 14 Rows |
Immigrants in Fairlawn
The most numerous immigrant groups reported in Fairlawn came from Asia (34 | 1.4%), Eastern Asia (34 | 1.4%), Korea (34 | 1.4%), Central America (26 | 1.1%), and Latin America (26 | 1.1%), together accounting for 6.4% of all Fairlawn residents.
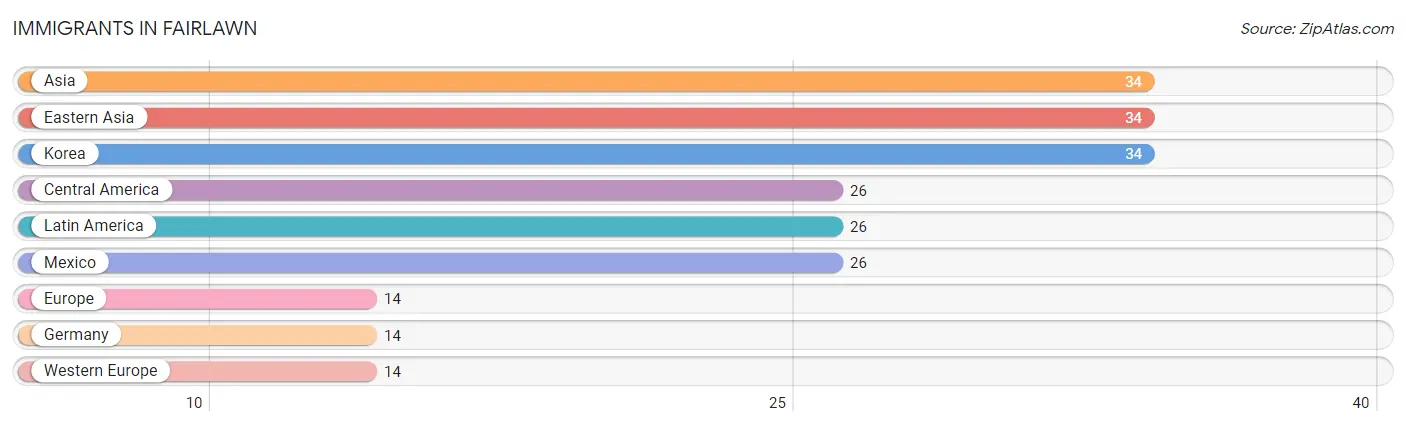
| Immigration Origin | # Population | % Population |
| Asia | 34 | 1.4% |
| Central America | 26 | 1.1% |
| Eastern Asia | 34 | 1.4% |
| Europe | 14 | 0.6% |
| Germany | 14 | 0.6% |
| Korea | 34 | 1.4% |
| Latin America | 26 | 1.1% |
| Mexico | 26 | 1.1% |
| Western Europe | 14 | 0.6% | View All 9 Rows |
Sex and Age in Fairlawn
Sex and Age in Fairlawn
The most populous age groups in Fairlawn are 55 to 59 Years (191 | 16.2%) for men and 75 to 79 Years (141 | 11.6%) for women.
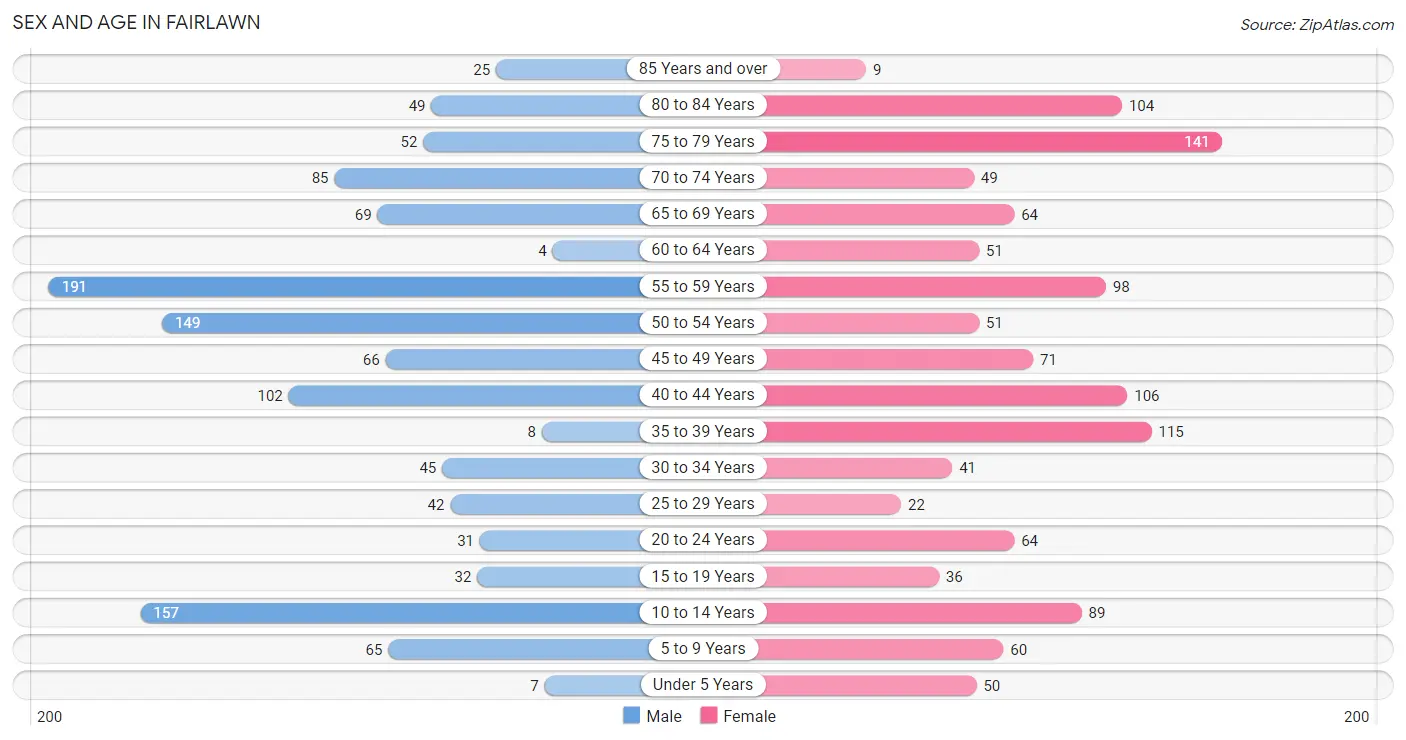
| Age Bracket | Male | Female |
| Under 5 Years | 7 (0.6%) | 50 (4.1%) |
| 5 to 9 Years | 65 (5.5%) | 60 (4.9%) |
| 10 to 14 Years | 157 (13.3%) | 89 (7.3%) |
| 15 to 19 Years | 32 (2.7%) | 36 (2.9%) |
| 20 to 24 Years | 31 (2.6%) | 64 (5.2%) |
| 25 to 29 Years | 42 (3.6%) | 22 (1.8%) |
| 30 to 34 Years | 45 (3.8%) | 41 (3.4%) |
| 35 to 39 Years | 8 (0.7%) | 115 (9.4%) |
| 40 to 44 Years | 102 (8.6%) | 106 (8.7%) |
| 45 to 49 Years | 66 (5.6%) | 71 (5.8%) |
| 50 to 54 Years | 149 (12.6%) | 51 (4.2%) |
| 55 to 59 Years | 191 (16.2%) | 98 (8.0%) |
| 60 to 64 Years | 4 (0.3%) | 51 (4.2%) |
| 65 to 69 Years | 69 (5.9%) | 64 (5.2%) |
| 70 to 74 Years | 85 (7.2%) | 49 (4.0%) |
| 75 to 79 Years | 52 (4.4%) | 141 (11.6%) |
| 80 to 84 Years | 49 (4.2%) | 104 (8.5%) |
| 85 Years and over | 25 (2.1%) | 9 (0.7%) |
| Total | 1,179 (100.0%) | 1,221 (100.0%) |
Families and Households in Fairlawn
Median Family Size in Fairlawn
The median family size in Fairlawn is 2.69 persons per family, with married-couple families (638 | 93.0%) accounting for the largest median family size of 2.73 persons per family. On the other hand, single male/father families (22 | 3.2%) represent the smallest median family size with 1.91 persons per family.
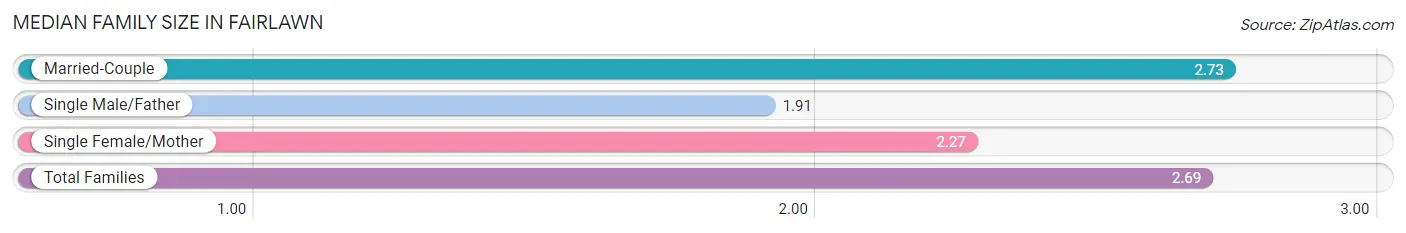
| Family Type | # Families | Family Size |
| Married-Couple | 638 (93.0%) | 2.73 |
| Single Male/Father | 22 (3.2%) | 1.91 |
| Single Female/Mother | 26 (3.8%) | 2.27 |
| Total Families | 686 (100.0%) | 2.69 |
Median Household Size in Fairlawn
The median household size in Fairlawn is 2.02 persons per household, with single female/mother households (26 | 2.2%) accounting for the largest median household size of 3.23 persons per household. non-family households (503 | 42.3%) represent the smallest median household size with 1.06 persons per household.
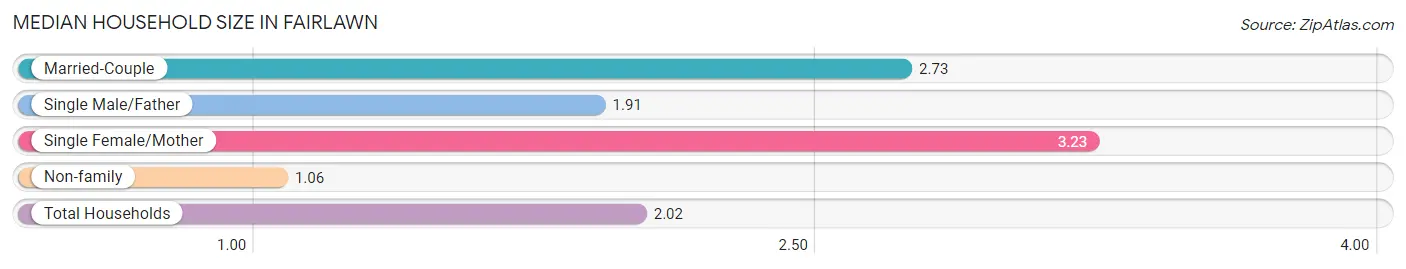
| Household Type | # Households | Household Size |
| Married-Couple | 638 (53.7%) | 2.73 |
| Single Male/Father | 22 (1.8%) | 1.91 |
| Single Female/Mother | 26 (2.2%) | 3.23 |
| Non-family | 503 (42.3%) | 1.06 |
| Total Households | 1,189 (100.0%) | 2.02 |
Household Size by Marriage Status in Fairlawn
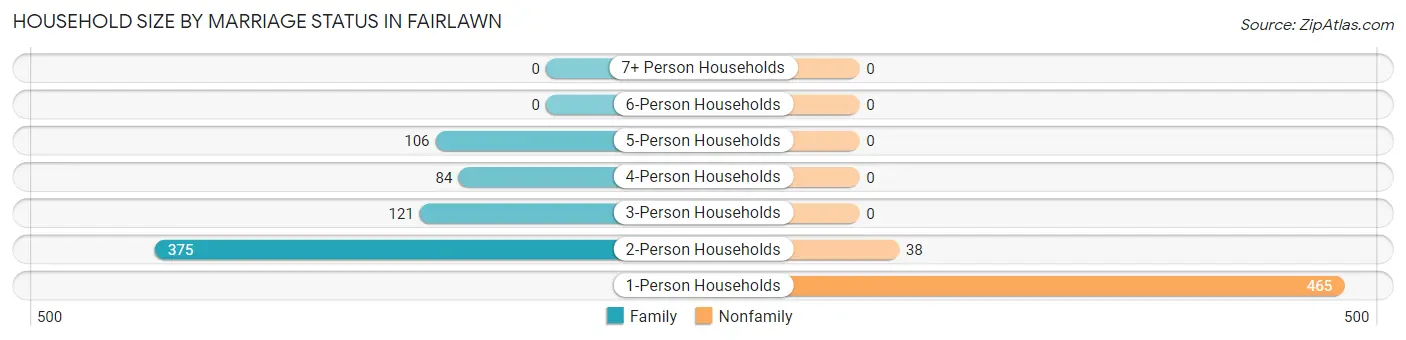
Out of a total of 1,189 households in Fairlawn, 686 (57.7%) are family households, while 503 (42.3%) are nonfamily households. The most numerous type of family households are 2-person households, comprising 375, and the most common type of nonfamily households are 1-person households, comprising 465.
| Household Size | Family Households | Nonfamily Households |
| 1-Person Households | - | 465 (39.1%) |
| 2-Person Households | 375 (31.5%) | 38 (3.2%) |
| 3-Person Households | 121 (10.2%) | 0 (0.0%) |
| 4-Person Households | 84 (7.1%) | 0 (0.0%) |
| 5-Person Households | 106 (8.9%) | 0 (0.0%) |
| 6-Person Households | 0 (0.0%) | 0 (0.0%) |
| 7+ Person Households | 0 (0.0%) | 0 (0.0%) |
| Total | 686 (57.7%) | 503 (42.3%) |
Female Fertility in Fairlawn
Fertility by Age in Fairlawn
| Age Bracket | Women with Births | Births / 1,000 Women |
| 15 to 19 years | 0 (0.0%) | 0.0 |
| 20 to 34 years | 0 (0.0%) | 0.0 |
| 35 to 50 years | 0 (0.0%) | 0.0 |
| Total | 0 (0.0%) | 0.0 |
Fertility by Age by Marriage Status in Fairlawn
| Age Bracket | Married | Unmarried |
| 15 to 19 years | 0 (0.0%) | 0 (0.0%) |
| 20 to 34 years | 0 (0.0%) | 0 (0.0%) |
| 35 to 50 years | 0 (0.0%) | 0 (0.0%) |
| Total | 0 (0.0%) | 0 (0.0%) |
Fertility by Education in Fairlawn
| Educational Attainment | Women with Births | Births / 1,000 Women |
| Less than High School | 0 (0.0%) | 0.0 |
| High School Diploma | 0 (0.0%) | 0.0 |
| College or Associate's Degree | 0 (0.0%) | 0.0 |
| Bachelor's Degree | 0 (0.0%) | 0.0 |
| Graduate Degree | 0 (0.0%) | 0.0 |
| Total | 0 (0.0%) | 0.0 |
Fertility by Education by Marriage Status in Fairlawn
| Educational Attainment | Married | Unmarried |
| Less than High School | 0 (0.0%) | 0 (0.0%) |
| High School Diploma | 0 (0.0%) | 0 (0.0%) |
| College or Associate's Degree | 0 (0.0%) | 0 (0.0%) |
| Bachelor's Degree | 0 (0.0%) | 0 (0.0%) |
| Graduate Degree | 0 (0.0%) | 0 (0.0%) |
| Total | 0 (0.0%) | 0 (0.0%) |
Employment Characteristics in Fairlawn
Employment by Class of Employer in Fairlawn
Among the 997 employed individuals in Fairlawn, private company employees (571 | 57.3%), state government employees (140 | 14.0%), and local government employees (124 | 12.4%) make up the most common classes of employment.
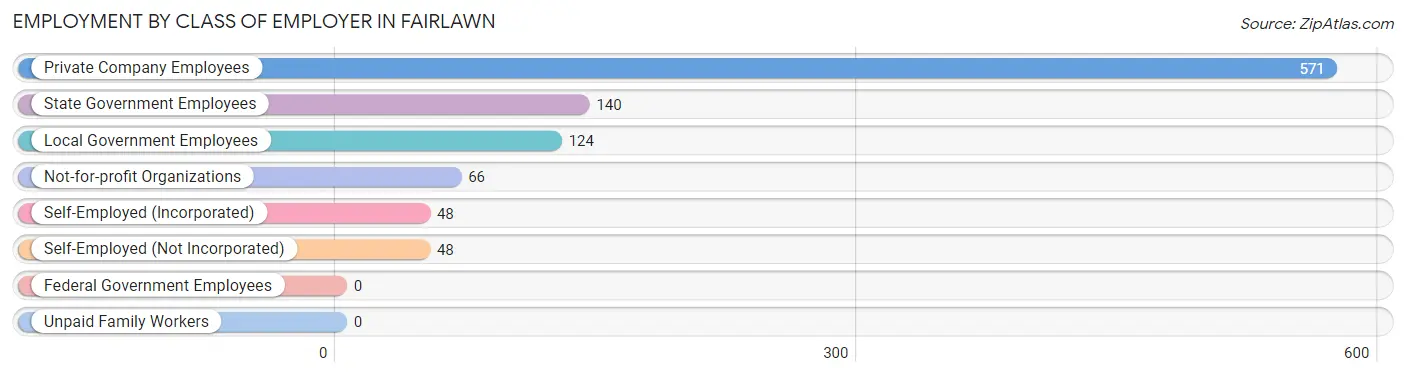
| Employer Class | # Employees | % Employees |
| Private Company Employees | 571 | 57.3% |
| Self-Employed (Incorporated) | 48 | 4.8% |
| Self-Employed (Not Incorporated) | 48 | 4.8% |
| Not-for-profit Organizations | 66 | 6.6% |
| Local Government Employees | 124 | 12.4% |
| State Government Employees | 140 | 14.0% |
| Federal Government Employees | 0 | 0.0% |
| Unpaid Family Workers | 0 | 0.0% |
| Total | 997 | 100.0% |
Employment Status by Age in Fairlawn
According to the labor force statistics for Fairlawn, out of the total population over 16 years of age (1,972), 54.5% or 1,075 individuals are in the labor force, with 3.2% or 34 of them unemployed. The age group with the highest labor force participation rate is 25 to 29 years, with 100.0% or 64 individuals in the labor force. Within the labor force, the 16 to 19 years age range has the highest percentage of unemployed individuals, with 100.0% or 12 of them being unemployed.
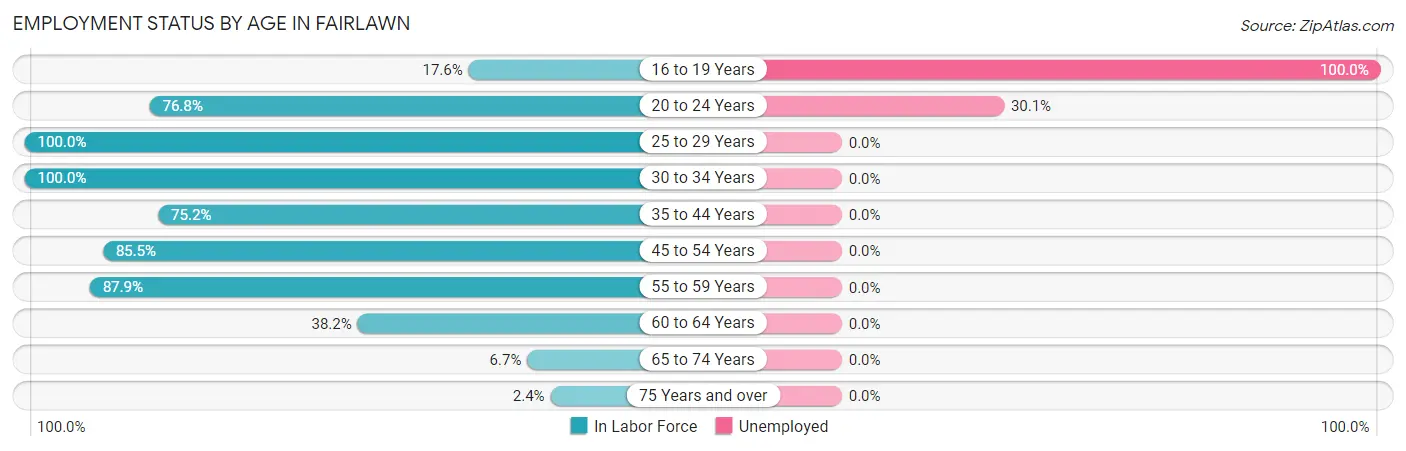
| Age Bracket | In Labor Force | Unemployed |
| 16 to 19 Years | 12 (17.6%) | 12 (100.0%) |
| 20 to 24 Years | 73 (76.8%) | 22 (30.1%) |
| 25 to 29 Years | 64 (100.0%) | 0 (0.0%) |
| 30 to 34 Years | 86 (100.0%) | 0 (0.0%) |
| 35 to 44 Years | 249 (75.2%) | 0 (0.0%) |
| 45 to 54 Years | 288 (85.5%) | 0 (0.0%) |
| 55 to 59 Years | 254 (87.9%) | 0 (0.0%) |
| 60 to 64 Years | 21 (38.2%) | 0 (0.0%) |
| 65 to 74 Years | 18 (6.7%) | 0 (0.0%) |
| 75 Years and over | 9 (2.4%) | 0 (0.0%) |
| Total | 1,075 (54.5%) | 34 (3.2%) |
Employment Status by Educational Attainment in Fairlawn
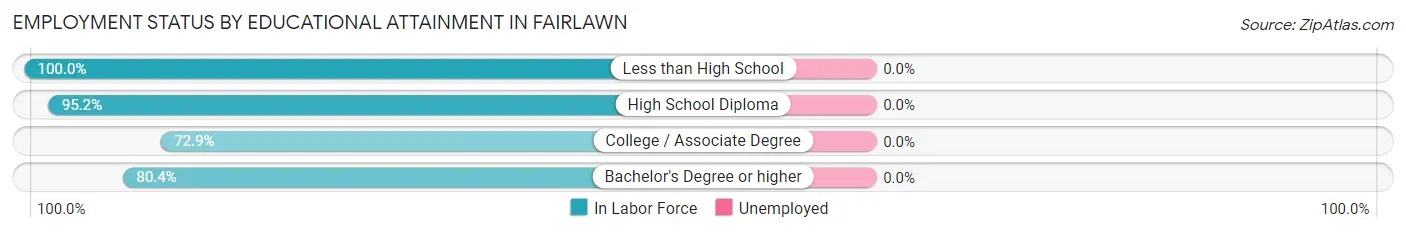
| Educational Attainment | In Labor Force | Unemployed |
| Less than High School | 59 (100.0%) | 0 (0.0%) |
| High School Diploma | 260 (95.2%) | 0 (0.0%) |
| College / Associate Degree | 237 (72.9%) | 0 (0.0%) |
| Bachelor's Degree or higher | 406 (80.4%) | 0 (0.0%) |
| Total | 962 (82.8%) | 0 (0.0%) |
Employment Occupations by Sex in Fairlawn
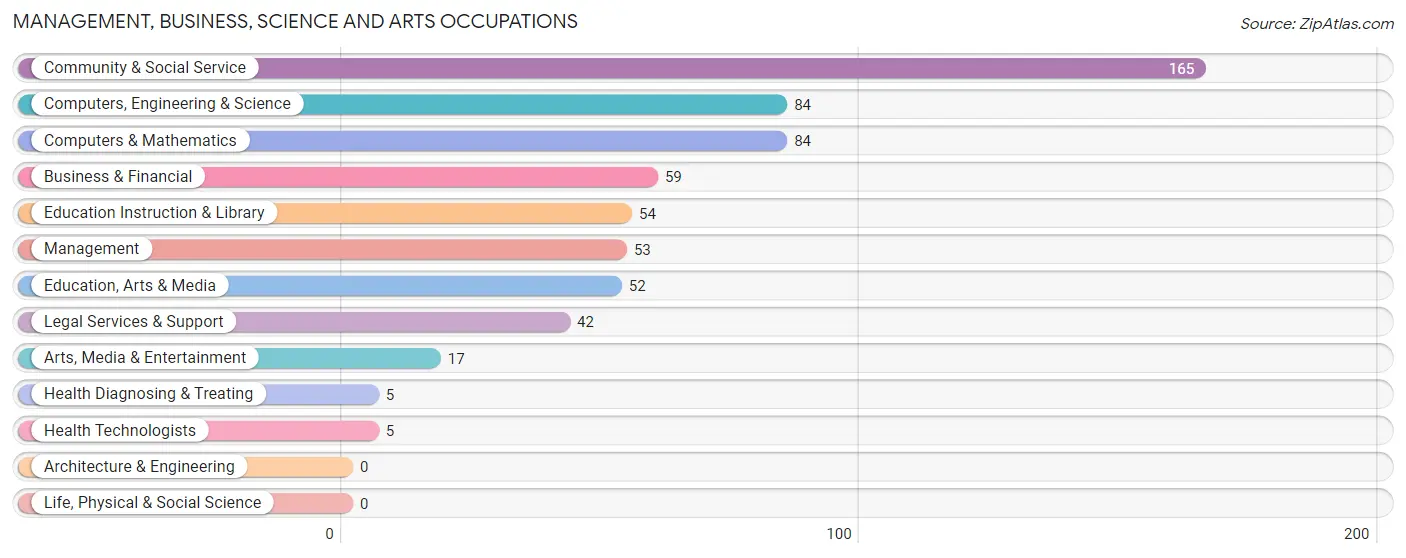
Management, Business, Science and Arts Occupations
The most common Management, Business, Science and Arts occupations in Fairlawn are Community & Social Service (165 | 15.9%), Computers, Engineering & Science (84 | 8.1%), Computers & Mathematics (84 | 8.1%), Business & Financial (59 | 5.7%), and Education Instruction & Library (54 | 5.2%).
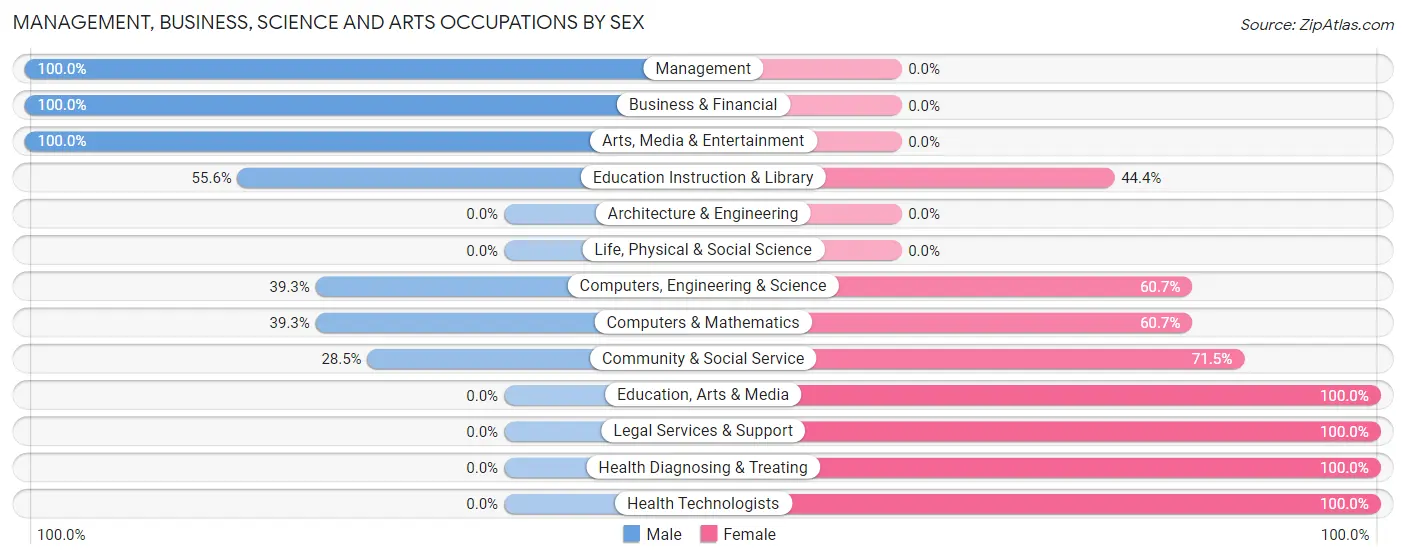
Management, Business, Science and Arts Occupations by Sex
Within the Management, Business, Science and Arts occupations in Fairlawn, the most male-oriented occupations are Management (100.0%), Business & Financial (100.0%), and Arts, Media & Entertainment (100.0%), while the most female-oriented occupations are Education, Arts & Media (100.0%), Legal Services & Support (100.0%), and Health Diagnosing & Treating (100.0%).
| Occupation | Male | Female |
| Management | 53 (100.0%) | 0 (0.0%) |
| Business & Financial | 59 (100.0%) | 0 (0.0%) |
| Computers, Engineering & Science | 33 (39.3%) | 51 (60.7%) |
| Computers & Mathematics | 33 (39.3%) | 51 (60.7%) |
| Architecture & Engineering | 0 (0.0%) | 0 (0.0%) |
| Life, Physical & Social Science | 0 (0.0%) | 0 (0.0%) |
| Community & Social Service | 47 (28.5%) | 118 (71.5%) |
| Education, Arts & Media | 0 (0.0%) | 52 (100.0%) |
| Legal Services & Support | 0 (0.0%) | 42 (100.0%) |
| Education Instruction & Library | 30 (55.6%) | 24 (44.4%) |
| Arts, Media & Entertainment | 17 (100.0%) | 0 (0.0%) |
| Health Diagnosing & Treating | 0 (0.0%) | 5 (100.0%) |
| Health Technologists | 0 (0.0%) | 5 (100.0%) |
| Total (Category) | 192 (52.5%) | 174 (47.5%) |
| Total (Overall) | 641 (61.6%) | 399 (38.4%) |
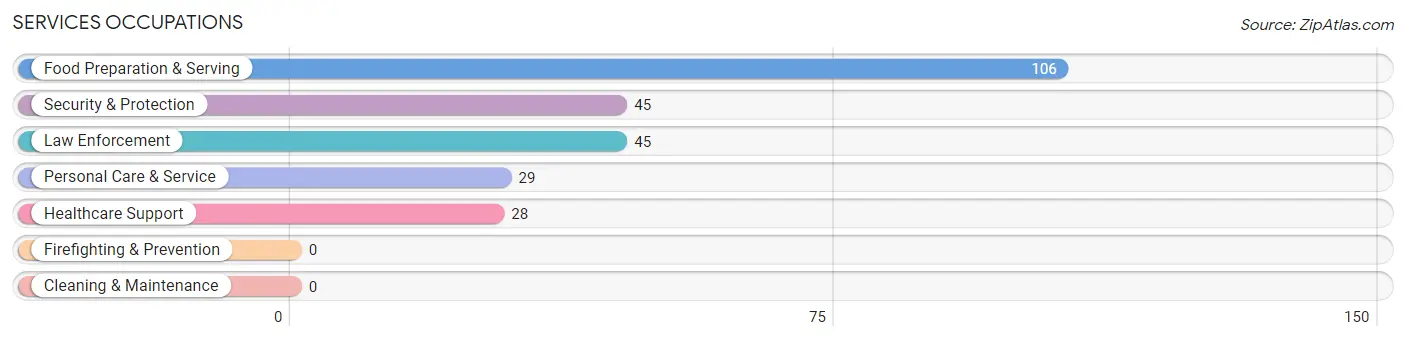
Services Occupations
The most common Services occupations in Fairlawn are Food Preparation & Serving (106 | 10.2%), Security & Protection (45 | 4.3%), Law Enforcement (45 | 4.3%), Personal Care & Service (29 | 2.8%), and Healthcare Support (28 | 2.7%).
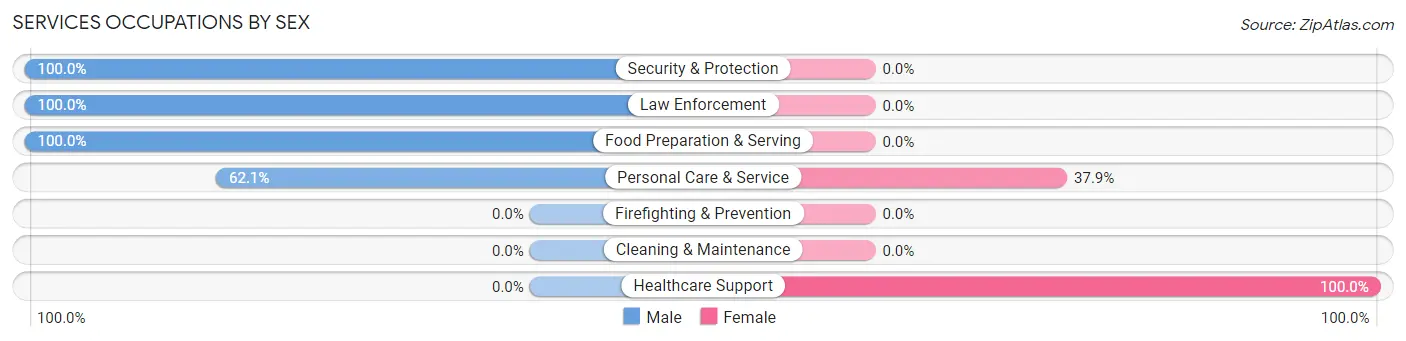
Services Occupations by Sex
Within the Services occupations in Fairlawn, the most male-oriented occupations are Security & Protection (100.0%), Law Enforcement (100.0%), and Food Preparation & Serving (100.0%), while the most female-oriented occupations are Healthcare Support (100.0%), and Personal Care & Service (37.9%).
| Occupation | Male | Female |
| Healthcare Support | 0 (0.0%) | 28 (100.0%) |
| Security & Protection | 45 (100.0%) | 0 (0.0%) |
| Firefighting & Prevention | 0 (0.0%) | 0 (0.0%) |
| Law Enforcement | 45 (100.0%) | 0 (0.0%) |
| Food Preparation & Serving | 106 (100.0%) | 0 (0.0%) |
| Cleaning & Maintenance | 0 (0.0%) | 0 (0.0%) |
| Personal Care & Service | 18 (62.1%) | 11 (37.9%) |
| Total (Category) | 169 (81.2%) | 39 (18.8%) |
| Total (Overall) | 641 (61.6%) | 399 (38.4%) |
Sales and Office Occupations
The most common Sales and Office occupations in Fairlawn are Sales & Related (161 | 15.5%), and Office & Administration (139 | 13.4%).
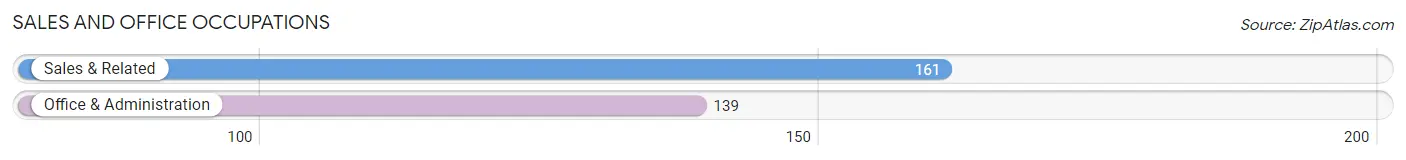
Sales and Office Occupations by Sex
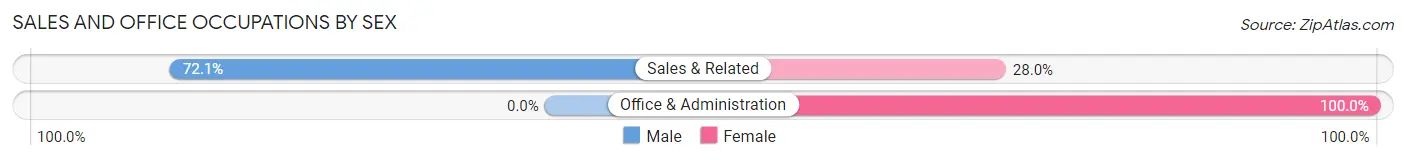
| Occupation | Male | Female |
| Sales & Related | 116 (72.1%) | 45 (28.0%) |
| Office & Administration | 0 (0.0%) | 139 (100.0%) |
| Total (Category) | 116 (38.7%) | 184 (61.3%) |
| Total (Overall) | 641 (61.6%) | 399 (38.4%) |
Natural Resources, Construction and Maintenance Occupations
The most common Natural Resources, Construction and Maintenance occupations in Fairlawn are Construction & Extraction (61 | 5.9%), and Installation, Maintenance & Repair (34 | 3.3%).
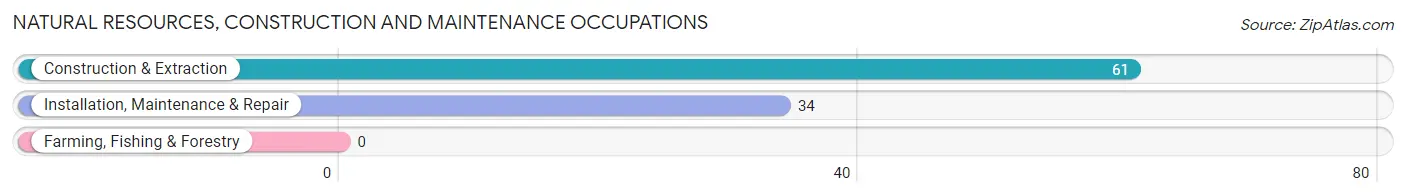
Natural Resources, Construction and Maintenance Occupations by Sex
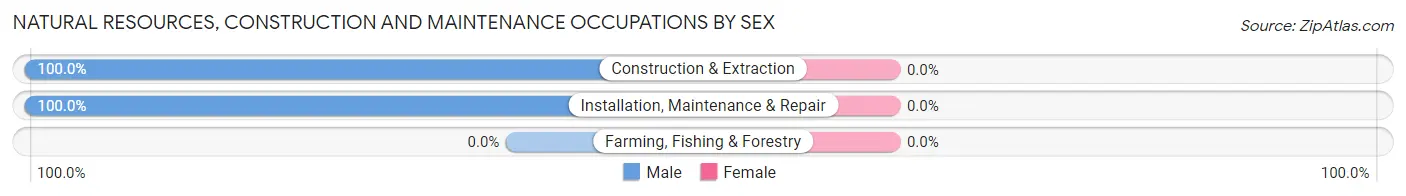
| Occupation | Male | Female |
| Farming, Fishing & Forestry | 0 (0.0%) | 0 (0.0%) |
| Construction & Extraction | 61 (100.0%) | 0 (0.0%) |
| Installation, Maintenance & Repair | 34 (100.0%) | 0 (0.0%) |
| Total (Category) | 95 (100.0%) | 0 (0.0%) |
| Total (Overall) | 641 (61.6%) | 399 (38.4%) |
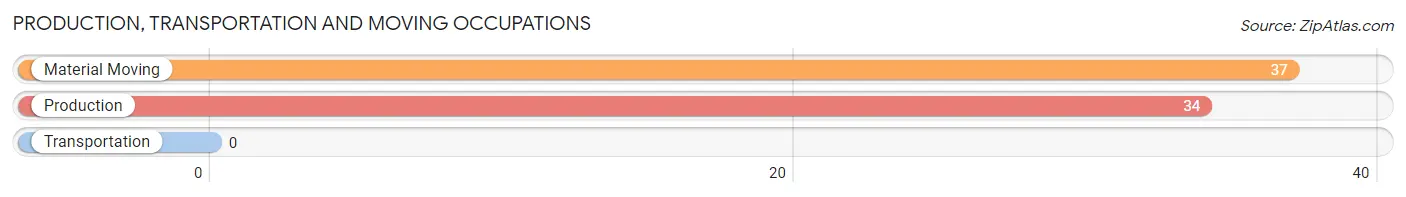
Production, Transportation and Moving Occupations
The most common Production, Transportation and Moving occupations in Fairlawn are Material Moving (37 | 3.6%), and Production (34 | 3.3%).
Production, Transportation and Moving Occupations by Sex
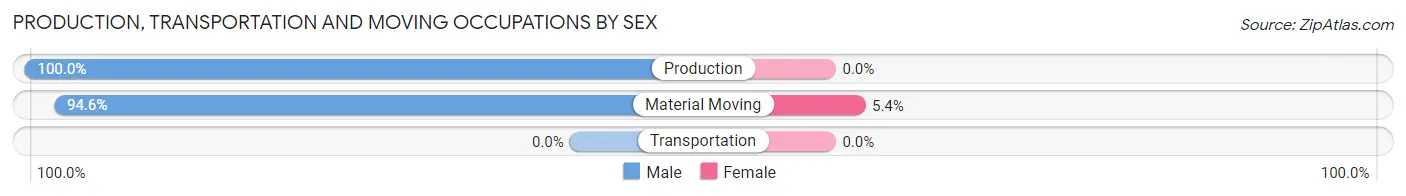
| Occupation | Male | Female |
| Production | 34 (100.0%) | 0 (0.0%) |
| Transportation | 0 (0.0%) | 0 (0.0%) |
| Material Moving | 35 (94.6%) | 2 (5.4%) |
| Total (Category) | 69 (97.2%) | 2 (2.8%) |
| Total (Overall) | 641 (61.6%) | 399 (38.4%) |
Employment Industries by Sex in Fairlawn
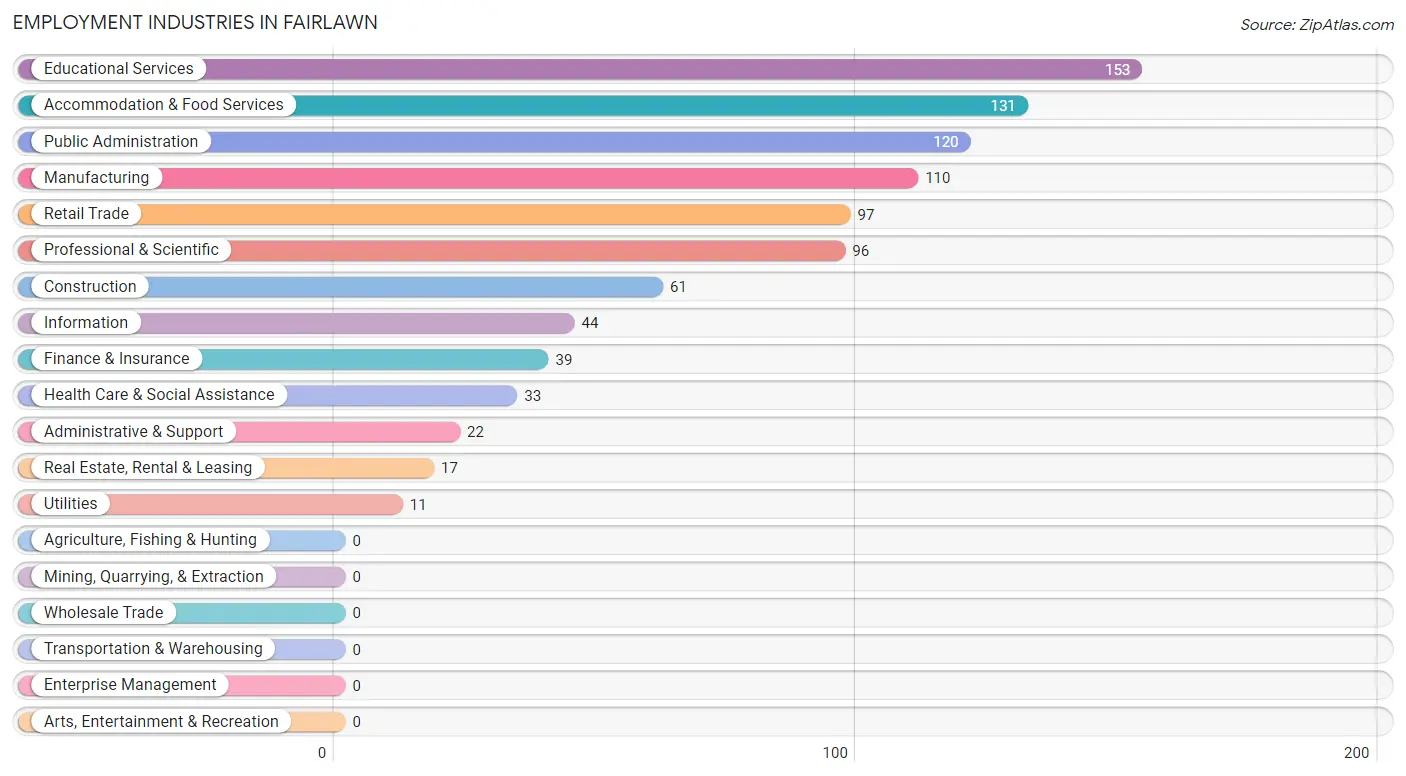
Employment Industries in Fairlawn
The major employment industries in Fairlawn include Educational Services (153 | 14.7%), Accommodation & Food Services (131 | 12.6%), Public Administration (120 | 11.5%), Manufacturing (110 | 10.6%), and Retail Trade (97 | 9.3%).
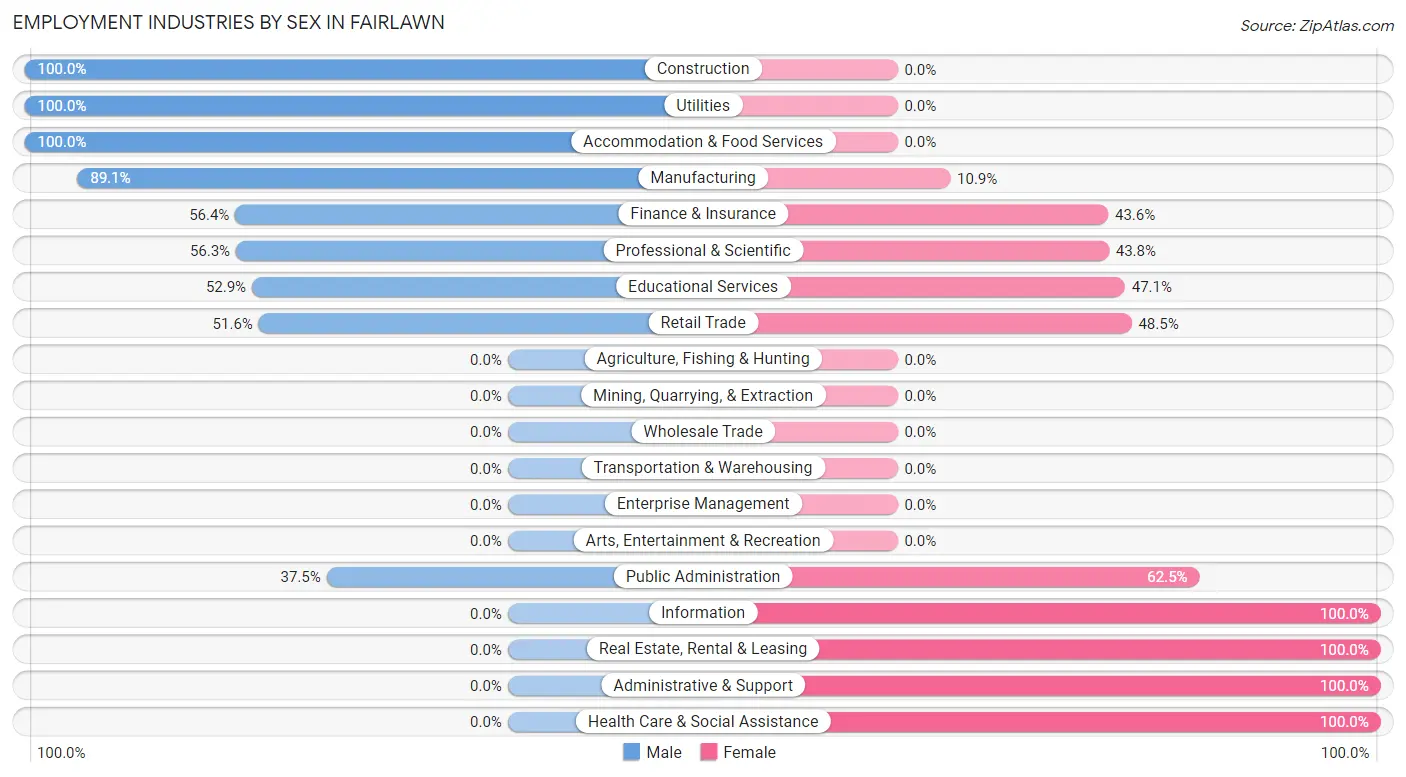
Employment Industries by Sex in Fairlawn
The Fairlawn industries that see more men than women are Construction (100.0%), Utilities (100.0%), and Accommodation & Food Services (100.0%), whereas the industries that tend to have a higher number of women are Information (100.0%), Real Estate, Rental & Leasing (100.0%), and Administrative & Support (100.0%).
| Industry | Male | Female |
| Agriculture, Fishing & Hunting | 0 (0.0%) | 0 (0.0%) |
| Mining, Quarrying, & Extraction | 0 (0.0%) | 0 (0.0%) |
| Construction | 61 (100.0%) | 0 (0.0%) |
| Manufacturing | 98 (89.1%) | 12 (10.9%) |
| Wholesale Trade | 0 (0.0%) | 0 (0.0%) |
| Retail Trade | 50 (51.5%) | 47 (48.4%) |
| Transportation & Warehousing | 0 (0.0%) | 0 (0.0%) |
| Utilities | 11 (100.0%) | 0 (0.0%) |
| Information | 0 (0.0%) | 44 (100.0%) |
| Finance & Insurance | 22 (56.4%) | 17 (43.6%) |
| Real Estate, Rental & Leasing | 0 (0.0%) | 17 (100.0%) |
| Professional & Scientific | 54 (56.2%) | 42 (43.8%) |
| Enterprise Management | 0 (0.0%) | 0 (0.0%) |
| Administrative & Support | 0 (0.0%) | 22 (100.0%) |
| Educational Services | 81 (52.9%) | 72 (47.1%) |
| Health Care & Social Assistance | 0 (0.0%) | 33 (100.0%) |
| Arts, Entertainment & Recreation | 0 (0.0%) | 0 (0.0%) |
| Accommodation & Food Services | 131 (100.0%) | 0 (0.0%) |
| Public Administration | 45 (37.5%) | 75 (62.5%) |
| Total | 641 (61.6%) | 399 (38.4%) |
Education in Fairlawn
School Enrollment in Fairlawn
The most common levels of schooling among the 439 students in Fairlawn are middle school (190 | 43.3%), elementary school (110 | 25.1%), and college / undergraduate (68 | 15.5%).
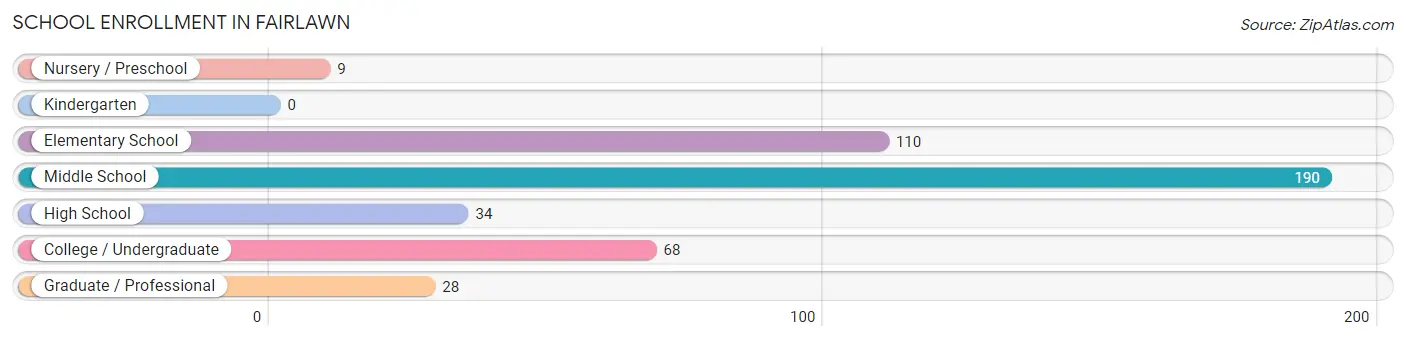
| School Level | # Students | % Students |
| Nursery / Preschool | 9 | 2.1% |
| Kindergarten | 0 | 0.0% |
| Elementary School | 110 | 25.1% |
| Middle School | 190 | 43.3% |
| High School | 34 | 7.7% |
| College / Undergraduate | 68 | 15.5% |
| Graduate / Professional | 28 | 6.4% |
| Total | 439 | 100.0% |
School Enrollment by Age by Funding Source in Fairlawn
Out of a total of 439 students who are enrolled in schools in Fairlawn, 9 (2.1%) attend a private institution, while the remaining 430 (97.9%) are enrolled in public schools. The age group of 3 to 4 year olds has the highest likelihood of being enrolled in private schools, with 9 (100.0% in the age bracket) enrolled. Conversely, the age group of 5 to 9 year old has the lowest likelihood of being enrolled in a private school, with 110 (100.0% in the age bracket) attending a public institution.
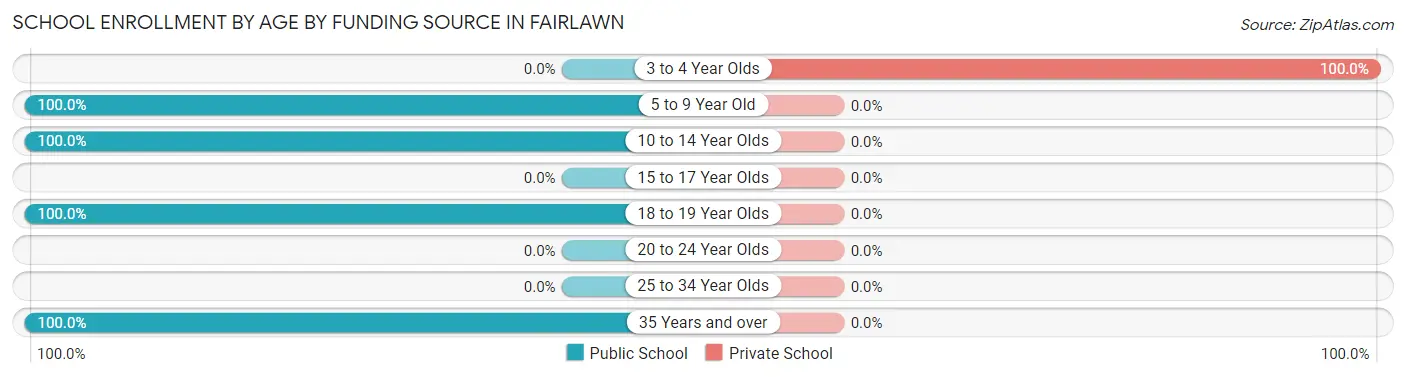
| Age Bracket | Public School | Private School |
| 3 to 4 Year Olds | 0 (0.0%) | 9 (100.0%) |
| 5 to 9 Year Old | 110 (100.0%) | 0 (0.0%) |
| 10 to 14 Year Olds | 224 (100.0%) | 0 (0.0%) |
| 15 to 17 Year Olds | 0 (0.0%) | 0 (0.0%) |
| 18 to 19 Year Olds | 68 (100.0%) | 0 (0.0%) |
| 20 to 24 Year Olds | 0 (0.0%) | 0 (0.0%) |
| 25 to 34 Year Olds | 0 (0.0%) | 0 (0.0%) |
| 35 Years and over | 28 (100.0%) | 0 (0.0%) |
| Total | 430 (97.9%) | 9 (2.1%) |
Educational Attainment by Field of Study in Fairlawn
Education (182 | 22.5%), business (146 | 18.0%), social sciences (116 | 14.3%), computers & mathematics (97 | 12.0%), and communications (62 | 7.6%) are the most common fields of study among 810 individuals in Fairlawn who have obtained a bachelor's degree or higher.
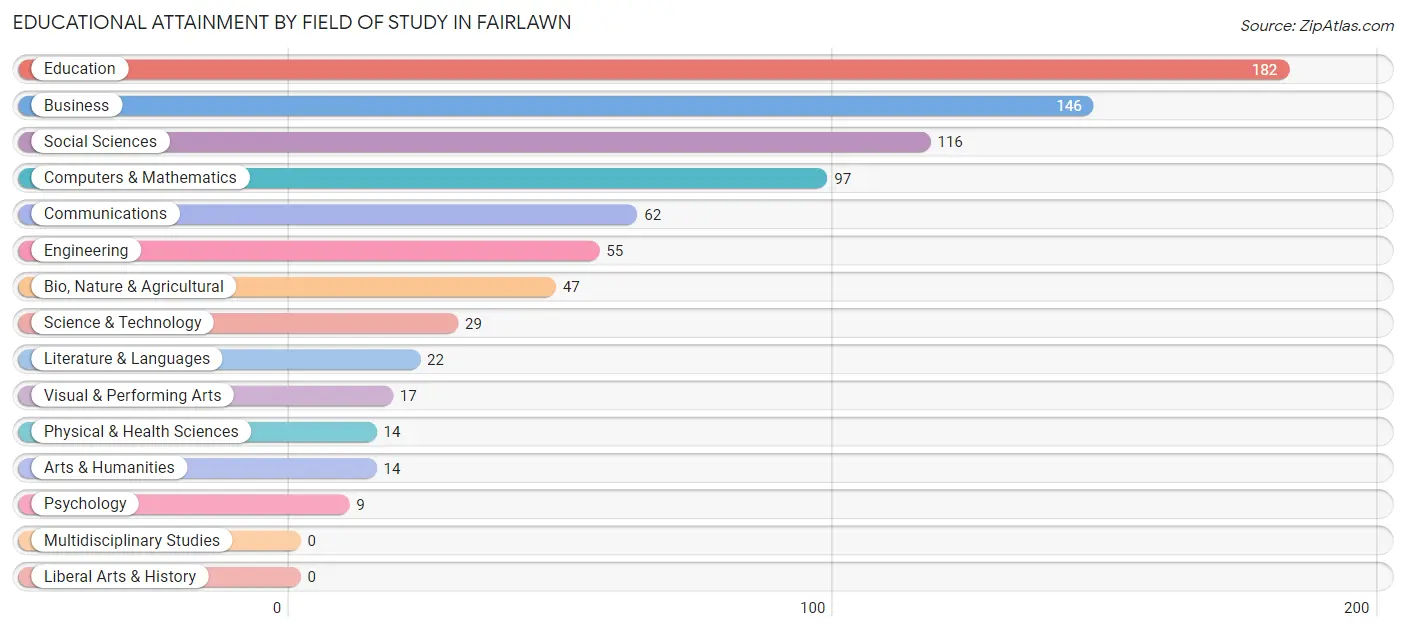
| Field of Study | # Graduates | % Graduates |
| Computers & Mathematics | 97 | 12.0% |
| Bio, Nature & Agricultural | 47 | 5.8% |
| Physical & Health Sciences | 14 | 1.7% |
| Psychology | 9 | 1.1% |
| Social Sciences | 116 | 14.3% |
| Engineering | 55 | 6.8% |
| Multidisciplinary Studies | 0 | 0.0% |
| Science & Technology | 29 | 3.6% |
| Business | 146 | 18.0% |
| Education | 182 | 22.5% |
| Literature & Languages | 22 | 2.7% |
| Liberal Arts & History | 0 | 0.0% |
| Visual & Performing Arts | 17 | 2.1% |
| Communications | 62 | 7.6% |
| Arts & Humanities | 14 | 1.7% |
| Total | 810 | 100.0% |
Transportation & Commute in Fairlawn
Vehicle Availability by Sex in Fairlawn
The most prevalent vehicle ownership categories in Fairlawn are males with 2 vehicles (301, accounting for 50.3%) and females with 2 vehicles (208, making up 75.4%).
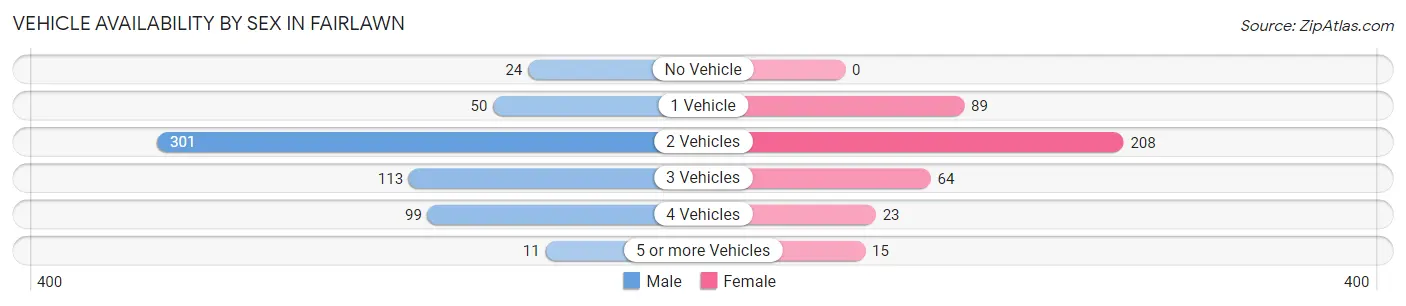
| Vehicles Available | Male | Female |
| No Vehicle | 24 (4.0%) | 0 (0.0%) |
| 1 Vehicle | 50 (8.4%) | 89 (22.3%) |
| 2 Vehicles | 301 (50.3%) | 208 (52.1%) |
| 3 Vehicles | 113 (18.9%) | 64 (16.0%) |
| 4 Vehicles | 99 (16.6%) | 23 (5.8%) |
| 5 or more Vehicles | 11 (1.8%) | 15 (3.8%) |
| Total | 598 (100.0%) | 399 (100.0%) |
Commute Time in Fairlawn
The most frequently occuring commute durations in Fairlawn are 20 to 24 minutes (360 commuters, 36.4%), 15 to 19 minutes (293 commuters, 29.7%), and 30 to 34 minutes (152 commuters, 15.4%).
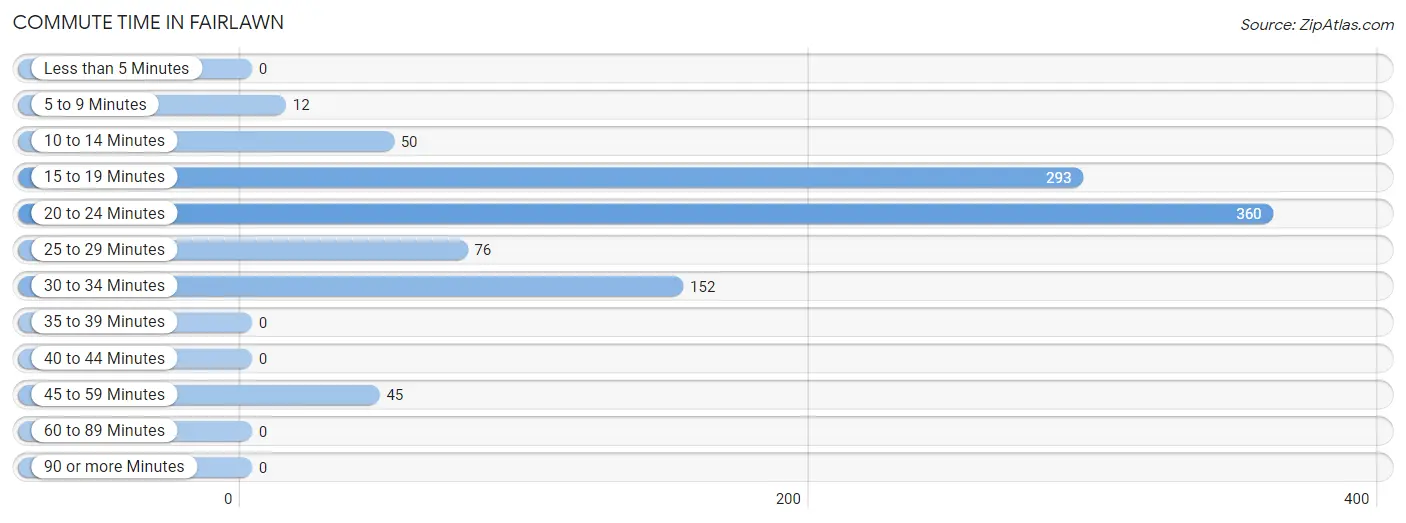
| Commute Time | # Commuters | % Commuters |
| Less than 5 Minutes | 0 | 0.0% |
| 5 to 9 Minutes | 12 | 1.2% |
| 10 to 14 Minutes | 50 | 5.1% |
| 15 to 19 Minutes | 293 | 29.7% |
| 20 to 24 Minutes | 360 | 36.4% |
| 25 to 29 Minutes | 76 | 7.7% |
| 30 to 34 Minutes | 152 | 15.4% |
| 35 to 39 Minutes | 0 | 0.0% |
| 40 to 44 Minutes | 0 | 0.0% |
| 45 to 59 Minutes | 45 | 4.5% |
| 60 to 89 Minutes | 0 | 0.0% |
| 90 or more Minutes | 0 | 0.0% |
Commute Time by Sex in Fairlawn
The most common commute times in Fairlawn are 15 to 19 minutes (230 commuters, 38.5%) for males and 20 to 24 minutes (215 commuters, 55.1%) for females.
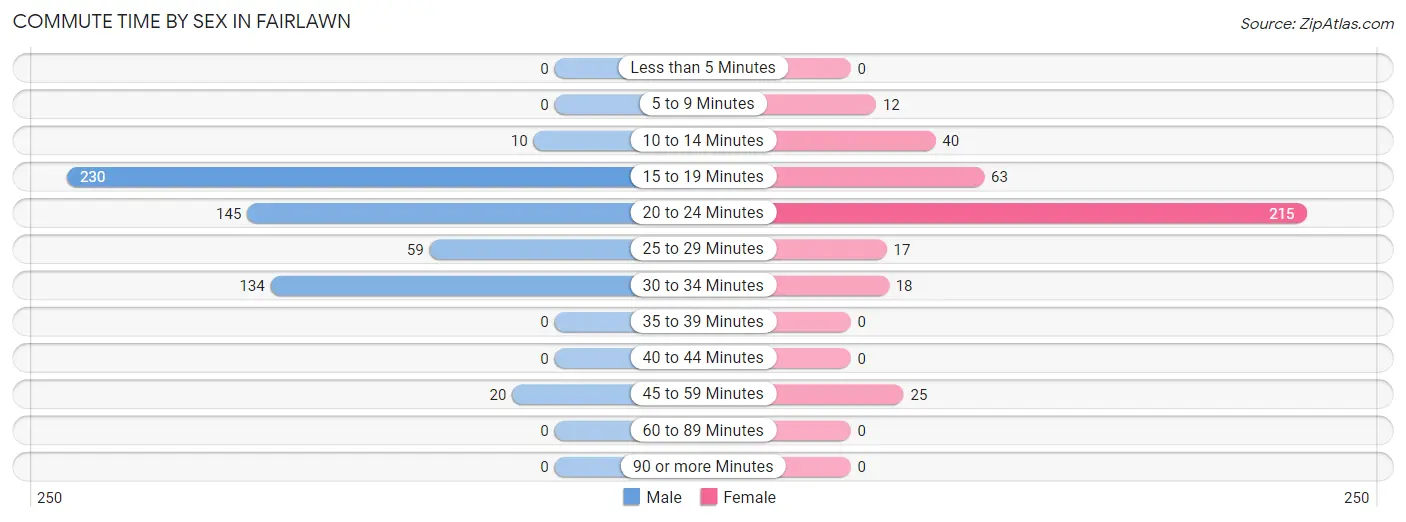
| Commute Time | Male | Female |
| Less than 5 Minutes | 0 (0.0%) | 0 (0.0%) |
| 5 to 9 Minutes | 0 (0.0%) | 12 (3.1%) |
| 10 to 14 Minutes | 10 (1.7%) | 40 (10.3%) |
| 15 to 19 Minutes | 230 (38.5%) | 63 (16.2%) |
| 20 to 24 Minutes | 145 (24.2%) | 215 (55.1%) |
| 25 to 29 Minutes | 59 (9.9%) | 17 (4.4%) |
| 30 to 34 Minutes | 134 (22.4%) | 18 (4.6%) |
| 35 to 39 Minutes | 0 (0.0%) | 0 (0.0%) |
| 40 to 44 Minutes | 0 (0.0%) | 0 (0.0%) |
| 45 to 59 Minutes | 20 (3.3%) | 25 (6.4%) |
| 60 to 89 Minutes | 0 (0.0%) | 0 (0.0%) |
| 90 or more Minutes | 0 (0.0%) | 0 (0.0%) |
Time of Departure to Work by Sex in Fairlawn
The most frequent times of departure to work in Fairlawn are 7:00 AM to 7:29 AM (167, 27.9%) for males and 6:30 AM to 6:59 AM (95, 24.4%) for females.
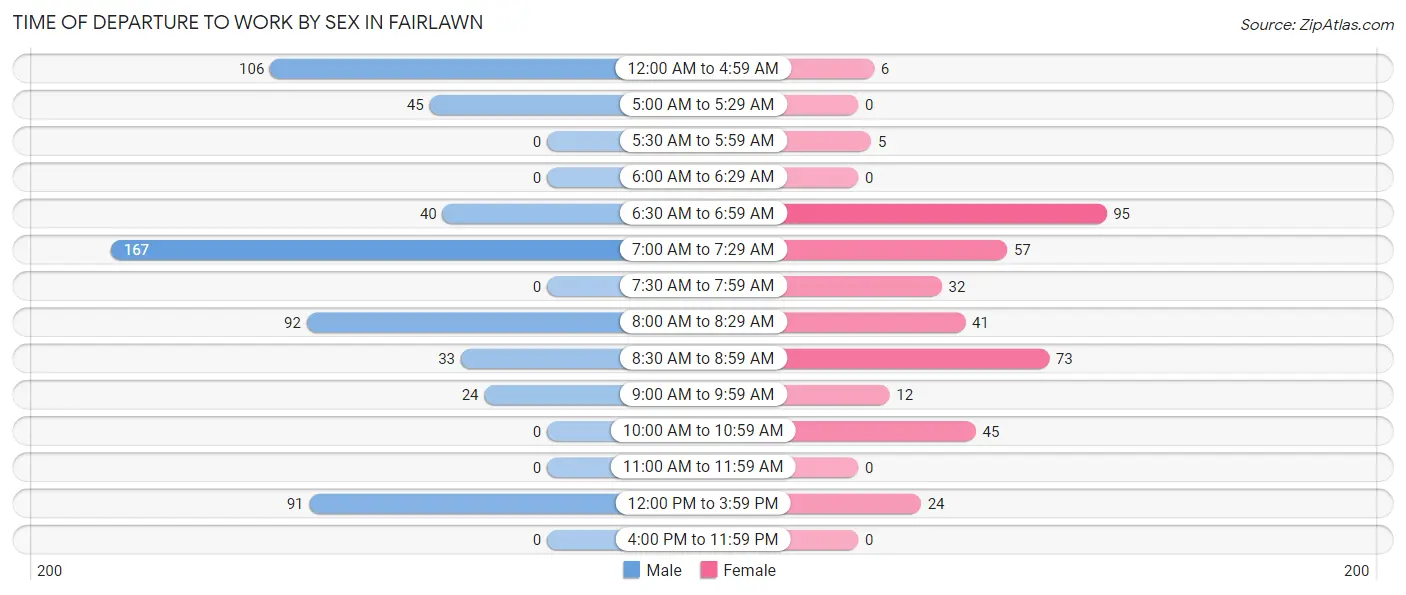
| Time of Departure | Male | Female |
| 12:00 AM to 4:59 AM | 106 (17.7%) | 6 (1.5%) |
| 5:00 AM to 5:29 AM | 45 (7.5%) | 0 (0.0%) |
| 5:30 AM to 5:59 AM | 0 (0.0%) | 5 (1.3%) |
| 6:00 AM to 6:29 AM | 0 (0.0%) | 0 (0.0%) |
| 6:30 AM to 6:59 AM | 40 (6.7%) | 95 (24.4%) |
| 7:00 AM to 7:29 AM | 167 (27.9%) | 57 (14.6%) |
| 7:30 AM to 7:59 AM | 0 (0.0%) | 32 (8.2%) |
| 8:00 AM to 8:29 AM | 92 (15.4%) | 41 (10.5%) |
| 8:30 AM to 8:59 AM | 33 (5.5%) | 73 (18.7%) |
| 9:00 AM to 9:59 AM | 24 (4.0%) | 12 (3.1%) |
| 10:00 AM to 10:59 AM | 0 (0.0%) | 45 (11.5%) |
| 11:00 AM to 11:59 AM | 0 (0.0%) | 0 (0.0%) |
| 12:00 PM to 3:59 PM | 91 (15.2%) | 24 (6.1%) |
| 4:00 PM to 11:59 PM | 0 (0.0%) | 0 (0.0%) |
| Total | 598 (100.0%) | 390 (100.0%) |
Housing Occupancy in Fairlawn
Occupancy by Ownership in Fairlawn
Of the total 1,189 dwellings in Fairlawn, owner-occupied units account for 932 (78.4%), while renter-occupied units make up 257 (21.6%).
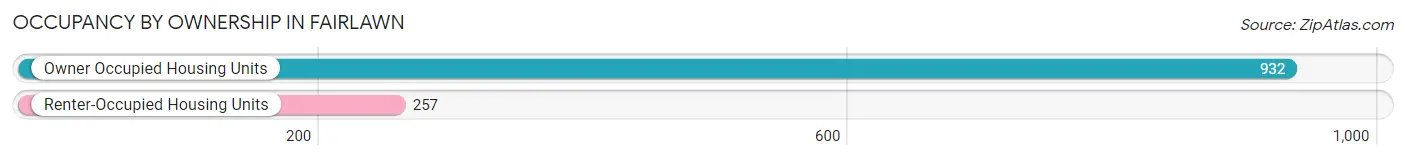
| Occupancy | # Housing Units | % Housing Units |
| Owner Occupied Housing Units | 932 | 78.4% |
| Renter-Occupied Housing Units | 257 | 21.6% |
| Total Occupied Housing Units | 1,189 | 100.0% |
Occupancy by Household Size in Fairlawn
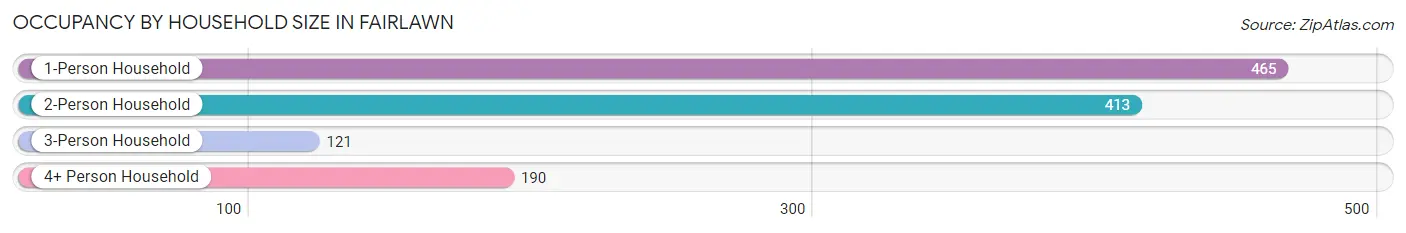
| Household Size | # Housing Units | % Housing Units |
| 1-Person Household | 465 | 39.1% |
| 2-Person Household | 413 | 34.7% |
| 3-Person Household | 121 | 10.2% |
| 4+ Person Household | 190 | 16.0% |
| Total Housing Units | 1,189 | 100.0% |
Occupancy by Ownership by Household Size in Fairlawn
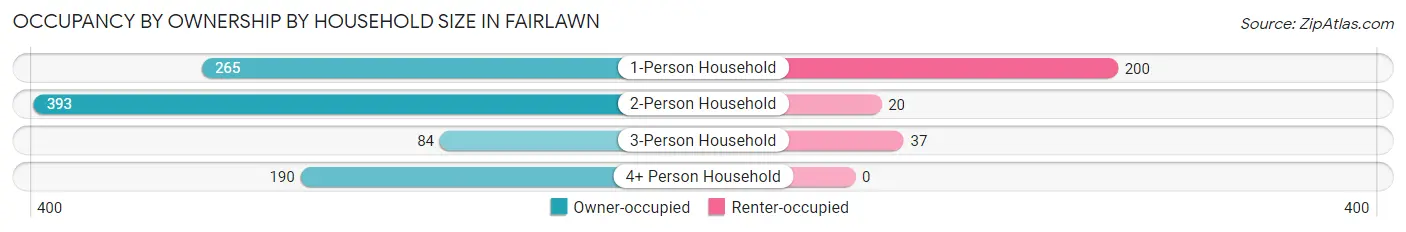
| Household Size | Owner-occupied | Renter-occupied |
| 1-Person Household | 265 (57.0%) | 200 (43.0%) |
| 2-Person Household | 393 (95.2%) | 20 (4.8%) |
| 3-Person Household | 84 (69.4%) | 37 (30.6%) |
| 4+ Person Household | 190 (100.0%) | 0 (0.0%) |
| Total Housing Units | 932 (78.4%) | 257 (21.6%) |
Occupancy by Educational Attainment in Fairlawn
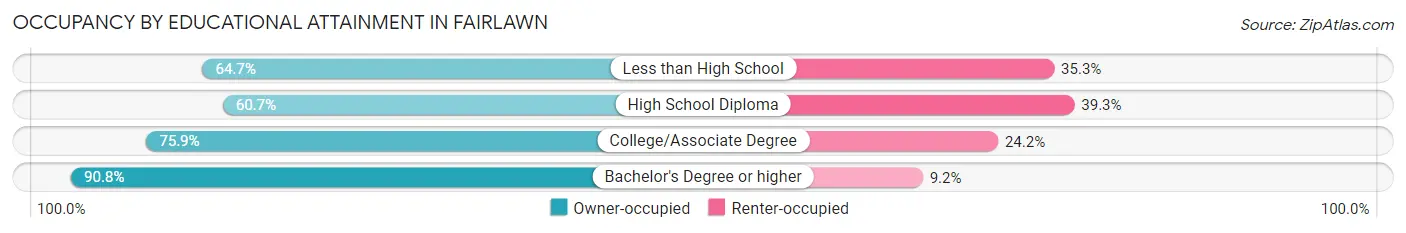
| Household Size | Owner-occupied | Renter-occupied |
| Less than High School | 44 (64.7%) | 24 (35.3%) |
| High School Diploma | 173 (60.7%) | 112 (39.3%) |
| College/Associate Degree | 223 (75.8%) | 71 (24.1%) |
| Bachelor's Degree or higher | 492 (90.8%) | 50 (9.2%) |
Occupancy by Age of Householder in Fairlawn
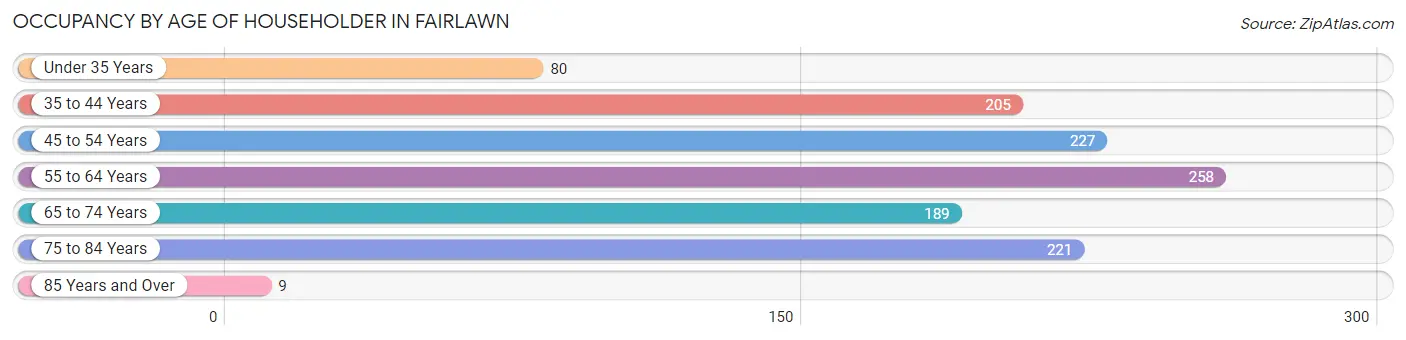
| Age Bracket | # Households | % Households |
| Under 35 Years | 80 | 6.7% |
| 35 to 44 Years | 205 | 17.2% |
| 45 to 54 Years | 227 | 19.1% |
| 55 to 64 Years | 258 | 21.7% |
| 65 to 74 Years | 189 | 15.9% |
| 75 to 84 Years | 221 | 18.6% |
| 85 Years and Over | 9 | 0.8% |
| Total | 1,189 | 100.0% |
Housing Finances in Fairlawn
Median Income by Occupancy in Fairlawn
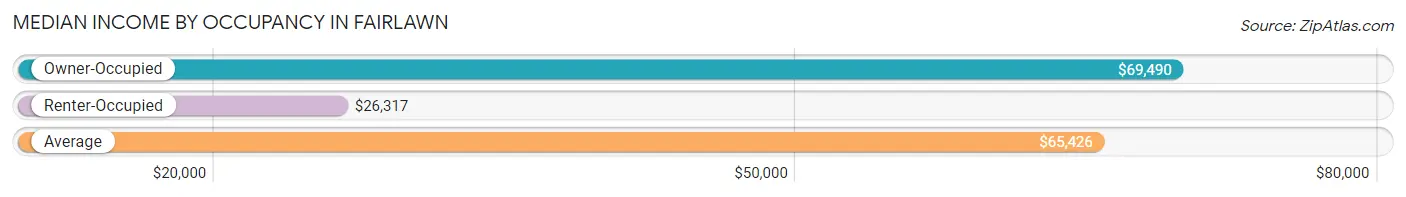
| Occupancy Type | # Households | Median Income |
| Owner-Occupied | 932 (78.4%) | $69,490 |
| Renter-Occupied | 257 (21.6%) | $26,317 |
| Average | 1,189 (100.0%) | $65,426 |
Occupancy by Householder Income Bracket in Fairlawn
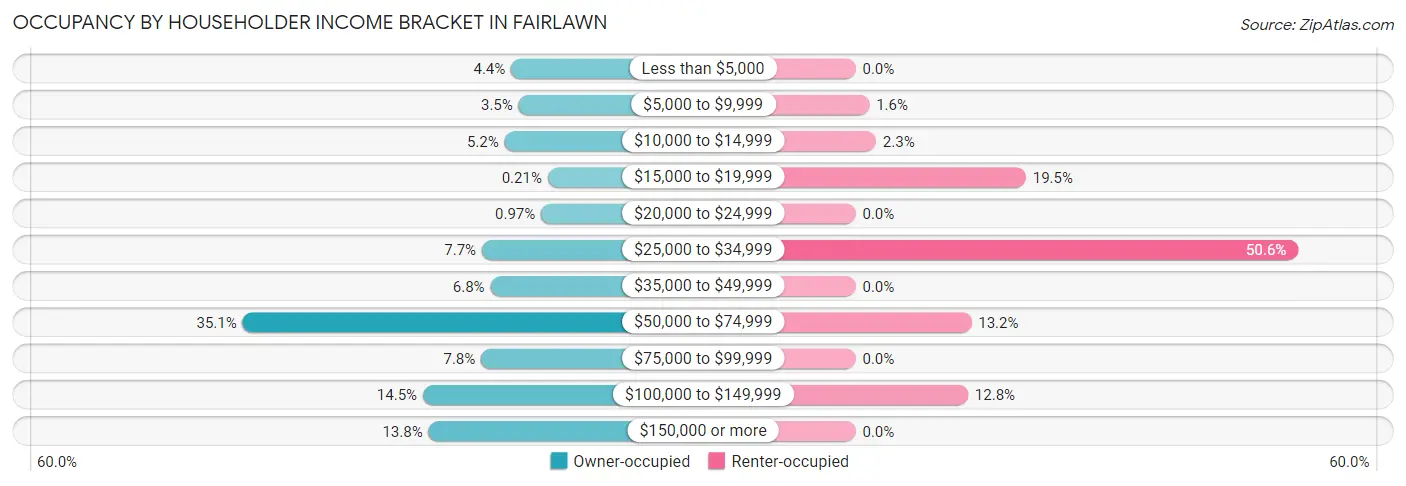
| Income Bracket | Owner-occupied | Renter-occupied |
| Less than $5,000 | 41 (4.4%) | 0 (0.0%) |
| $5,000 to $9,999 | 33 (3.5%) | 4 (1.6%) |
| $10,000 to $14,999 | 48 (5.1%) | 6 (2.3%) |
| $15,000 to $19,999 | 2 (0.2%) | 50 (19.5%) |
| $20,000 to $24,999 | 9 (1.0%) | 0 (0.0%) |
| $25,000 to $34,999 | 72 (7.7%) | 130 (50.6%) |
| $35,000 to $49,999 | 63 (6.8%) | 0 (0.0%) |
| $50,000 to $74,999 | 327 (35.1%) | 34 (13.2%) |
| $75,000 to $99,999 | 73 (7.8%) | 0 (0.0%) |
| $100,000 to $149,999 | 135 (14.5%) | 33 (12.8%) |
| $150,000 or more | 129 (13.8%) | 0 (0.0%) |
| Total | 932 (100.0%) | 257 (100.0%) |
Monthly Housing Cost Tiers in Fairlawn
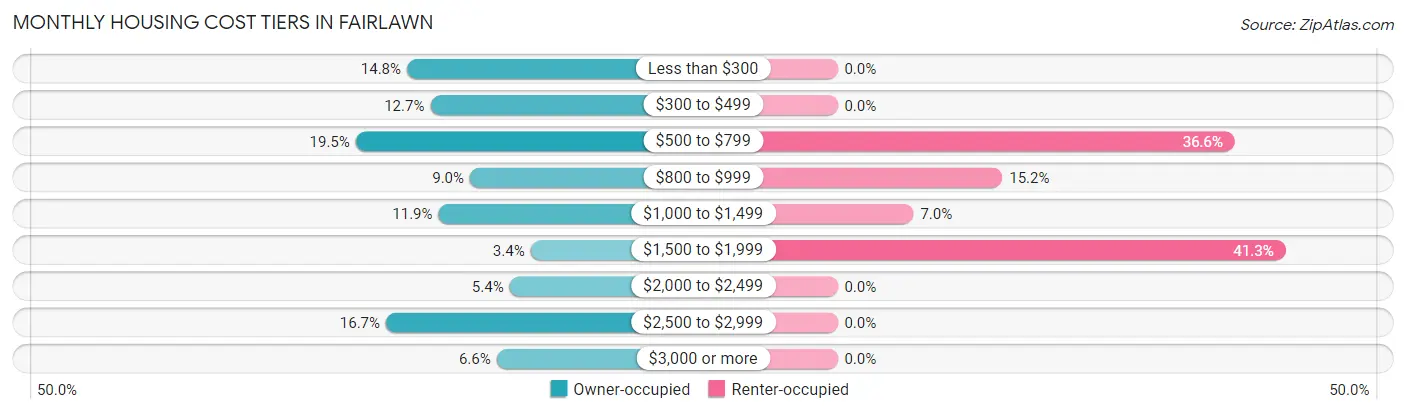
| Monthly Cost | Owner-occupied | Renter-occupied |
| Less than $300 | 138 (14.8%) | 0 (0.0%) |
| $300 to $499 | 118 (12.7%) | 0 (0.0%) |
| $500 to $799 | 182 (19.5%) | 94 (36.6%) |
| $800 to $999 | 84 (9.0%) | 39 (15.2%) |
| $1,000 to $1,499 | 111 (11.9%) | 18 (7.0%) |
| $1,500 to $1,999 | 32 (3.4%) | 106 (41.2%) |
| $2,000 to $2,499 | 50 (5.4%) | 0 (0.0%) |
| $2,500 to $2,999 | 156 (16.7%) | 0 (0.0%) |
| $3,000 or more | 61 (6.6%) | 0 (0.0%) |
| Total | 932 (100.0%) | 257 (100.0%) |
Physical Housing Characteristics in Fairlawn
Housing Structures in Fairlawn
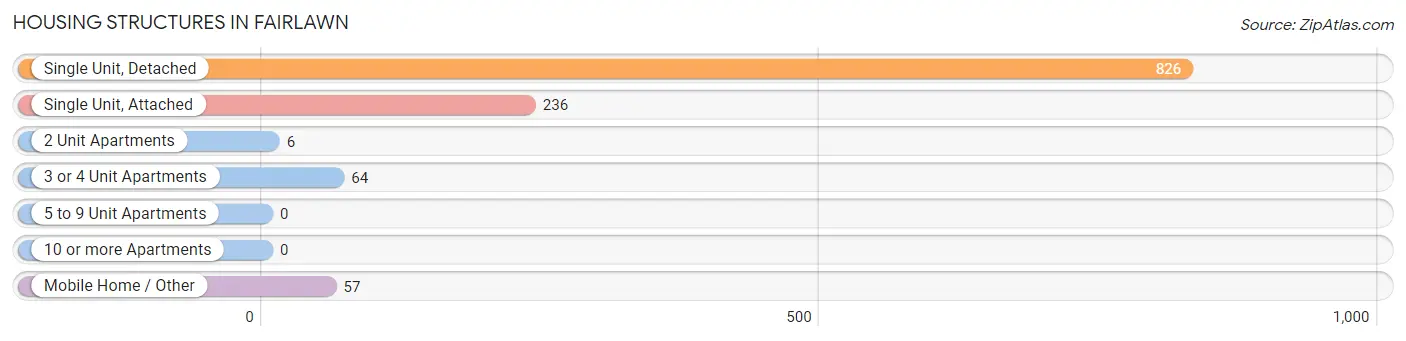
| Structure Type | # Housing Units | % Housing Units |
| Single Unit, Detached | 826 | 69.5% |
| Single Unit, Attached | 236 | 19.9% |
| 2 Unit Apartments | 6 | 0.5% |
| 3 or 4 Unit Apartments | 64 | 5.4% |
| 5 to 9 Unit Apartments | 0 | 0.0% |
| 10 or more Apartments | 0 | 0.0% |
| Mobile Home / Other | 57 | 4.8% |
| Total | 1,189 | 100.0% |
Housing Structures by Occupancy in Fairlawn
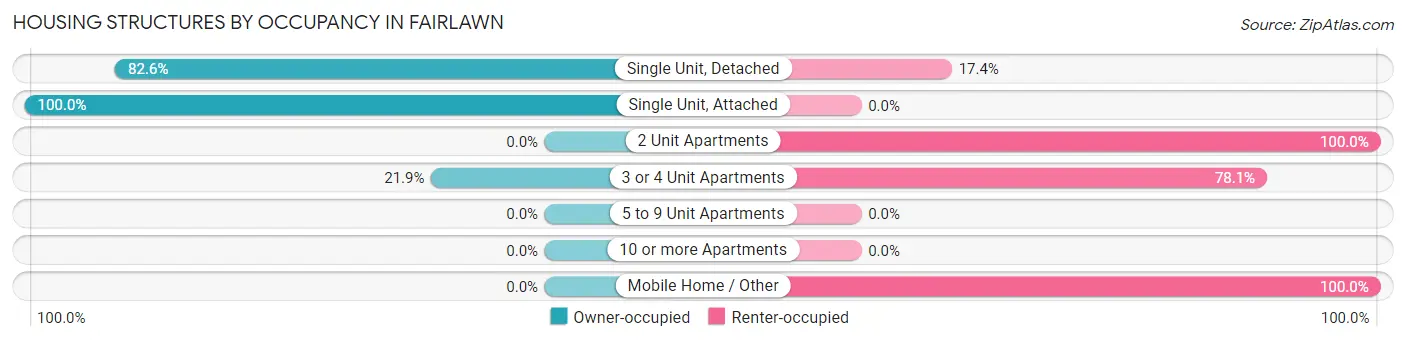
| Structure Type | Owner-occupied | Renter-occupied |
| Single Unit, Detached | 682 (82.6%) | 144 (17.4%) |
| Single Unit, Attached | 236 (100.0%) | 0 (0.0%) |
| 2 Unit Apartments | 0 (0.0%) | 6 (100.0%) |
| 3 or 4 Unit Apartments | 14 (21.9%) | 50 (78.1%) |
| 5 to 9 Unit Apartments | 0 (0.0%) | 0 (0.0%) |
| 10 or more Apartments | 0 (0.0%) | 0 (0.0%) |
| Mobile Home / Other | 0 (0.0%) | 57 (100.0%) |
| Total | 932 (78.4%) | 257 (21.6%) |
Housing Structures by Number of Rooms in Fairlawn
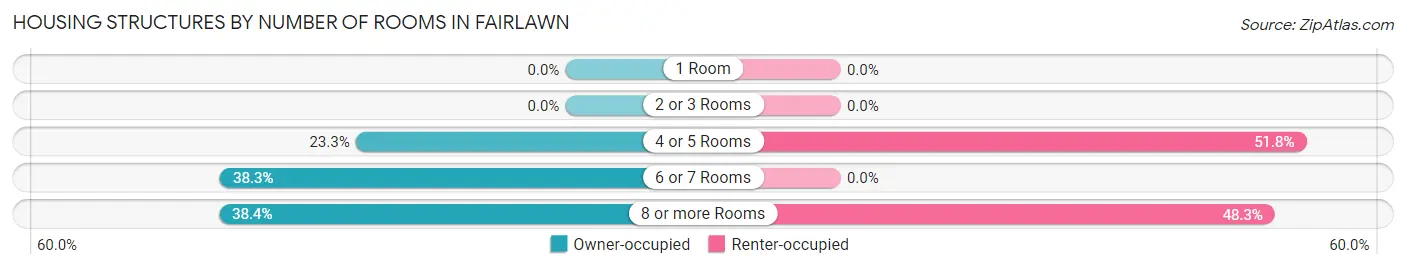
| Number of Rooms | Owner-occupied | Renter-occupied |
| 1 Room | 0 (0.0%) | 0 (0.0%) |
| 2 or 3 Rooms | 0 (0.0%) | 0 (0.0%) |
| 4 or 5 Rooms | 217 (23.3%) | 133 (51.7%) |
| 6 or 7 Rooms | 357 (38.3%) | 0 (0.0%) |
| 8 or more Rooms | 358 (38.4%) | 124 (48.2%) |
| Total | 932 (100.0%) | 257 (100.0%) |
Housing Structure by Heating Type in Fairlawn
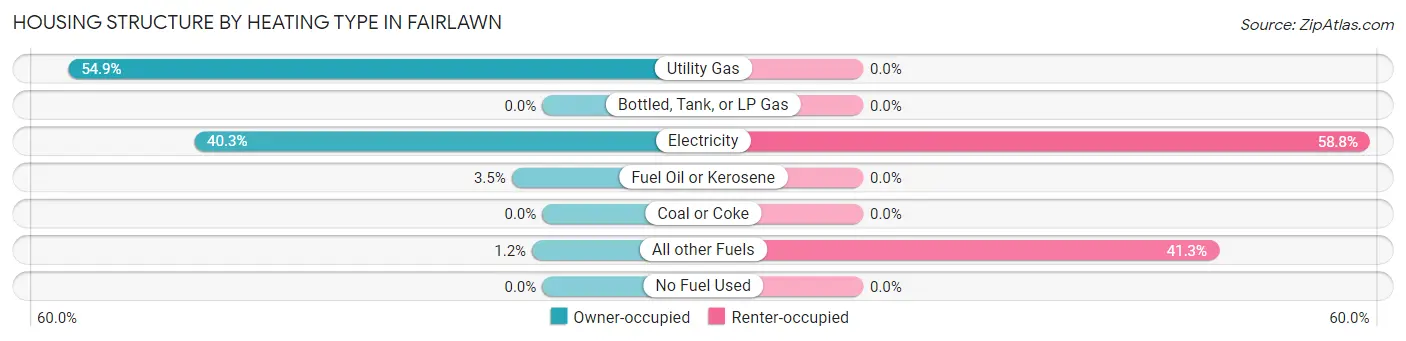
| Heating Type | Owner-occupied | Renter-occupied |
| Utility Gas | 512 (54.9%) | 0 (0.0%) |
| Bottled, Tank, or LP Gas | 0 (0.0%) | 0 (0.0%) |
| Electricity | 376 (40.3%) | 151 (58.8%) |
| Fuel Oil or Kerosene | 33 (3.5%) | 0 (0.0%) |
| Coal or Coke | 0 (0.0%) | 0 (0.0%) |
| All other Fuels | 11 (1.2%) | 106 (41.2%) |
| No Fuel Used | 0 (0.0%) | 0 (0.0%) |
| Total | 932 (100.0%) | 257 (100.0%) |
Household Vehicle Usage in Fairlawn
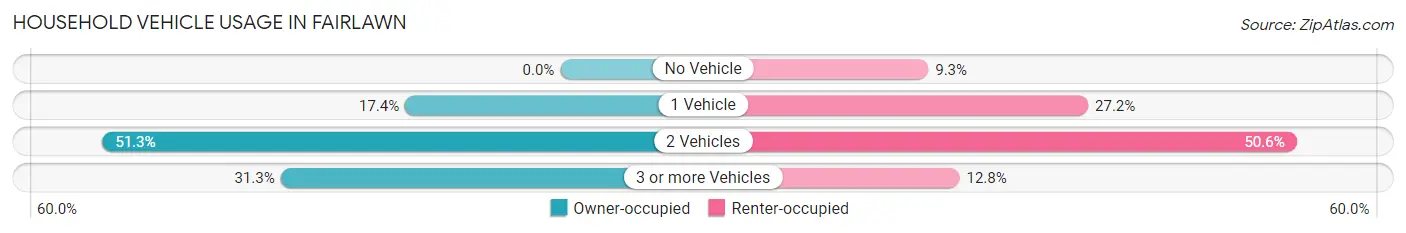
| Vehicles per Household | Owner-occupied | Renter-occupied |
| No Vehicle | 0 (0.0%) | 24 (9.3%) |
| 1 Vehicle | 162 (17.4%) | 70 (27.2%) |
| 2 Vehicles | 478 (51.3%) | 130 (50.6%) |
| 3 or more Vehicles | 292 (31.3%) | 33 (12.8%) |
| Total | 932 (100.0%) | 257 (100.0%) |
Real Estate & Mortgages in Fairlawn
Real Estate and Mortgage Overview in Fairlawn
| Characteristic | Without Mortgage | With Mortgage |
| Housing Units | 440 | 492 |
| Median Property Value | $168,200 | $339,800 |
| Median Household Income | $57,750 | $120 |
| Monthly Housing Costs | $416 | $61 |
| Real Estate Taxes | $1,632 | $0 |
Property Value by Mortgage Status in Fairlawn
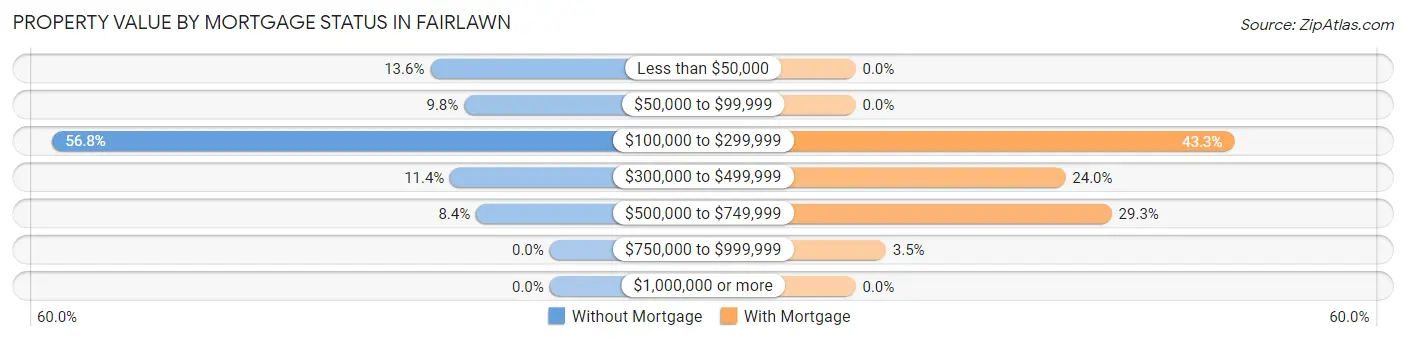
| Property Value | Without Mortgage | With Mortgage |
| Less than $50,000 | 60 (13.6%) | 0 (0.0%) |
| $50,000 to $99,999 | 43 (9.8%) | 0 (0.0%) |
| $100,000 to $299,999 | 250 (56.8%) | 213 (43.3%) |
| $300,000 to $499,999 | 50 (11.4%) | 118 (24.0%) |
| $500,000 to $749,999 | 37 (8.4%) | 144 (29.3%) |
| $750,000 to $999,999 | 0 (0.0%) | 17 (3.5%) |
| $1,000,000 or more | 0 (0.0%) | 0 (0.0%) |
| Total | 440 (100.0%) | 492 (100.0%) |
Household Income by Mortgage Status in Fairlawn
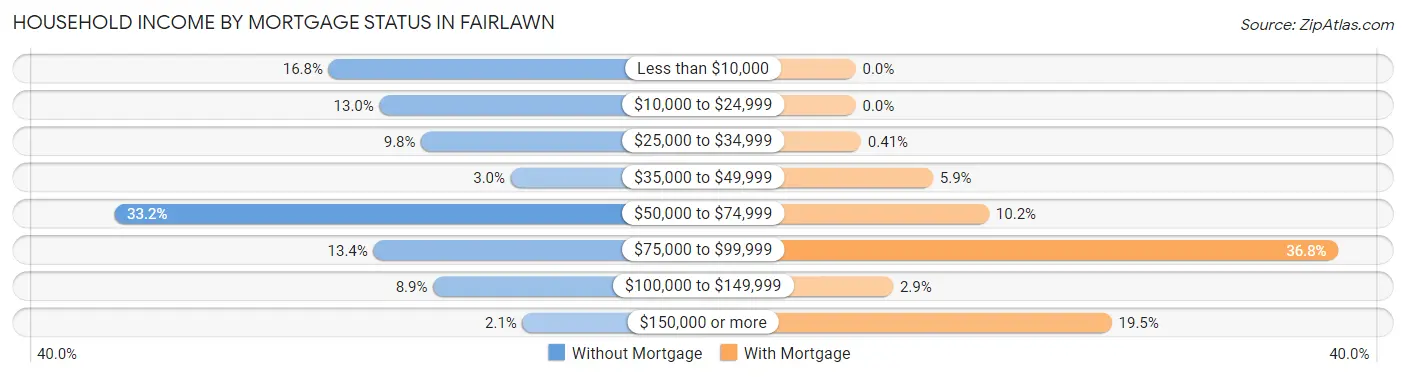
| Household Income | Without Mortgage | With Mortgage |
| Less than $10,000 | 74 (16.8%) | 0 (0.0%) |
| $10,000 to $24,999 | 57 (13.0%) | 0 (0.0%) |
| $25,000 to $34,999 | 43 (9.8%) | 2 (0.4%) |
| $35,000 to $49,999 | 13 (2.9%) | 29 (5.9%) |
| $50,000 to $74,999 | 146 (33.2%) | 50 (10.2%) |
| $75,000 to $99,999 | 59 (13.4%) | 181 (36.8%) |
| $100,000 to $149,999 | 39 (8.9%) | 14 (2.9%) |
| $150,000 or more | 9 (2.1%) | 96 (19.5%) |
| Total | 440 (100.0%) | 492 (100.0%) |
Property Value to Household Income Ratio in Fairlawn
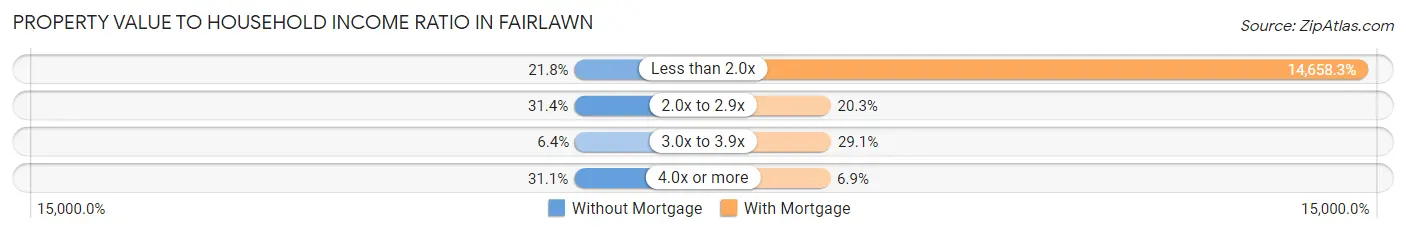
| Value-to-Income Ratio | Without Mortgage | With Mortgage |
| Less than 2.0x | 96 (21.8%) | 72,119 (14,658.3%) |
| 2.0x to 2.9x | 138 (31.4%) | 100 (20.3%) |
| 3.0x to 3.9x | 28 (6.4%) | 143 (29.1%) |
| 4.0x or more | 137 (31.1%) | 34 (6.9%) |
| Total | 440 (100.0%) | 492 (100.0%) |
Real Estate Taxes by Mortgage Status in Fairlawn
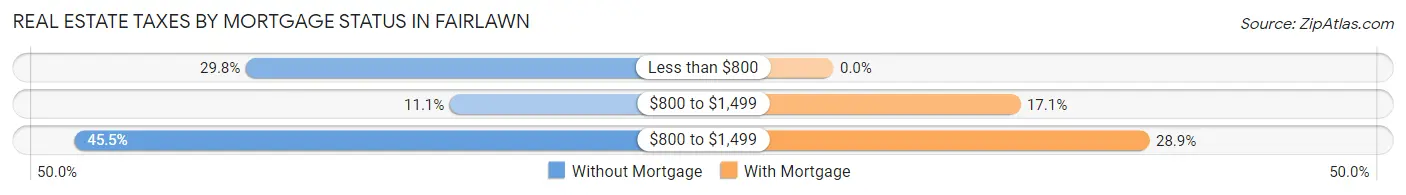
| Property Taxes | Without Mortgage | With Mortgage |
| Less than $800 | 131 (29.8%) | 0 (0.0%) |
| $800 to $1,499 | 49 (11.1%) | 84 (17.1%) |
| $800 to $1,499 | 200 (45.5%) | 142 (28.9%) |
| Total | 440 (100.0%) | 492 (100.0%) |
Health & Disability in Fairlawn
Health Insurance Coverage by Age in Fairlawn
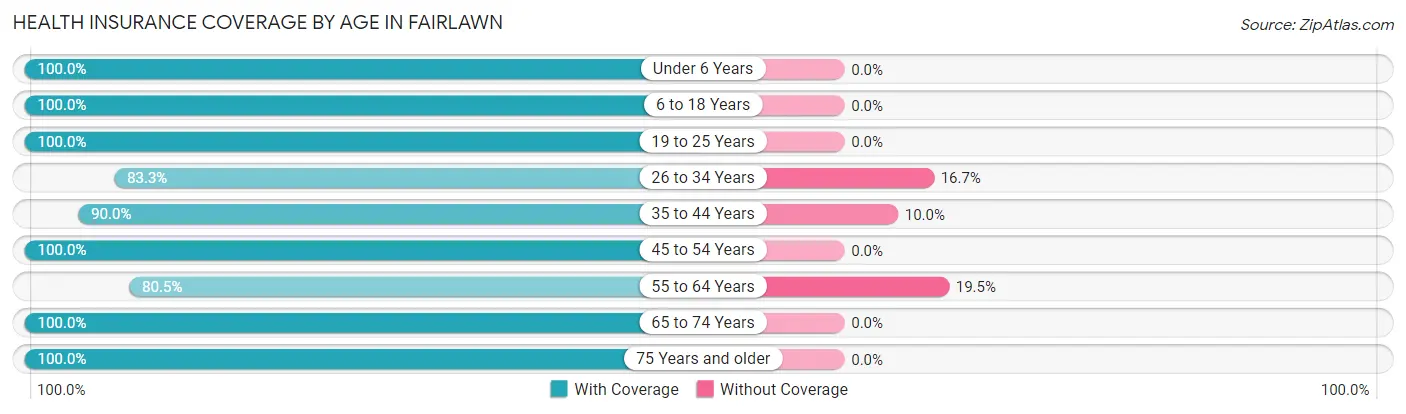
| Age Bracket | With Coverage | Without Coverage |
| Under 6 Years | 72 (100.0%) | 0 (0.0%) |
| 6 to 18 Years | 392 (100.0%) | 0 (0.0%) |
| 19 to 25 Years | 127 (100.0%) | 0 (0.0%) |
| 26 to 34 Years | 125 (83.3%) | 25 (16.7%) |
| 35 to 44 Years | 298 (90.0%) | 33 (10.0%) |
| 45 to 54 Years | 337 (100.0%) | 0 (0.0%) |
| 55 to 64 Years | 277 (80.5%) | 67 (19.5%) |
| 65 to 74 Years | 267 (100.0%) | 0 (0.0%) |
| 75 Years and older | 380 (100.0%) | 0 (0.0%) |
| Total | 2,275 (94.8%) | 125 (5.2%) |
Health Insurance Coverage by Citizenship Status in Fairlawn
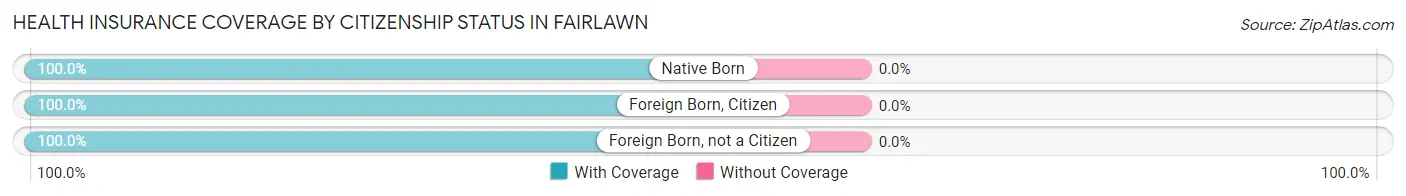
| Citizenship Status | With Coverage | Without Coverage |
| Native Born | 72 (100.0%) | 0 (0.0%) |
| Foreign Born, Citizen | 392 (100.0%) | 0 (0.0%) |
| Foreign Born, not a Citizen | 127 (100.0%) | 0 (0.0%) |
Health Insurance Coverage by Household Income in Fairlawn
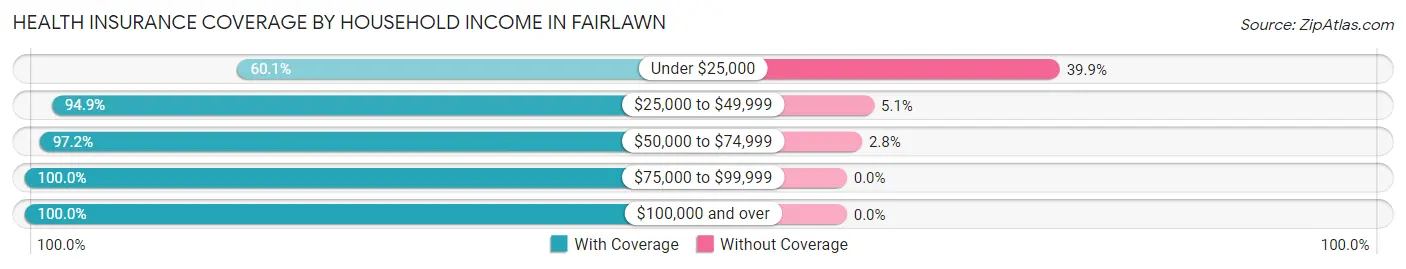
| Household Income | With Coverage | Without Coverage |
| Under $25,000 | 125 (60.1%) | 83 (39.9%) |
| $25,000 to $49,999 | 315 (94.9%) | 17 (5.1%) |
| $50,000 to $74,999 | 856 (97.2%) | 25 (2.8%) |
| $75,000 to $99,999 | 180 (100.0%) | 0 (0.0%) |
| $100,000 and over | 798 (100.0%) | 0 (0.0%) |
Public vs Private Health Insurance Coverage by Age in Fairlawn
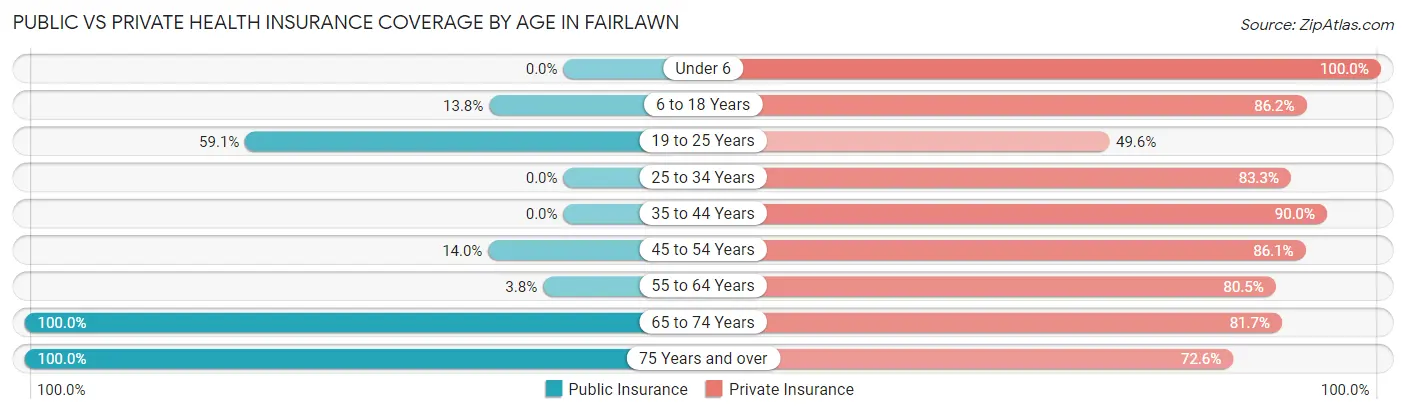
| Age Bracket | Public Insurance | Private Insurance |
| Under 6 | 0 (0.0%) | 72 (100.0%) |
| 6 to 18 Years | 54 (13.8%) | 338 (86.2%) |
| 19 to 25 Years | 75 (59.1%) | 63 (49.6%) |
| 25 to 34 Years | 0 (0.0%) | 125 (83.3%) |
| 35 to 44 Years | 0 (0.0%) | 298 (90.0%) |
| 45 to 54 Years | 47 (14.0%) | 290 (86.1%) |
| 55 to 64 Years | 13 (3.8%) | 277 (80.5%) |
| 65 to 74 Years | 267 (100.0%) | 218 (81.7%) |
| 75 Years and over | 380 (100.0%) | 276 (72.6%) |
| Total | 836 (34.8%) | 1,957 (81.5%) |
Disability Status by Sex by Age in Fairlawn
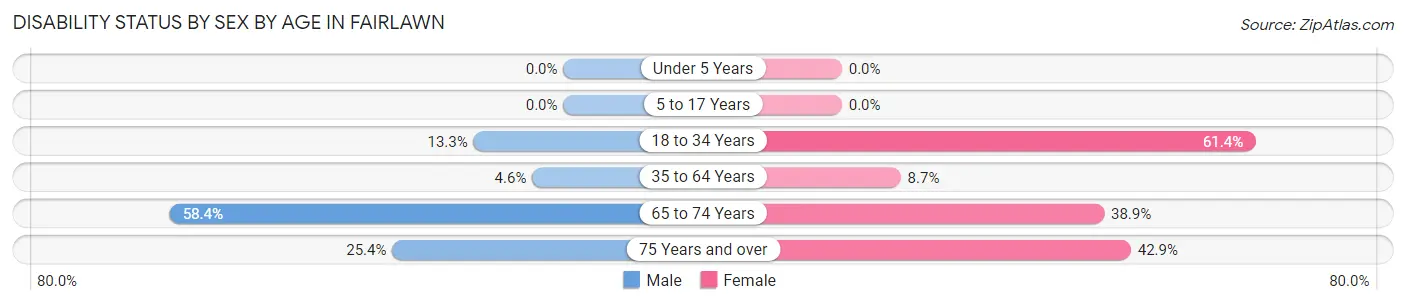
| Age Bracket | Male | Female |
| Under 5 Years | 0 (0.0%) | 0 (0.0%) |
| 5 to 17 Years | 0 (0.0%) | 0 (0.0%) |
| 18 to 34 Years | 20 (13.3%) | 100 (61.4%) |
| 35 to 64 Years | 24 (4.6%) | 43 (8.7%) |
| 65 to 74 Years | 90 (58.4%) | 44 (38.9%) |
| 75 Years and over | 32 (25.4%) | 109 (42.9%) |
Disability Class by Sex by Age in Fairlawn
Disability Class: Hearing Difficulty
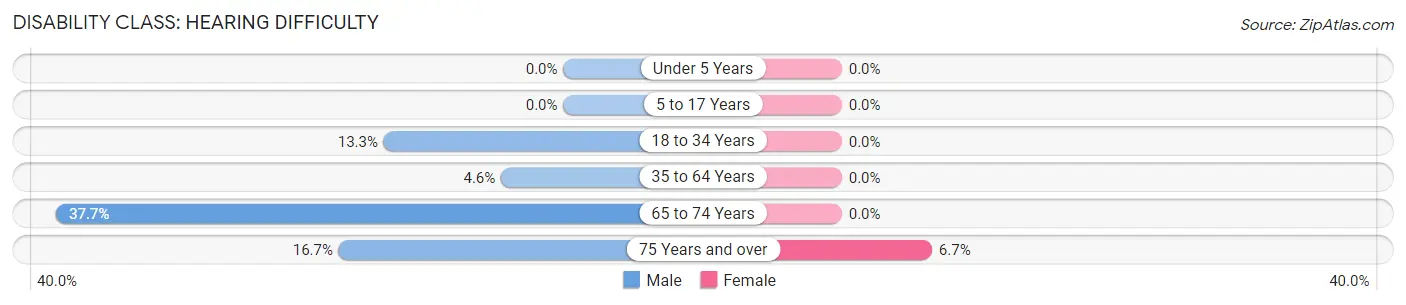
| Age Bracket | Male | Female |
| Under 5 Years | 0 (0.0%) | 0 (0.0%) |
| 5 to 17 Years | 0 (0.0%) | 0 (0.0%) |
| 18 to 34 Years | 20 (13.3%) | 0 (0.0%) |
| 35 to 64 Years | 24 (4.6%) | 0 (0.0%) |
| 65 to 74 Years | 58 (37.7%) | 0 (0.0%) |
| 75 Years and over | 21 (16.7%) | 17 (6.7%) |
Disability Class: Vision Difficulty
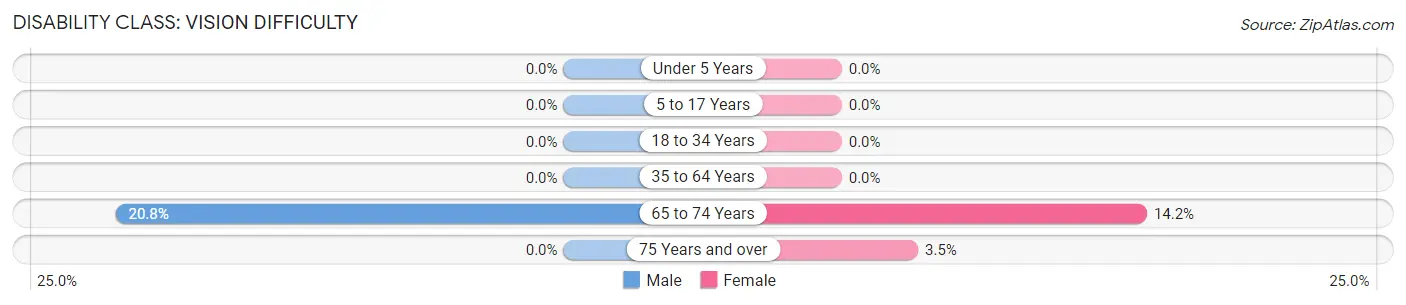
| Age Bracket | Male | Female |
| Under 5 Years | 0 (0.0%) | 0 (0.0%) |
| 5 to 17 Years | 0 (0.0%) | 0 (0.0%) |
| 18 to 34 Years | 0 (0.0%) | 0 (0.0%) |
| 35 to 64 Years | 0 (0.0%) | 0 (0.0%) |
| 65 to 74 Years | 32 (20.8%) | 16 (14.2%) |
| 75 Years and over | 0 (0.0%) | 9 (3.5%) |
Disability Class: Cognitive Difficulty
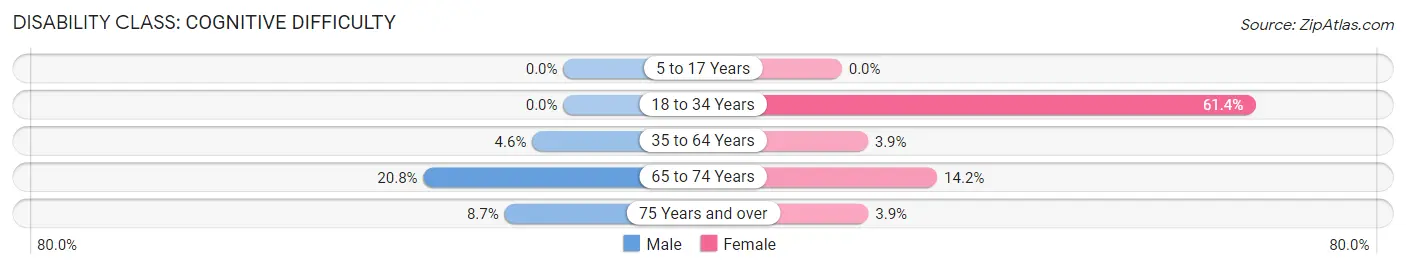
| Age Bracket | Male | Female |
| 5 to 17 Years | 0 (0.0%) | 0 (0.0%) |
| 18 to 34 Years | 0 (0.0%) | 100 (61.4%) |
| 35 to 64 Years | 24 (4.6%) | 19 (3.9%) |
| 65 to 74 Years | 32 (20.8%) | 16 (14.2%) |
| 75 Years and over | 11 (8.7%) | 10 (3.9%) |
Disability Class: Ambulatory Difficulty
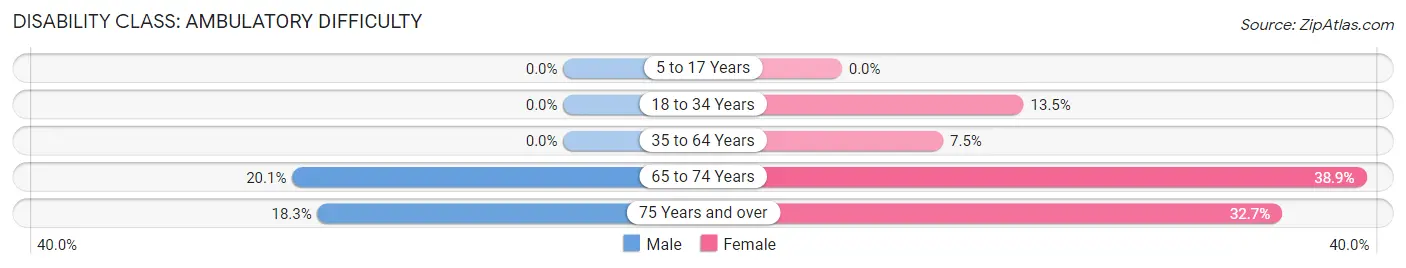
| Age Bracket | Male | Female |
| 5 to 17 Years | 0 (0.0%) | 0 (0.0%) |
| 18 to 34 Years | 0 (0.0%) | 22 (13.5%) |
| 35 to 64 Years | 0 (0.0%) | 37 (7.5%) |
| 65 to 74 Years | 31 (20.1%) | 44 (38.9%) |
| 75 Years and over | 23 (18.2%) | 83 (32.7%) |
Disability Class: Self-Care Difficulty
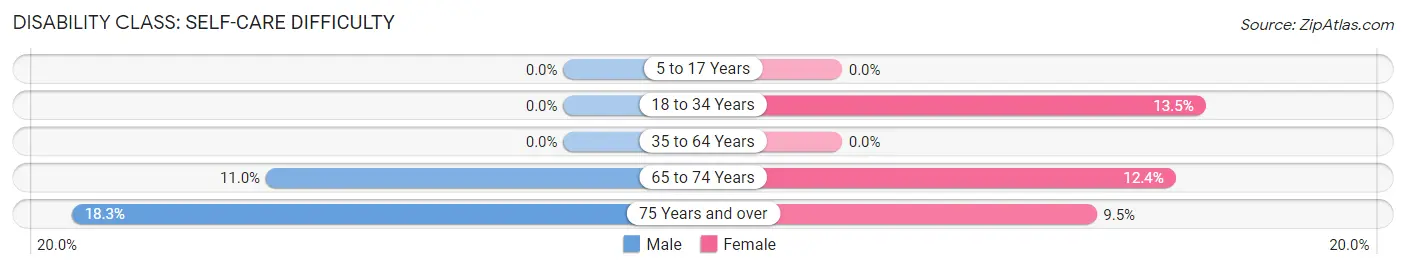
| Age Bracket | Male | Female |
| 5 to 17 Years | 0 (0.0%) | 0 (0.0%) |
| 18 to 34 Years | 0 (0.0%) | 22 (13.5%) |
| 35 to 64 Years | 0 (0.0%) | 0 (0.0%) |
| 65 to 74 Years | 17 (11.0%) | 14 (12.4%) |
| 75 Years and over | 23 (18.2%) | 24 (9.5%) |
Technology Access in Fairlawn
Computing Device Access in Fairlawn
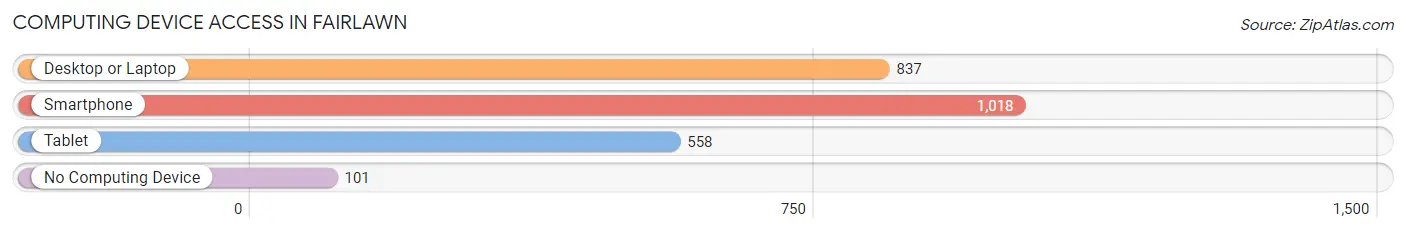
| Device Type | # Households | % Households |
| Desktop or Laptop | 837 | 70.4% |
| Smartphone | 1,018 | 85.6% |
| Tablet | 558 | 46.9% |
| No Computing Device | 101 | 8.5% |
| Total | 1,189 | 100.0% |
Internet Access in Fairlawn
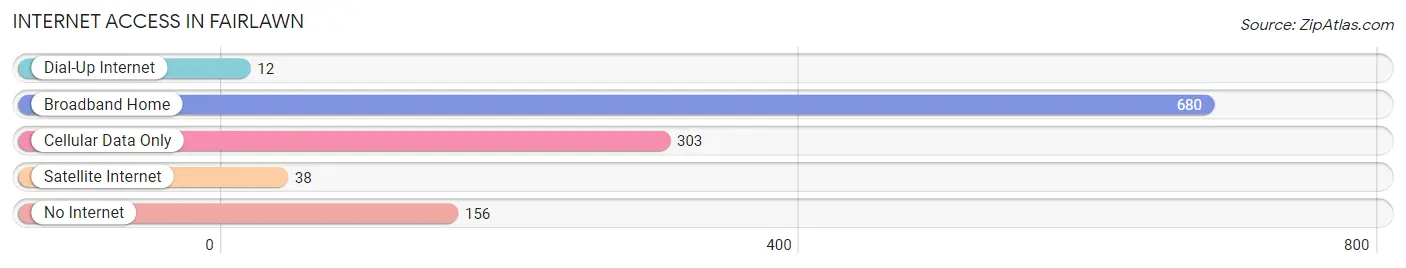
| Internet Type | # Households | % Households |
| Dial-Up Internet | 12 | 1.0% |
| Broadband Home | 680 | 57.2% |
| Cellular Data Only | 303 | 25.5% |
| Satellite Internet | 38 | 3.2% |
| No Internet | 156 | 13.1% |
| Total | 1,189 | 100.0% |
Fairlawn Summary
Fairlawn, Virginia is a small town located in the Shenandoah Valley of Virginia. It is situated in the northern part of the state, about 25 miles south of Winchester and about 50 miles west of Washington, D.C. The town is part of the Winchester, Virginia Metropolitan Statistical Area.
History
Fairlawn was first settled in the late 1700s by a group of German immigrants. The town was originally known as “Fairlawn” due to the abundance of wildflowers that grew in the area. The town was officially incorporated in 1891.
In the early 1900s, Fairlawn was a thriving agricultural community. The town was home to several farms, a general store, a post office, and a blacksmith shop. The town also had a school, a church, and a few other businesses.
In the 1950s, the town began to experience a decline in population as many of the residents moved away in search of better job opportunities. By the 1970s, the town had become a virtual ghost town.
In the 1980s, the town began to experience a resurgence in population as people began to move back to the area. The town has since become a popular destination for tourists and retirees.
Geography
Fairlawn is located in the northern part of Virginia in the Shenandoah Valley. The town is situated at the intersection of US Route 11 and State Route 645. The town is surrounded by the Blue Ridge Mountains to the east and the Allegheny Mountains to the west.
The town is located in a rural area and is surrounded by farmland. The town is also located near several state parks, including Shenandoah National Park and George Washington National Forest.
Economy
The economy of Fairlawn is largely based on tourism and agriculture. The town is home to several farms, which produce a variety of crops, including corn, soybeans, and hay. The town is also home to several wineries, which produce a variety of wines.
The town is also home to several small businesses, including restaurants, antique stores, and gift shops. The town is also home to several bed and breakfasts, which attract tourists from all over the world.
Demographics
As of the 2010 census, the population of Fairlawn was 1,845. The town has a median household income of $45,000 and a median age of 44. The town is predominantly white (94.3%) and the majority of the population is Christian (90.3%).
Conclusion
Fairlawn, Virginia is a small town located in the Shenandoah Valley of Virginia. The town has a rich history and is home to several farms, wineries, and small businesses. The town is also a popular destination for tourists and retirees. The town has a predominantly white population and a median household income of $45,000.
Common Questions
What is Per Capita Income in Fairlawn?
Per Capita income in Fairlawn is $40,038.
What is the Median Family Income in Fairlawn?
Median Family Income in Fairlawn is $79,545.
What is the Median Household income in Fairlawn?
Median Household Income in Fairlawn is $65,426.
What is Income or Wage Gap in Fairlawn?
Income or Wage Gap in Fairlawn is 28.0%.
Women in Fairlawn earn 72.0 cents for every dollar earned by a man.
What is Inequality or Gini Index in Fairlawn?
Inequality or Gini Index in Fairlawn is 0.49.
What is the Total Population of Fairlawn?
Total Population of Fairlawn is 2,400.
What is the Total Male Population of Fairlawn?
Total Male Population of Fairlawn is 1,179.
What is the Total Female Population of Fairlawn?
Total Female Population of Fairlawn is 1,221.
What is the Ratio of Males per 100 Females in Fairlawn?
There are 96.56 Males per 100 Females in Fairlawn.
What is the Ratio of Females per 100 Males in Fairlawn?
There are 103.56 Females per 100 Males in Fairlawn.
What is the Median Population Age in Fairlawn?
Median Population Age in Fairlawn is 49.8 Years.
What is the Average Family Size in Fairlawn
Average Family Size in Fairlawn is 2.7 People.
What is the Average Household Size in Fairlawn
Average Household Size in Fairlawn is 2.0 People.
How Large is the Labor Force in Fairlawn?
There are 1,075 People in the Labor Forcein in Fairlawn.
What is the Percentage of People in the Labor Force in Fairlawn?
54.5% of People are in the Labor Force in Fairlawn.
What is the Unemployment Rate in Fairlawn?
Unemployment Rate in Fairlawn is 3.2%.