Zip Codes with the Highest Percentage of Population Employed in Legal Services & Support in Roanoke, VA
RELATED REPORTS & OPTIONS
Legal Services & Support
Roanoke
Compare Zip Codes
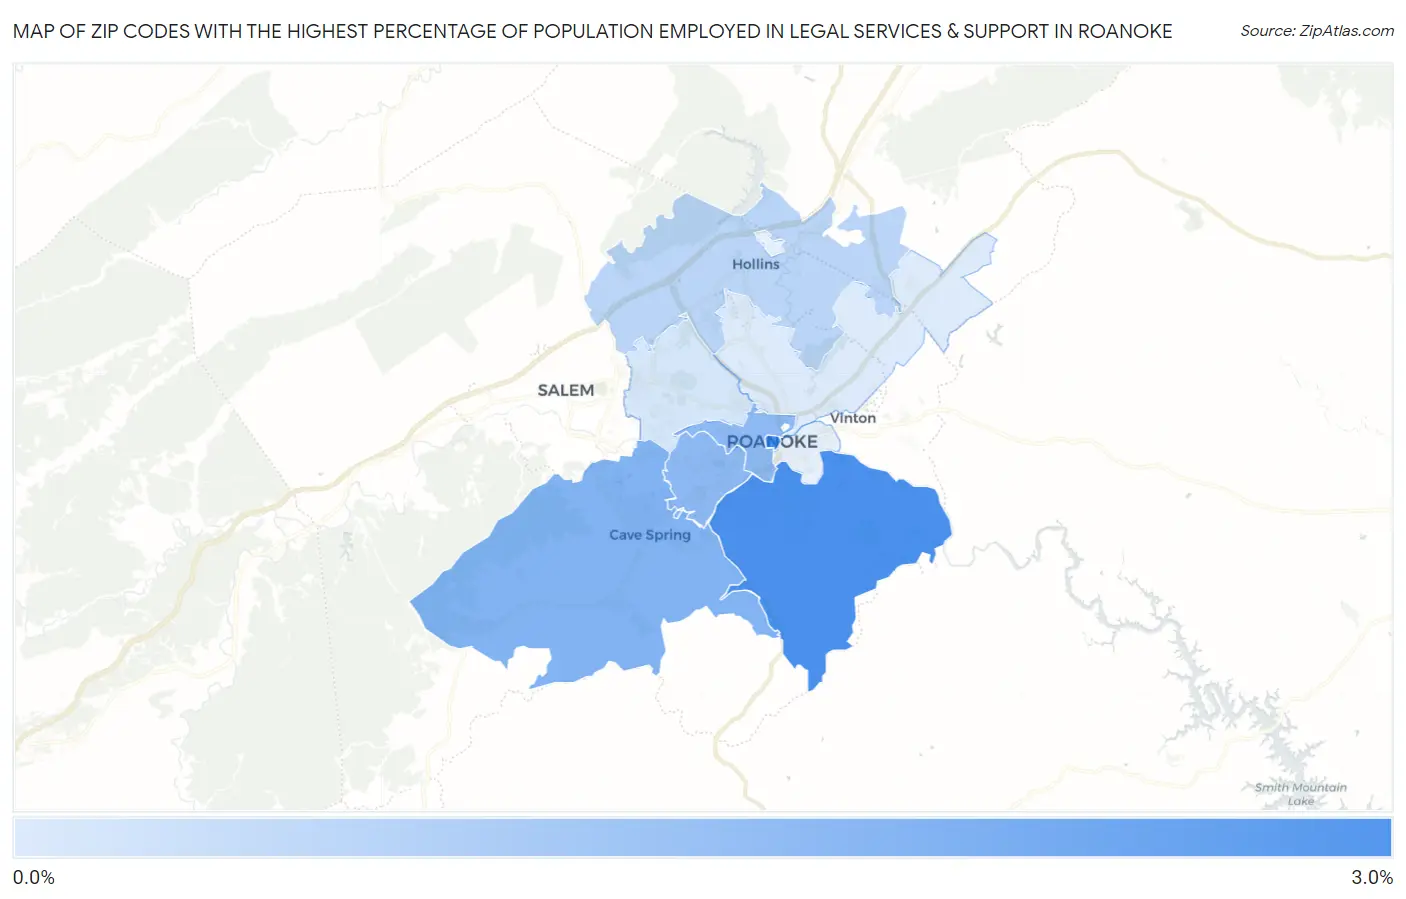
Map of Zip Codes with the Highest Percentage of Population Employed in Legal Services & Support in Roanoke
0.37%
2.9%
Zip Codes with the Highest Percentage of Population Employed in Legal Services & Support in Roanoke, VA
| Zip Code | % Employed | vs State | vs National | |
| 1. | 24011 | 2.9% | 1.6%(+1.25)#85 | 1.2%(+1.69)#1,997 |
| 2. | 24014 | 2.8% | 1.6%(+1.21)#87 | 1.2%(+1.64)#2,044 |
| 3. | 24018 | 1.9% | 1.6%(+0.278)#137 | 1.2%(+0.717)#3,733 |
| 4. | 24015 | 1.7% | 1.6%(+0.098)#153 | 1.2%(+0.537)#4,248 |
| 5. | 24016 | 1.7% | 1.6%(+0.035)#164 | 1.2%(+0.473)#4,470 |
| 6. | 24019 | 0.95% | 1.6%(-0.671)#261 | 1.2%(-0.233)#8,207 |
| 7. | 24017 | 0.48% | 1.6%(-1.14)#364 | 1.2%(-0.703)#12,867 |
| 8. | 24012 | 0.37% | 1.6%(-1.25)#392 | 1.2%(-0.815)#14,219 |
1
Common Questions
What are the Top 5 Zip Codes with the Highest Percentage of Population Employed in Legal Services & Support in Roanoke, VA?
Top 5 Zip Codes with the Highest Percentage of Population Employed in Legal Services & Support in Roanoke, VA are:
What zip code has the Highest Percentage of Population Employed in Legal Services & Support in Roanoke, VA?
24011 has the Highest Percentage of Population Employed in Legal Services & Support in Roanoke, VA with 2.9%.
What is the Percentage of Population Employed in Legal Services & Support in Roanoke, VA?
Percentage of Population Employed in Legal Services & Support in Roanoke is 1.2%.
What is the Percentage of Population Employed in Legal Services & Support in Virginia?
Percentage of Population Employed in Legal Services & Support in Virginia is 1.6%.
What is the Percentage of Population Employed in Legal Services & Support in the United States?
Percentage of Population Employed in Legal Services & Support in the United States is 1.2%.