Seven Corners, VA Map & Demographics
Seven Corners Map
Seven Corners Overview
$35,780
PER CAPITA INCOME
$57,479
AVG FAMILY INCOME
$63,625
AVG HOUSEHOLD INCOME
26.4%
WAGE / INCOME GAP [ % ]
73.6¢/ $1
WAGE / INCOME GAP [ $ ]
0.47
INEQUALITY / GINI INDEX
9,141
TOTAL POPULATION
4,668
MALE POPULATION
4,473
FEMALE POPULATION
104.36
MALES / 100 FEMALES
95.82
FEMALES / 100 MALES
34.4
MEDIAN AGE
3.4
AVG FAMILY SIZE
2.5
AVG HOUSEHOLD SIZE
4,777
LABOR FORCE [ PEOPLE ]
66.5%
PERCENT IN LABOR FORCE
8.3%
UNEMPLOYMENT RATE
Seven Corners Area Codes
Income in Seven Corners
Income Overview in Seven Corners
Per Capita Income in Seven Corners is $35,780, while median incomes of families and households are $57,479 and $63,625 respectively.
| Characteristic | Number | Measure |
| Per Capita Income | 9,141 | $35,780 |
| Median Family Income | 2,053 | $57,479 |
| Mean Family Income | 2,053 | $99,740 |
| Median Household Income | 3,577 | $63,625 |
| Mean Household Income | 3,577 | $89,247 |
| Income Deficit | 2,053 | $0 |
| Wage / Income Gap (%) | 9,141 | 26.35% |
| Wage / Income Gap ($) | 9,141 | 73.65¢ per $1 |
| Gini / Inequality Index | 9,141 | 0.47 |
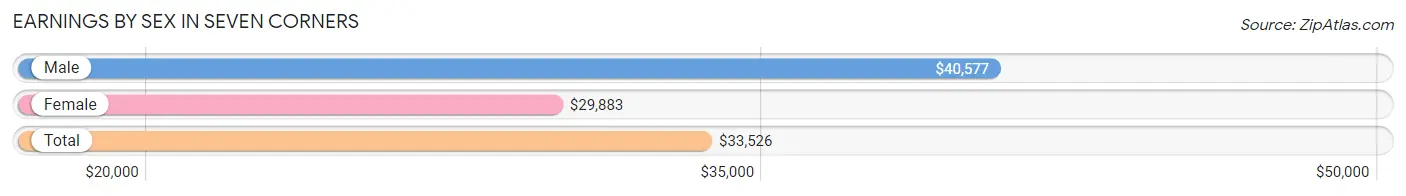
Earnings by Sex in Seven Corners
Average Earnings in Seven Corners are $33,526, $40,577 for men and $29,883 for women, a difference of 26.4%.
| Sex | Number | Average Earnings |
| Male | 2,866 (58.0%) | $40,577 |
| Female | 2,077 (42.0%) | $29,883 |
| Total | 4,943 (100.0%) | $33,526 |
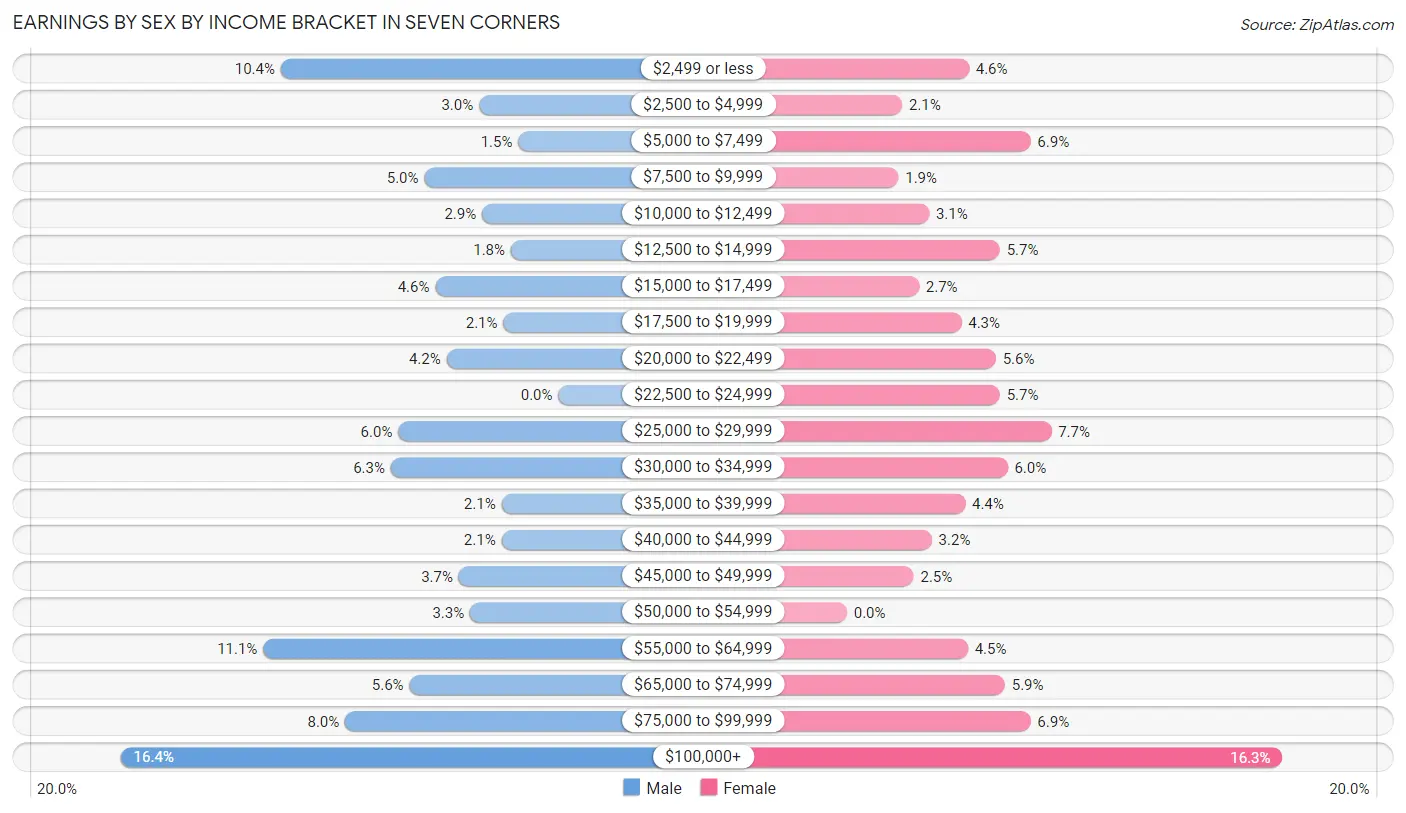
Earnings by Sex by Income Bracket in Seven Corners
The most common earnings brackets in Seven Corners are $100,000+ for men (470 | 16.4%) and $100,000+ for women (339 | 16.3%).
| Income | Male | Female |
| $2,499 or less | 298 (10.4%) | 95 (4.6%) |
| $2,500 to $4,999 | 85 (3.0%) | 43 (2.1%) |
| $5,000 to $7,499 | 43 (1.5%) | 143 (6.9%) |
| $7,500 to $9,999 | 144 (5.0%) | 40 (1.9%) |
| $10,000 to $12,499 | 82 (2.9%) | 64 (3.1%) |
| $12,500 to $14,999 | 51 (1.8%) | 119 (5.7%) |
| $15,000 to $17,499 | 132 (4.6%) | 56 (2.7%) |
| $17,500 to $19,999 | 59 (2.1%) | 89 (4.3%) |
| $20,000 to $22,499 | 120 (4.2%) | 116 (5.6%) |
| $22,500 to $24,999 | 0 (0.0%) | 119 (5.7%) |
| $25,000 to $29,999 | 172 (6.0%) | 159 (7.7%) |
| $30,000 to $34,999 | 180 (6.3%) | 125 (6.0%) |
| $35,000 to $39,999 | 61 (2.1%) | 92 (4.4%) |
| $40,000 to $44,999 | 61 (2.1%) | 66 (3.2%) |
| $45,000 to $49,999 | 107 (3.7%) | 52 (2.5%) |
| $50,000 to $54,999 | 95 (3.3%) | 0 (0.0%) |
| $55,000 to $64,999 | 317 (11.1%) | 94 (4.5%) |
| $65,000 to $74,999 | 160 (5.6%) | 123 (5.9%) |
| $75,000 to $99,999 | 229 (8.0%) | 143 (6.9%) |
| $100,000+ | 470 (16.4%) | 339 (16.3%) |
| Total | 2,866 (100.0%) | 2,077 (100.0%) |
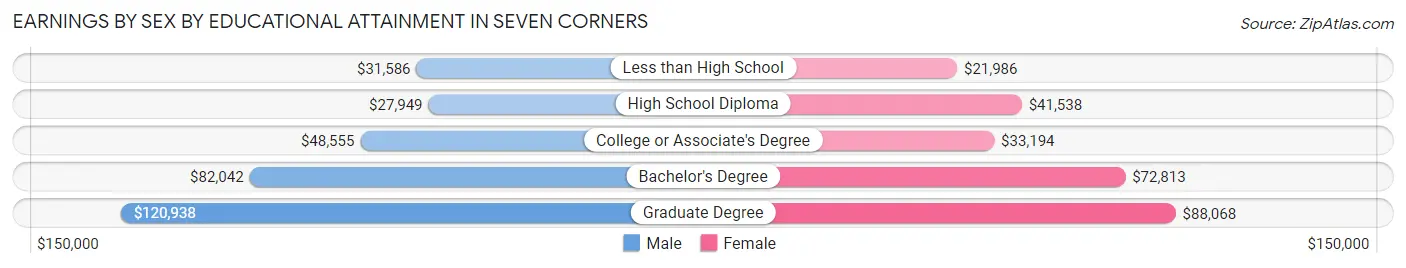
Earnings by Sex by Educational Attainment in Seven Corners
Average earnings in Seven Corners are $55,285 for men and $32,309 for women, a difference of 41.6%. Men with an educational attainment of graduate degree enjoy the highest average annual earnings of $120,938, while those with high school diploma education earn the least with $27,949. Women with an educational attainment of graduate degree earn the most with the average annual earnings of $88,068, while those with less than high school education have the smallest earnings of $21,986.
| Educational Attainment | Male Income | Female Income |
| Less than High School | $31,586 | $21,986 |
| High School Diploma | $27,949 | $41,538 |
| College or Associate's Degree | $48,555 | $33,194 |
| Bachelor's Degree | $82,042 | $72,813 |
| Graduate Degree | $120,938 | $88,068 |
| Total | $55,285 | $32,309 |
Family Income in Seven Corners
Family Income Brackets in Seven Corners
According to the Seven Corners family income data, there are 310 families falling into the $50,000 to $74,999 income range, which is the most common income bracket and makes up 15.1% of all families. Conversely, the $10,000 to $14,999 income bracket is the least frequent group with only 21 families (1.0%) belonging to this category.
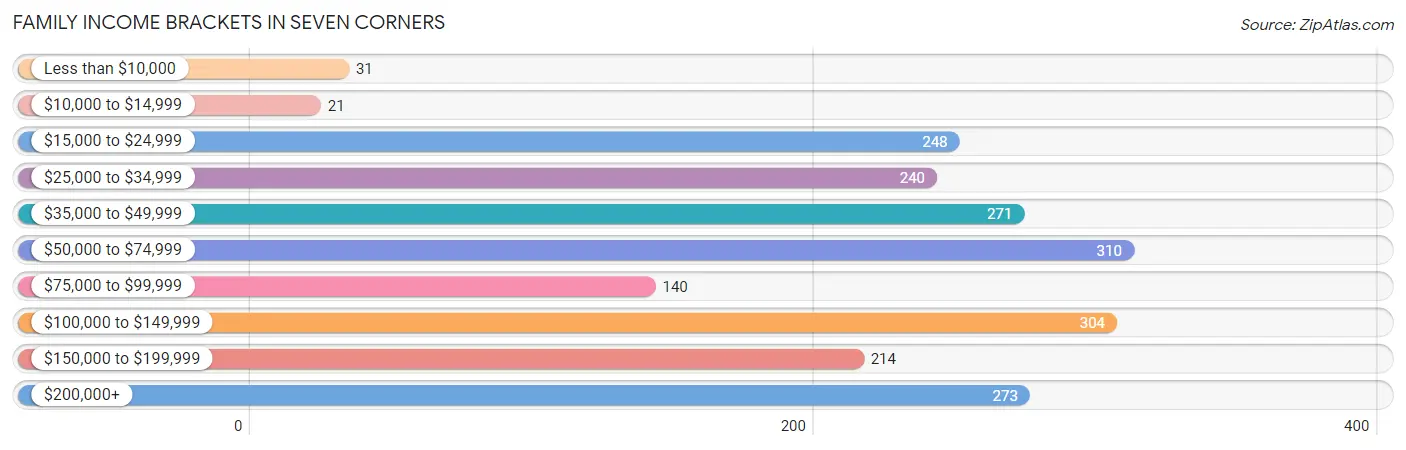
| Income Bracket | # Families | % Families |
| Less than $10,000 | 31 | 1.5% |
| $10,000 to $14,999 | 21 | 1.0% |
| $15,000 to $24,999 | 248 | 12.1% |
| $25,000 to $34,999 | 240 | 11.7% |
| $35,000 to $49,999 | 271 | 13.2% |
| $50,000 to $74,999 | 310 | 15.1% |
| $75,000 to $99,999 | 140 | 6.8% |
| $100,000 to $149,999 | 304 | 14.8% |
| $150,000 to $199,999 | 214 | 10.4% |
| $200,000+ | 273 | 13.3% |
Family Income by Famaliy Size in Seven Corners
2-person families (938 | 45.7%) account for the highest median family income in Seven Corners with $54,286 per family, while 2-person families (938 | 45.7%) have the highest median income of $27,143 per family member.
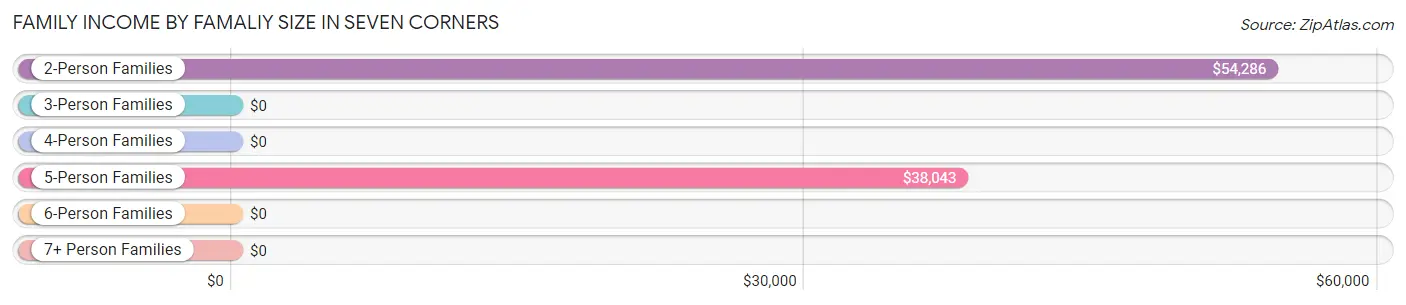
| Income Bracket | # Families | Median Income |
| 2-Person Families | 938 (45.7%) | $54,286 |
| 3-Person Families | 465 (22.7%) | $0 |
| 4-Person Families | 249 (12.1%) | $0 |
| 5-Person Families | 300 (14.6%) | $38,043 |
| 6-Person Families | 15 (0.7%) | $0 |
| 7+ Person Families | 86 (4.2%) | $0 |
| Total | 2,053 (100.0%) | $57,479 |
Family Income by Number of Earners in Seven Corners
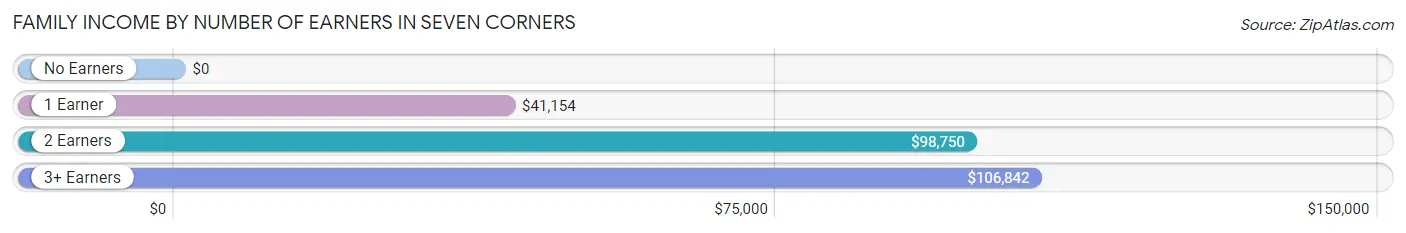
| Number of Earners | # Families | Median Income |
| No Earners | 169 (8.2%) | $0 |
| 1 Earner | 868 (42.3%) | $41,154 |
| 2 Earners | 758 (36.9%) | $98,750 |
| 3+ Earners | 258 (12.6%) | $106,842 |
| Total | 2,053 (100.0%) | $57,479 |
Household Income in Seven Corners
Household Income Brackets in Seven Corners
With 633 households falling in the category, the $100,000 to $149,999 income range is the most frequent in Seven Corners, accounting for 17.7% of all households. In contrast, only 165 households (4.6%) fall into the $10,000 to $14,999 income bracket, making it the least populous group.
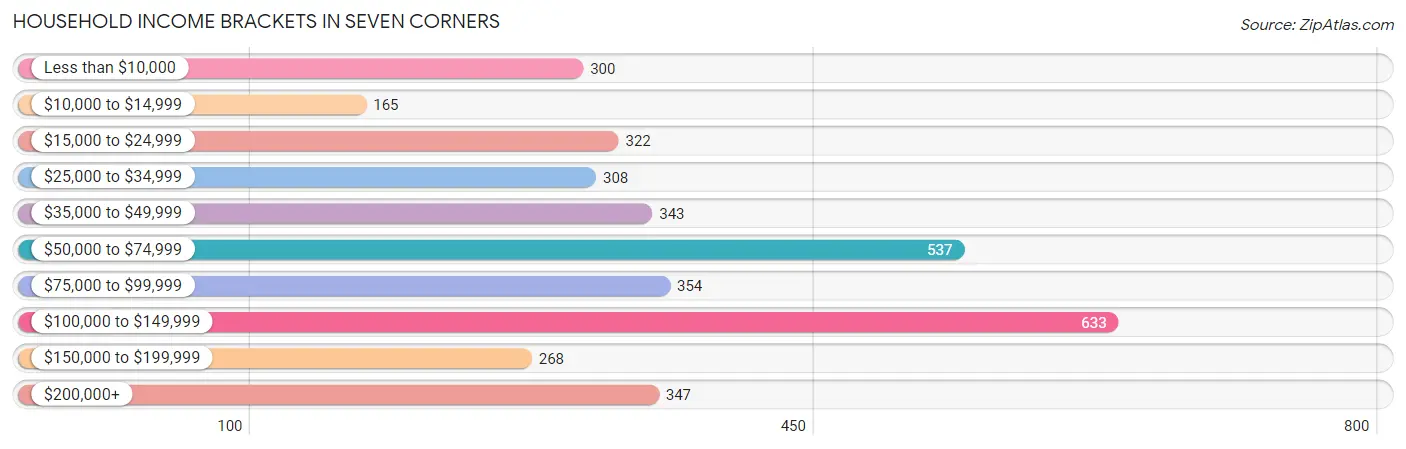
| Income Bracket | # Households | % Households |
| Less than $10,000 | 300 | 8.4% |
| $10,000 to $14,999 | 165 | 4.6% |
| $15,000 to $24,999 | 322 | 9.0% |
| $25,000 to $34,999 | 308 | 8.6% |
| $35,000 to $49,999 | 343 | 9.6% |
| $50,000 to $74,999 | 537 | 15.0% |
| $75,000 to $99,999 | 354 | 9.9% |
| $100,000 to $149,999 | 633 | 17.7% |
| $150,000 to $199,999 | 268 | 7.5% |
| $200,000+ | 347 | 9.7% |
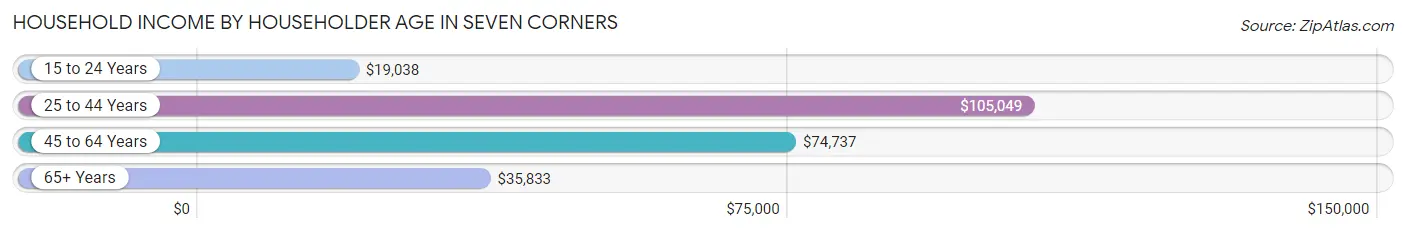
Household Income by Householder Age in Seven Corners
The median household income in Seven Corners is $63,625, with the highest median household income of $105,049 found in the 25 to 44 years age bracket for the primary householder. A total of 1,385 households (38.7%) fall into this category. Meanwhile, the 15 to 24 years age bracket for the primary householder has the lowest median household income of $19,038, with 144 households (4.0%) in this group.
| Income Bracket | # Households | Median Income |
| 15 to 24 Years | 144 (4.0%) | $19,038 |
| 25 to 44 Years | 1,385 (38.7%) | $105,049 |
| 45 to 64 Years | 1,082 (30.2%) | $74,737 |
| 65+ Years | 966 (27.0%) | $35,833 |
| Total | 3,577 (100.0%) | $63,625 |
Poverty in Seven Corners
Income Below Poverty by Sex and Age in Seven Corners
With 18.4% poverty level for males and 25.8% for females among the residents of Seven Corners, 16 and 17 year old males and 16 and 17 year old females are the most vulnerable to poverty, with 56 males (47.1%) and 82 females (69.5%) in their respective age groups living below the poverty level.
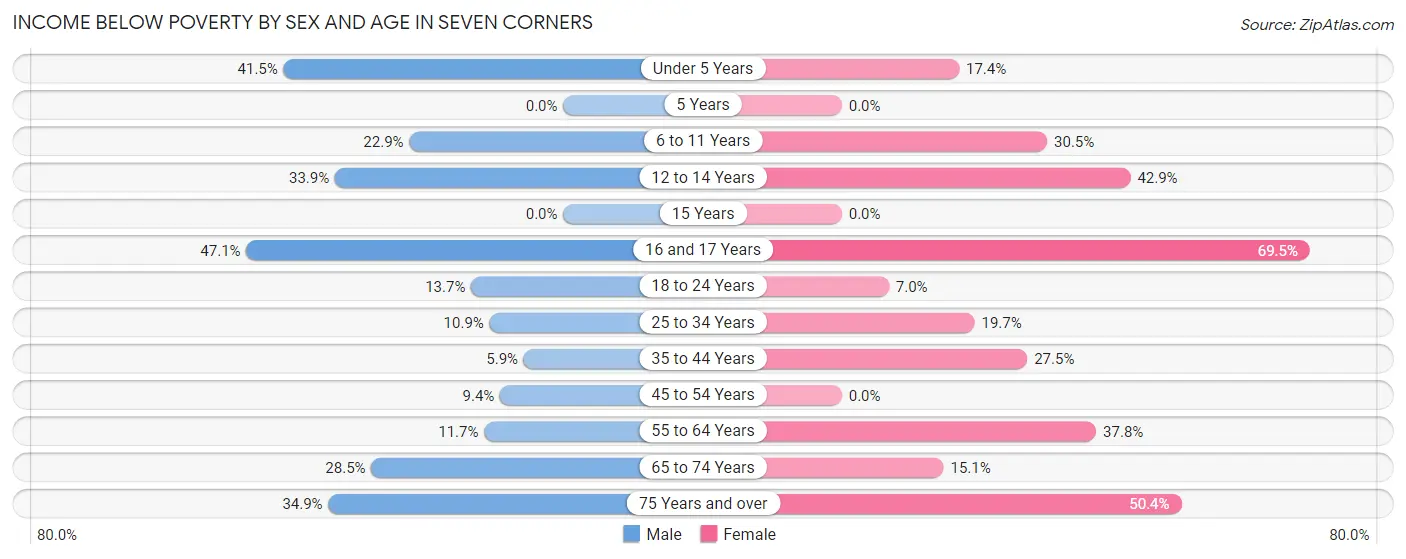
| Age Bracket | Male | Female |
| Under 5 Years | 162 (41.5%) | 70 (17.4%) |
| 5 Years | 0 (0.0%) | 0 (0.0%) |
| 6 to 11 Years | 48 (22.9%) | 93 (30.5%) |
| 12 to 14 Years | 60 (33.9%) | 138 (42.9%) |
| 15 Years | 0 (0.0%) | 0 (0.0%) |
| 16 and 17 Years | 56 (47.1%) | 82 (69.5%) |
| 18 to 24 Years | 78 (13.7%) | 13 (7.0%) |
| 25 to 34 Years | 106 (10.9%) | 161 (19.7%) |
| 35 to 44 Years | 30 (5.9%) | 184 (27.5%) |
| 45 to 54 Years | 41 (9.4%) | 0 (0.0%) |
| 55 to 64 Years | 60 (11.7%) | 159 (37.8%) |
| 65 to 74 Years | 110 (28.5%) | 71 (15.1%) |
| 75 Years and over | 105 (34.9%) | 182 (50.4%) |
| Total | 856 (18.4%) | 1,153 (25.8%) |
Income Above Poverty by Sex and Age in Seven Corners
According to the poverty statistics in Seven Corners, males aged 5 years and females aged 5 years are the age groups that are most secure financially, with 100.0% of males and 100.0% of females in these age groups living above the poverty line.
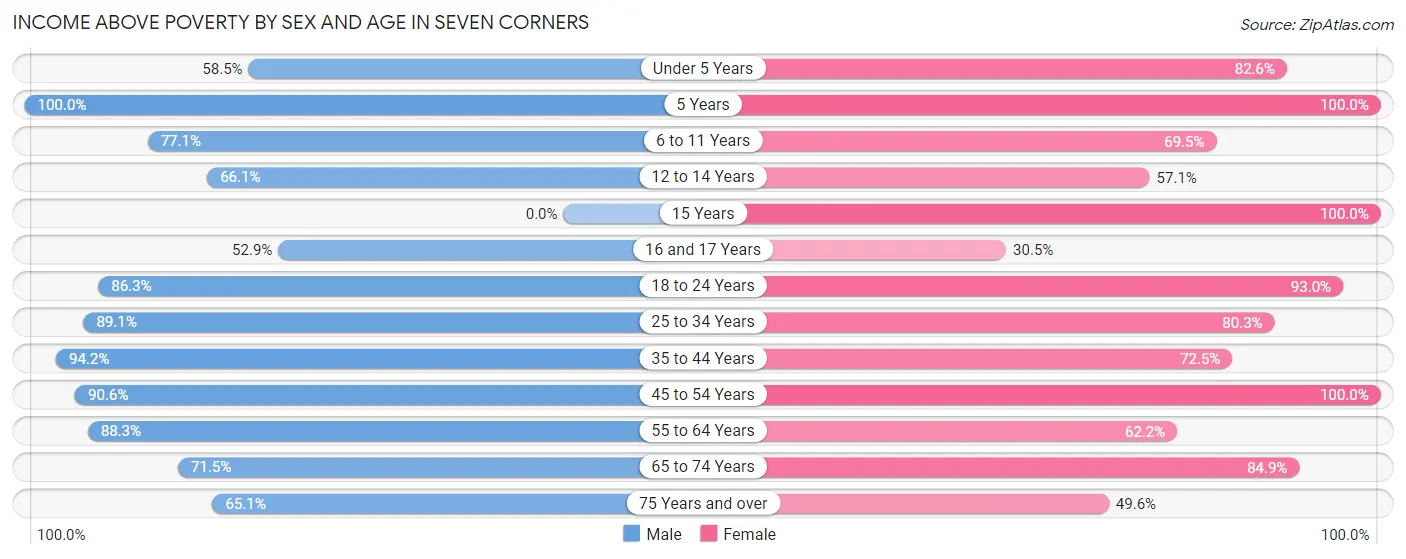
| Age Bracket | Male | Female |
| Under 5 Years | 228 (58.5%) | 332 (82.6%) |
| 5 Years | 70 (100.0%) | 52 (100.0%) |
| 6 to 11 Years | 162 (77.1%) | 212 (69.5%) |
| 12 to 14 Years | 117 (66.1%) | 184 (57.1%) |
| 15 Years | 0 (0.0%) | 30 (100.0%) |
| 16 and 17 Years | 63 (52.9%) | 36 (30.5%) |
| 18 to 24 Years | 492 (86.3%) | 173 (93.0%) |
| 25 to 34 Years | 863 (89.1%) | 656 (80.3%) |
| 35 to 44 Years | 483 (94.2%) | 484 (72.5%) |
| 45 to 54 Years | 396 (90.6%) | 321 (100.0%) |
| 55 to 64 Years | 451 (88.3%) | 262 (62.2%) |
| 65 to 74 Years | 276 (71.5%) | 399 (84.9%) |
| 75 Years and over | 196 (65.1%) | 179 (49.6%) |
| Total | 3,797 (81.6%) | 3,320 (74.2%) |
Income Below Poverty Among Married-Couple Families in Seven Corners
The poverty statistics for married-couple families in Seven Corners show that 9.9% or 146 of the total 1,469 families live below the poverty line. Families with 3 or 4 children have the highest poverty rate of 22.9%, comprising of 47 families. On the other hand, families with no children have the lowest poverty rate of 7.6%, which includes 64 families.
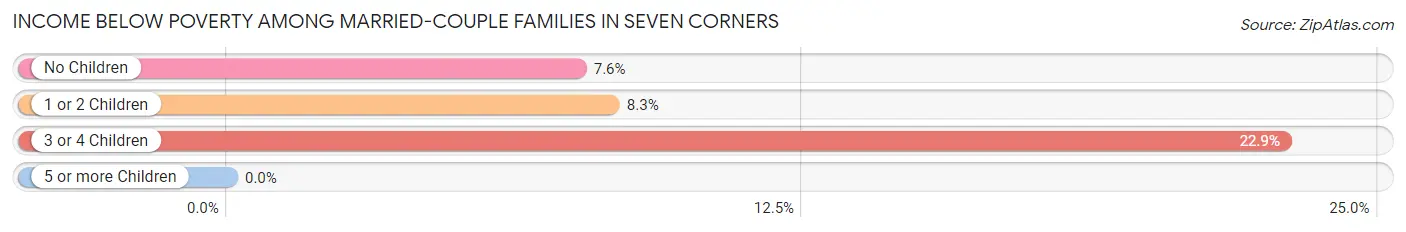
| Children | Above Poverty | Below Poverty |
| No Children | 779 (92.4%) | 64 (7.6%) |
| 1 or 2 Children | 386 (91.7%) | 35 (8.3%) |
| 3 or 4 Children | 158 (77.1%) | 47 (22.9%) |
| 5 or more Children | 0 (0.0%) | 0 (0.0%) |
| Total | 1,323 (90.1%) | 146 (9.9%) |
Income Below Poverty Among Single-Parent Households in Seven Corners
According to the poverty data in Seven Corners, 9.2% or 21 single-father households and 41.8% or 149 single-mother households are living below the poverty line. Among single-father households, those with no children have the highest poverty rate, with 21 households (13.2%) experiencing poverty. Likewise, among single-mother households, those with 3 or 4 children have the highest poverty rate, with 63 households (72.4%) falling below the poverty line.
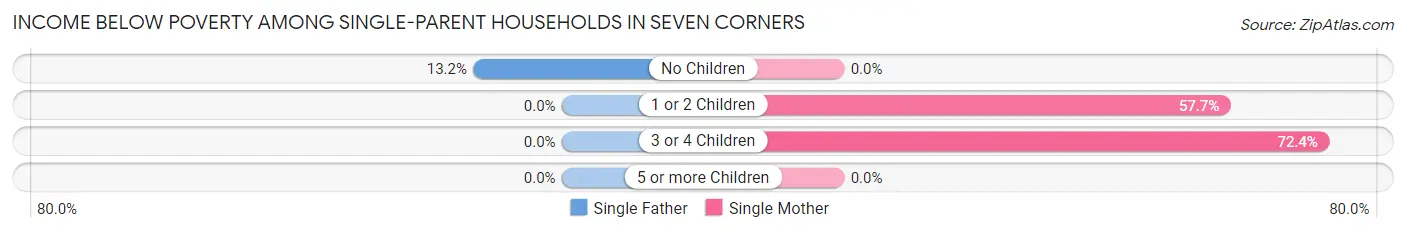
| Children | Single Father | Single Mother |
| No Children | 21 (13.2%) | 0 (0.0%) |
| 1 or 2 Children | 0 (0.0%) | 86 (57.7%) |
| 3 or 4 Children | 0 (0.0%) | 63 (72.4%) |
| 5 or more Children | 0 (0.0%) | 0 (0.0%) |
| Total | 21 (9.2%) | 149 (41.8%) |
Income Below Poverty Among Married-Couple vs Single-Parent Households in Seven Corners
The poverty data for Seven Corners shows that 146 of the married-couple family households (9.9%) and 170 of the single-parent households (29.1%) are living below the poverty level. Within the married-couple family households, those with 3 or 4 children have the highest poverty rate, with 47 households (22.9%) falling below the poverty line. Among the single-parent households, those with 3 or 4 children have the highest poverty rate, with 63 household (72.4%) living below poverty.
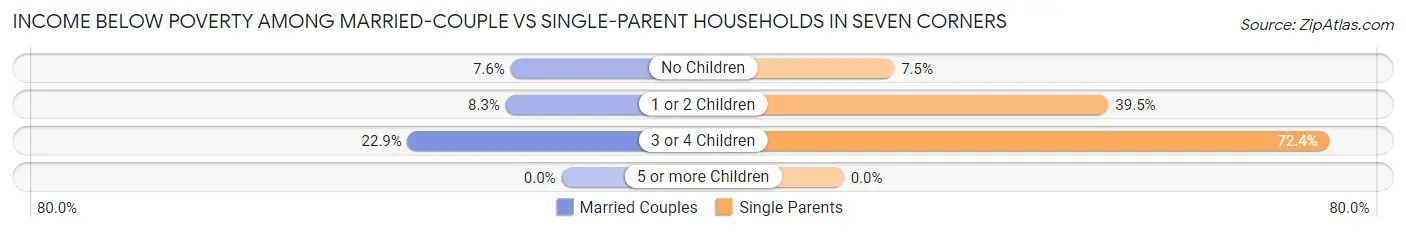
| Children | Married-Couple Families | Single-Parent Households |
| No Children | 64 (7.6%) | 21 (7.5%) |
| 1 or 2 Children | 35 (8.3%) | 86 (39.5%) |
| 3 or 4 Children | 47 (22.9%) | 63 (72.4%) |
| 5 or more Children | 0 (0.0%) | 0 (0.0%) |
| Total | 146 (9.9%) | 170 (29.1%) |
Race in Seven Corners
The most populous races in Seven Corners are White / Caucasian (4,164 | 45.6%), Hispanic or Latino (3,338 | 36.5%), and Some other Race (2,097 | 22.9%).
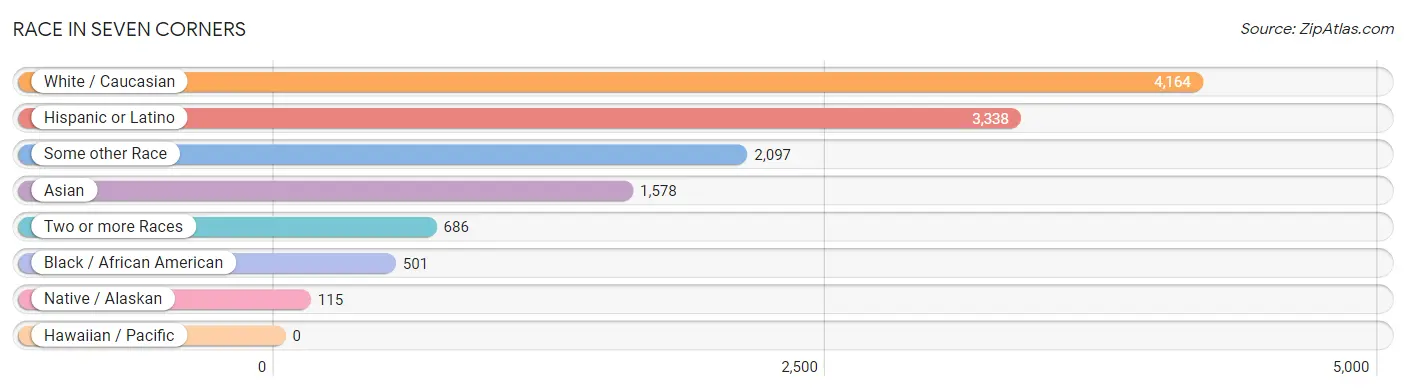
| Race | # Population | % Population |
| Asian | 1,578 | 17.3% |
| Black / African American | 501 | 5.5% |
| Hawaiian / Pacific | 0 | 0.0% |
| Hispanic or Latino | 3,338 | 36.5% |
| Native / Alaskan | 115 | 1.3% |
| White / Caucasian | 4,164 | 45.6% |
| Two or more Races | 686 | 7.5% |
| Some other Race | 2,097 | 22.9% |
| Total | 9,141 | 100.0% |
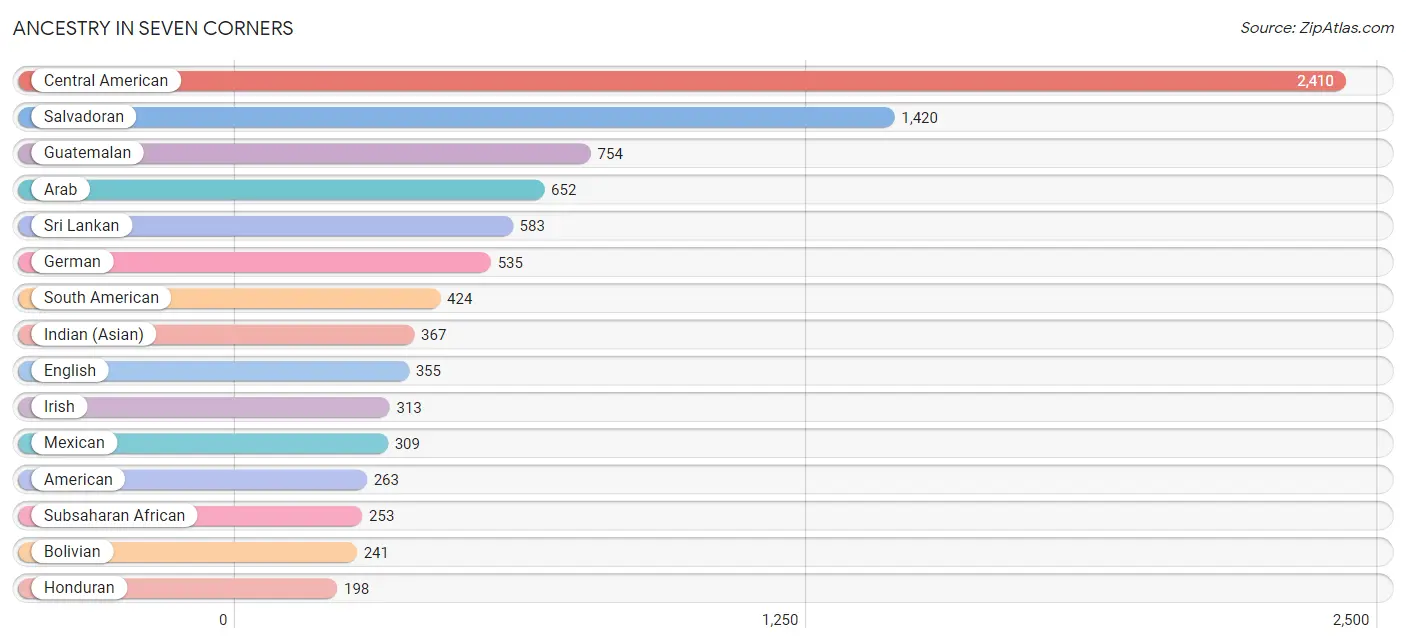
Ancestry in Seven Corners
The most populous ancestries reported in Seven Corners are Central American (2,410 | 26.4%), Salvadoran (1,420 | 15.5%), Guatemalan (754 | 8.3%), Arab (652 | 7.1%), and Sri Lankan (583 | 6.4%), together accounting for 63.6% of all Seven Corners residents.
| Ancestry | # Population | % Population |
| African | 29 | 0.3% |
| Alsatian | 12 | 0.1% |
| American | 263 | 2.9% |
| Arab | 652 | 7.1% |
| Argentinean | 18 | 0.2% |
| Austrian | 32 | 0.4% |
| Belgian | 15 | 0.2% |
| Bhutanese | 38 | 0.4% |
| Bolivian | 241 | 2.6% |
| Burmese | 103 | 1.1% |
| Central American | 2,410 | 26.4% |
| Cherokee | 28 | 0.3% |
| Croatian | 15 | 0.2% |
| Cuban | 11 | 0.1% |
| Czech | 78 | 0.9% |
| Czechoslovakian | 10 | 0.1% |
| Danish | 20 | 0.2% |
| Dominican | 52 | 0.6% |
| Dutch | 10 | 0.1% |
| Eastern European | 21 | 0.2% |
| Egyptian | 17 | 0.2% |
| English | 355 | 3.9% |
| Ethiopian | 136 | 1.5% |
| European | 92 | 1.0% |
| French | 166 | 1.8% |
| French Canadian | 46 | 0.5% |
| German | 535 | 5.9% |
| Greek | 17 | 0.2% |
| Guatemalan | 754 | 8.3% |
| Guyanese | 31 | 0.3% |
| Haitian | 16 | 0.2% |
| Honduran | 198 | 2.2% |
| Hungarian | 35 | 0.4% |
| Indian (Asian) | 367 | 4.0% |
| Iranian | 42 | 0.5% |
| Iraqi | 77 | 0.8% |
| Irish | 313 | 3.4% |
| Italian | 140 | 1.5% |
| Jamaican | 31 | 0.3% |
| Japanese | 79 | 0.9% |
| Korean | 190 | 2.1% |
| Laotian | 75 | 0.8% |
| Lebanese | 21 | 0.2% |
| Luxembourger | 14 | 0.2% |
| Malaysian | 29 | 0.3% |
| Mexican | 309 | 3.4% |
| Moroccan | 156 | 1.7% |
| Nicaraguan | 38 | 0.4% |
| Nigerian | 88 | 1.0% |
| Northern European | 23 | 0.3% |
| Norwegian | 42 | 0.5% |
| Peruvian | 139 | 1.5% |
| Polish | 143 | 1.6% |
| Romanian | 14 | 0.2% |
| Russian | 48 | 0.5% |
| Salvadoran | 1,420 | 15.5% |
| Scotch-Irish | 21 | 0.2% |
| Scottish | 138 | 1.5% |
| Seminole | 35 | 0.4% |
| Serbian | 79 | 0.9% |
| Slovak | 16 | 0.2% |
| Slovene | 15 | 0.2% |
| South American | 424 | 4.6% |
| Spanish | 65 | 0.7% |
| Sri Lankan | 583 | 6.4% |
| Subsaharan African | 253 | 2.8% |
| Thai | 79 | 0.9% |
| Turkish | 129 | 1.4% |
| Uruguayan | 26 | 0.3% |
| Yugoslavian | 42 | 0.5% | View All 70 Rows |
Immigrants in Seven Corners
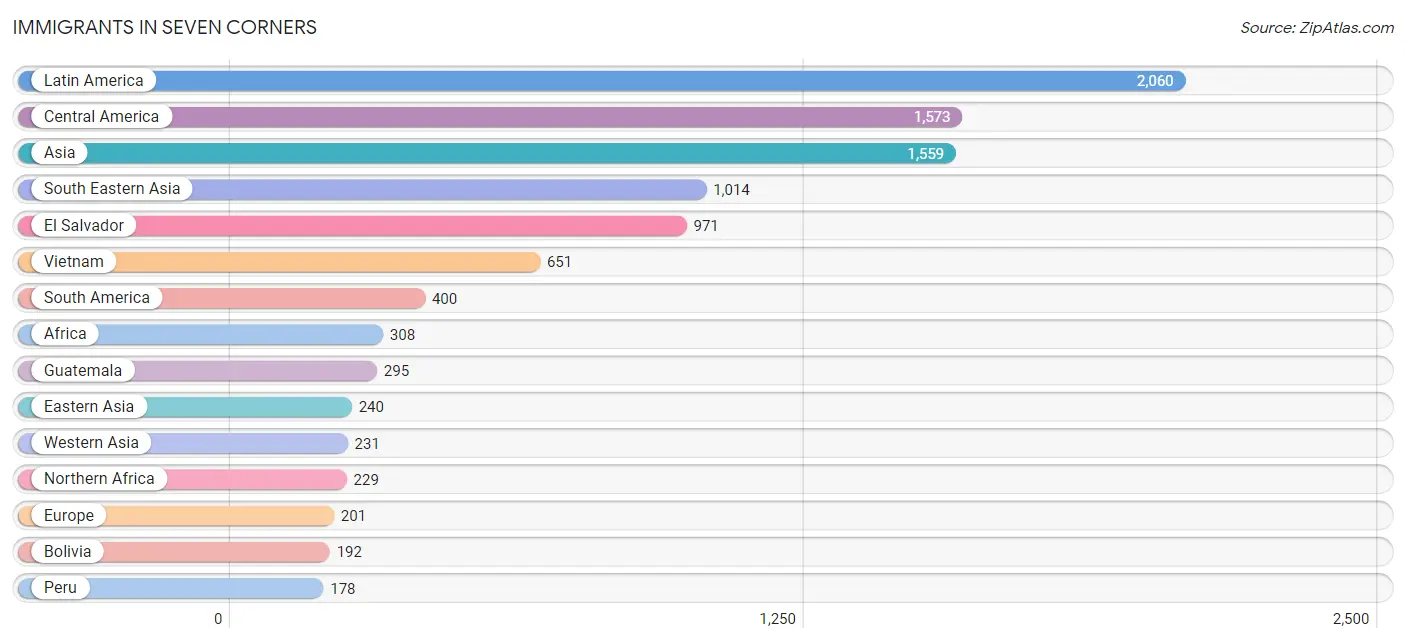
The most numerous immigrant groups reported in Seven Corners came from Latin America (2,060 | 22.5%), Central America (1,573 | 17.2%), Asia (1,559 | 17.1%), South Eastern Asia (1,014 | 11.1%), and El Salvador (971 | 10.6%), together accounting for 78.5% of all Seven Corners residents.
| Immigration Origin | # Population | % Population |
| Afghanistan | 10 | 0.1% |
| Africa | 308 | 3.4% |
| Argentina | 18 | 0.2% |
| Asia | 1,559 | 17.1% |
| Austria | 39 | 0.4% |
| Bangladesh | 12 | 0.1% |
| Belgium | 15 | 0.2% |
| Bolivia | 192 | 2.1% |
| Bosnia and Herzegovina | 42 | 0.5% |
| Cambodia | 127 | 1.4% |
| Canada | 15 | 0.2% |
| Caribbean | 87 | 0.9% |
| Central America | 1,573 | 17.2% |
| China | 97 | 1.1% |
| Cuba | 11 | 0.1% |
| Dominican Republic | 76 | 0.8% |
| Eastern Africa | 79 | 0.9% |
| Eastern Asia | 240 | 2.6% |
| Eastern Europe | 86 | 0.9% |
| Egypt | 16 | 0.2% |
| El Salvador | 971 | 10.6% |
| Ethiopia | 79 | 0.9% |
| Europe | 201 | 2.2% |
| Germany | 16 | 0.2% |
| Guatemala | 295 | 3.2% |
| Honduras | 134 | 1.5% |
| India | 17 | 0.2% |
| Indonesia | 95 | 1.0% |
| Iran | 25 | 0.3% |
| Iraq | 77 | 0.8% |
| Italy | 29 | 0.3% |
| Korea | 143 | 1.6% |
| Laos | 29 | 0.3% |
| Latin America | 2,060 | 22.5% |
| Mexico | 135 | 1.5% |
| Morocco | 135 | 1.5% |
| Nepal | 10 | 0.1% |
| Nicaragua | 38 | 0.4% |
| Northern Africa | 229 | 2.5% |
| Northern Europe | 16 | 0.2% |
| Peru | 178 | 1.9% |
| Philippines | 112 | 1.2% |
| Russia | 20 | 0.2% |
| Saudi Arabia | 55 | 0.6% |
| Serbia | 9 | 0.1% |
| South America | 400 | 4.4% |
| South Central Asia | 74 | 0.8% |
| South Eastern Asia | 1,014 | 11.1% |
| Southern Europe | 29 | 0.3% |
| Turkey | 99 | 1.1% |
| Uruguay | 12 | 0.1% |
| Vietnam | 651 | 7.1% |
| Western Asia | 231 | 2.5% |
| Western Europe | 70 | 0.8% | View All 54 Rows |
Sex and Age in Seven Corners
Sex and Age in Seven Corners
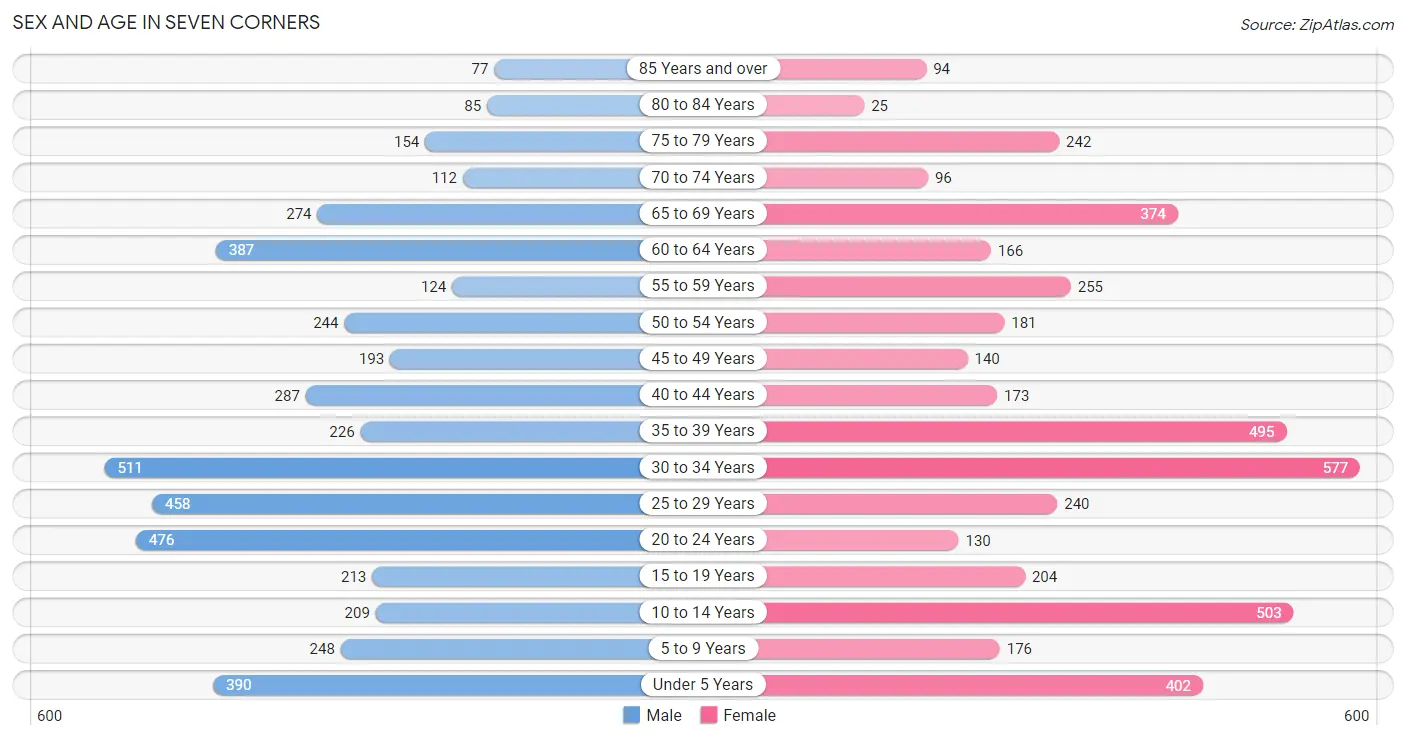
The most populous age groups in Seven Corners are 30 to 34 Years (511 | 11.0%) for men and 30 to 34 Years (577 | 12.9%) for women.
| Age Bracket | Male | Female |
| Under 5 Years | 390 (8.4%) | 402 (9.0%) |
| 5 to 9 Years | 248 (5.3%) | 176 (3.9%) |
| 10 to 14 Years | 209 (4.5%) | 503 (11.3%) |
| 15 to 19 Years | 213 (4.6%) | 204 (4.6%) |
| 20 to 24 Years | 476 (10.2%) | 130 (2.9%) |
| 25 to 29 Years | 458 (9.8%) | 240 (5.4%) |
| 30 to 34 Years | 511 (11.0%) | 577 (12.9%) |
| 35 to 39 Years | 226 (4.8%) | 495 (11.1%) |
| 40 to 44 Years | 287 (6.1%) | 173 (3.9%) |
| 45 to 49 Years | 193 (4.1%) | 140 (3.1%) |
| 50 to 54 Years | 244 (5.2%) | 181 (4.1%) |
| 55 to 59 Years | 124 (2.7%) | 255 (5.7%) |
| 60 to 64 Years | 387 (8.3%) | 166 (3.7%) |
| 65 to 69 Years | 274 (5.9%) | 374 (8.4%) |
| 70 to 74 Years | 112 (2.4%) | 96 (2.1%) |
| 75 to 79 Years | 154 (3.3%) | 242 (5.4%) |
| 80 to 84 Years | 85 (1.8%) | 25 (0.6%) |
| 85 Years and over | 77 (1.7%) | 94 (2.1%) |
| Total | 4,668 (100.0%) | 4,473 (100.0%) |
Families and Households in Seven Corners
Median Family Size in Seven Corners
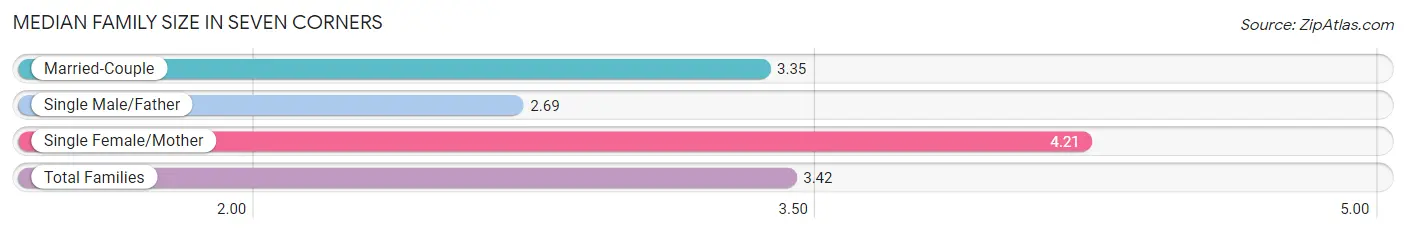
The median family size in Seven Corners is 3.42 persons per family, with single female/mother families (356 | 17.3%) accounting for the largest median family size of 4.21 persons per family. On the other hand, single male/father families (228 | 11.1%) represent the smallest median family size with 2.69 persons per family.
| Family Type | # Families | Family Size |
| Married-Couple | 1,469 (71.6%) | 3.35 |
| Single Male/Father | 228 (11.1%) | 2.69 |
| Single Female/Mother | 356 (17.3%) | 4.21 |
| Total Families | 2,053 (100.0%) | 3.42 |
Median Household Size in Seven Corners
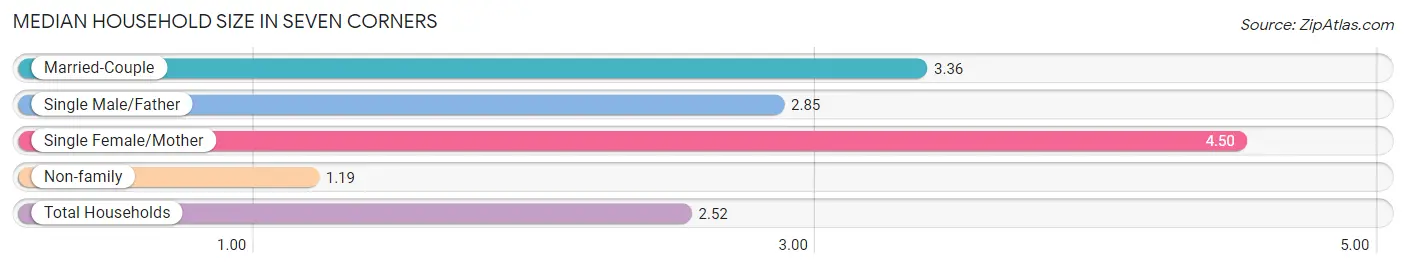
The median household size in Seven Corners is 2.52 persons per household, with single female/mother households (356 | 10.0%) accounting for the largest median household size of 4.5 persons per household. non-family households (1,524 | 42.6%) represent the smallest median household size with 1.19 persons per household.
| Household Type | # Households | Household Size |
| Married-Couple | 1,469 (41.1%) | 3.36 |
| Single Male/Father | 228 (6.4%) | 2.85 |
| Single Female/Mother | 356 (10.0%) | 4.50 |
| Non-family | 1,524 (42.6%) | 1.19 |
| Total Households | 3,577 (100.0%) | 2.52 |
Household Size by Marriage Status in Seven Corners
Out of a total of 3,577 households in Seven Corners, 2,053 (57.4%) are family households, while 1,524 (42.6%) are nonfamily households. The most numerous type of family households are 2-person households, comprising 901, and the most common type of nonfamily households are 1-person households, comprising 1,246.
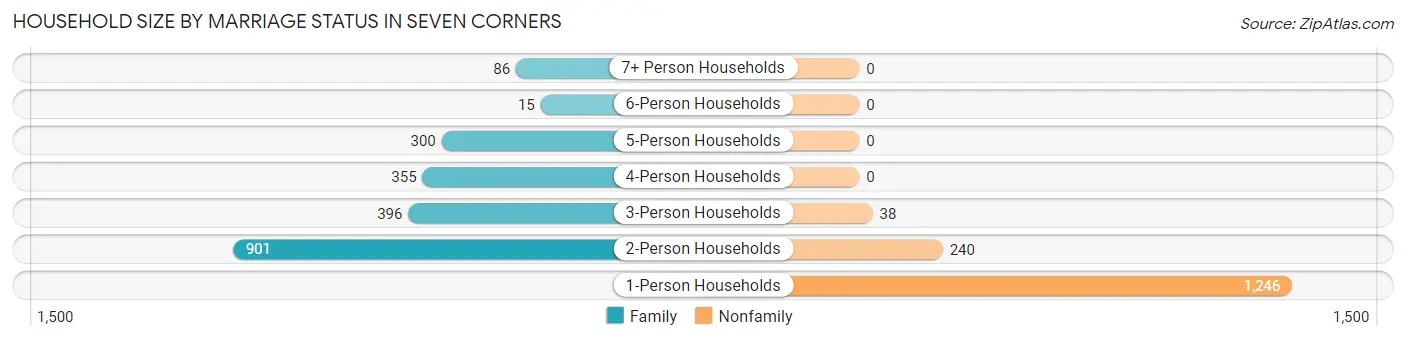
| Household Size | Family Households | Nonfamily Households |
| 1-Person Households | - | 1,246 (34.8%) |
| 2-Person Households | 901 (25.2%) | 240 (6.7%) |
| 3-Person Households | 396 (11.1%) | 38 (1.1%) |
| 4-Person Households | 355 (9.9%) | 0 (0.0%) |
| 5-Person Households | 300 (8.4%) | 0 (0.0%) |
| 6-Person Households | 15 (0.4%) | 0 (0.0%) |
| 7+ Person Households | 86 (2.4%) | 0 (0.0%) |
| Total | 2,053 (57.4%) | 1,524 (42.6%) |
Female Fertility in Seven Corners
Fertility by Age in Seven Corners
Average fertility rate in Seven Corners is 99.0 births per 1,000 women. Women in the age bracket of 35 to 50 years have the highest fertility rate with 124.0 births per 1,000 women. Women in the age bracket of 35 to 50 years acount for 51.8% of all women with births.
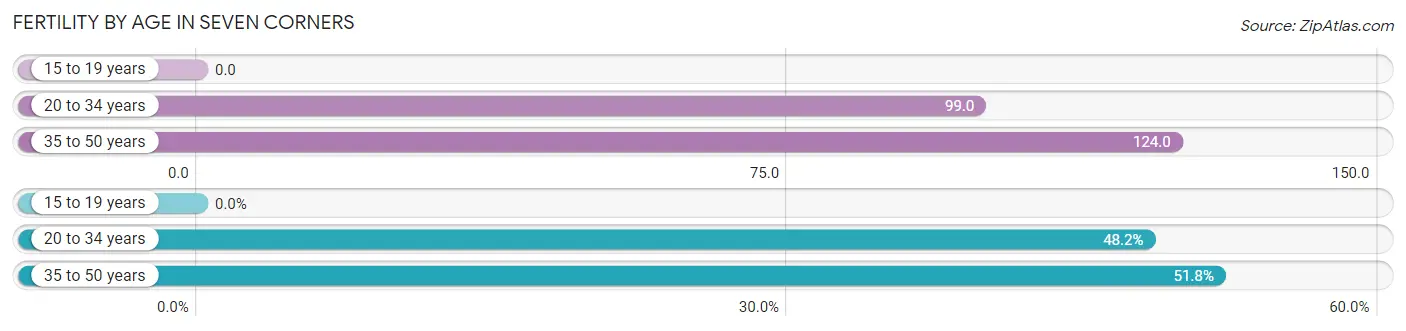
| Age Bracket | Women with Births | Births / 1,000 Women |
| 15 to 19 years | 0 (0.0%) | 0.0 |
| 20 to 34 years | 94 (48.2%) | 99.0 |
| 35 to 50 years | 101 (51.8%) | 124.0 |
| Total | 195 (100.0%) | 99.0 |
Fertility by Age by Marriage Status in Seven Corners
87.2% of women with births (195) in Seven Corners are married. The highest percentage of unmarried women with births falls into 20 to 34 years age bracket with 26.6% of them unmarried at the time of birth, while the lowest percentage of unmarried women with births belong to 35 to 50 years age bracket with 0.0% of them unmarried.
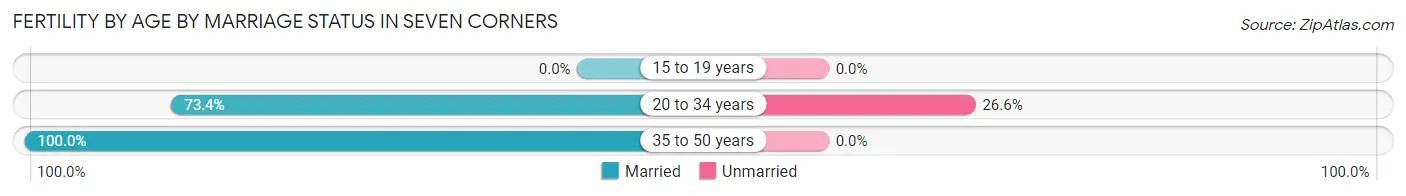
| Age Bracket | Married | Unmarried |
| 15 to 19 years | 0 (0.0%) | 0 (0.0%) |
| 20 to 34 years | 69 (73.4%) | 25 (26.6%) |
| 35 to 50 years | 101 (100.0%) | 0 (0.0%) |
| Total | 170 (87.2%) | 25 (12.8%) |
Fertility by Education in Seven Corners
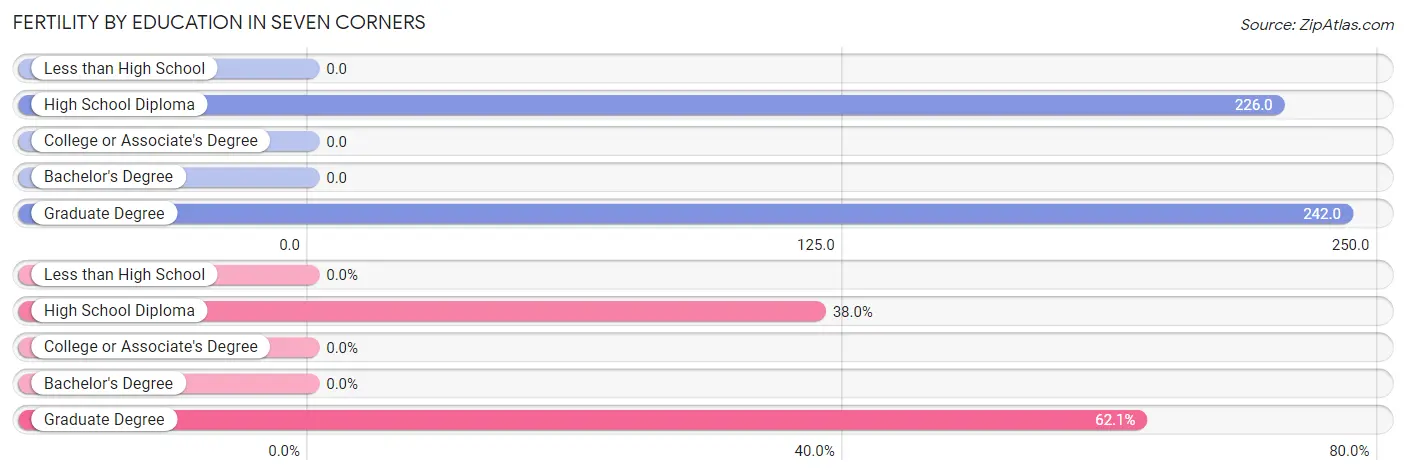
| Educational Attainment | Women with Births | Births / 1,000 Women |
| Less than High School | 0 (0.0%) | 0.0 |
| High School Diploma | 74 (38.0%) | 226.0 |
| College or Associate's Degree | 0 (0.0%) | 0.0 |
| Bachelor's Degree | 0 (0.0%) | 0.0 |
| Graduate Degree | 121 (62.1%) | 242.0 |
| Total | 195 (100.0%) | 99.0 |
Fertility by Education by Marriage Status in Seven Corners
12.8% of women with births in Seven Corners are unmarried. Women with the educational attainment of graduate degree are most likely to be married with 100.0% of them married at childbirth, while women with the educational attainment of high school diploma are least likely to be married with 33.8% of them unmarried at childbirth.
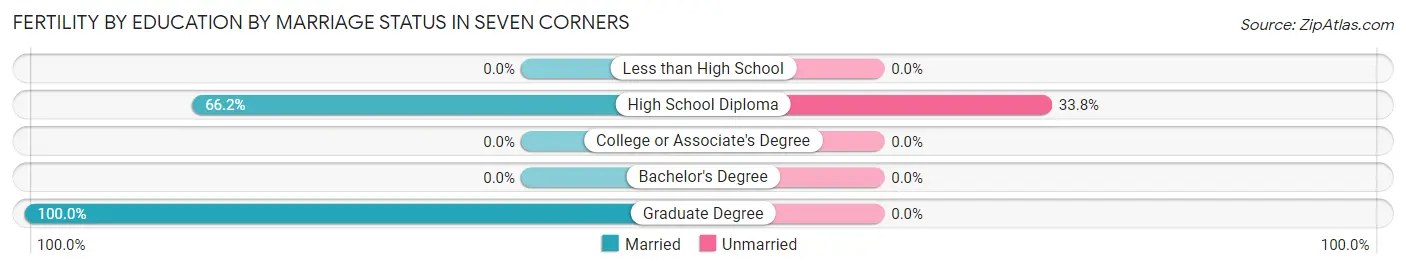
| Educational Attainment | Married | Unmarried |
| Less than High School | 0 (0.0%) | 0 (0.0%) |
| High School Diploma | 49 (66.2%) | 25 (33.8%) |
| College or Associate's Degree | 0 (0.0%) | 0 (0.0%) |
| Bachelor's Degree | 0 (0.0%) | 0 (0.0%) |
| Graduate Degree | 121 (100.0%) | 0 (0.0%) |
| Total | 170 (87.2%) | 25 (12.8%) |
Employment Characteristics in Seven Corners
Employment by Class of Employer in Seven Corners
Among the 4,281 employed individuals in Seven Corners, private company employees (3,200 | 74.8%), federal government employees (455 | 10.6%), and not-for-profit organizations (242 | 5.7%) make up the most common classes of employment.
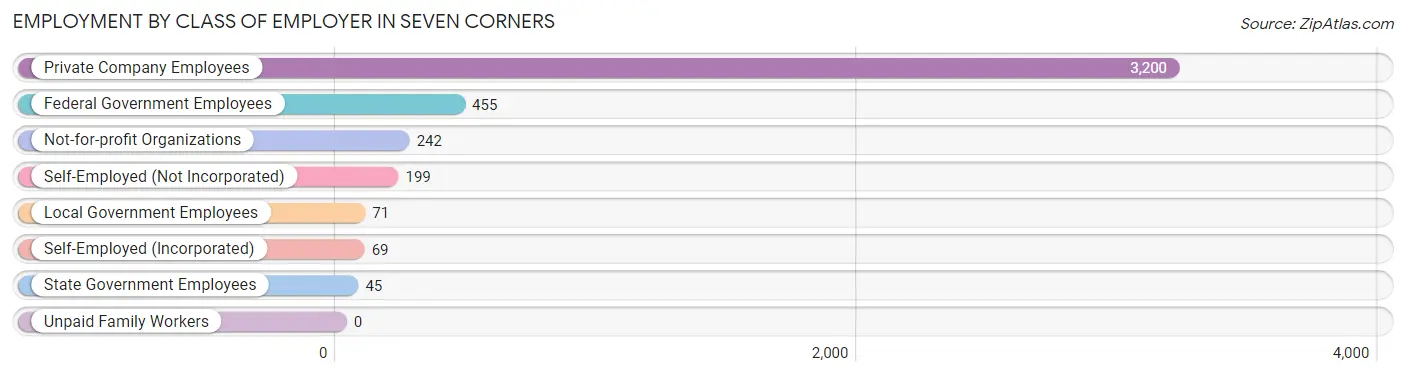
| Employer Class | # Employees | % Employees |
| Private Company Employees | 3,200 | 74.8% |
| Self-Employed (Incorporated) | 69 | 1.6% |
| Self-Employed (Not Incorporated) | 199 | 4.6% |
| Not-for-profit Organizations | 242 | 5.7% |
| Local Government Employees | 71 | 1.7% |
| State Government Employees | 45 | 1.1% |
| Federal Government Employees | 455 | 10.6% |
| Unpaid Family Workers | 0 | 0.0% |
| Total | 4,281 | 100.0% |
Employment Status by Age in Seven Corners
According to the labor force statistics for Seven Corners, out of the total population over 16 years of age (7,183), 66.5% or 4,777 individuals are in the labor force, with 8.3% or 396 of them unemployed. The age group with the highest labor force participation rate is 25 to 29 years, with 93.8% or 655 individuals in the labor force. Within the labor force, the 16 to 19 years age range has the highest percentage of unemployed individuals, with 26.5% or 56 of them being unemployed.
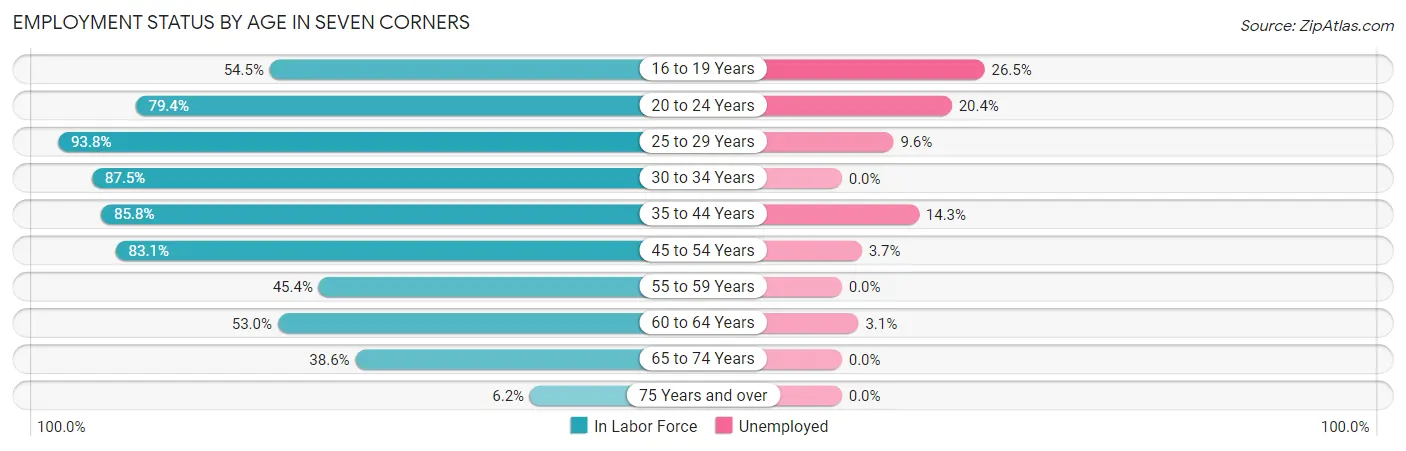
| Age Bracket | In Labor Force | Unemployed |
| 16 to 19 Years | 211 (54.5%) | 56 (26.5%) |
| 20 to 24 Years | 481 (79.4%) | 98 (20.4%) |
| 25 to 29 Years | 655 (93.8%) | 63 (9.6%) |
| 30 to 34 Years | 952 (87.5%) | 0 (0.0%) |
| 35 to 44 Years | 1,013 (85.8%) | 145 (14.3%) |
| 45 to 54 Years | 630 (83.1%) | 23 (3.7%) |
| 55 to 59 Years | 172 (45.4%) | 0 (0.0%) |
| 60 to 64 Years | 293 (53.0%) | 9 (3.1%) |
| 65 to 74 Years | 330 (38.6%) | 0 (0.0%) |
| 75 Years and over | 42 (6.2%) | 0 (0.0%) |
| Total | 4,777 (66.5%) | 396 (8.3%) |
Employment Status by Educational Attainment in Seven Corners
According to labor force statistics for Seven Corners, 79.8% of individuals (3,716) out of the total population between 25 and 64 years of age (4,657) are in the labor force, with 6.5% or 242 of them being unemployed. The group with the highest labor force participation rate are those with the educational attainment of bachelor's degree or higher, with 90.0% or 1,692 individuals in the labor force. Within the labor force, individuals with college / associate degree education have the highest percentage of unemployment, with 10.8% or 78 of them being unemployed.
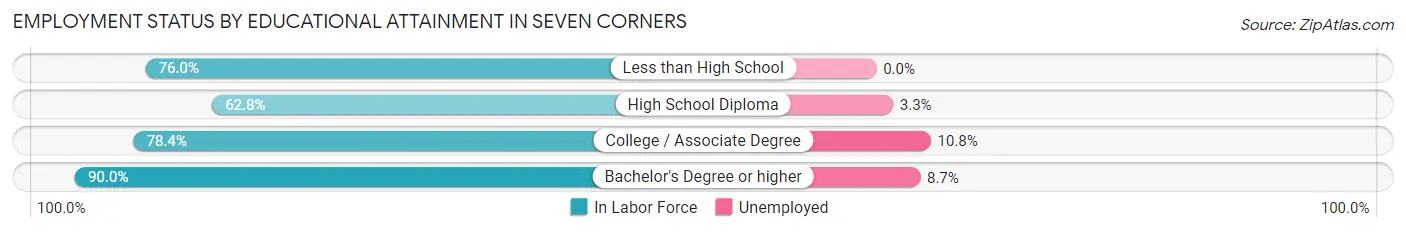
| Educational Attainment | In Labor Force | Unemployed |
| Less than High School | 779 (76.0%) | 0 (0.0%) |
| High School Diploma | 522 (62.8%) | 27 (3.3%) |
| College / Associate Degree | 722 (78.4%) | 99 (10.8%) |
| Bachelor's Degree or higher | 1,692 (90.0%) | 164 (8.7%) |
| Total | 3,716 (79.8%) | 303 (6.5%) |
Employment Occupations by Sex in Seven Corners
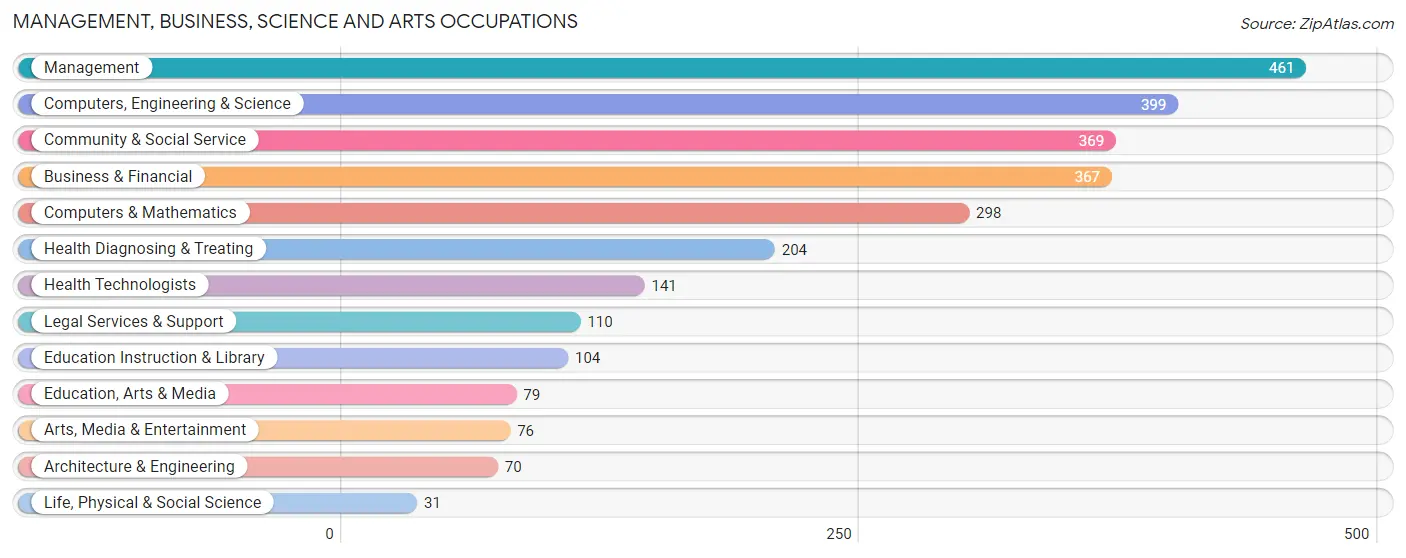
Management, Business, Science and Arts Occupations
The most common Management, Business, Science and Arts occupations in Seven Corners are Management (461 | 10.6%), Computers, Engineering & Science (399 | 9.2%), Community & Social Service (369 | 8.5%), Business & Financial (367 | 8.5%), and Computers & Mathematics (298 | 6.9%).
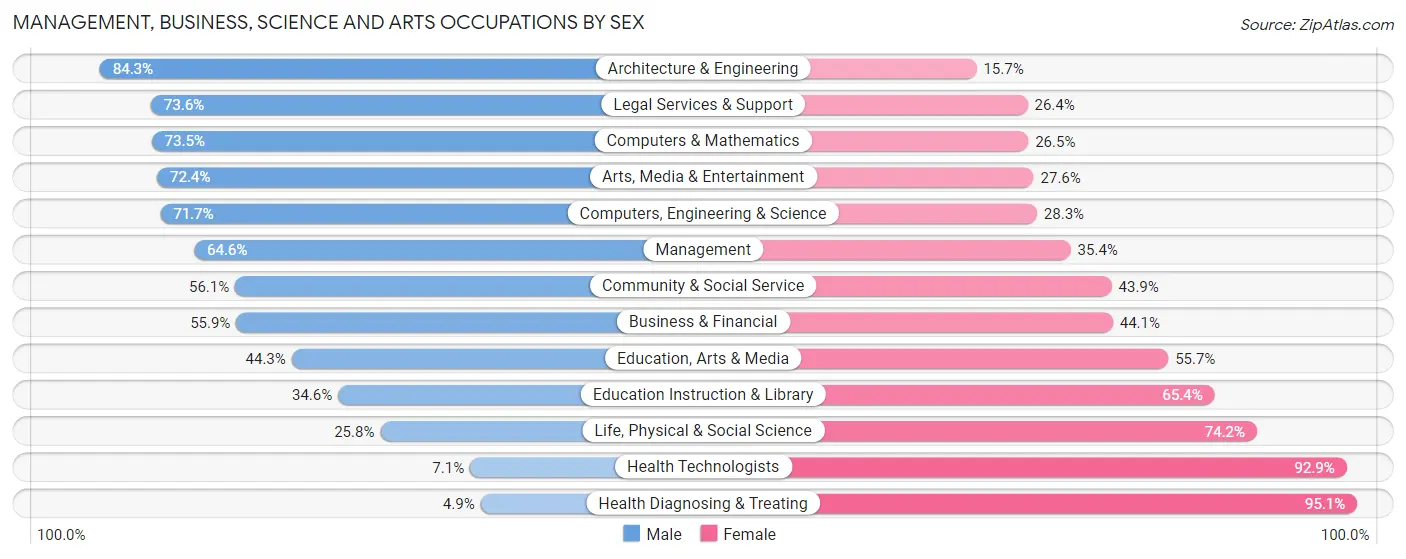
Management, Business, Science and Arts Occupations by Sex
Within the Management, Business, Science and Arts occupations in Seven Corners, the most male-oriented occupations are Architecture & Engineering (84.3%), Legal Services & Support (73.6%), and Computers & Mathematics (73.5%), while the most female-oriented occupations are Health Diagnosing & Treating (95.1%), Health Technologists (92.9%), and Life, Physical & Social Science (74.2%).
| Occupation | Male | Female |
| Management | 298 (64.6%) | 163 (35.4%) |
| Business & Financial | 205 (55.9%) | 162 (44.1%) |
| Computers, Engineering & Science | 286 (71.7%) | 113 (28.3%) |
| Computers & Mathematics | 219 (73.5%) | 79 (26.5%) |
| Architecture & Engineering | 59 (84.3%) | 11 (15.7%) |
| Life, Physical & Social Science | 8 (25.8%) | 23 (74.2%) |
| Community & Social Service | 207 (56.1%) | 162 (43.9%) |
| Education, Arts & Media | 35 (44.3%) | 44 (55.7%) |
| Legal Services & Support | 81 (73.6%) | 29 (26.4%) |
| Education Instruction & Library | 36 (34.6%) | 68 (65.4%) |
| Arts, Media & Entertainment | 55 (72.4%) | 21 (27.6%) |
| Health Diagnosing & Treating | 10 (4.9%) | 194 (95.1%) |
| Health Technologists | 10 (7.1%) | 131 (92.9%) |
| Total (Category) | 1,006 (55.9%) | 794 (44.1%) |
| Total (Overall) | 2,542 (58.6%) | 1,794 (41.4%) |
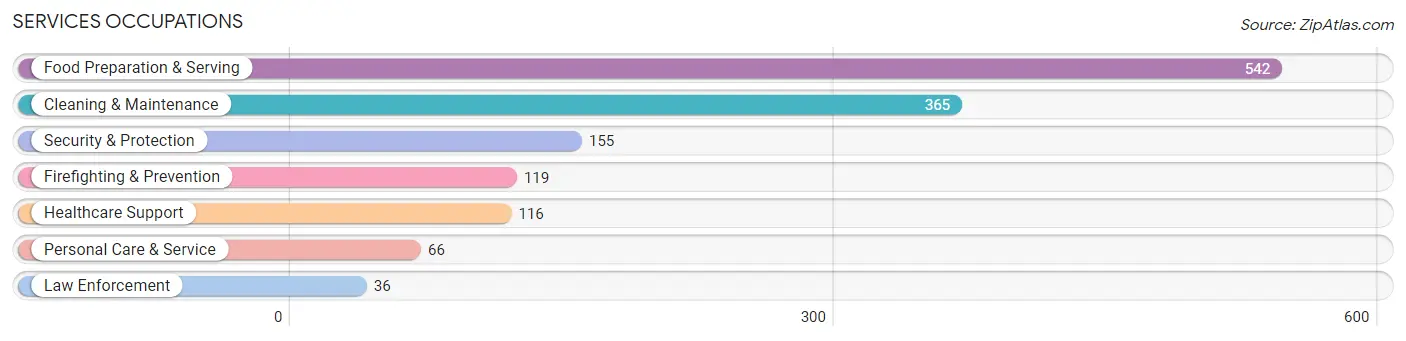
Services Occupations
The most common Services occupations in Seven Corners are Food Preparation & Serving (542 | 12.5%), Cleaning & Maintenance (365 | 8.4%), Security & Protection (155 | 3.6%), Firefighting & Prevention (119 | 2.7%), and Healthcare Support (116 | 2.7%).
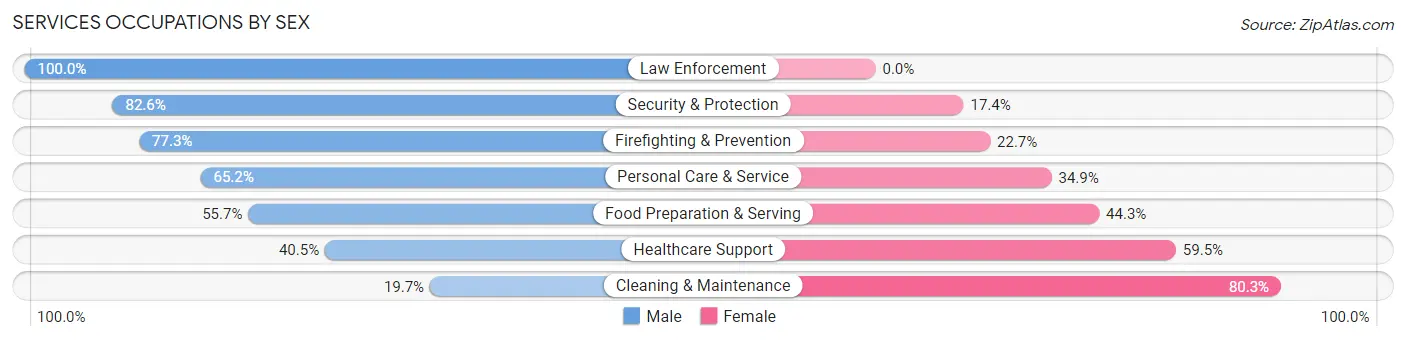
Services Occupations by Sex
Within the Services occupations in Seven Corners, the most male-oriented occupations are Law Enforcement (100.0%), Security & Protection (82.6%), and Firefighting & Prevention (77.3%), while the most female-oriented occupations are Cleaning & Maintenance (80.3%), Healthcare Support (59.5%), and Food Preparation & Serving (44.3%).
| Occupation | Male | Female |
| Healthcare Support | 47 (40.5%) | 69 (59.5%) |
| Security & Protection | 128 (82.6%) | 27 (17.4%) |
| Firefighting & Prevention | 92 (77.3%) | 27 (22.7%) |
| Law Enforcement | 36 (100.0%) | 0 (0.0%) |
| Food Preparation & Serving | 302 (55.7%) | 240 (44.3%) |
| Cleaning & Maintenance | 72 (19.7%) | 293 (80.3%) |
| Personal Care & Service | 43 (65.1%) | 23 (34.8%) |
| Total (Category) | 592 (47.6%) | 652 (52.4%) |
| Total (Overall) | 2,542 (58.6%) | 1,794 (41.4%) |
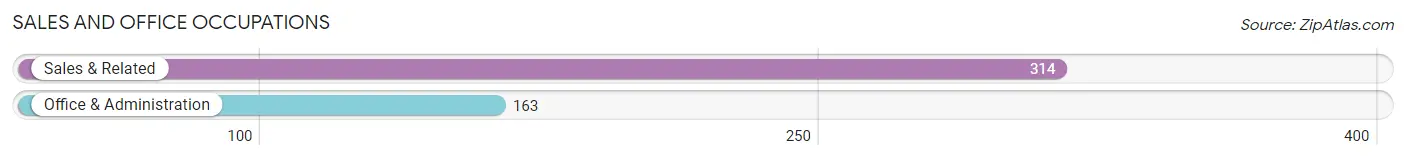
Sales and Office Occupations
The most common Sales and Office occupations in Seven Corners are Sales & Related (314 | 7.2%), and Office & Administration (163 | 3.8%).
Sales and Office Occupations by Sex
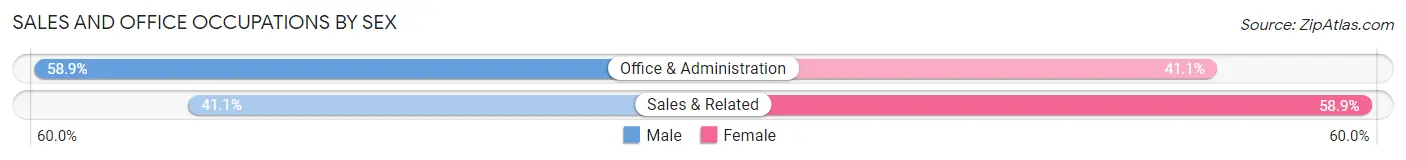
| Occupation | Male | Female |
| Sales & Related | 129 (41.1%) | 185 (58.9%) |
| Office & Administration | 96 (58.9%) | 67 (41.1%) |
| Total (Category) | 225 (47.2%) | 252 (52.8%) |
| Total (Overall) | 2,542 (58.6%) | 1,794 (41.4%) |
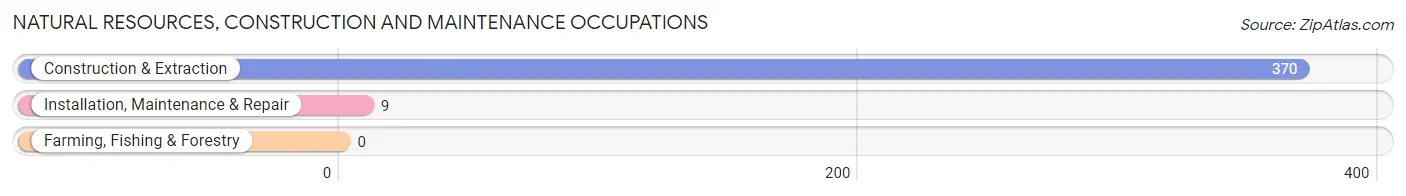
Natural Resources, Construction and Maintenance Occupations
The most common Natural Resources, Construction and Maintenance occupations in Seven Corners are Construction & Extraction (370 | 8.5%), and Installation, Maintenance & Repair (9 | 0.2%).
Natural Resources, Construction and Maintenance Occupations by Sex
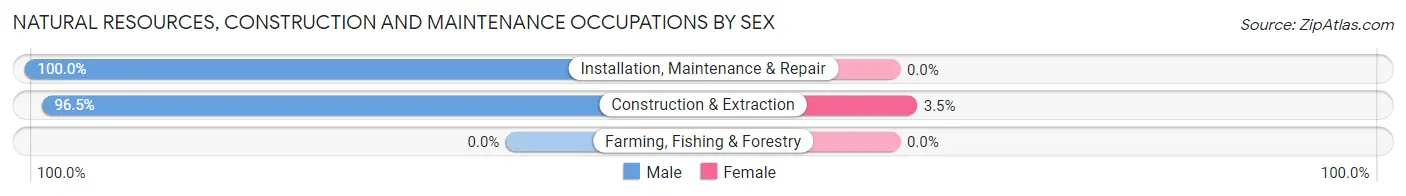
| Occupation | Male | Female |
| Farming, Fishing & Forestry | 0 (0.0%) | 0 (0.0%) |
| Construction & Extraction | 357 (96.5%) | 13 (3.5%) |
| Installation, Maintenance & Repair | 9 (100.0%) | 0 (0.0%) |
| Total (Category) | 366 (96.6%) | 13 (3.4%) |
| Total (Overall) | 2,542 (58.6%) | 1,794 (41.4%) |
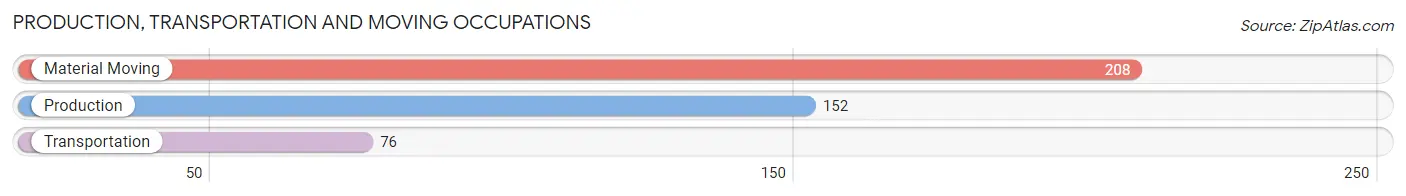
Production, Transportation and Moving Occupations
The most common Production, Transportation and Moving occupations in Seven Corners are Material Moving (208 | 4.8%), Production (152 | 3.5%), and Transportation (76 | 1.8%).
Production, Transportation and Moving Occupations by Sex
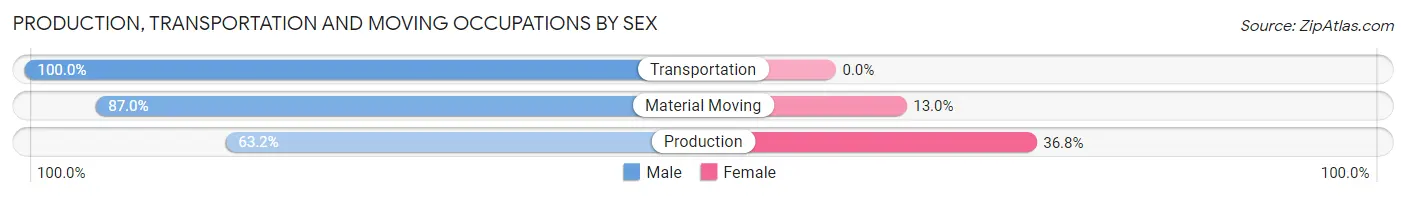
| Occupation | Male | Female |
| Production | 96 (63.2%) | 56 (36.8%) |
| Transportation | 76 (100.0%) | 0 (0.0%) |
| Material Moving | 181 (87.0%) | 27 (13.0%) |
| Total (Category) | 353 (81.0%) | 83 (19.0%) |
| Total (Overall) | 2,542 (58.6%) | 1,794 (41.4%) |
Employment Industries by Sex in Seven Corners
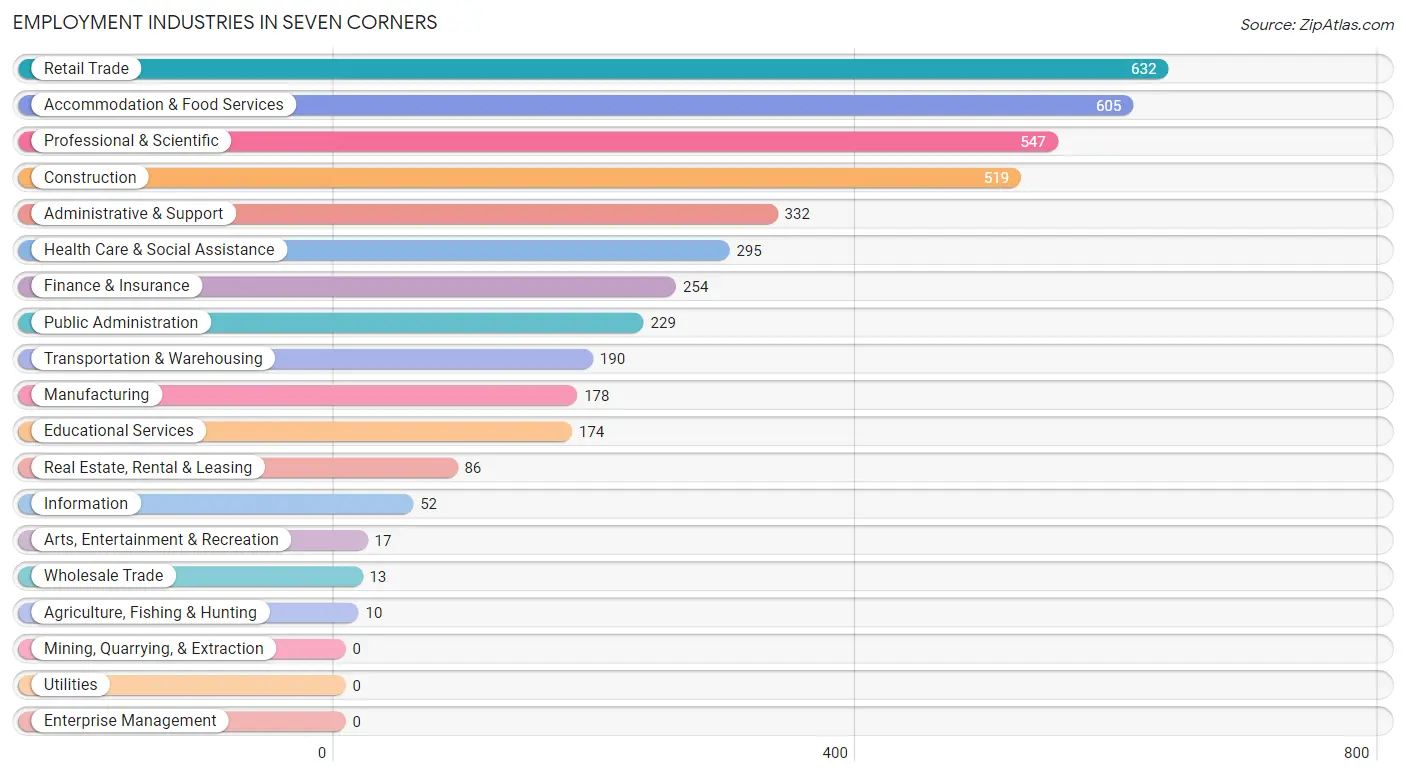
Employment Industries in Seven Corners
The major employment industries in Seven Corners include Retail Trade (632 | 14.6%), Accommodation & Food Services (605 | 14.0%), Professional & Scientific (547 | 12.6%), Construction (519 | 12.0%), and Administrative & Support (332 | 7.7%).
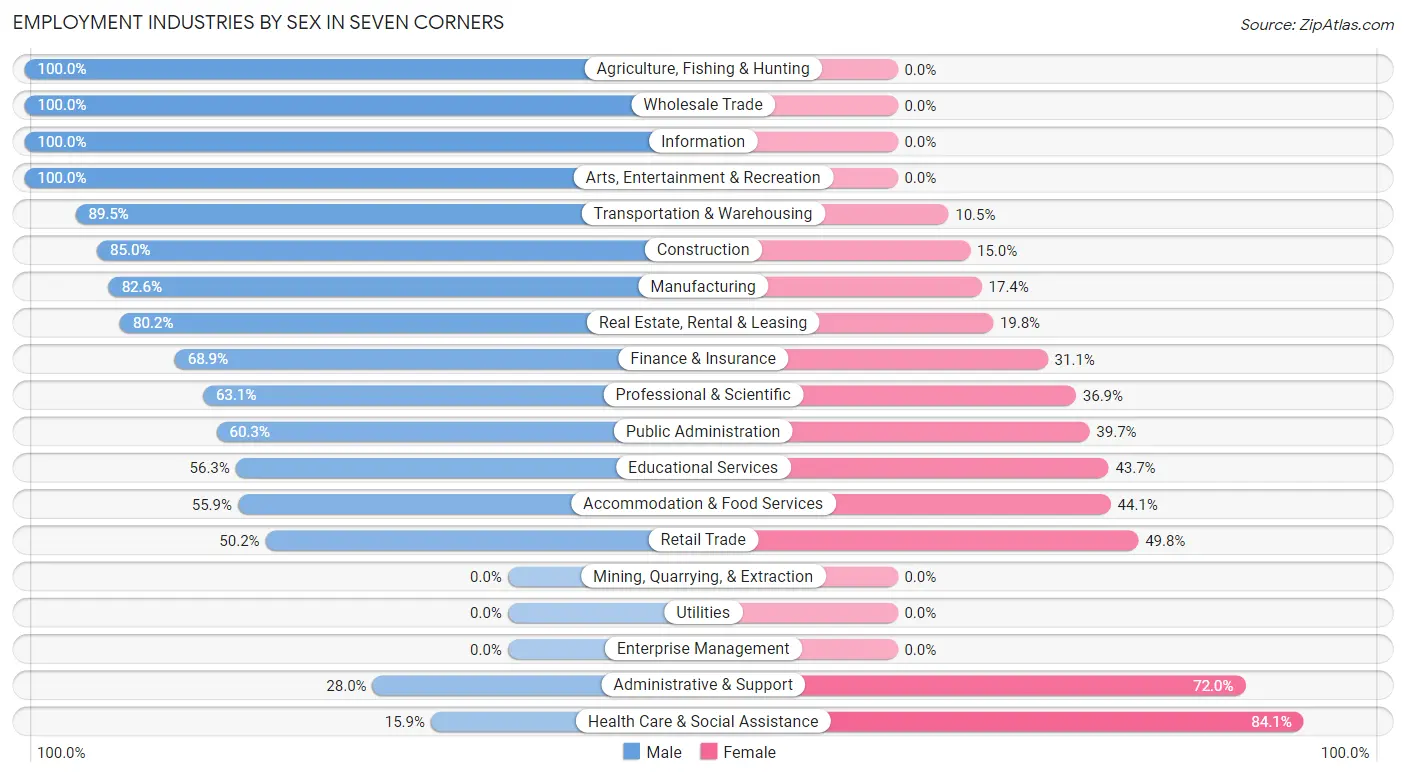
Employment Industries by Sex in Seven Corners
The Seven Corners industries that see more men than women are Agriculture, Fishing & Hunting (100.0%), Wholesale Trade (100.0%), and Information (100.0%), whereas the industries that tend to have a higher number of women are Health Care & Social Assistance (84.1%), Administrative & Support (72.0%), and Retail Trade (49.8%).
| Industry | Male | Female |
| Agriculture, Fishing & Hunting | 10 (100.0%) | 0 (0.0%) |
| Mining, Quarrying, & Extraction | 0 (0.0%) | 0 (0.0%) |
| Construction | 441 (85.0%) | 78 (15.0%) |
| Manufacturing | 147 (82.6%) | 31 (17.4%) |
| Wholesale Trade | 13 (100.0%) | 0 (0.0%) |
| Retail Trade | 317 (50.2%) | 315 (49.8%) |
| Transportation & Warehousing | 170 (89.5%) | 20 (10.5%) |
| Utilities | 0 (0.0%) | 0 (0.0%) |
| Information | 52 (100.0%) | 0 (0.0%) |
| Finance & Insurance | 175 (68.9%) | 79 (31.1%) |
| Real Estate, Rental & Leasing | 69 (80.2%) | 17 (19.8%) |
| Professional & Scientific | 345 (63.1%) | 202 (36.9%) |
| Enterprise Management | 0 (0.0%) | 0 (0.0%) |
| Administrative & Support | 93 (28.0%) | 239 (72.0%) |
| Educational Services | 98 (56.3%) | 76 (43.7%) |
| Health Care & Social Assistance | 47 (15.9%) | 248 (84.1%) |
| Arts, Entertainment & Recreation | 17 (100.0%) | 0 (0.0%) |
| Accommodation & Food Services | 338 (55.9%) | 267 (44.1%) |
| Public Administration | 138 (60.3%) | 91 (39.7%) |
| Total | 2,542 (58.6%) | 1,794 (41.4%) |
Education in Seven Corners
School Enrollment in Seven Corners
The most common levels of schooling among the 1,901 students in Seven Corners are middle school (527 | 27.7%), elementary school (388 | 20.4%), and college / undergraduate (346 | 18.2%).
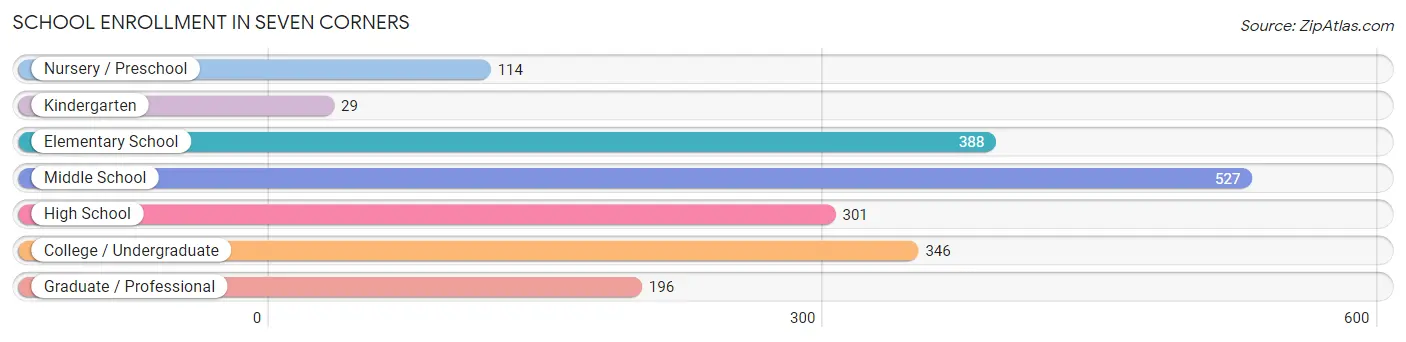
| School Level | # Students | % Students |
| Nursery / Preschool | 114 | 6.0% |
| Kindergarten | 29 | 1.5% |
| Elementary School | 388 | 20.4% |
| Middle School | 527 | 27.7% |
| High School | 301 | 15.8% |
| College / Undergraduate | 346 | 18.2% |
| Graduate / Professional | 196 | 10.3% |
| Total | 1,901 | 100.0% |
School Enrollment by Age by Funding Source in Seven Corners
Out of a total of 1,901 students who are enrolled in schools in Seven Corners, 462 (24.3%) attend a private institution, while the remaining 1,439 (75.7%) are enrolled in public schools. The age group of 3 to 4 year olds has the highest likelihood of being enrolled in private schools, with 44 (67.7% in the age bracket) enrolled. Conversely, the age group of 18 to 19 year olds has the lowest likelihood of being enrolled in a private school, with 28 (100.0% in the age bracket) attending a public institution.
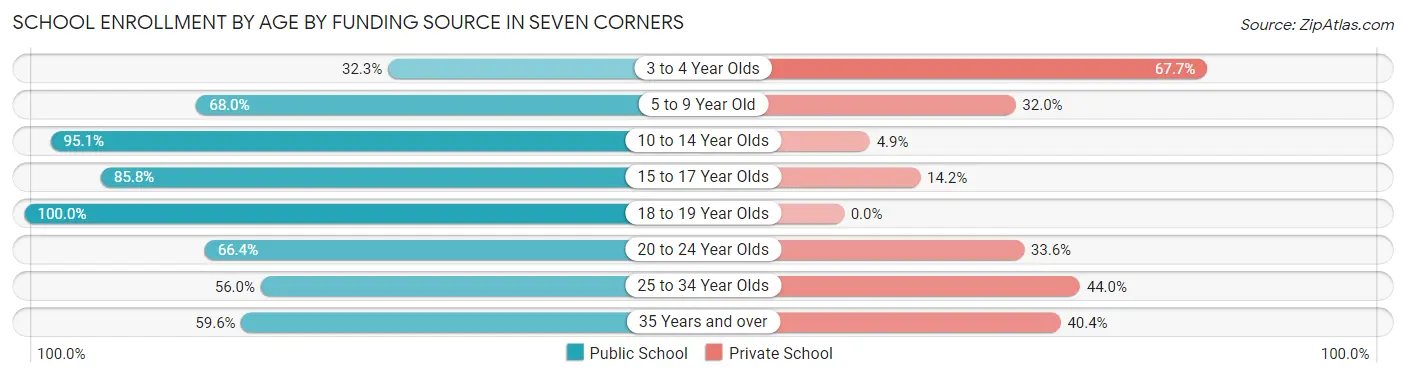
| Age Bracket | Public School | Private School |
| 3 to 4 Year Olds | 21 (32.3%) | 44 (67.7%) |
| 5 to 9 Year Old | 253 (68.0%) | 119 (32.0%) |
| 10 to 14 Year Olds | 607 (95.1%) | 31 (4.9%) |
| 15 to 17 Year Olds | 181 (85.8%) | 30 (14.2%) |
| 18 to 19 Year Olds | 28 (100.0%) | 0 (0.0%) |
| 20 to 24 Year Olds | 93 (66.4%) | 47 (33.6%) |
| 25 to 34 Year Olds | 163 (56.0%) | 128 (44.0%) |
| 35 Years and over | 93 (59.6%) | 63 (40.4%) |
| Total | 1,439 (75.7%) | 462 (24.3%) |
Educational Attainment by Field of Study in Seven Corners
Business (431 | 16.6%), social sciences (396 | 15.2%), engineering (279 | 10.7%), computers & mathematics (261 | 10.0%), and literature & languages (175 | 6.7%) are the most common fields of study among 2,605 individuals in Seven Corners who have obtained a bachelor's degree or higher.
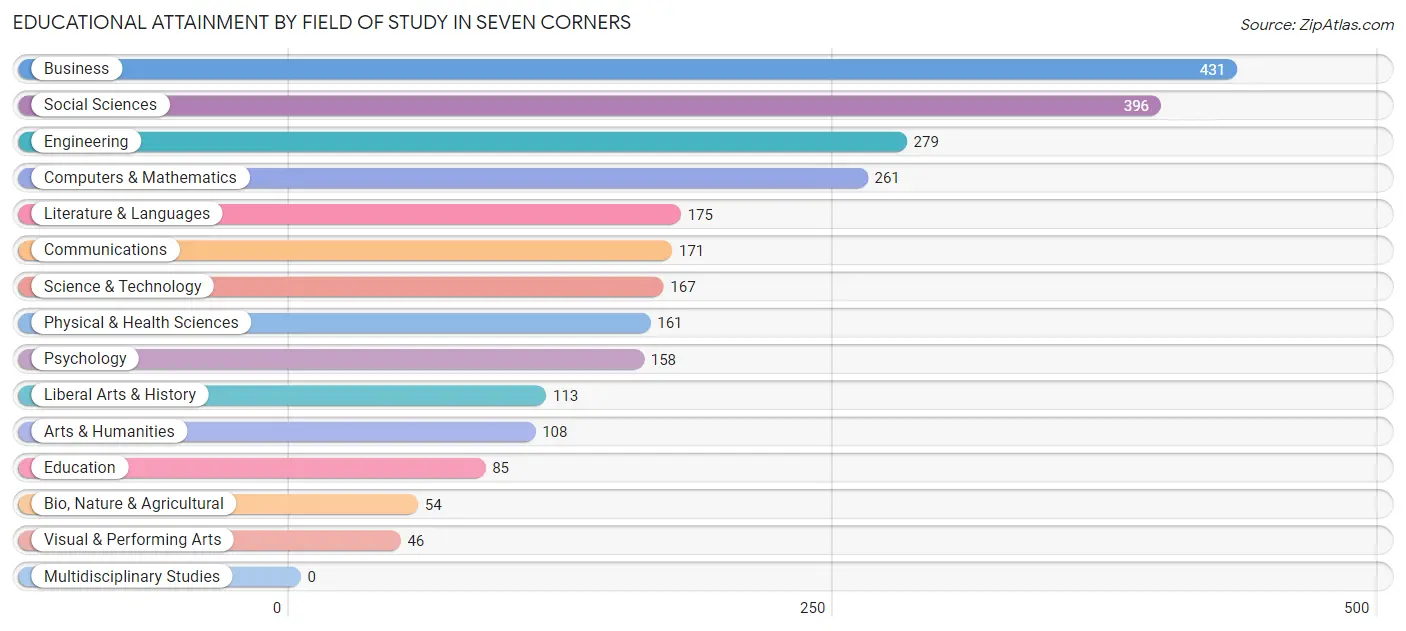
| Field of Study | # Graduates | % Graduates |
| Computers & Mathematics | 261 | 10.0% |
| Bio, Nature & Agricultural | 54 | 2.1% |
| Physical & Health Sciences | 161 | 6.2% |
| Psychology | 158 | 6.1% |
| Social Sciences | 396 | 15.2% |
| Engineering | 279 | 10.7% |
| Multidisciplinary Studies | 0 | 0.0% |
| Science & Technology | 167 | 6.4% |
| Business | 431 | 16.6% |
| Education | 85 | 3.3% |
| Literature & Languages | 175 | 6.7% |
| Liberal Arts & History | 113 | 4.3% |
| Visual & Performing Arts | 46 | 1.8% |
| Communications | 171 | 6.6% |
| Arts & Humanities | 108 | 4.2% |
| Total | 2,605 | 100.0% |
Transportation & Commute in Seven Corners
Vehicle Availability by Sex in Seven Corners
The most prevalent vehicle ownership categories in Seven Corners are males with 2 vehicles (874, accounting for 36.5%) and females with 2 vehicles (522, making up 48.5%).
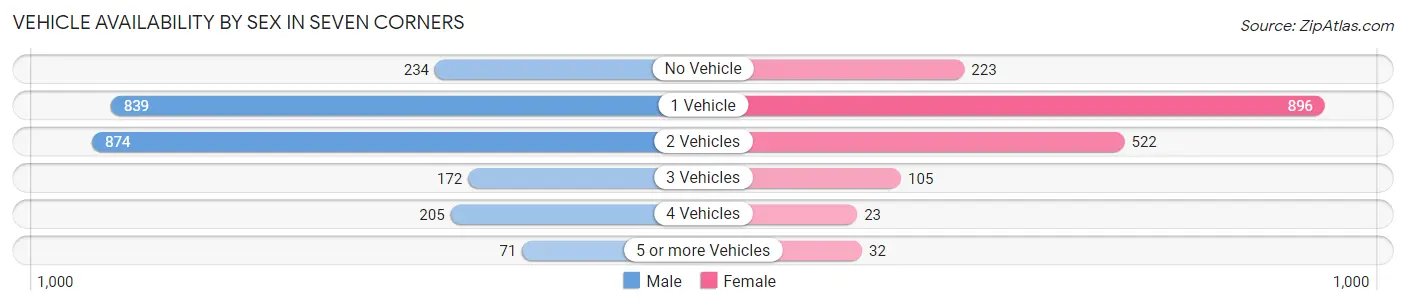
| Vehicles Available | Male | Female |
| No Vehicle | 234 (9.8%) | 223 (12.4%) |
| 1 Vehicle | 839 (35.0%) | 896 (49.7%) |
| 2 Vehicles | 874 (36.5%) | 522 (29.0%) |
| 3 Vehicles | 172 (7.2%) | 105 (5.8%) |
| 4 Vehicles | 205 (8.6%) | 23 (1.3%) |
| 5 or more Vehicles | 71 (3.0%) | 32 (1.8%) |
| Total | 2,395 (100.0%) | 1,801 (100.0%) |
Commute Time in Seven Corners
The most frequently occuring commute durations in Seven Corners are 30 to 34 minutes (717 commuters, 20.4%), 20 to 24 minutes (558 commuters, 15.9%), and 5 to 9 minutes (409 commuters, 11.7%).
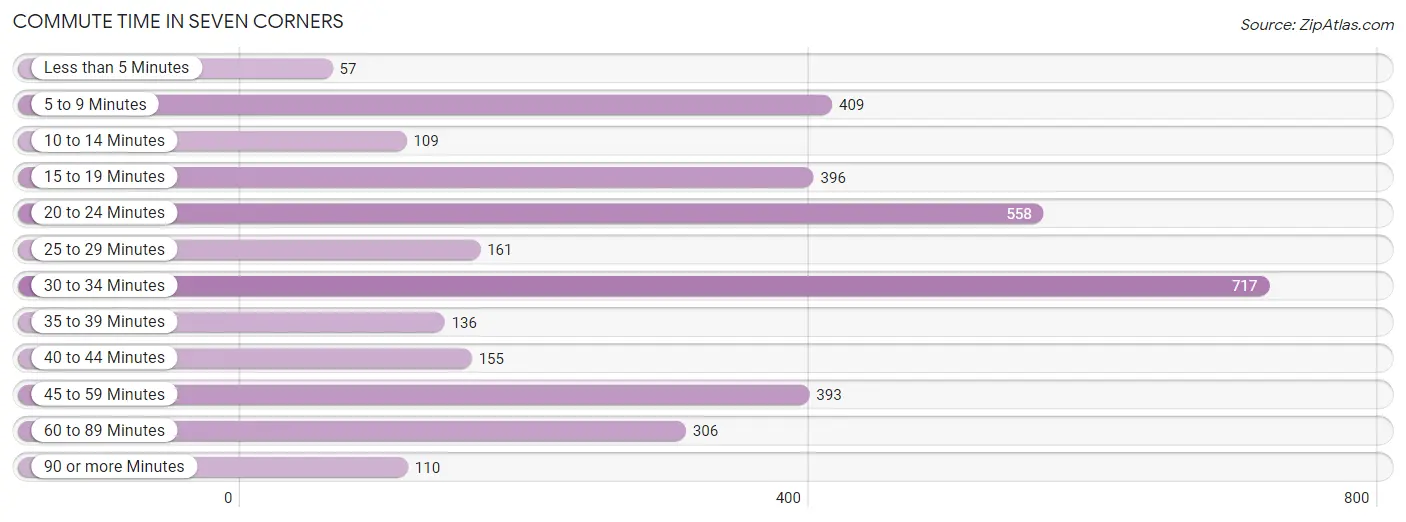
| Commute Time | # Commuters | % Commuters |
| Less than 5 Minutes | 57 | 1.6% |
| 5 to 9 Minutes | 409 | 11.7% |
| 10 to 14 Minutes | 109 | 3.1% |
| 15 to 19 Minutes | 396 | 11.3% |
| 20 to 24 Minutes | 558 | 15.9% |
| 25 to 29 Minutes | 161 | 4.6% |
| 30 to 34 Minutes | 717 | 20.4% |
| 35 to 39 Minutes | 136 | 3.9% |
| 40 to 44 Minutes | 155 | 4.4% |
| 45 to 59 Minutes | 393 | 11.2% |
| 60 to 89 Minutes | 306 | 8.7% |
| 90 or more Minutes | 110 | 3.1% |
Commute Time by Sex in Seven Corners
The most common commute times in Seven Corners are 30 to 34 minutes (464 commuters, 24.3%) for males and 5 to 9 minutes (258 commuters, 16.2%) for females.
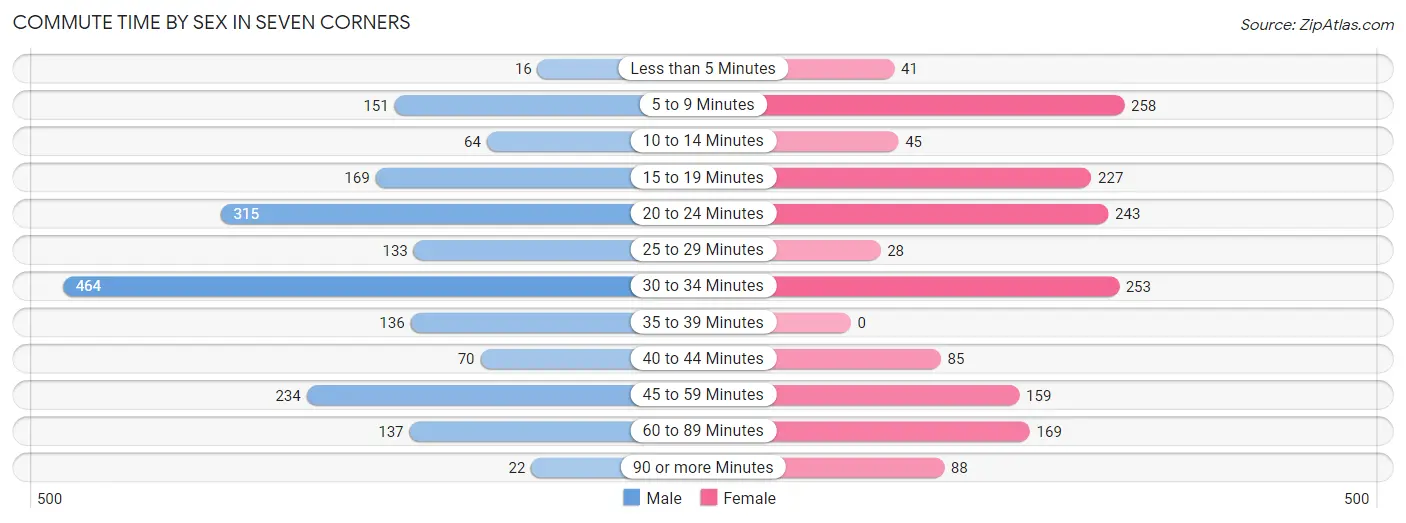
| Commute Time | Male | Female |
| Less than 5 Minutes | 16 (0.8%) | 41 (2.6%) |
| 5 to 9 Minutes | 151 (7.9%) | 258 (16.2%) |
| 10 to 14 Minutes | 64 (3.4%) | 45 (2.8%) |
| 15 to 19 Minutes | 169 (8.8%) | 227 (14.2%) |
| 20 to 24 Minutes | 315 (16.5%) | 243 (15.2%) |
| 25 to 29 Minutes | 133 (7.0%) | 28 (1.8%) |
| 30 to 34 Minutes | 464 (24.3%) | 253 (15.9%) |
| 35 to 39 Minutes | 136 (7.1%) | 0 (0.0%) |
| 40 to 44 Minutes | 70 (3.7%) | 85 (5.3%) |
| 45 to 59 Minutes | 234 (12.2%) | 159 (10.0%) |
| 60 to 89 Minutes | 137 (7.2%) | 169 (10.6%) |
| 90 or more Minutes | 22 (1.1%) | 88 (5.5%) |
Time of Departure to Work by Sex in Seven Corners
The most frequent times of departure to work in Seven Corners are 7:00 AM to 7:29 AM (458, 24.0%) for males and 7:30 AM to 7:59 AM (342, 21.4%) for females.
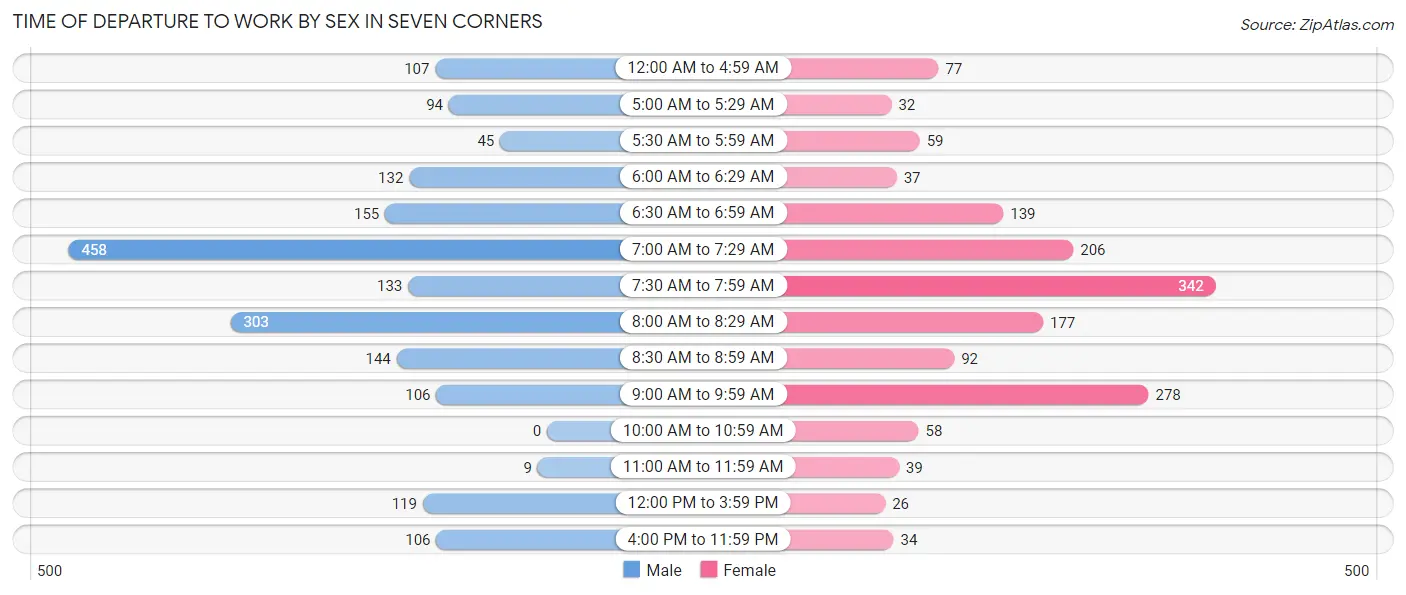
| Time of Departure | Male | Female |
| 12:00 AM to 4:59 AM | 107 (5.6%) | 77 (4.8%) |
| 5:00 AM to 5:29 AM | 94 (4.9%) | 32 (2.0%) |
| 5:30 AM to 5:59 AM | 45 (2.4%) | 59 (3.7%) |
| 6:00 AM to 6:29 AM | 132 (6.9%) | 37 (2.3%) |
| 6:30 AM to 6:59 AM | 155 (8.1%) | 139 (8.7%) |
| 7:00 AM to 7:29 AM | 458 (24.0%) | 206 (12.9%) |
| 7:30 AM to 7:59 AM | 133 (7.0%) | 342 (21.4%) |
| 8:00 AM to 8:29 AM | 303 (15.9%) | 177 (11.1%) |
| 8:30 AM to 8:59 AM | 144 (7.5%) | 92 (5.8%) |
| 9:00 AM to 9:59 AM | 106 (5.6%) | 278 (17.4%) |
| 10:00 AM to 10:59 AM | 0 (0.0%) | 58 (3.6%) |
| 11:00 AM to 11:59 AM | 9 (0.5%) | 39 (2.4%) |
| 12:00 PM to 3:59 PM | 119 (6.2%) | 26 (1.6%) |
| 4:00 PM to 11:59 PM | 106 (5.6%) | 34 (2.1%) |
| Total | 1,911 (100.0%) | 1,596 (100.0%) |
Housing Occupancy in Seven Corners
Occupancy by Ownership in Seven Corners
Of the total 3,577 dwellings in Seven Corners, owner-occupied units account for 1,391 (38.9%), while renter-occupied units make up 2,186 (61.1%).
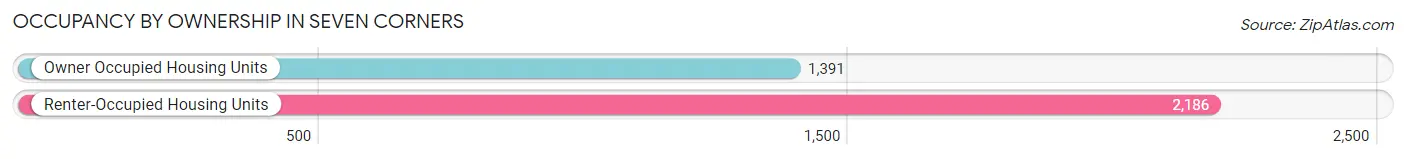
| Occupancy | # Housing Units | % Housing Units |
| Owner Occupied Housing Units | 1,391 | 38.9% |
| Renter-Occupied Housing Units | 2,186 | 61.1% |
| Total Occupied Housing Units | 3,577 | 100.0% |
Occupancy by Household Size in Seven Corners
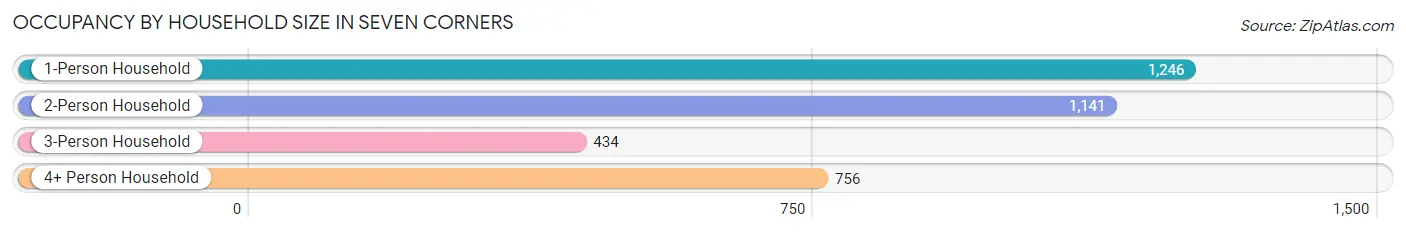
| Household Size | # Housing Units | % Housing Units |
| 1-Person Household | 1,246 | 34.8% |
| 2-Person Household | 1,141 | 31.9% |
| 3-Person Household | 434 | 12.1% |
| 4+ Person Household | 756 | 21.1% |
| Total Housing Units | 3,577 | 100.0% |
Occupancy by Ownership by Household Size in Seven Corners
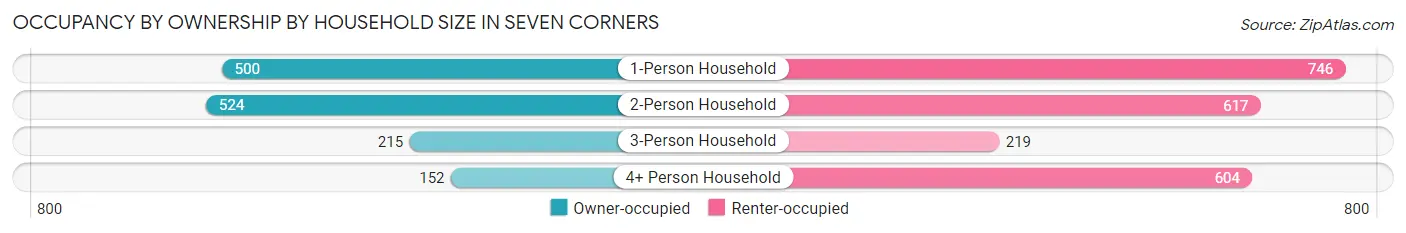
| Household Size | Owner-occupied | Renter-occupied |
| 1-Person Household | 500 (40.1%) | 746 (59.9%) |
| 2-Person Household | 524 (45.9%) | 617 (54.1%) |
| 3-Person Household | 215 (49.5%) | 219 (50.5%) |
| 4+ Person Household | 152 (20.1%) | 604 (79.9%) |
| Total Housing Units | 1,391 (38.9%) | 2,186 (61.1%) |
Occupancy by Educational Attainment in Seven Corners
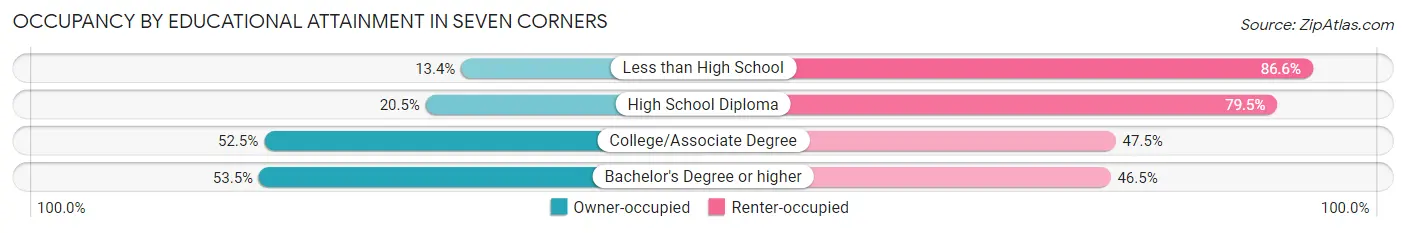
| Household Size | Owner-occupied | Renter-occupied |
| Less than High School | 123 (13.4%) | 792 (86.6%) |
| High School Diploma | 93 (20.5%) | 361 (79.5%) |
| College/Associate Degree | 365 (52.5%) | 330 (47.5%) |
| Bachelor's Degree or higher | 810 (53.5%) | 703 (46.5%) |
Occupancy by Age of Householder in Seven Corners
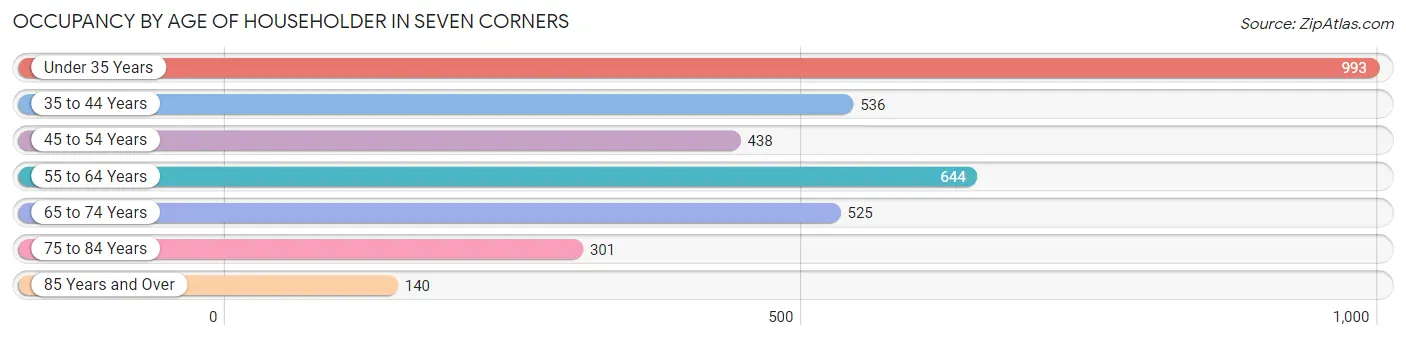
| Age Bracket | # Households | % Households |
| Under 35 Years | 993 | 27.8% |
| 35 to 44 Years | 536 | 15.0% |
| 45 to 54 Years | 438 | 12.2% |
| 55 to 64 Years | 644 | 18.0% |
| 65 to 74 Years | 525 | 14.7% |
| 75 to 84 Years | 301 | 8.4% |
| 85 Years and Over | 140 | 3.9% |
| Total | 3,577 | 100.0% |
Housing Finances in Seven Corners
Median Income by Occupancy in Seven Corners
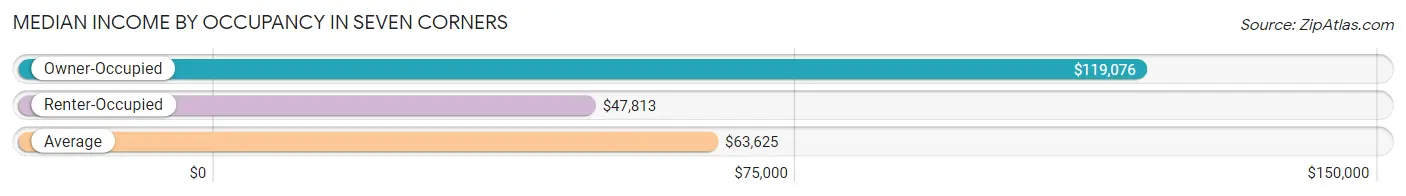
| Occupancy Type | # Households | Median Income |
| Owner-Occupied | 1,391 (38.9%) | $119,076 |
| Renter-Occupied | 2,186 (61.1%) | $47,813 |
| Average | 3,577 (100.0%) | $63,625 |
Occupancy by Householder Income Bracket in Seven Corners
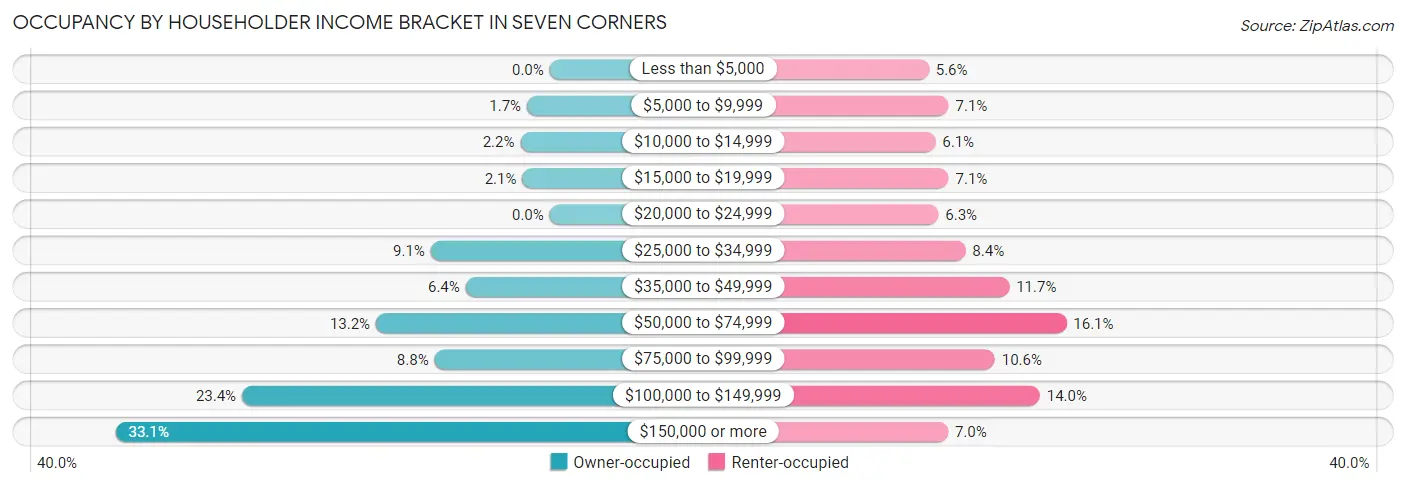
| Income Bracket | Owner-occupied | Renter-occupied |
| Less than $5,000 | 0 (0.0%) | 122 (5.6%) |
| $5,000 to $9,999 | 24 (1.7%) | 155 (7.1%) |
| $10,000 to $14,999 | 31 (2.2%) | 133 (6.1%) |
| $15,000 to $19,999 | 29 (2.1%) | 155 (7.1%) |
| $20,000 to $24,999 | 0 (0.0%) | 138 (6.3%) |
| $25,000 to $34,999 | 126 (9.1%) | 183 (8.4%) |
| $35,000 to $49,999 | 89 (6.4%) | 256 (11.7%) |
| $50,000 to $74,999 | 184 (13.2%) | 351 (16.1%) |
| $75,000 to $99,999 | 122 (8.8%) | 232 (10.6%) |
| $100,000 to $149,999 | 326 (23.4%) | 307 (14.0%) |
| $150,000 or more | 460 (33.1%) | 154 (7.0%) |
| Total | 1,391 (100.0%) | 2,186 (100.0%) |
Monthly Housing Cost Tiers in Seven Corners
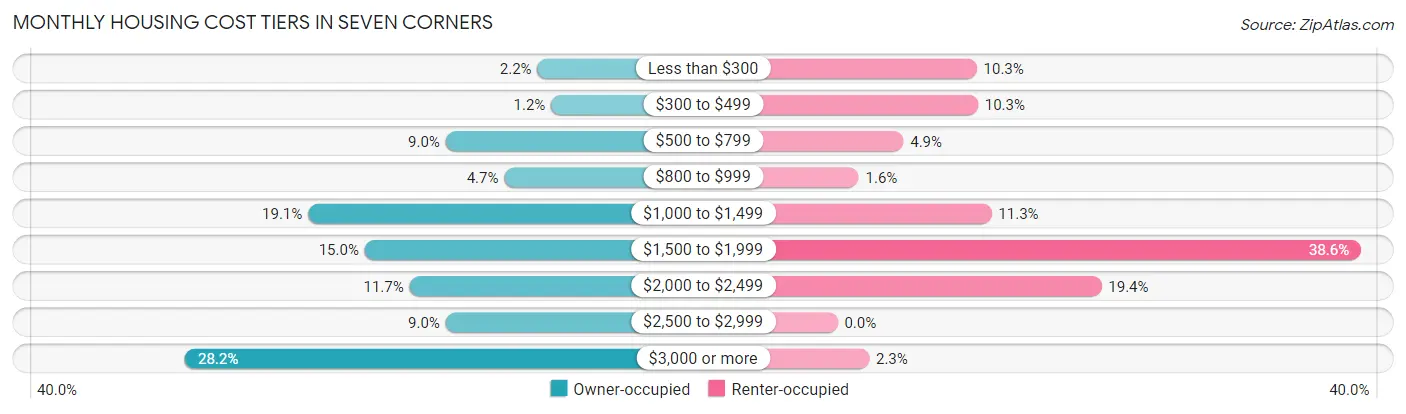
| Monthly Cost | Owner-occupied | Renter-occupied |
| Less than $300 | 31 (2.2%) | 224 (10.2%) |
| $300 to $499 | 17 (1.2%) | 226 (10.3%) |
| $500 to $799 | 125 (9.0%) | 106 (4.9%) |
| $800 to $999 | 65 (4.7%) | 34 (1.6%) |
| $1,000 to $1,499 | 266 (19.1%) | 248 (11.3%) |
| $1,500 to $1,999 | 208 (14.9%) | 843 (38.6%) |
| $2,000 to $2,499 | 162 (11.7%) | 425 (19.4%) |
| $2,500 to $2,999 | 125 (9.0%) | 0 (0.0%) |
| $3,000 or more | 392 (28.2%) | 51 (2.3%) |
| Total | 1,391 (100.0%) | 2,186 (100.0%) |
Physical Housing Characteristics in Seven Corners
Housing Structures in Seven Corners
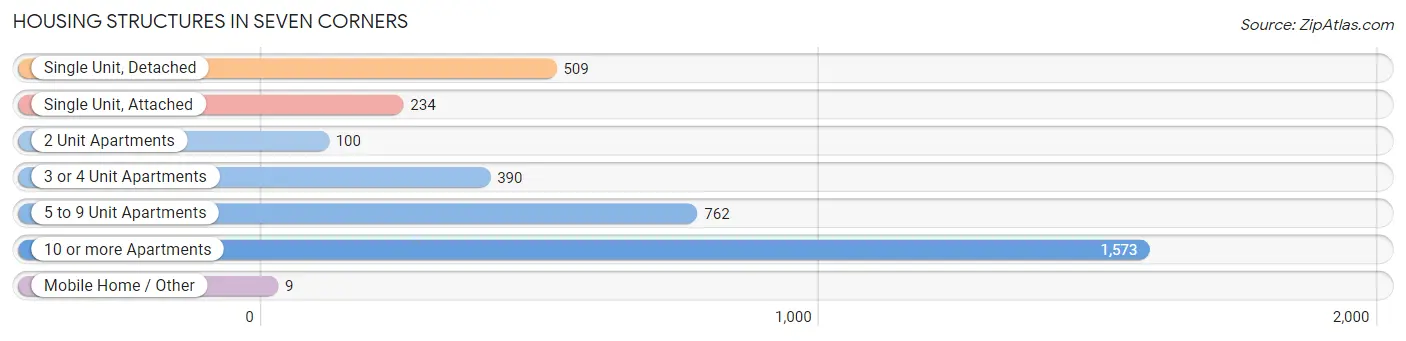
| Structure Type | # Housing Units | % Housing Units |
| Single Unit, Detached | 509 | 14.2% |
| Single Unit, Attached | 234 | 6.5% |
| 2 Unit Apartments | 100 | 2.8% |
| 3 or 4 Unit Apartments | 390 | 10.9% |
| 5 to 9 Unit Apartments | 762 | 21.3% |
| 10 or more Apartments | 1,573 | 44.0% |
| Mobile Home / Other | 9 | 0.3% |
| Total | 3,577 | 100.0% |
Housing Structures by Occupancy in Seven Corners
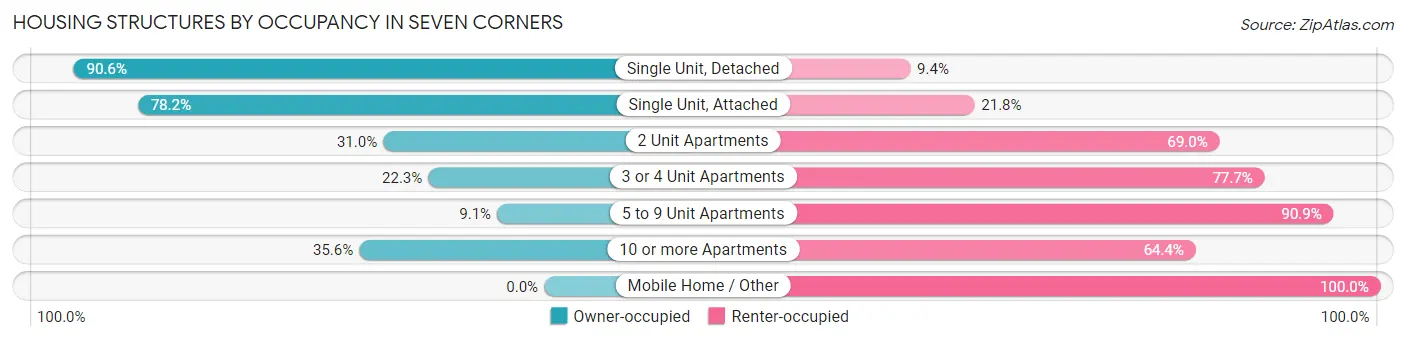
| Structure Type | Owner-occupied | Renter-occupied |
| Single Unit, Detached | 461 (90.6%) | 48 (9.4%) |
| Single Unit, Attached | 183 (78.2%) | 51 (21.8%) |
| 2 Unit Apartments | 31 (31.0%) | 69 (69.0%) |
| 3 or 4 Unit Apartments | 87 (22.3%) | 303 (77.7%) |
| 5 to 9 Unit Apartments | 69 (9.1%) | 693 (90.9%) |
| 10 or more Apartments | 560 (35.6%) | 1,013 (64.4%) |
| Mobile Home / Other | 0 (0.0%) | 9 (100.0%) |
| Total | 1,391 (38.9%) | 2,186 (61.1%) |
Housing Structures by Number of Rooms in Seven Corners
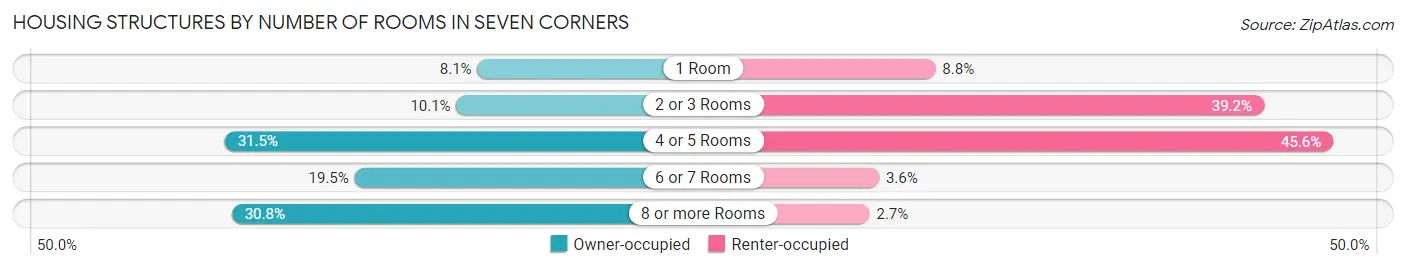
| Number of Rooms | Owner-occupied | Renter-occupied |
| 1 Room | 113 (8.1%) | 193 (8.8%) |
| 2 or 3 Rooms | 140 (10.1%) | 857 (39.2%) |
| 4 or 5 Rooms | 438 (31.5%) | 997 (45.6%) |
| 6 or 7 Rooms | 271 (19.5%) | 79 (3.6%) |
| 8 or more Rooms | 429 (30.8%) | 60 (2.7%) |
| Total | 1,391 (100.0%) | 2,186 (100.0%) |
Housing Structure by Heating Type in Seven Corners
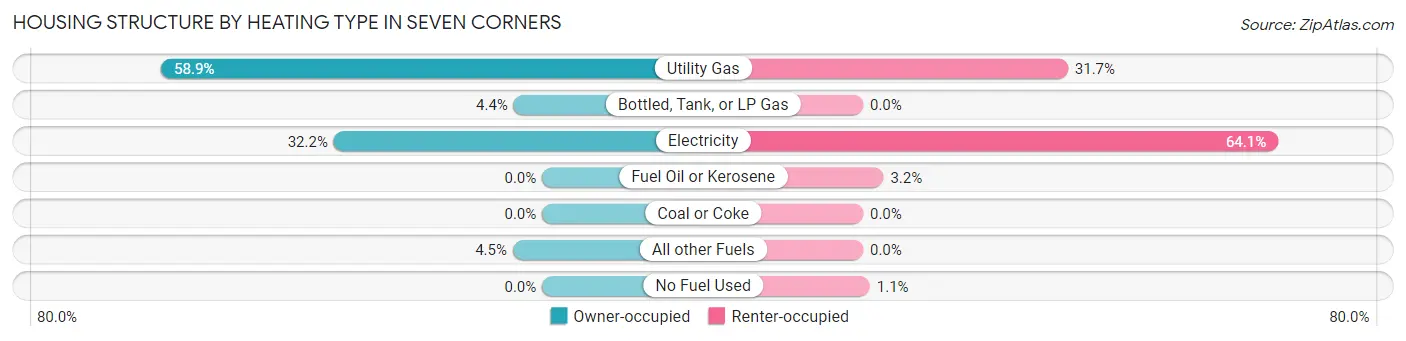
| Heating Type | Owner-occupied | Renter-occupied |
| Utility Gas | 819 (58.9%) | 692 (31.7%) |
| Bottled, Tank, or LP Gas | 61 (4.4%) | 0 (0.0%) |
| Electricity | 448 (32.2%) | 1,402 (64.1%) |
| Fuel Oil or Kerosene | 0 (0.0%) | 69 (3.2%) |
| Coal or Coke | 0 (0.0%) | 0 (0.0%) |
| All other Fuels | 63 (4.5%) | 0 (0.0%) |
| No Fuel Used | 0 (0.0%) | 23 (1.1%) |
| Total | 1,391 (100.0%) | 2,186 (100.0%) |
Household Vehicle Usage in Seven Corners
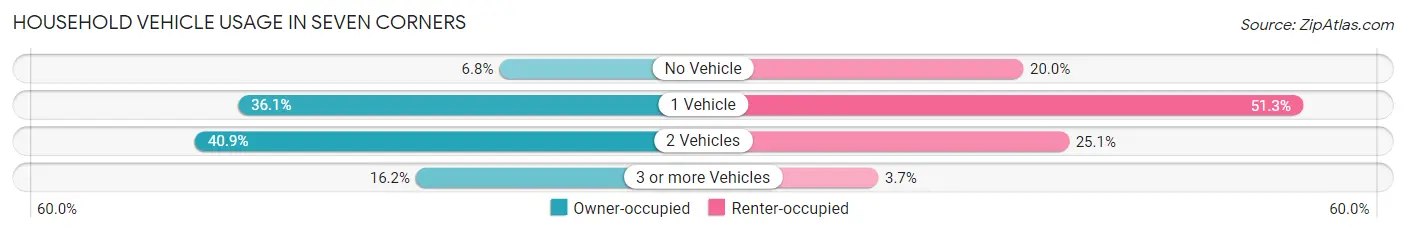
| Vehicles per Household | Owner-occupied | Renter-occupied |
| No Vehicle | 95 (6.8%) | 436 (20.0%) |
| 1 Vehicle | 502 (36.1%) | 1,121 (51.3%) |
| 2 Vehicles | 569 (40.9%) | 548 (25.1%) |
| 3 or more Vehicles | 225 (16.2%) | 81 (3.7%) |
| Total | 1,391 (100.0%) | 2,186 (100.0%) |
Real Estate & Mortgages in Seven Corners
Real Estate and Mortgage Overview in Seven Corners
| Characteristic | Without Mortgage | With Mortgage |
| Housing Units | 458 | 933 |
| Median Property Value | $284,500 | $561,200 |
| Median Household Income | $87,778 | $423 |
| Monthly Housing Costs | $976 | $392 |
| Real Estate Taxes | $3,714 | $40 |
Property Value by Mortgage Status in Seven Corners
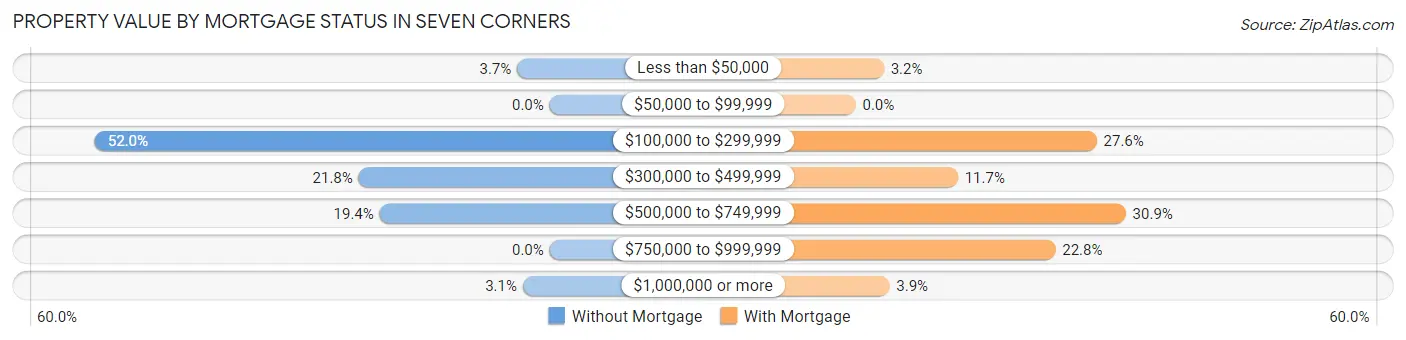
| Property Value | Without Mortgage | With Mortgage |
| Less than $50,000 | 17 (3.7%) | 30 (3.2%) |
| $50,000 to $99,999 | 0 (0.0%) | 0 (0.0%) |
| $100,000 to $299,999 | 238 (52.0%) | 257 (27.6%) |
| $300,000 to $499,999 | 100 (21.8%) | 109 (11.7%) |
| $500,000 to $749,999 | 89 (19.4%) | 288 (30.9%) |
| $750,000 to $999,999 | 0 (0.0%) | 213 (22.8%) |
| $1,000,000 or more | 14 (3.1%) | 36 (3.9%) |
| Total | 458 (100.0%) | 933 (100.0%) |
Household Income by Mortgage Status in Seven Corners
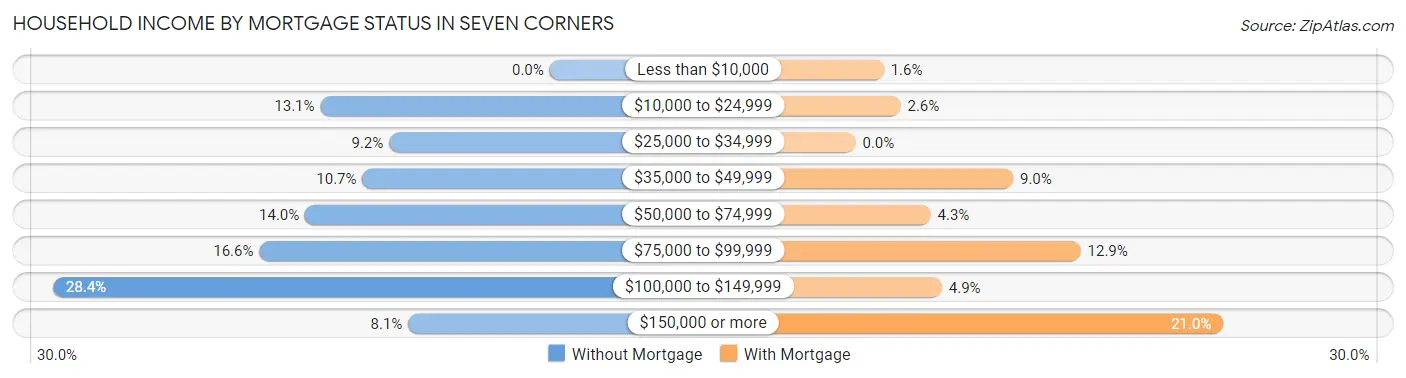
| Household Income | Without Mortgage | With Mortgage |
| Less than $10,000 | 0 (0.0%) | 15 (1.6%) |
| $10,000 to $24,999 | 60 (13.1%) | 24 (2.6%) |
| $25,000 to $34,999 | 42 (9.2%) | 0 (0.0%) |
| $35,000 to $49,999 | 49 (10.7%) | 84 (9.0%) |
| $50,000 to $74,999 | 64 (14.0%) | 40 (4.3%) |
| $75,000 to $99,999 | 76 (16.6%) | 120 (12.9%) |
| $100,000 to $149,999 | 130 (28.4%) | 46 (4.9%) |
| $150,000 or more | 37 (8.1%) | 196 (21.0%) |
| Total | 458 (100.0%) | 933 (100.0%) |
Property Value to Household Income Ratio in Seven Corners
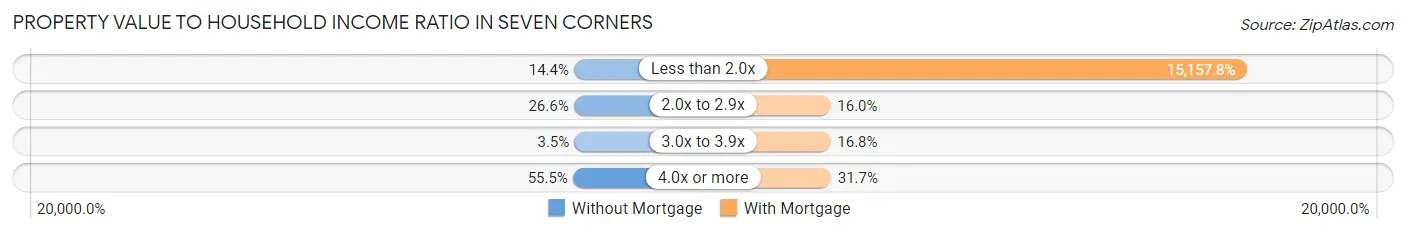
| Value-to-Income Ratio | Without Mortgage | With Mortgage |
| Less than 2.0x | 66 (14.4%) | 141,422 (15,157.8%) |
| 2.0x to 2.9x | 122 (26.6%) | 149 (16.0%) |
| 3.0x to 3.9x | 16 (3.5%) | 157 (16.8%) |
| 4.0x or more | 254 (55.5%) | 296 (31.7%) |
| Total | 458 (100.0%) | 933 (100.0%) |
Real Estate Taxes by Mortgage Status in Seven Corners
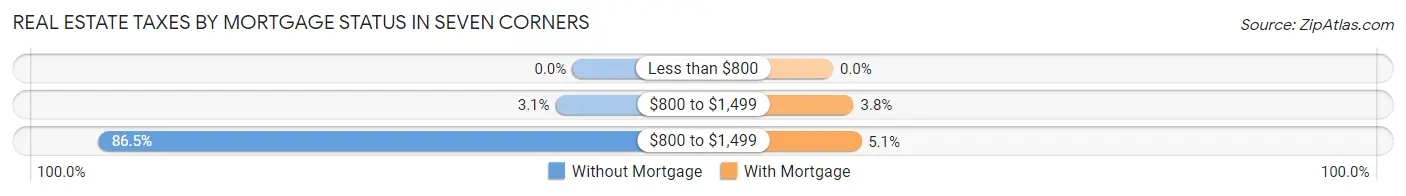
| Property Taxes | Without Mortgage | With Mortgage |
| Less than $800 | 0 (0.0%) | 0 (0.0%) |
| $800 to $1,499 | 14 (3.1%) | 35 (3.7%) |
| $800 to $1,499 | 396 (86.5%) | 48 (5.1%) |
| Total | 458 (100.0%) | 933 (100.0%) |
Health & Disability in Seven Corners
Health Insurance Coverage by Age in Seven Corners
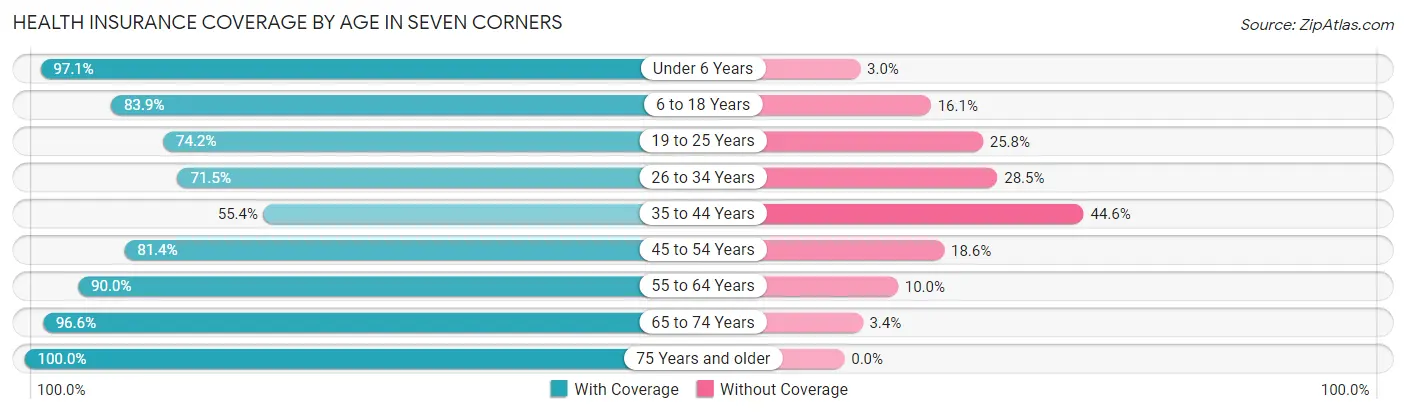
| Age Bracket | With Coverage | Without Coverage |
| Under 6 Years | 887 (97.1%) | 27 (2.9%) |
| 6 to 18 Years | 1,098 (83.9%) | 211 (16.1%) |
| 19 to 25 Years | 649 (74.2%) | 226 (25.8%) |
| 26 to 34 Years | 1,150 (71.5%) | 459 (28.5%) |
| 35 to 44 Years | 642 (55.4%) | 517 (44.6%) |
| 45 to 54 Years | 617 (81.4%) | 141 (18.6%) |
| 55 to 64 Years | 839 (90.0%) | 93 (10.0%) |
| 65 to 74 Years | 827 (96.6%) | 29 (3.4%) |
| 75 Years and older | 662 (100.0%) | 0 (0.0%) |
| Total | 7,371 (81.2%) | 1,703 (18.8%) |
Health Insurance Coverage by Citizenship Status in Seven Corners
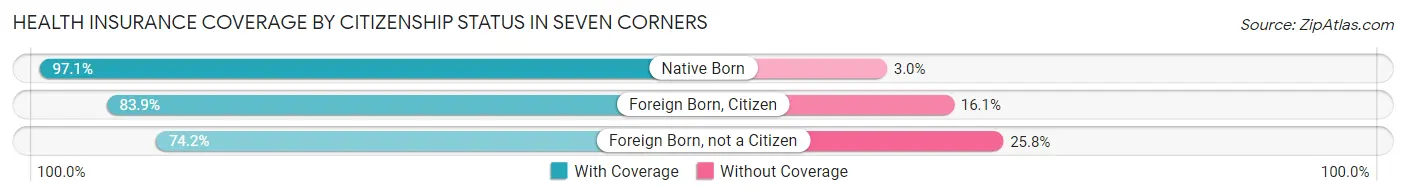
| Citizenship Status | With Coverage | Without Coverage |
| Native Born | 887 (97.1%) | 27 (2.9%) |
| Foreign Born, Citizen | 1,098 (83.9%) | 211 (16.1%) |
| Foreign Born, not a Citizen | 649 (74.2%) | 226 (25.8%) |
Health Insurance Coverage by Household Income in Seven Corners
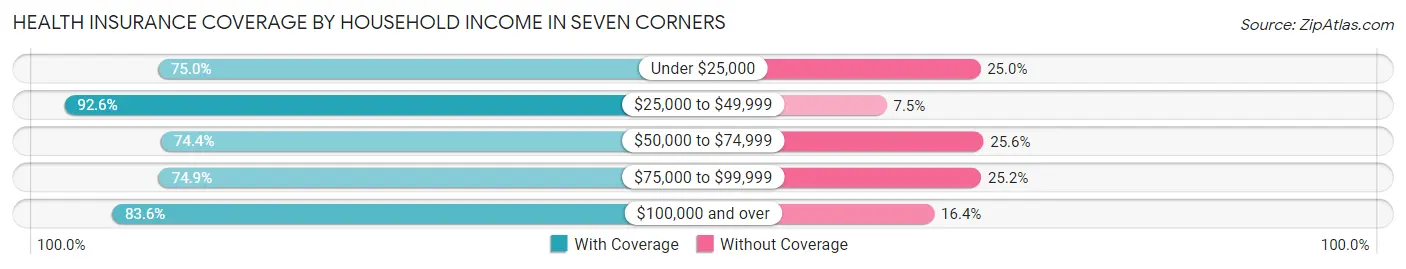
| Household Income | With Coverage | Without Coverage |
| Under $25,000 | 1,245 (75.0%) | 415 (25.0%) |
| $25,000 to $49,999 | 1,591 (92.5%) | 128 (7.4%) |
| $50,000 to $74,999 | 1,146 (74.4%) | 394 (25.6%) |
| $75,000 to $99,999 | 503 (74.9%) | 169 (25.2%) |
| $100,000 and over | 2,814 (83.6%) | 551 (16.4%) |
Public vs Private Health Insurance Coverage by Age in Seven Corners
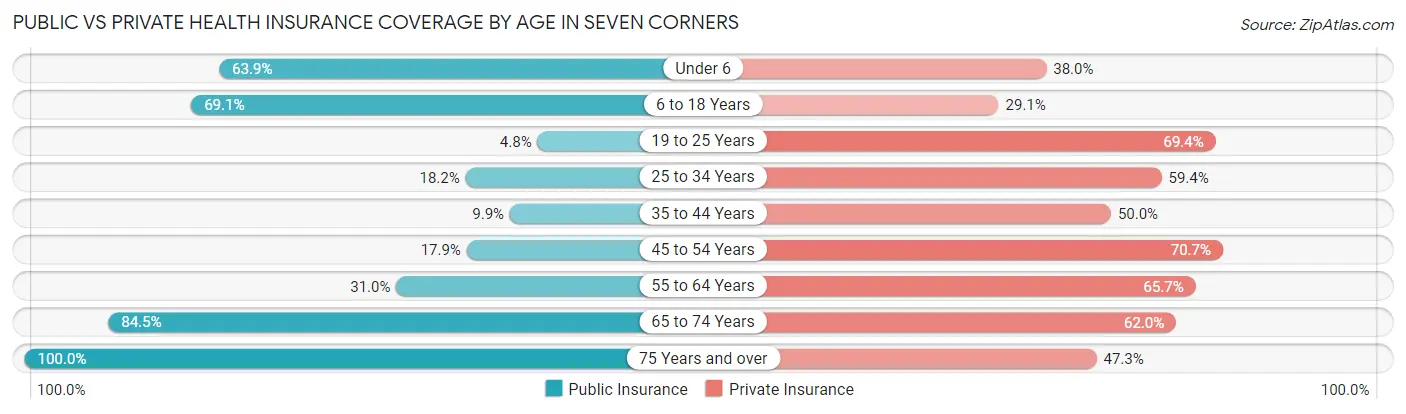
| Age Bracket | Public Insurance | Private Insurance |
| Under 6 | 584 (63.9%) | 347 (38.0%) |
| 6 to 18 Years | 904 (69.1%) | 381 (29.1%) |
| 19 to 25 Years | 42 (4.8%) | 607 (69.4%) |
| 25 to 34 Years | 292 (18.1%) | 955 (59.4%) |
| 35 to 44 Years | 115 (9.9%) | 579 (50.0%) |
| 45 to 54 Years | 136 (17.9%) | 536 (70.7%) |
| 55 to 64 Years | 289 (31.0%) | 612 (65.7%) |
| 65 to 74 Years | 723 (84.5%) | 531 (62.0%) |
| 75 Years and over | 662 (100.0%) | 313 (47.3%) |
| Total | 3,747 (41.3%) | 4,861 (53.6%) |
Disability Status by Sex by Age in Seven Corners
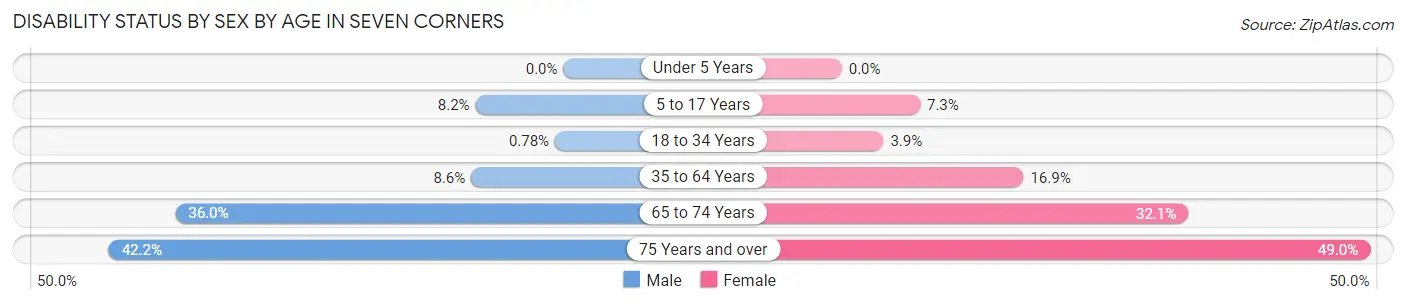
| Age Bracket | Male | Female |
| Under 5 Years | 0 (0.0%) | 0 (0.0%) |
| 5 to 17 Years | 47 (8.2%) | 60 (7.3%) |
| 18 to 34 Years | 12 (0.8%) | 38 (3.9%) |
| 35 to 64 Years | 125 (8.6%) | 234 (16.9%) |
| 65 to 74 Years | 139 (36.0%) | 151 (32.1%) |
| 75 Years and over | 127 (42.2%) | 177 (49.0%) |
Disability Class by Sex by Age in Seven Corners
Disability Class: Hearing Difficulty
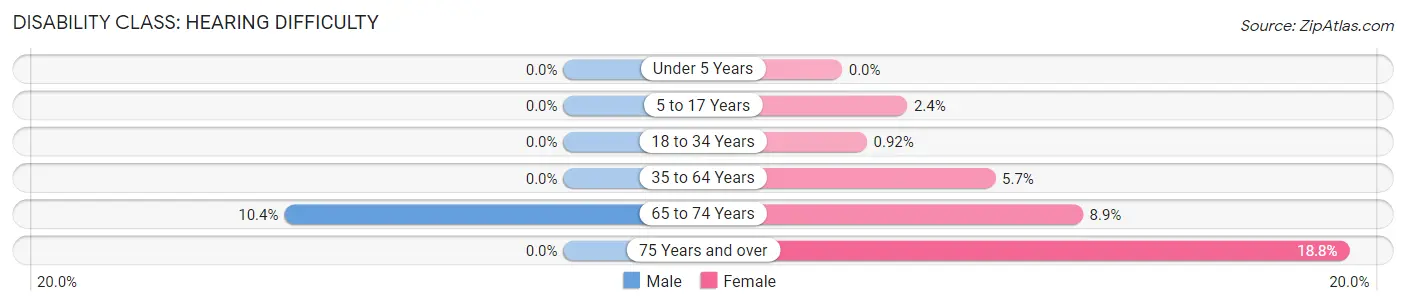
| Age Bracket | Male | Female |
| Under 5 Years | 0 (0.0%) | 0 (0.0%) |
| 5 to 17 Years | 0 (0.0%) | 20 (2.4%) |
| 18 to 34 Years | 0 (0.0%) | 9 (0.9%) |
| 35 to 64 Years | 0 (0.0%) | 79 (5.7%) |
| 65 to 74 Years | 40 (10.4%) | 42 (8.9%) |
| 75 Years and over | 0 (0.0%) | 68 (18.8%) |
Disability Class: Vision Difficulty
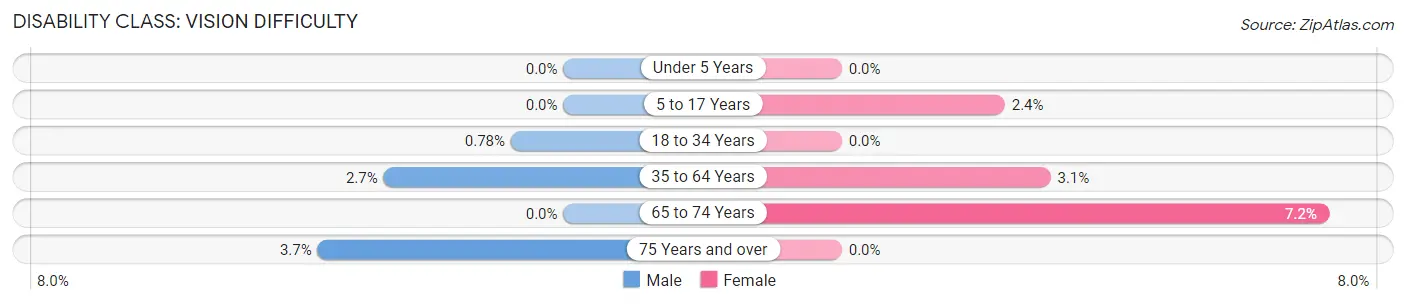
| Age Bracket | Male | Female |
| Under 5 Years | 0 (0.0%) | 0 (0.0%) |
| 5 to 17 Years | 0 (0.0%) | 20 (2.4%) |
| 18 to 34 Years | 12 (0.8%) | 0 (0.0%) |
| 35 to 64 Years | 39 (2.7%) | 43 (3.1%) |
| 65 to 74 Years | 0 (0.0%) | 34 (7.2%) |
| 75 Years and over | 11 (3.6%) | 0 (0.0%) |
Disability Class: Cognitive Difficulty
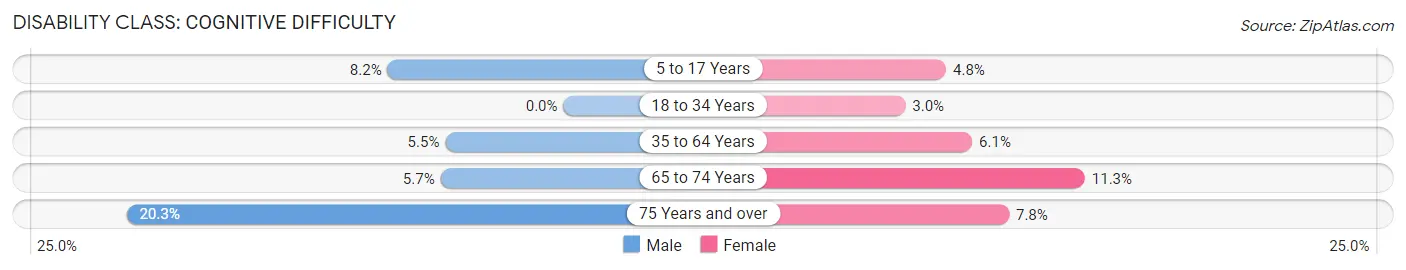
| Age Bracket | Male | Female |
| 5 to 17 Years | 47 (8.2%) | 40 (4.8%) |
| 18 to 34 Years | 0 (0.0%) | 29 (2.9%) |
| 35 to 64 Years | 80 (5.5%) | 84 (6.0%) |
| 65 to 74 Years | 22 (5.7%) | 53 (11.3%) |
| 75 Years and over | 61 (20.3%) | 28 (7.8%) |
Disability Class: Ambulatory Difficulty
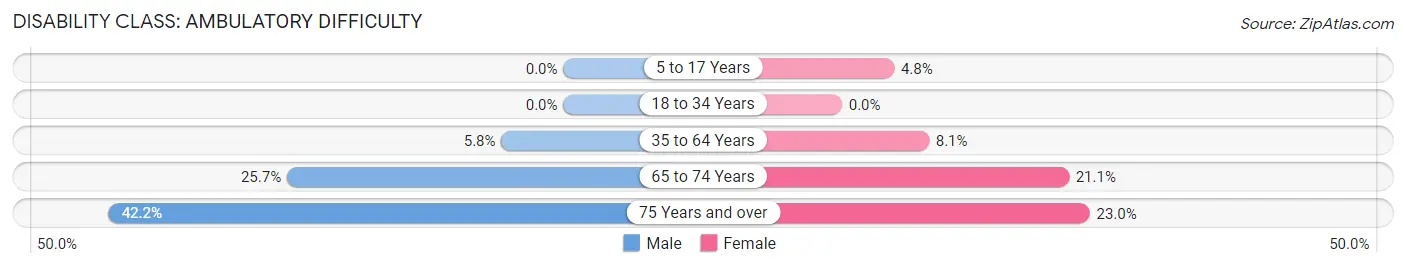
| Age Bracket | Male | Female |
| 5 to 17 Years | 0 (0.0%) | 40 (4.8%) |
| 18 to 34 Years | 0 (0.0%) | 0 (0.0%) |
| 35 to 64 Years | 84 (5.8%) | 112 (8.1%) |
| 65 to 74 Years | 99 (25.7%) | 99 (21.1%) |
| 75 Years and over | 127 (42.2%) | 83 (23.0%) |
Disability Class: Self-Care Difficulty
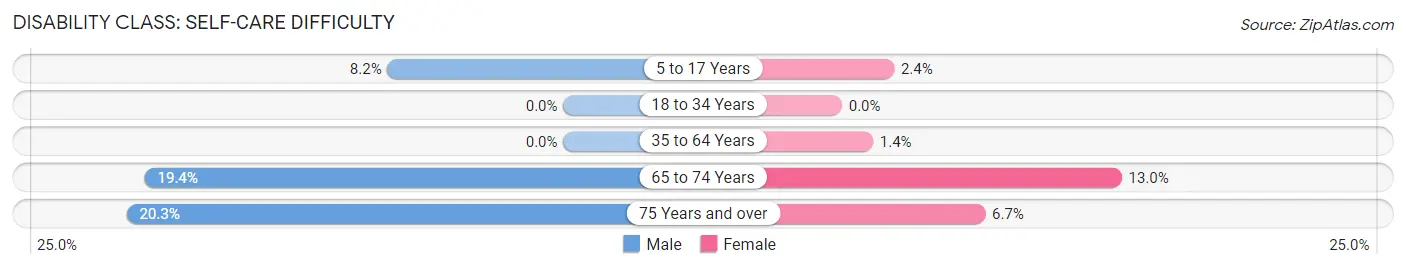
| Age Bracket | Male | Female |
| 5 to 17 Years | 47 (8.2%) | 20 (2.4%) |
| 18 to 34 Years | 0 (0.0%) | 0 (0.0%) |
| 35 to 64 Years | 0 (0.0%) | 20 (1.4%) |
| 65 to 74 Years | 75 (19.4%) | 61 (13.0%) |
| 75 Years and over | 61 (20.3%) | 24 (6.7%) |
Technology Access in Seven Corners
Computing Device Access in Seven Corners
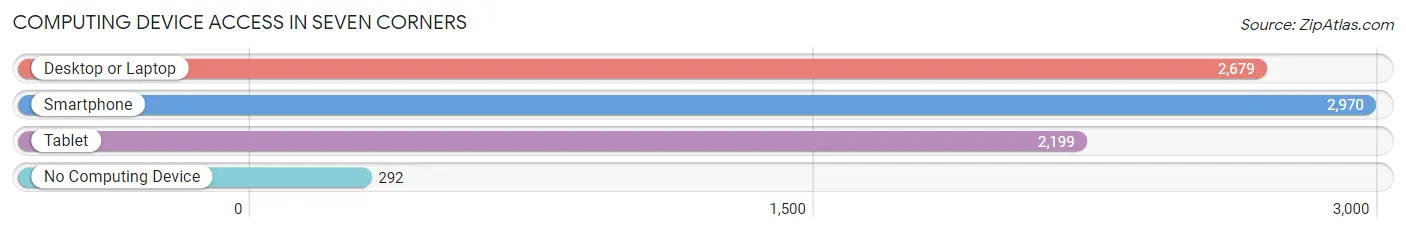
| Device Type | # Households | % Households |
| Desktop or Laptop | 2,679 | 74.9% |
| Smartphone | 2,970 | 83.0% |
| Tablet | 2,199 | 61.5% |
| No Computing Device | 292 | 8.2% |
| Total | 3,577 | 100.0% |
Internet Access in Seven Corners
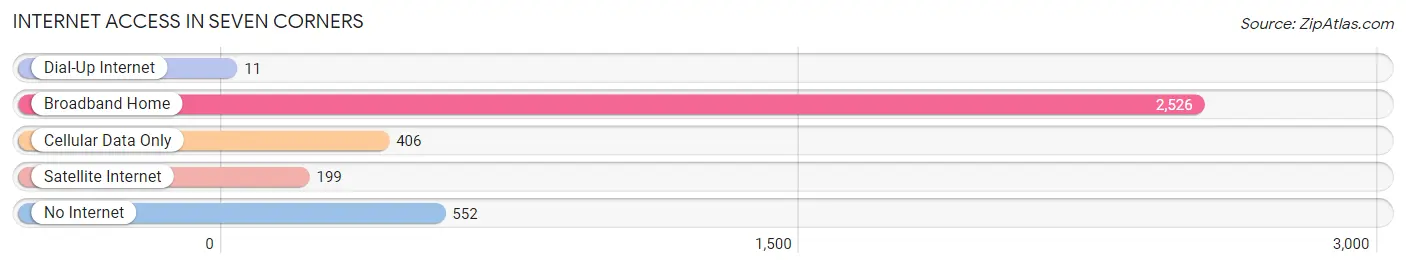
| Internet Type | # Households | % Households |
| Dial-Up Internet | 11 | 0.3% |
| Broadband Home | 2,526 | 70.6% |
| Cellular Data Only | 406 | 11.4% |
| Satellite Internet | 199 | 5.6% |
| No Internet | 552 | 15.4% |
| Total | 3,577 | 100.0% |
Seven Corners Summary
Corners, Virginia is a small unincorporated community located in Fairfax County, Virginia. It is situated at the intersection of seven roads, hence its name. The area is known for its rural atmosphere and is home to a variety of businesses, including a post office, a gas station, a convenience store, and a few restaurants.
History
The area now known as Seven Corners was first settled in the late 1700s by German immigrants. The area was originally known as “Seven Mile Run” due to its location seven miles from Alexandria. The area was later renamed “Seven Corners” in the early 1800s.
In the mid-1800s, the area was home to a number of small farms and businesses. The area was also home to a number of Civil War battles, including the Battle of Seven Pines and the Battle of Bull Run.
In the early 1900s, the area began to experience rapid growth due to its proximity to Washington, D.C. The area was home to a number of businesses, including a post office, a gas station, a convenience store, and a few restaurants.
Geography
Seven Corners is located in Fairfax County, Virginia. It is situated at the intersection of seven roads, hence its name. The area is bordered by the City of Falls Church to the north, the City of Fairfax to the east, and the City of Alexandria to the south.
The area is characterized by its rural atmosphere and is home to a variety of businesses, including a post office, a gas station, a convenience store, and a few restaurants. The area is also home to a number of parks, including Seven Corners Park, which features a playground, a basketball court, and a picnic area.
Economy
The economy of Seven Corners is largely driven by the retail and service industries. The area is home to a number of businesses, including a post office, a gas station, a convenience store, and a few restaurants. The area is also home to a number of government offices, including the Fairfax County Government Center and the Fairfax County Courthouse.
Demographics
As of the 2010 census, the population of Seven Corners was 8,717. The racial makeup of the area was 79.3% White, 8.2% African American, 0.3% Native American, 5.2% Asian, 0.1% Pacific Islander, 4.2% from other races, and 2.9% from two or more races. The median household income was $68,945.
Conclusion
Seven Corners is a small unincorporated community located in Fairfax County, Virginia. It is situated at the intersection of seven roads, hence its name. The area is known for its rural atmosphere and is home to a variety of businesses, including a post office, a gas station, a convenience store, and a few restaurants. The area was first settled in the late 1700s by German immigrants and has since experienced rapid growth due to its proximity to Washington, D.C. The economy of Seven Corners is largely driven by the retail and service industries, and the area is home to a number of government offices. As of the 2010 census, the population of Seven Corners was 8,717.
Common Questions
What is Per Capita Income in Seven Corners?
Per Capita income in Seven Corners is $35,780.
What is the Median Family Income in Seven Corners?
Median Family Income in Seven Corners is $57,479.
What is the Median Household income in Seven Corners?
Median Household Income in Seven Corners is $63,625.
What is Income or Wage Gap in Seven Corners?
Income or Wage Gap in Seven Corners is 26.4%.
Women in Seven Corners earn 73.6 cents for every dollar earned by a man.
What is Inequality or Gini Index in Seven Corners?
Inequality or Gini Index in Seven Corners is 0.47.
What is the Total Population of Seven Corners?
Total Population of Seven Corners is 9,141.
What is the Total Male Population of Seven Corners?
Total Male Population of Seven Corners is 4,668.
What is the Total Female Population of Seven Corners?
Total Female Population of Seven Corners is 4,473.
What is the Ratio of Males per 100 Females in Seven Corners?
There are 104.36 Males per 100 Females in Seven Corners.
What is the Ratio of Females per 100 Males in Seven Corners?
There are 95.82 Females per 100 Males in Seven Corners.
What is the Median Population Age in Seven Corners?
Median Population Age in Seven Corners is 34.4 Years.
What is the Average Family Size in Seven Corners
Average Family Size in Seven Corners is 3.4 People.
What is the Average Household Size in Seven Corners
Average Household Size in Seven Corners is 2.5 People.
How Large is the Labor Force in Seven Corners?
There are 4,777 People in the Labor Forcein in Seven Corners.
What is the Percentage of People in the Labor Force in Seven Corners?
66.5% of People are in the Labor Force in Seven Corners.
What is the Unemployment Rate in Seven Corners?
Unemployment Rate in Seven Corners is 8.3%.