Zip Codes with the Highest Percentage of Population Employed in Legal Services & Support in Mechanicsville, VA
RELATED REPORTS & OPTIONS
Legal Services & Support
Mechanicsville
Compare Zip Codes
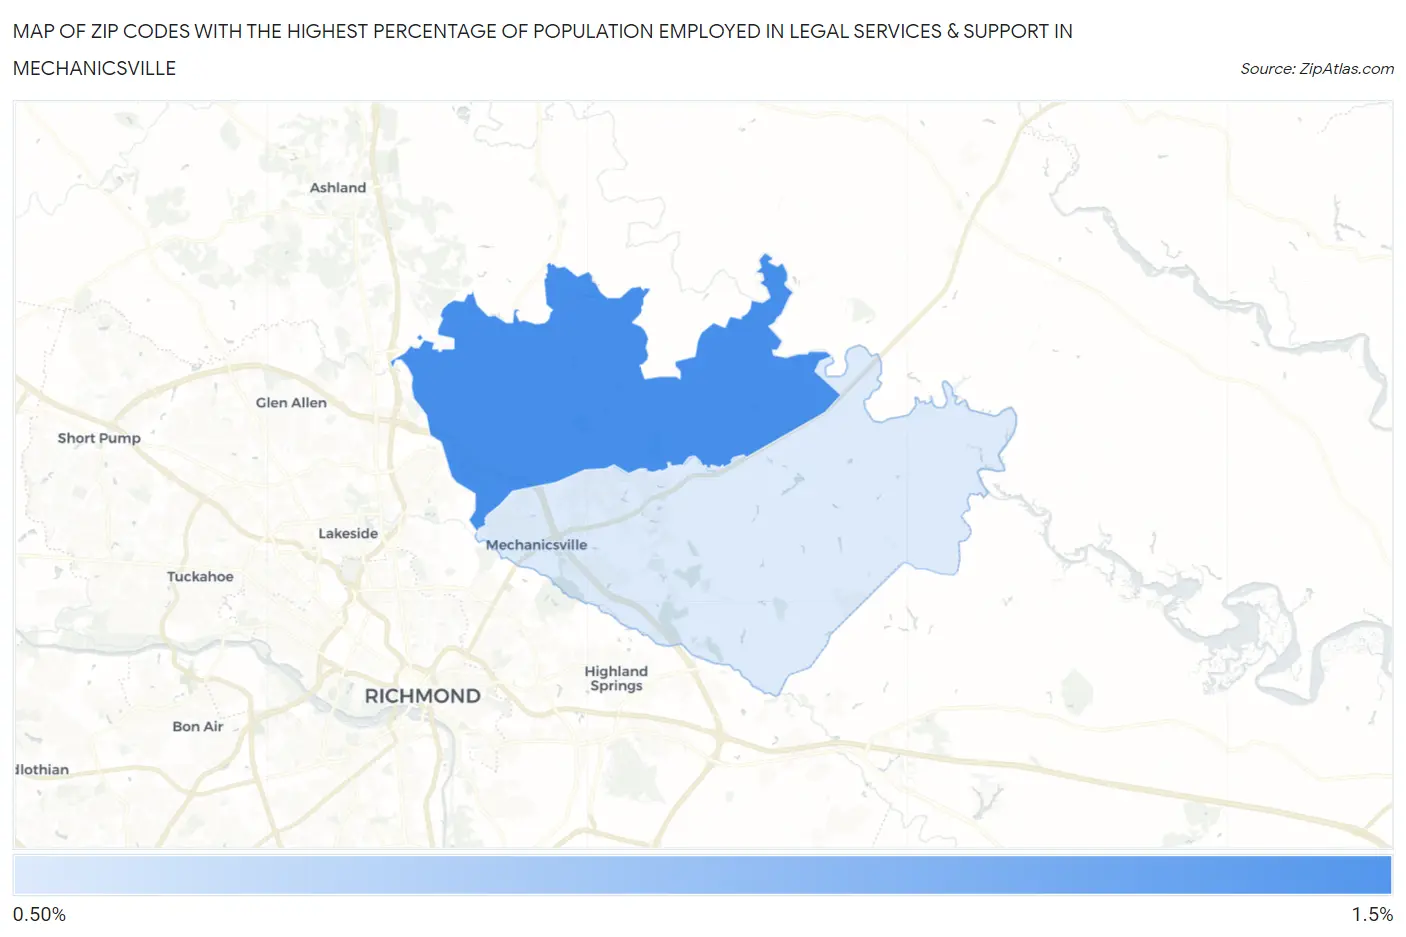
Map of Zip Codes with the Highest Percentage of Population Employed in Legal Services & Support in Mechanicsville
0.73%
1.0%
Zip Codes with the Highest Percentage of Population Employed in Legal Services & Support in Mechanicsville, VA
| Zip Code | % Employed | vs State | vs National | |
| 1. | 23116 | 1.0% | 1.6%(-0.581)#241 | 1.2%(-0.143)#7,546 |
| 2. | 23111 | 0.73% | 1.6%(-0.891)#303 | 1.2%(-0.453)#10,093 |
1
Common Questions
What are the Top Zip Codes with the Highest Percentage of Population Employed in Legal Services & Support in Mechanicsville, VA?
Top Zip Codes with the Highest Percentage of Population Employed in Legal Services & Support in Mechanicsville, VA are:
What zip code has the Highest Percentage of Population Employed in Legal Services & Support in Mechanicsville, VA?
23116 has the Highest Percentage of Population Employed in Legal Services & Support in Mechanicsville, VA with 1.0%.
What is the Percentage of Population Employed in Legal Services & Support in Mechanicsville, VA?
Percentage of Population Employed in Legal Services & Support in Mechanicsville is 0.97%.
What is the Percentage of Population Employed in Legal Services & Support in Virginia?
Percentage of Population Employed in Legal Services & Support in Virginia is 1.6%.
What is the Percentage of Population Employed in Legal Services & Support in the United States?
Percentage of Population Employed in Legal Services & Support in the United States is 1.2%.