Raven, VA Map & Demographics
Raven Map
Raven Overview
$20,123
PER CAPITA INCOME
$45,078
AVG FAMILY INCOME
$36,613
AVG HOUSEHOLD INCOME
28.7%
WAGE / INCOME GAP [ % ]
71.3¢/ $1
WAGE / INCOME GAP [ $ ]
0.44
INEQUALITY / GINI INDEX
2,065
TOTAL POPULATION
811
MALE POPULATION
1,254
FEMALE POPULATION
64.67
MALES / 100 FEMALES
154.62
FEMALES / 100 MALES
46.2
MEDIAN AGE
3.4
AVG FAMILY SIZE
2.6
AVG HOUSEHOLD SIZE
655
LABOR FORCE [ PEOPLE ]
39.4%
PERCENT IN LABOR FORCE
12.2%
UNEMPLOYMENT RATE
Raven Zip Codes
Raven Area Codes
Income in Raven
Income Overview in Raven
Per Capita Income in Raven is $20,123, while median incomes of families and households are $45,078 and $36,613 respectively.
| Characteristic | Number | Measure |
| Per Capita Income | 2,065 | $20,123 |
| Median Family Income | 527 | $45,078 |
| Mean Family Income | 527 | $62,758 |
| Median Household Income | 784 | $36,613 |
| Mean Household Income | 784 | $49,846 |
| Income Deficit | 527 | $0 |
| Wage / Income Gap (%) | 2,065 | 28.74% |
| Wage / Income Gap ($) | 2,065 | 71.26¢ per $1 |
| Gini / Inequality Index | 2,065 | 0.44 |
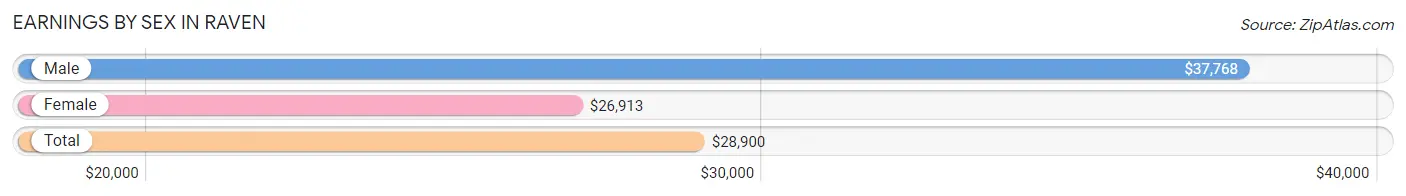
Earnings by Sex in Raven
Average Earnings in Raven are $28,900, $37,768 for men and $26,913 for women, a difference of 28.7%.
| Sex | Number | Average Earnings |
| Male | 323 (45.5%) | $37,768 |
| Female | 387 (54.5%) | $26,913 |
| Total | 710 (100.0%) | $28,900 |
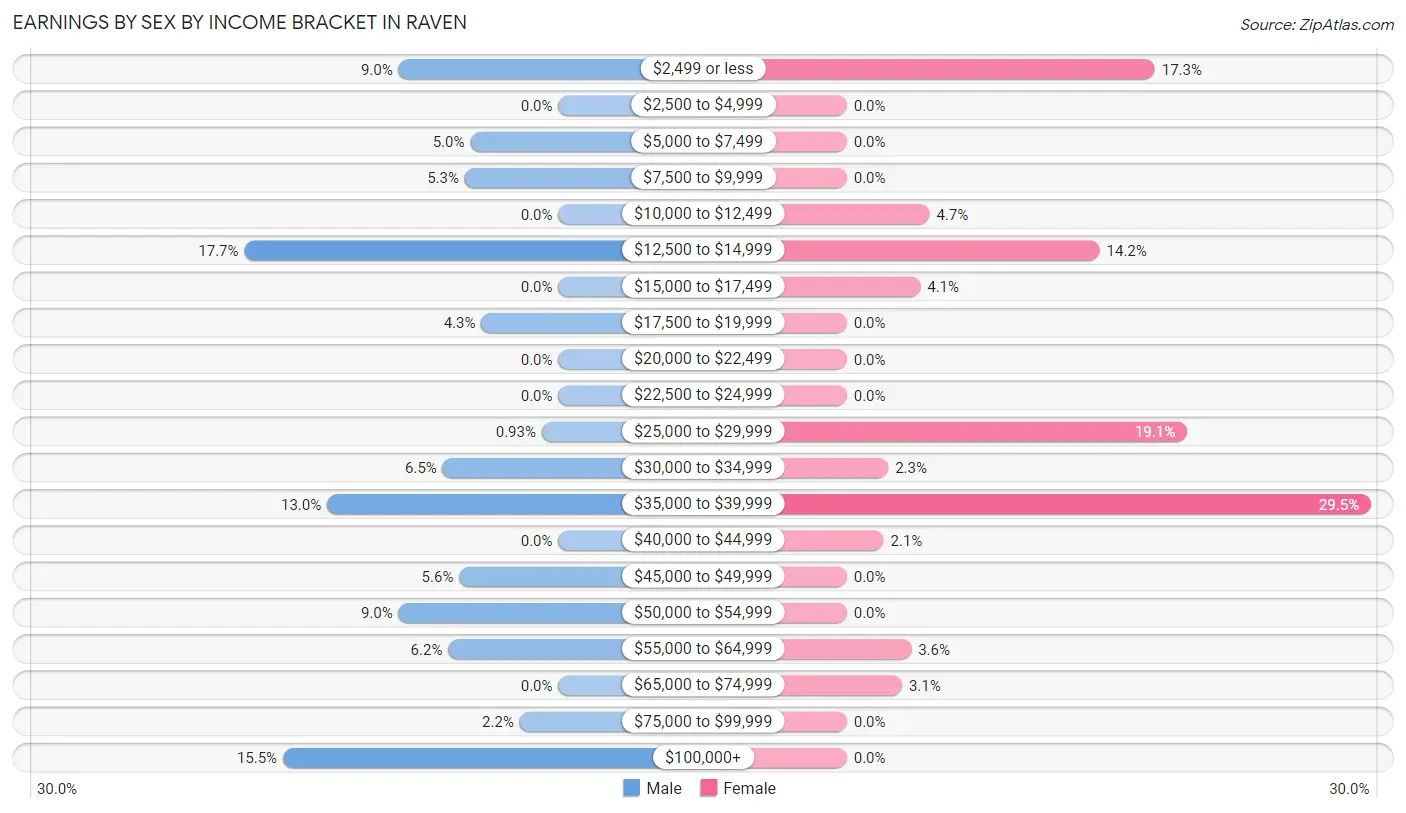
Earnings by Sex by Income Bracket in Raven
The most common earnings brackets in Raven are $12,500 to $14,999 for men (57 | 17.6%) and $35,000 to $39,999 for women (114 | 29.5%).
| Income | Male | Female |
| $2,499 or less | 29 (9.0%) | 67 (17.3%) |
| $2,500 to $4,999 | 0 (0.0%) | 0 (0.0%) |
| $5,000 to $7,499 | 16 (5.0%) | 0 (0.0%) |
| $7,500 to $9,999 | 17 (5.3%) | 0 (0.0%) |
| $10,000 to $12,499 | 0 (0.0%) | 18 (4.6%) |
| $12,500 to $14,999 | 57 (17.6%) | 55 (14.2%) |
| $15,000 to $17,499 | 0 (0.0%) | 16 (4.1%) |
| $17,500 to $19,999 | 14 (4.3%) | 0 (0.0%) |
| $20,000 to $22,499 | 0 (0.0%) | 0 (0.0%) |
| $22,500 to $24,999 | 0 (0.0%) | 0 (0.0%) |
| $25,000 to $29,999 | 3 (0.9%) | 74 (19.1%) |
| $30,000 to $34,999 | 21 (6.5%) | 9 (2.3%) |
| $35,000 to $39,999 | 42 (13.0%) | 114 (29.5%) |
| $40,000 to $44,999 | 0 (0.0%) | 8 (2.1%) |
| $45,000 to $49,999 | 18 (5.6%) | 0 (0.0%) |
| $50,000 to $54,999 | 29 (9.0%) | 0 (0.0%) |
| $55,000 to $64,999 | 20 (6.2%) | 14 (3.6%) |
| $65,000 to $74,999 | 0 (0.0%) | 12 (3.1%) |
| $75,000 to $99,999 | 7 (2.2%) | 0 (0.0%) |
| $100,000+ | 50 (15.5%) | 0 (0.0%) |
| Total | 323 (100.0%) | 387 (100.0%) |
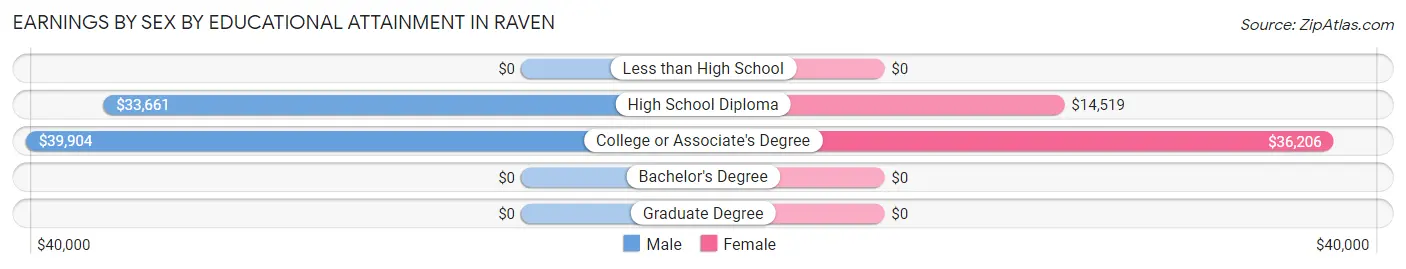
Earnings by Sex by Educational Attainment in Raven
Average earnings in Raven are $39,107 for men and $31,528 for women, a difference of 19.4%. Men with an educational attainment of college or associate's degree enjoy the highest average annual earnings of $39,904, while those with high school diploma education earn the least with $33,661. Women with an educational attainment of college or associate's degree earn the most with the average annual earnings of $36,206, while those with high school diploma education have the smallest earnings of $14,519.
| Educational Attainment | Male Income | Female Income |
| Less than High School | - | - |
| High School Diploma | $33,661 | $14,519 |
| College or Associate's Degree | $39,904 | $36,206 |
| Bachelor's Degree | - | - |
| Graduate Degree | - | - |
| Total | $39,107 | $31,528 |
Family Income in Raven
Family Income Brackets in Raven
According to the Raven family income data, there are 178 families falling into the $35,000 to $49,999 income range, which is the most common income bracket and makes up 33.8% of all families.
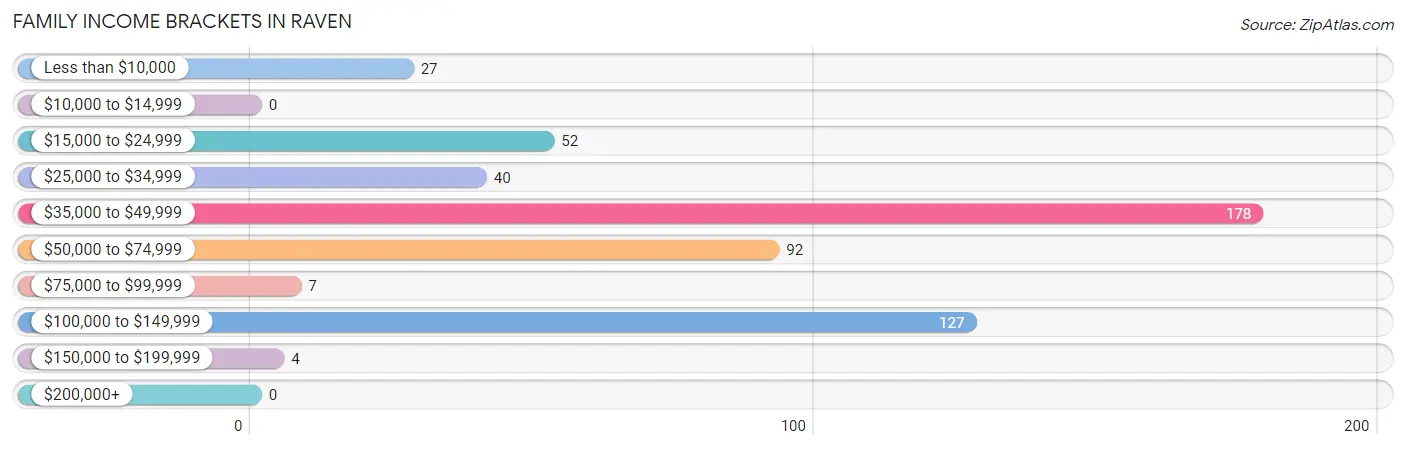
| Income Bracket | # Families | % Families |
| Less than $10,000 | 27 | 5.1% |
| $10,000 to $14,999 | 0 | 0.0% |
| $15,000 to $24,999 | 52 | 9.9% |
| $25,000 to $34,999 | 40 | 7.6% |
| $35,000 to $49,999 | 178 | 33.8% |
| $50,000 to $74,999 | 92 | 17.5% |
| $75,000 to $99,999 | 7 | 1.3% |
| $100,000 to $149,999 | 127 | 24.1% |
| $150,000 to $199,999 | 4 | 0.8% |
| $200,000+ | 0 | 0.0% |
Family Income by Famaliy Size in Raven
4-person families (113 | 21.4%) account for the highest median family income in Raven with $40,433 per family, while 4-person families (113 | 21.4%) have the highest median income of $10,108 per family member.
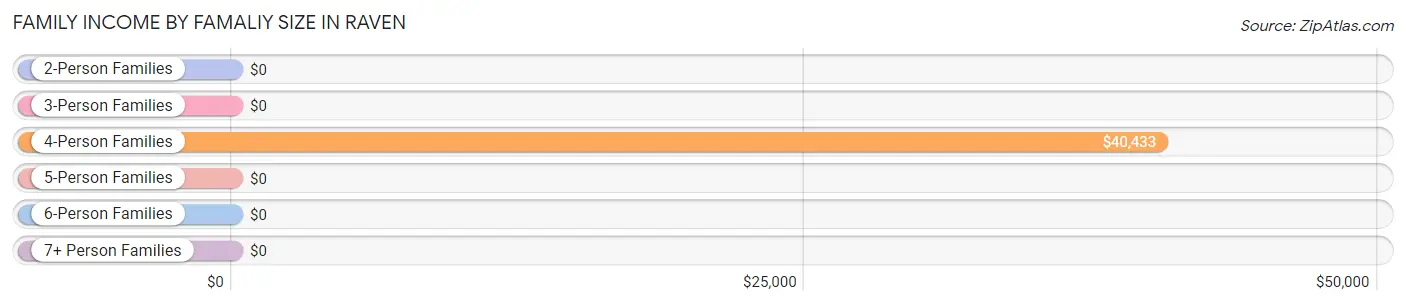
| Income Bracket | # Families | Median Income |
| 2-Person Families | 237 (45.0%) | $0 |
| 3-Person Families | 129 (24.5%) | $0 |
| 4-Person Families | 113 (21.4%) | $40,433 |
| 5-Person Families | 32 (6.1%) | $0 |
| 6-Person Families | 16 (3.0%) | $0 |
| 7+ Person Families | 0 (0.0%) | $0 |
| Total | 527 (100.0%) | $45,078 |
Family Income by Number of Earners in Raven
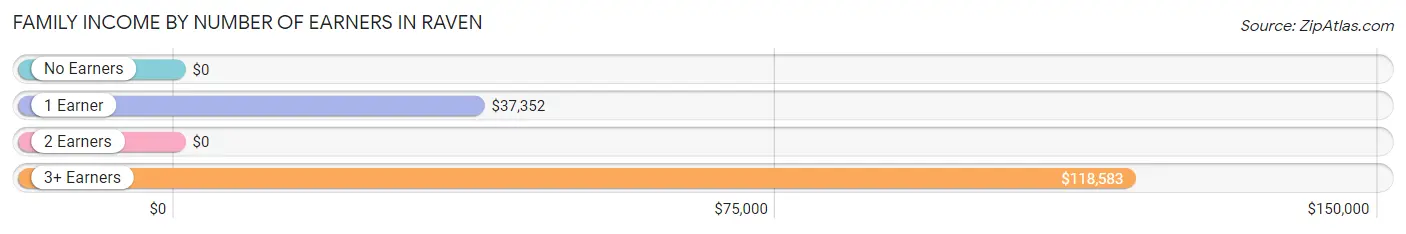
| Number of Earners | # Families | Median Income |
| No Earners | 178 (33.8%) | $0 |
| 1 Earner | 217 (41.2%) | $37,352 |
| 2 Earners | 91 (17.3%) | $0 |
| 3+ Earners | 41 (7.8%) | $118,583 |
| Total | 527 (100.0%) | $45,078 |
Household Income in Raven
Household Income Brackets in Raven
With 183 households falling in the category, the $35,000 to $49,999 income range is the most frequent in Raven, accounting for 23.3% of all households.
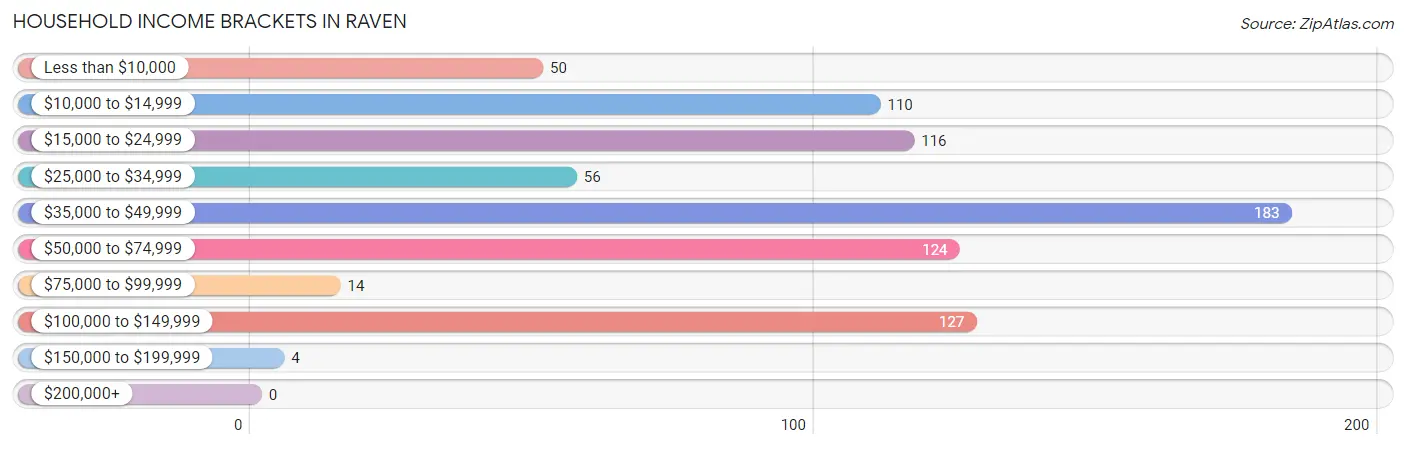
| Income Bracket | # Households | % Households |
| Less than $10,000 | 50 | 6.4% |
| $10,000 to $14,999 | 110 | 14.0% |
| $15,000 to $24,999 | 116 | 14.8% |
| $25,000 to $34,999 | 56 | 7.1% |
| $35,000 to $49,999 | 183 | 23.3% |
| $50,000 to $74,999 | 124 | 15.8% |
| $75,000 to $99,999 | 14 | 1.8% |
| $100,000 to $149,999 | 127 | 16.2% |
| $150,000 to $199,999 | 4 | 0.5% |
| $200,000+ | 0 | 0.0% |
Household Income by Householder Age in Raven
The median household income in Raven is $36,613, with the highest median household income of $36,976 found in the 45 to 64 years age bracket for the primary householder. A total of 317 households (40.4%) fall into this category. Meanwhile, the 15 to 24 years age bracket for the primary householder has the lowest median household income of $0, with 9 households (1.1%) in this group.
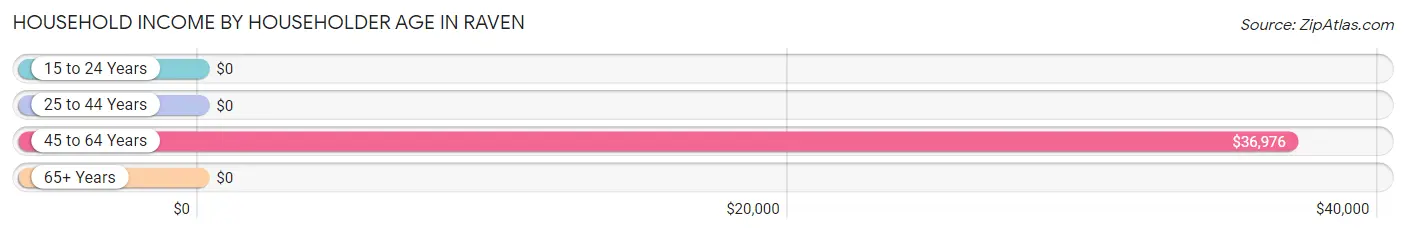
| Income Bracket | # Households | Median Income |
| 15 to 24 Years | 9 (1.1%) | $0 |
| 25 to 44 Years | 131 (16.7%) | $0 |
| 45 to 64 Years | 317 (40.4%) | $36,976 |
| 65+ Years | 327 (41.7%) | $0 |
| Total | 784 (100.0%) | $36,613 |
Poverty in Raven
Income Below Poverty by Sex and Age in Raven
With 36.6% poverty level for males and 25.0% for females among the residents of Raven, 12 to 14 year old males and 12 to 14 year old females are the most vulnerable to poverty, with 33 males (100.0%) and 15 females (100.0%) in their respective age groups living below the poverty level.
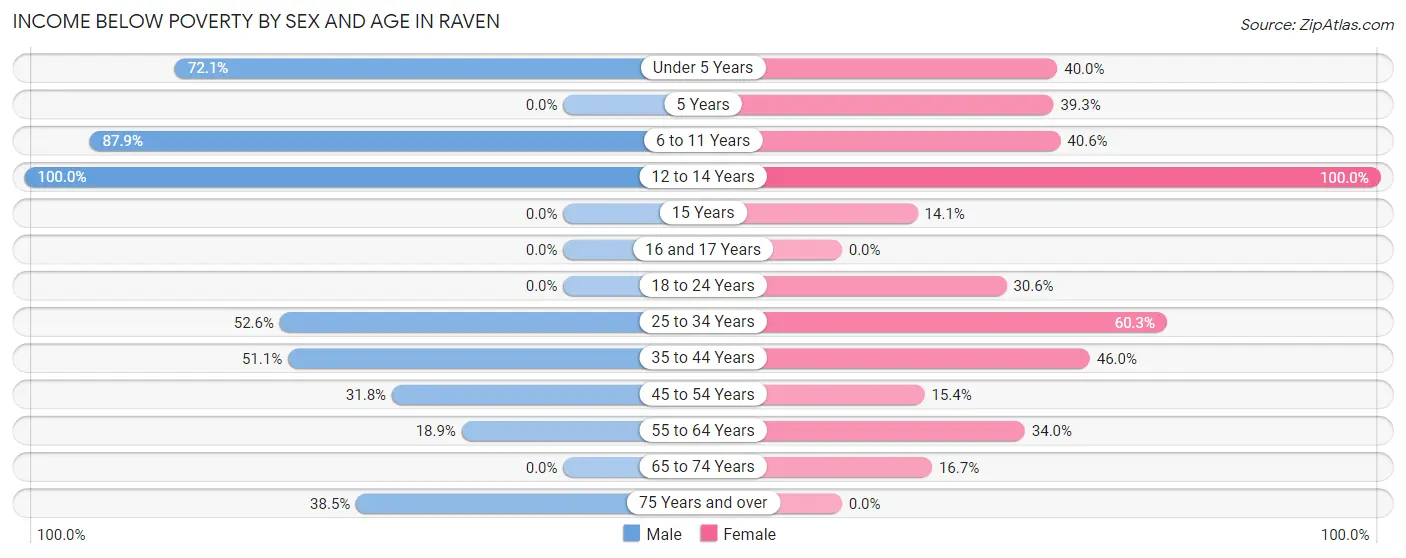
| Age Bracket | Male | Female |
| Under 5 Years | 31 (72.1%) | 34 (40.0%) |
| 5 Years | 0 (0.0%) | 11 (39.3%) |
| 6 to 11 Years | 51 (87.9%) | 28 (40.6%) |
| 12 to 14 Years | 33 (100.0%) | 15 (100.0%) |
| 15 Years | 0 (0.0%) | 10 (14.1%) |
| 16 and 17 Years | 0 (0.0%) | 0 (0.0%) |
| 18 to 24 Years | 0 (0.0%) | 33 (30.6%) |
| 25 to 34 Years | 80 (52.6%) | 38 (60.3%) |
| 35 to 44 Years | 23 (51.1%) | 29 (46.0%) |
| 45 to 54 Years | 49 (31.8%) | 41 (15.4%) |
| 55 to 64 Years | 10 (18.9%) | 35 (34.0%) |
| 65 to 74 Years | 0 (0.0%) | 39 (16.7%) |
| 75 Years and over | 20 (38.5%) | 0 (0.0%) |
| Total | 297 (36.6%) | 313 (25.0%) |
Income Above Poverty by Sex and Age in Raven
According to the poverty statistics in Raven, males aged 16 and 17 years and females aged 16 and 17 years are the age groups that are most secure financially, with 100.0% of males and 100.0% of females in these age groups living above the poverty line.
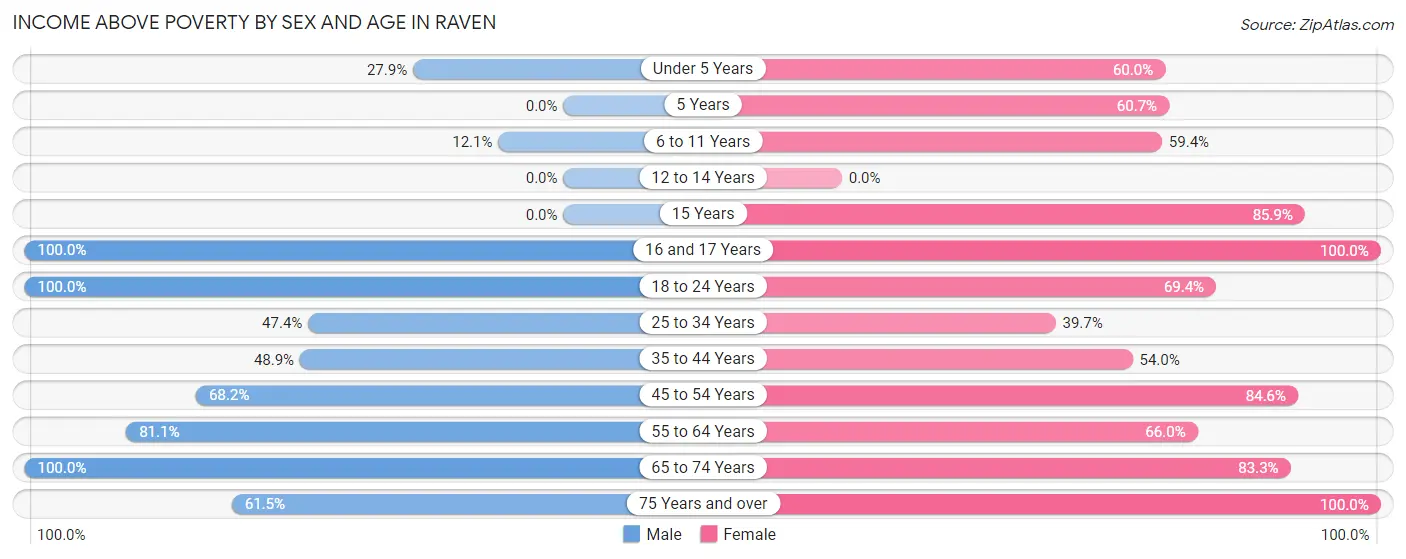
| Age Bracket | Male | Female |
| Under 5 Years | 12 (27.9%) | 51 (60.0%) |
| 5 Years | 0 (0.0%) | 17 (60.7%) |
| 6 to 11 Years | 7 (12.1%) | 41 (59.4%) |
| 12 to 14 Years | 0 (0.0%) | 0 (0.0%) |
| 15 Years | 0 (0.0%) | 61 (85.9%) |
| 16 and 17 Years | 18 (100.0%) | 57 (100.0%) |
| 18 to 24 Years | 85 (100.0%) | 75 (69.4%) |
| 25 to 34 Years | 72 (47.4%) | 25 (39.7%) |
| 35 to 44 Years | 22 (48.9%) | 34 (54.0%) |
| 45 to 54 Years | 105 (68.2%) | 226 (84.6%) |
| 55 to 64 Years | 43 (81.1%) | 68 (66.0%) |
| 65 to 74 Years | 118 (100.0%) | 194 (83.3%) |
| 75 Years and over | 32 (61.5%) | 92 (100.0%) |
| Total | 514 (63.4%) | 941 (75.0%) |
Income Below Poverty Among Married-Couple Families in Raven
The poverty statistics for married-couple families in Raven show that 10.0% or 28 of the total 280 families live below the poverty line. Families with 3 or 4 children have the highest poverty rate of 100.0%, comprising of 20 families. On the other hand, families with no children have the lowest poverty rate of 0.0%, which includes 0 families.
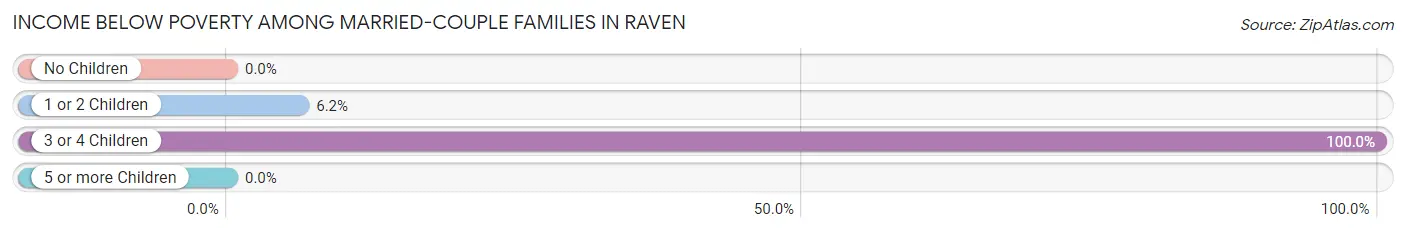
| Children | Above Poverty | Below Poverty |
| No Children | 131 (100.0%) | 0 (0.0%) |
| 1 or 2 Children | 121 (93.8%) | 8 (6.2%) |
| 3 or 4 Children | 0 (0.0%) | 20 (100.0%) |
| 5 or more Children | 0 (0.0%) | 0 (0.0%) |
| Total | 252 (90.0%) | 28 (10.0%) |
Income Below Poverty Among Single-Parent Households in Raven
According to the poverty data in Raven, 34.5% or 20 single-father households and 20.6% or 39 single-mother households are living below the poverty line. Among single-father households, those with 1 or 2 children have the highest poverty rate, with 20 households (100.0%) experiencing poverty. Likewise, among single-mother households, those with 1 or 2 children have the highest poverty rate, with 12 households (100.0%) falling below the poverty line.
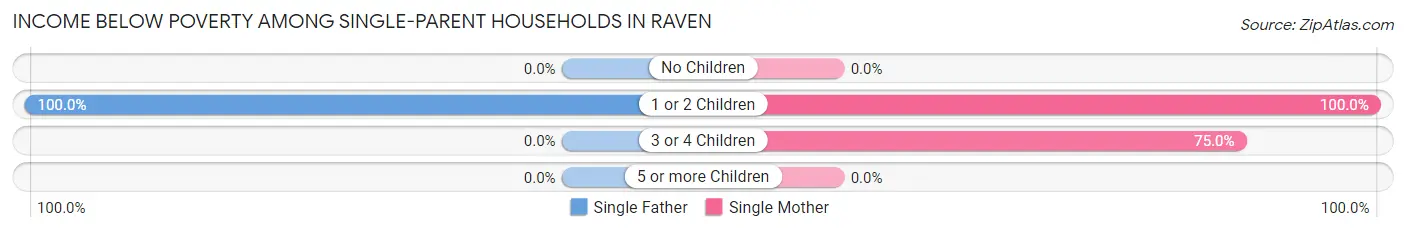
| Children | Single Father | Single Mother |
| No Children | 0 (0.0%) | 0 (0.0%) |
| 1 or 2 Children | 20 (100.0%) | 12 (100.0%) |
| 3 or 4 Children | 0 (0.0%) | 27 (75.0%) |
| 5 or more Children | 0 (0.0%) | 0 (0.0%) |
| Total | 20 (34.5%) | 39 (20.6%) |
Income Below Poverty Among Married-Couple vs Single-Parent Households in Raven
The poverty data for Raven shows that 28 of the married-couple family households (10.0%) and 59 of the single-parent households (23.9%) are living below the poverty level. Within the married-couple family households, those with 3 or 4 children have the highest poverty rate, with 20 households (100.0%) falling below the poverty line. Among the single-parent households, those with 1 or 2 children have the highest poverty rate, with 32 household (100.0%) living below poverty.
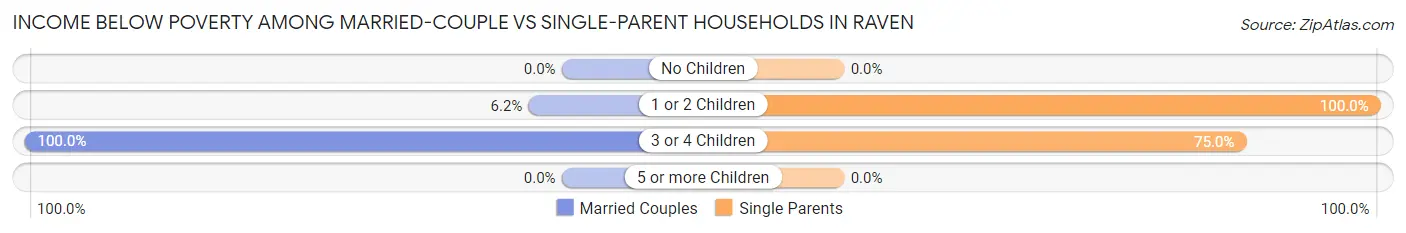
| Children | Married-Couple Families | Single-Parent Households |
| No Children | 0 (0.0%) | 0 (0.0%) |
| 1 or 2 Children | 8 (6.2%) | 32 (100.0%) |
| 3 or 4 Children | 20 (100.0%) | 27 (75.0%) |
| 5 or more Children | 0 (0.0%) | 0 (0.0%) |
| Total | 28 (10.0%) | 59 (23.9%) |
Race in Raven
The most populous races in Raven are White / Caucasian (2,035 | 98.6%), and Two or more Races (30 | 1.5%).
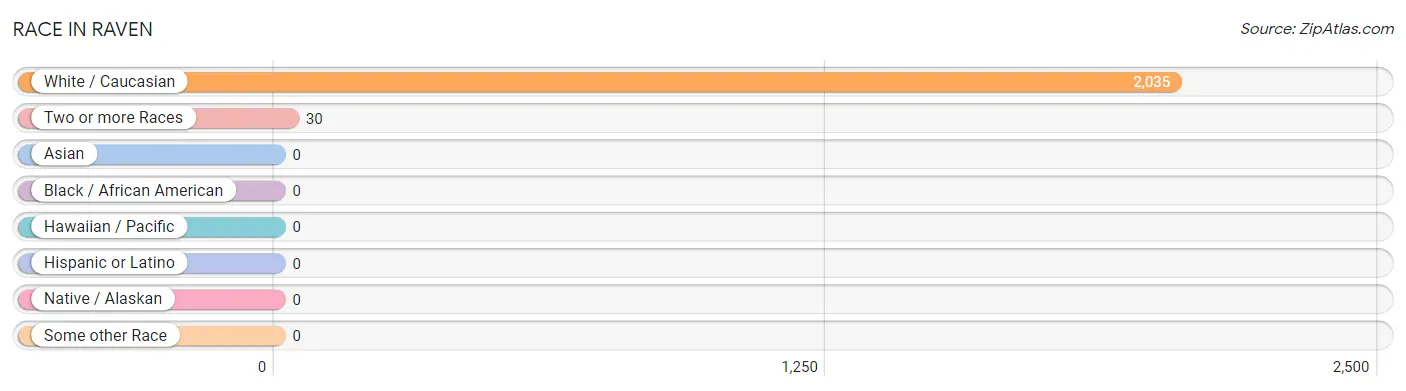
| Race | # Population | % Population |
| Asian | 0 | 0.0% |
| Black / African American | 0 | 0.0% |
| Hawaiian / Pacific | 0 | 0.0% |
| Hispanic or Latino | 0 | 0.0% |
| Native / Alaskan | 0 | 0.0% |
| White / Caucasian | 2,035 | 98.6% |
| Two or more Races | 30 | 1.5% |
| Some other Race | 0 | 0.0% |
| Total | 2,065 | 100.0% |
Ancestry in Raven
The most populous ancestries reported in Raven are American (811 | 39.3%), English (347 | 16.8%), Irish (143 | 6.9%), German (92 | 4.5%), and British (65 | 3.2%), together accounting for 70.6% of all Raven residents.
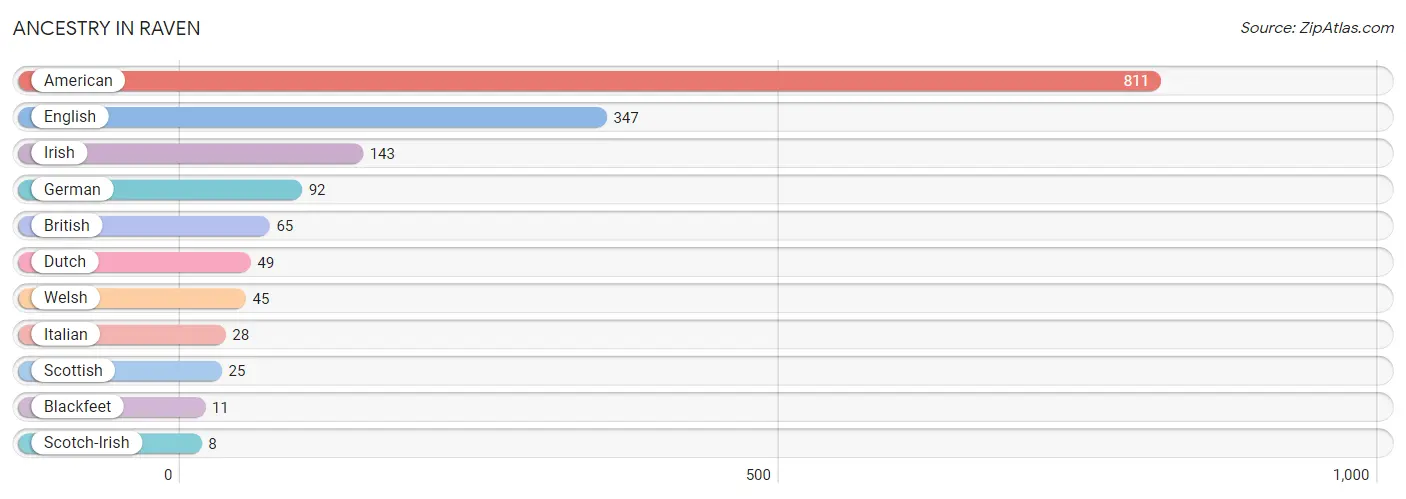
| Ancestry | # Population | % Population |
| American | 811 | 39.3% |
| Blackfeet | 11 | 0.5% |
| British | 65 | 3.2% |
| Dutch | 49 | 2.4% |
| English | 347 | 16.8% |
| German | 92 | 4.5% |
| Irish | 143 | 6.9% |
| Italian | 28 | 1.4% |
| Scotch-Irish | 8 | 0.4% |
| Scottish | 25 | 1.2% |
| Welsh | 45 | 2.2% | View All 11 Rows |
Immigrants in Raven

| Immigration Origin | # Population | % Population | View All 0 Rows |
Sex and Age in Raven
Sex and Age in Raven
The most populous age groups in Raven are 25 to 29 Years (147 | 18.1%) for men and 45 to 49 Years (199 | 15.9%) for women.
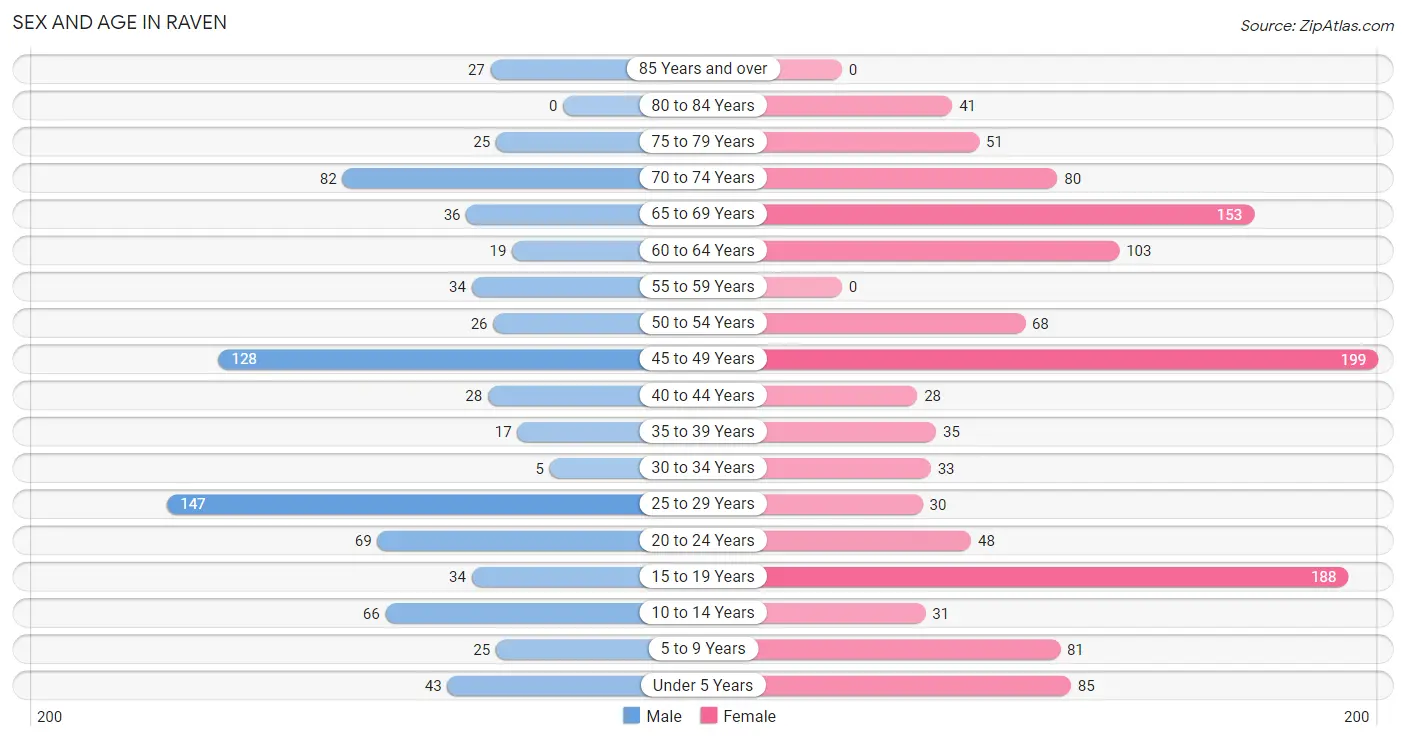
| Age Bracket | Male | Female |
| Under 5 Years | 43 (5.3%) | 85 (6.8%) |
| 5 to 9 Years | 25 (3.1%) | 81 (6.5%) |
| 10 to 14 Years | 66 (8.1%) | 31 (2.5%) |
| 15 to 19 Years | 34 (4.2%) | 188 (15.0%) |
| 20 to 24 Years | 69 (8.5%) | 48 (3.8%) |
| 25 to 29 Years | 147 (18.1%) | 30 (2.4%) |
| 30 to 34 Years | 5 (0.6%) | 33 (2.6%) |
| 35 to 39 Years | 17 (2.1%) | 35 (2.8%) |
| 40 to 44 Years | 28 (3.5%) | 28 (2.2%) |
| 45 to 49 Years | 128 (15.8%) | 199 (15.9%) |
| 50 to 54 Years | 26 (3.2%) | 68 (5.4%) |
| 55 to 59 Years | 34 (4.2%) | 0 (0.0%) |
| 60 to 64 Years | 19 (2.3%) | 103 (8.2%) |
| 65 to 69 Years | 36 (4.4%) | 153 (12.2%) |
| 70 to 74 Years | 82 (10.1%) | 80 (6.4%) |
| 75 to 79 Years | 25 (3.1%) | 51 (4.1%) |
| 80 to 84 Years | 0 (0.0%) | 41 (3.3%) |
| 85 Years and over | 27 (3.3%) | 0 (0.0%) |
| Total | 811 (100.0%) | 1,254 (100.0%) |
Families and Households in Raven
Median Family Size in Raven
The median family size in Raven is 3.35 persons per family, with single male/father families (58 | 11.0%) accounting for the largest median family size of 3.59 persons per family. On the other hand, single female/mother families (189 | 35.9%) represent the smallest median family size with 3.22 persons per family.
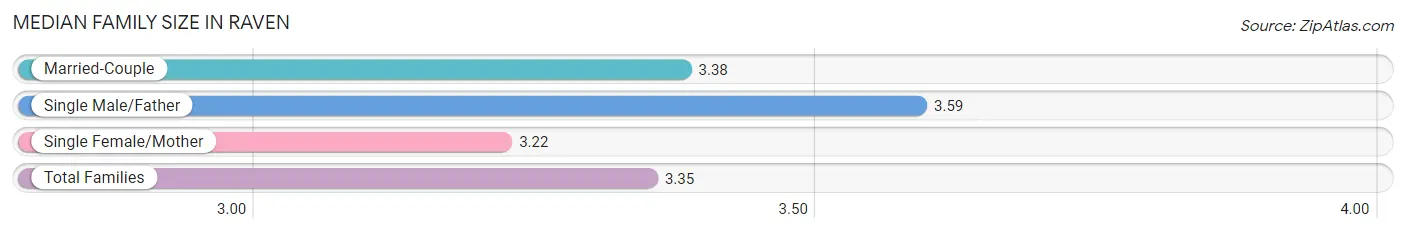
| Family Type | # Families | Family Size |
| Married-Couple | 280 (53.1%) | 3.38 |
| Single Male/Father | 58 (11.0%) | 3.59 |
| Single Female/Mother | 189 (35.9%) | 3.22 |
| Total Families | 527 (100.0%) | 3.35 |
Median Household Size in Raven
The median household size in Raven is 2.63 persons per household, with single male/father households (58 | 7.4%) accounting for the largest median household size of 3.59 persons per household. non-family households (257 | 32.8%) represent the smallest median household size with 1.00 persons per household.
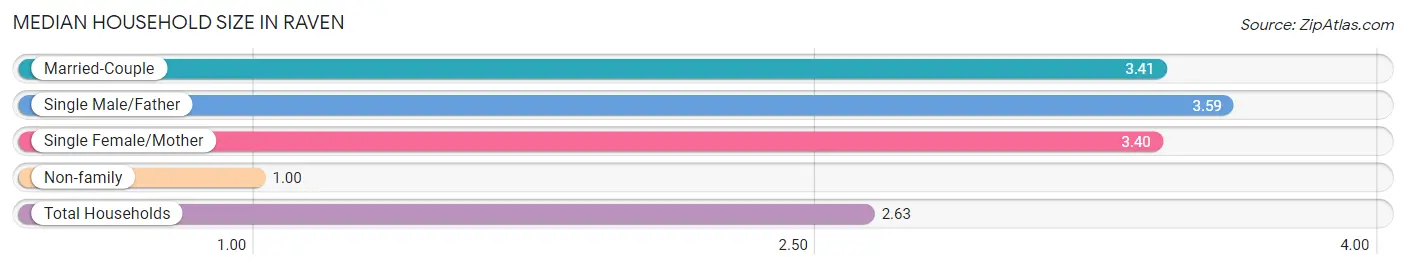
| Household Type | # Households | Household Size |
| Married-Couple | 280 (35.7%) | 3.41 |
| Single Male/Father | 58 (7.4%) | 3.59 |
| Single Female/Mother | 189 (24.1%) | 3.40 |
| Non-family | 257 (32.8%) | 1.00 |
| Total Households | 784 (100.0%) | 2.63 |
Household Size by Marriage Status in Raven
Out of a total of 784 households in Raven, 527 (67.2%) are family households, while 257 (32.8%) are nonfamily households. The most numerous type of family households are 2-person households, comprising 237, and the most common type of nonfamily households are 1-person households, comprising 247.
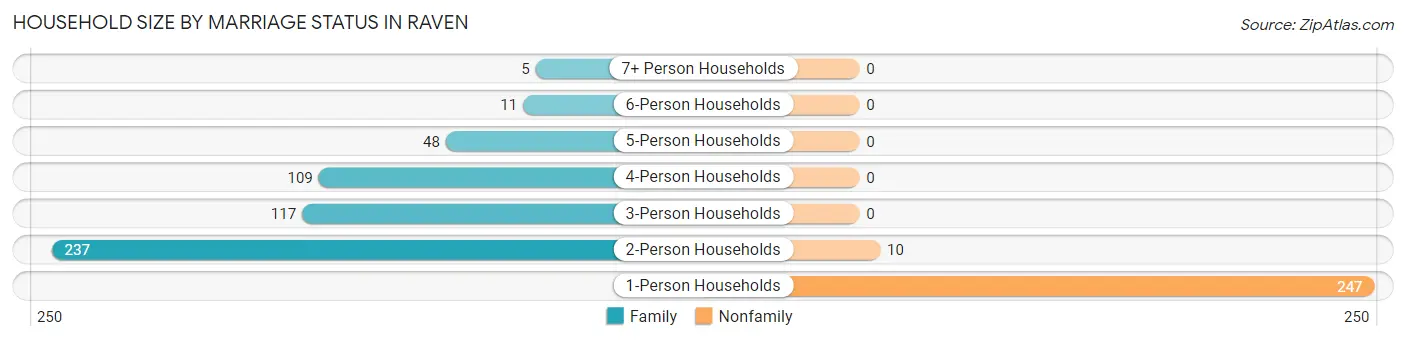
| Household Size | Family Households | Nonfamily Households |
| 1-Person Households | - | 247 (31.5%) |
| 2-Person Households | 237 (30.2%) | 10 (1.3%) |
| 3-Person Households | 117 (14.9%) | 0 (0.0%) |
| 4-Person Households | 109 (13.9%) | 0 (0.0%) |
| 5-Person Households | 48 (6.1%) | 0 (0.0%) |
| 6-Person Households | 11 (1.4%) | 0 (0.0%) |
| 7+ Person Households | 5 (0.6%) | 0 (0.0%) |
| Total | 527 (67.2%) | 257 (32.8%) |
Female Fertility in Raven
Fertility by Age in Raven
Average fertility rate in Raven is 59.0 births per 1,000 women. Women in the age bracket of 20 to 34 years have the highest fertility rate with 297.0 births per 1,000 women. Women in the age bracket of 20 to 34 years acount for 100.0% of all women with births.
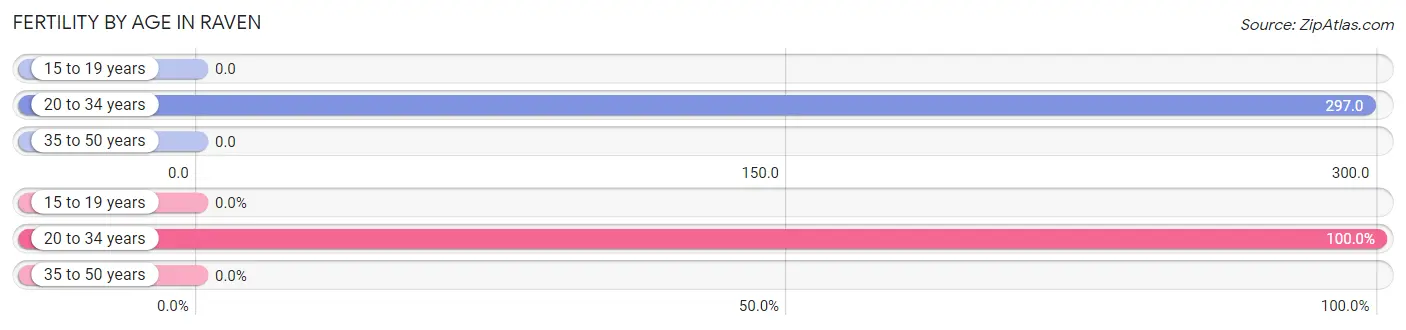
| Age Bracket | Women with Births | Births / 1,000 Women |
| 15 to 19 years | 0 (0.0%) | 0.0 |
| 20 to 34 years | 33 (100.0%) | 297.0 |
| 35 to 50 years | 0 (0.0%) | 0.0 |
| Total | 33 (100.0%) | 59.0 |
Fertility by Age by Marriage Status in Raven
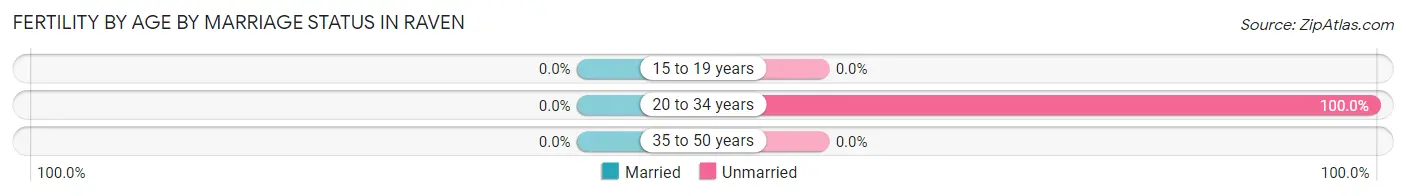
| Age Bracket | Married | Unmarried |
| 15 to 19 years | 0 (0.0%) | 0 (0.0%) |
| 20 to 34 years | 0 (0.0%) | 33 (100.0%) |
| 35 to 50 years | 0 (0.0%) | 0 (0.0%) |
| Total | 0 (0.0%) | 33 (100.0%) |
Fertility by Education in Raven
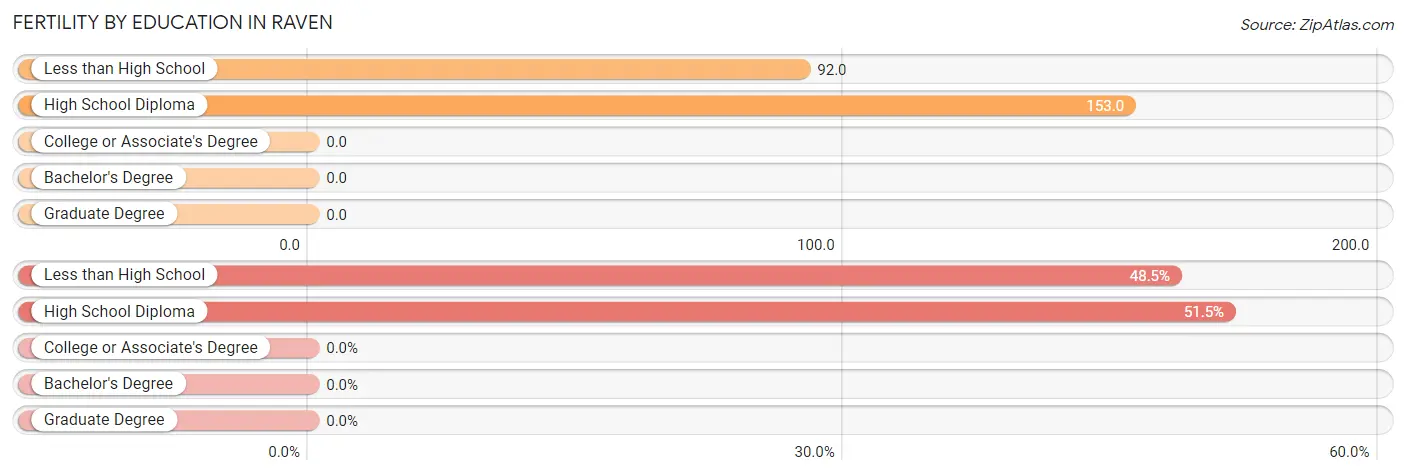
| Educational Attainment | Women with Births | Births / 1,000 Women |
| Less than High School | 16 (48.5%) | 92.0 |
| High School Diploma | 17 (51.5%) | 153.0 |
| College or Associate's Degree | 0 (0.0%) | 0.0 |
| Bachelor's Degree | 0 (0.0%) | 0.0 |
| Graduate Degree | 0 (0.0%) | 0.0 |
| Total | 33 (100.0%) | 59.0 |
Fertility by Education by Marriage Status in Raven
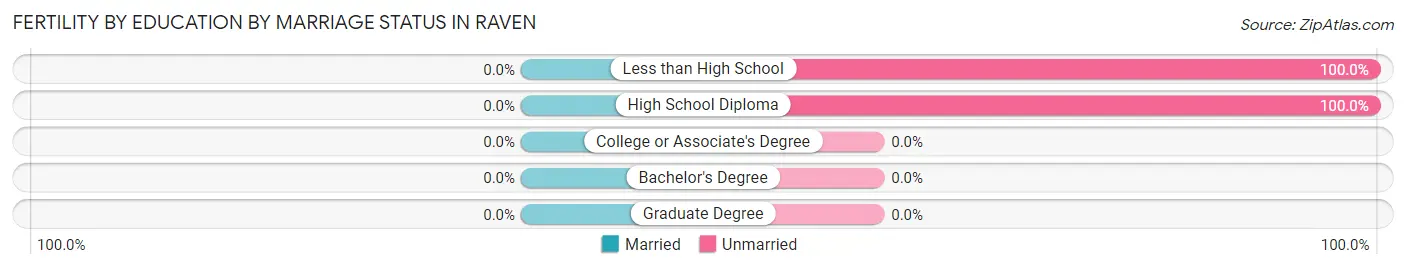
| Educational Attainment | Married | Unmarried |
| Less than High School | 0 (0.0%) | 16 (100.0%) |
| High School Diploma | 0 (0.0%) | 17 (100.0%) |
| College or Associate's Degree | 0 (0.0%) | 0 (0.0%) |
| Bachelor's Degree | 0 (0.0%) | 0 (0.0%) |
| Graduate Degree | 0 (0.0%) | 0 (0.0%) |
| Total | 0 (0.0%) | 33 (100.0%) |
Employment Characteristics in Raven
Employment by Class of Employer in Raven
Among the 569 employed individuals in Raven, private company employees (457 | 80.3%), not-for-profit organizations (71 | 12.5%), and state government employees (16 | 2.8%) make up the most common classes of employment.
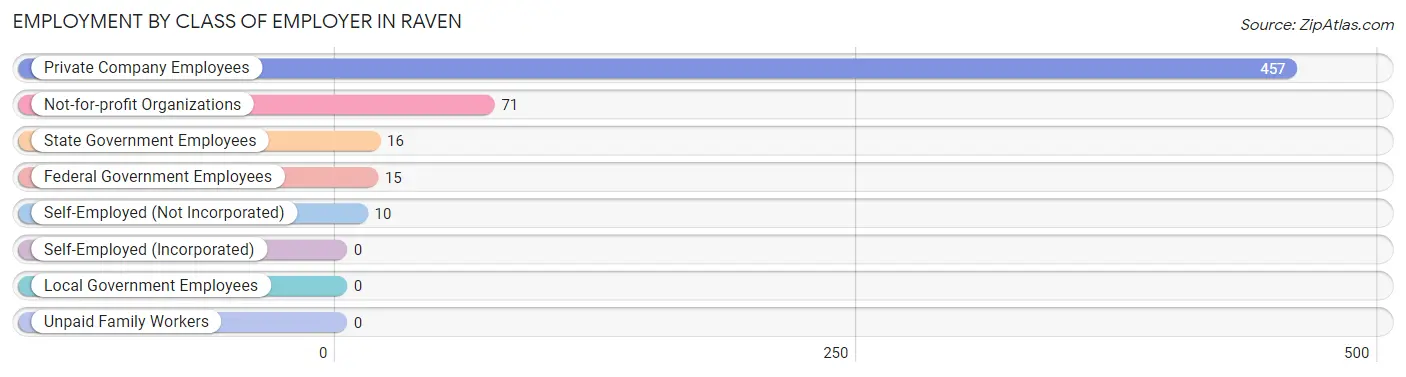
| Employer Class | # Employees | % Employees |
| Private Company Employees | 457 | 80.3% |
| Self-Employed (Incorporated) | 0 | 0.0% |
| Self-Employed (Not Incorporated) | 10 | 1.8% |
| Not-for-profit Organizations | 71 | 12.5% |
| Local Government Employees | 0 | 0.0% |
| State Government Employees | 16 | 2.8% |
| Federal Government Employees | 15 | 2.6% |
| Unpaid Family Workers | 0 | 0.0% |
| Total | 569 | 100.0% |
Employment Status by Age in Raven
According to the labor force statistics for Raven, out of the total population over 16 years of age (1,663), 39.4% or 655 individuals are in the labor force, with 12.2% or 80 of them unemployed. The age group with the highest labor force participation rate is 20 to 24 years, with 80.3% or 94 individuals in the labor force. Within the labor force, the 20 to 24 years age range has the highest percentage of unemployed individuals, with 73.4% or 69 of them being unemployed.
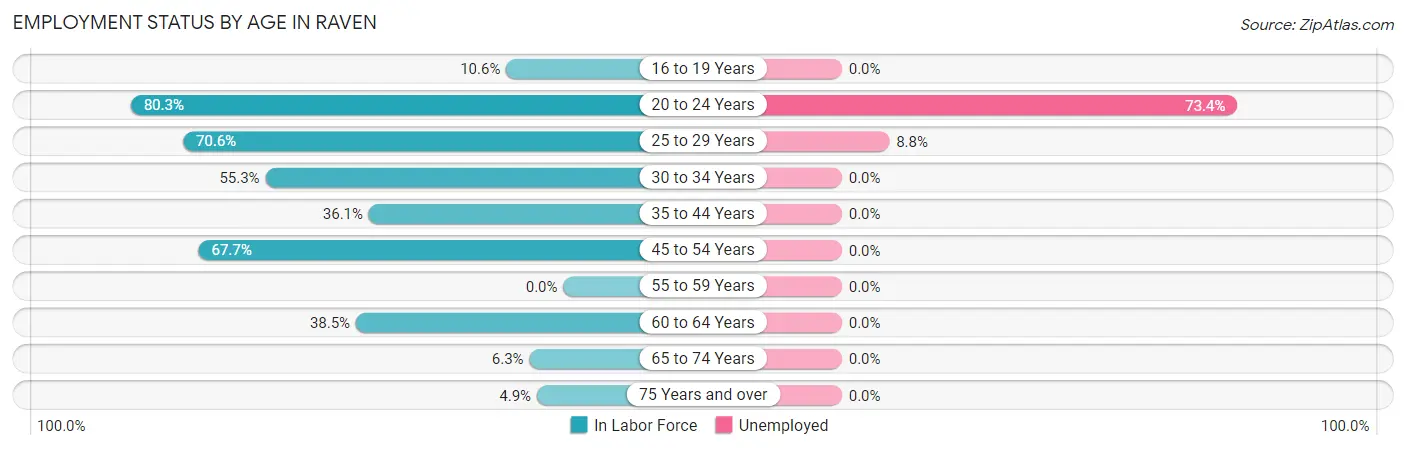
| Age Bracket | In Labor Force | Unemployed |
| 16 to 19 Years | 16 (10.6%) | 0 (0.0%) |
| 20 to 24 Years | 94 (80.3%) | 69 (73.4%) |
| 25 to 29 Years | 125 (70.6%) | 11 (8.8%) |
| 30 to 34 Years | 21 (55.3%) | 0 (0.0%) |
| 35 to 44 Years | 39 (36.1%) | 0 (0.0%) |
| 45 to 54 Years | 285 (67.7%) | 0 (0.0%) |
| 55 to 59 Years | 0 (0.0%) | 0 (0.0%) |
| 60 to 64 Years | 47 (38.5%) | 0 (0.0%) |
| 65 to 74 Years | 22 (6.3%) | 0 (0.0%) |
| 75 Years and over | 7 (4.9%) | 0 (0.0%) |
| Total | 655 (39.4%) | 80 (12.2%) |
Employment Status by Educational Attainment in Raven
According to labor force statistics for Raven, 57.4% of individuals (517) out of the total population between 25 and 64 years of age (900) are in the labor force, with 2.1% or 11 of them being unemployed. The group with the highest labor force participation rate are those with the educational attainment of bachelor's degree or higher, with 93.1% or 95 individuals in the labor force. Within the labor force, individuals with less than high school education have the highest percentage of unemployment, with 36.7% or 11 of them being unemployed.
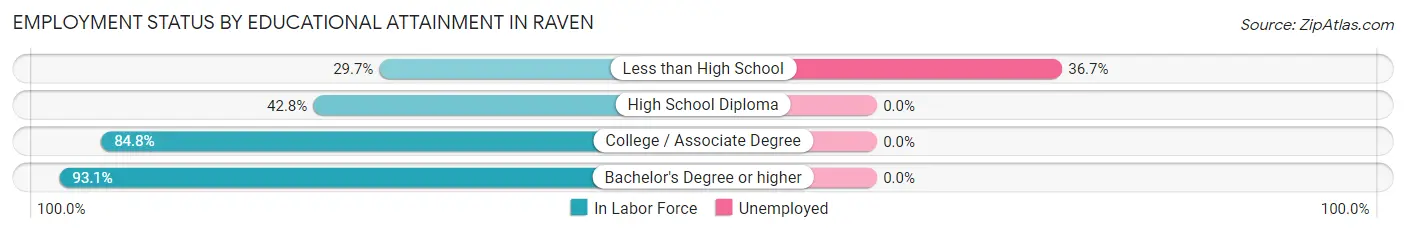
| Educational Attainment | In Labor Force | Unemployed |
| Less than High School | 30 (29.7%) | 37 (36.7%) |
| High School Diploma | 203 (42.8%) | 0 (0.0%) |
| College / Associate Degree | 189 (84.8%) | 0 (0.0%) |
| Bachelor's Degree or higher | 95 (93.1%) | 0 (0.0%) |
| Total | 517 (57.4%) | 19 (2.1%) |
Employment Occupations by Sex in Raven
Management, Business, Science and Arts Occupations
The most common Management, Business, Science and Arts occupations in Raven are Health Diagnosing & Treating (64 | 11.1%), Community & Social Service (38 | 6.6%), Health Technologists (33 | 5.7%), Legal Services & Support (31 | 5.4%), and Business & Financial (8 | 1.4%).
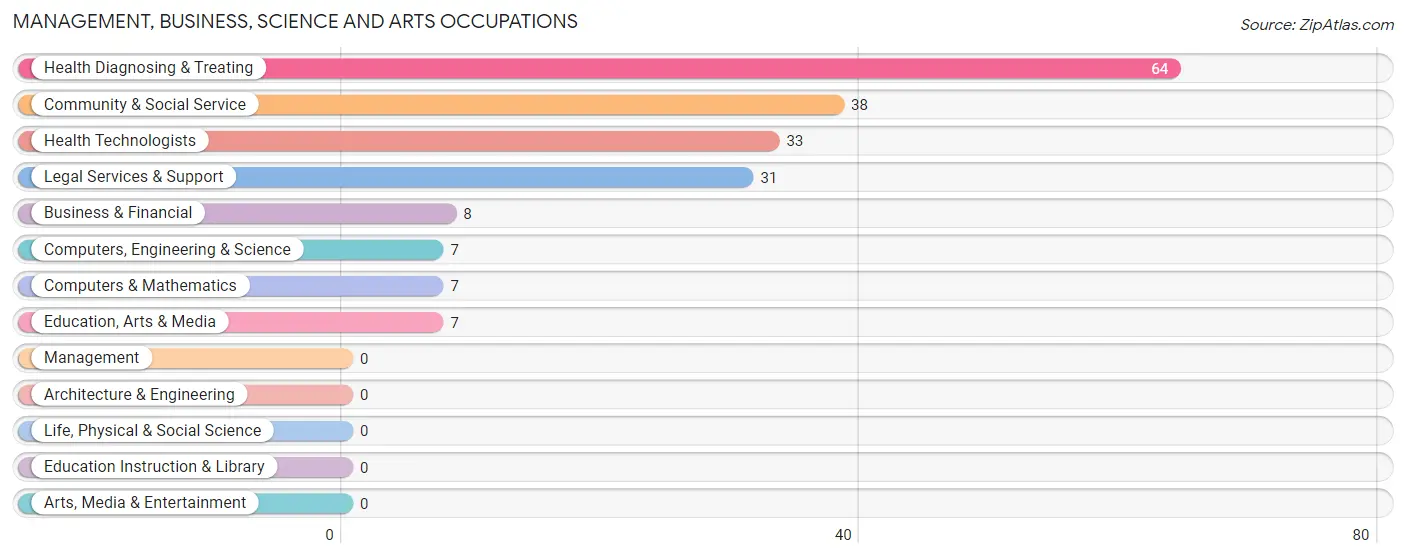
Management, Business, Science and Arts Occupations by Sex
Within the Management, Business, Science and Arts occupations in Raven, the most male-oriented occupations are Computers, Engineering & Science (100.0%), Computers & Mathematics (100.0%), and Education, Arts & Media (100.0%), while the most female-oriented occupations are Business & Financial (100.0%), Health Diagnosing & Treating (100.0%), and Health Technologists (100.0%).
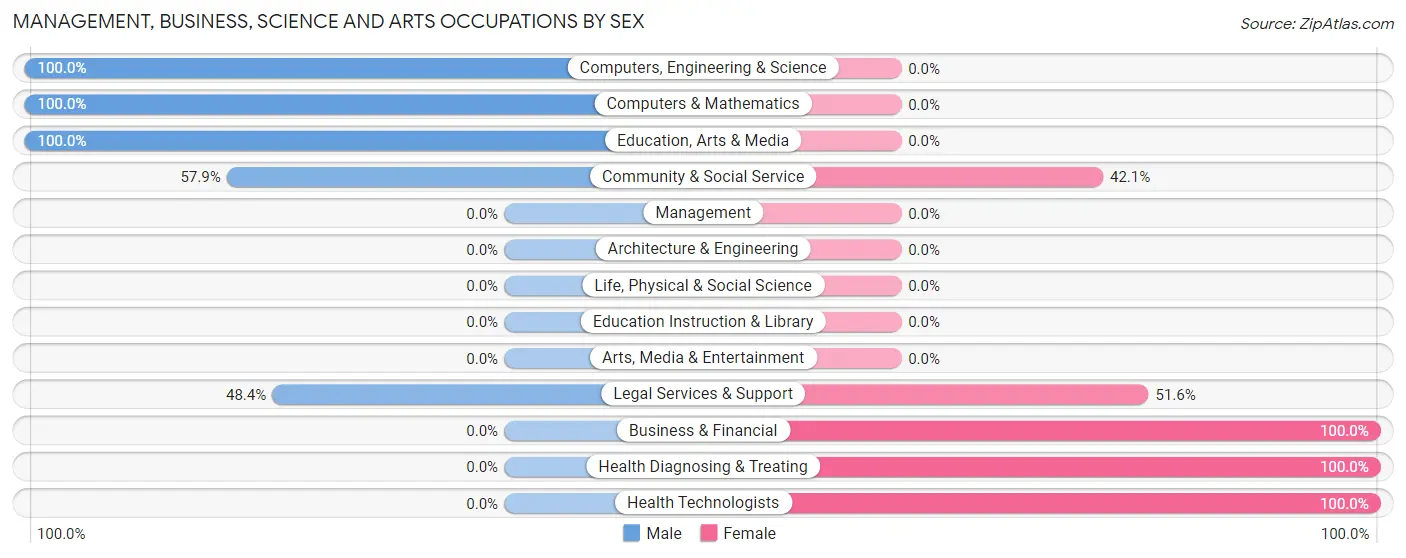
| Occupation | Male | Female |
| Management | 0 (0.0%) | 0 (0.0%) |
| Business & Financial | 0 (0.0%) | 8 (100.0%) |
| Computers, Engineering & Science | 7 (100.0%) | 0 (0.0%) |
| Computers & Mathematics | 7 (100.0%) | 0 (0.0%) |
| Architecture & Engineering | 0 (0.0%) | 0 (0.0%) |
| Life, Physical & Social Science | 0 (0.0%) | 0 (0.0%) |
| Community & Social Service | 22 (57.9%) | 16 (42.1%) |
| Education, Arts & Media | 7 (100.0%) | 0 (0.0%) |
| Legal Services & Support | 15 (48.4%) | 16 (51.6%) |
| Education Instruction & Library | 0 (0.0%) | 0 (0.0%) |
| Arts, Media & Entertainment | 0 (0.0%) | 0 (0.0%) |
| Health Diagnosing & Treating | 0 (0.0%) | 64 (100.0%) |
| Health Technologists | 0 (0.0%) | 33 (100.0%) |
| Total (Category) | 29 (24.8%) | 88 (75.2%) |
| Total (Overall) | 248 (43.1%) | 328 (56.9%) |
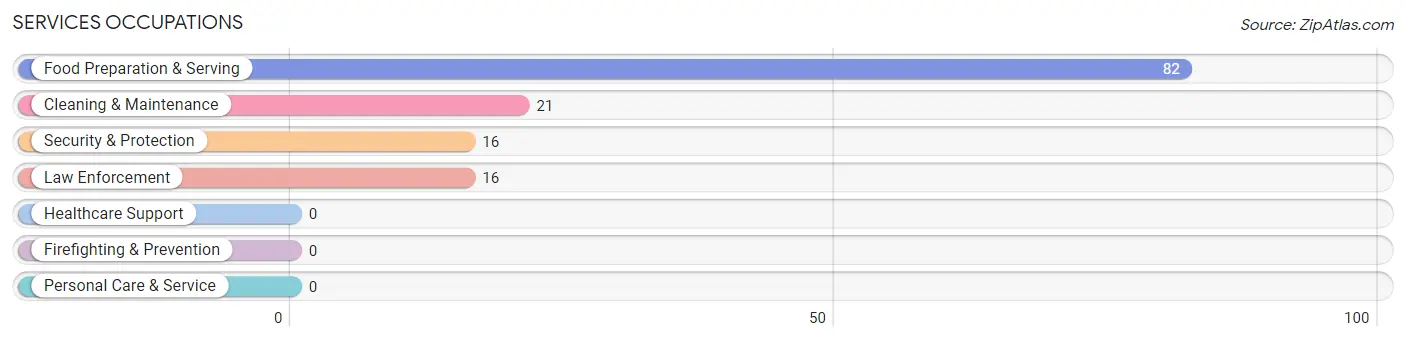
Services Occupations
The most common Services occupations in Raven are Food Preparation & Serving (82 | 14.2%), Cleaning & Maintenance (21 | 3.6%), Security & Protection (16 | 2.8%), and Law Enforcement (16 | 2.8%).
Services Occupations by Sex
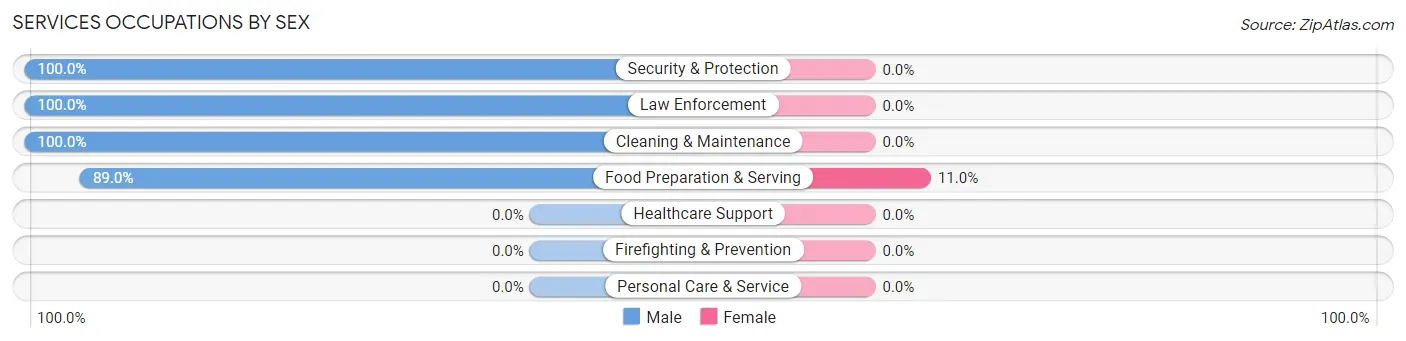
| Occupation | Male | Female |
| Healthcare Support | 0 (0.0%) | 0 (0.0%) |
| Security & Protection | 16 (100.0%) | 0 (0.0%) |
| Firefighting & Prevention | 0 (0.0%) | 0 (0.0%) |
| Law Enforcement | 16 (100.0%) | 0 (0.0%) |
| Food Preparation & Serving | 73 (89.0%) | 9 (11.0%) |
| Cleaning & Maintenance | 21 (100.0%) | 0 (0.0%) |
| Personal Care & Service | 0 (0.0%) | 0 (0.0%) |
| Total (Category) | 110 (92.4%) | 9 (7.6%) |
| Total (Overall) | 248 (43.1%) | 328 (56.9%) |
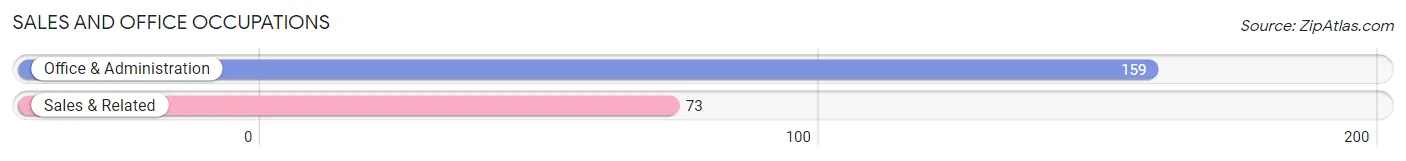
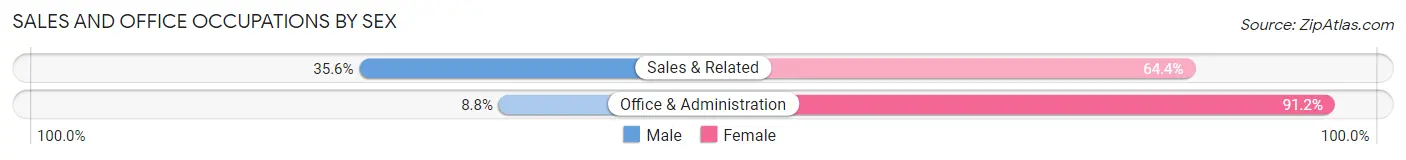
Sales and Office Occupations
The most common Sales and Office occupations in Raven are Office & Administration (159 | 27.6%), and Sales & Related (73 | 12.7%).
Sales and Office Occupations by Sex
| Occupation | Male | Female |
| Sales & Related | 26 (35.6%) | 47 (64.4%) |
| Office & Administration | 14 (8.8%) | 145 (91.2%) |
| Total (Category) | 40 (17.2%) | 192 (82.8%) |
| Total (Overall) | 248 (43.1%) | 328 (56.9%) |
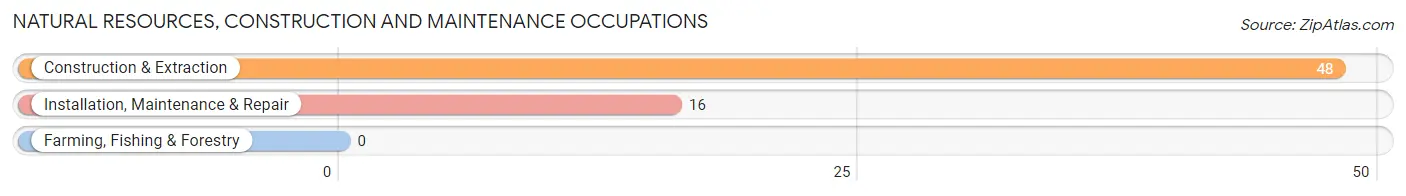
Natural Resources, Construction and Maintenance Occupations
The most common Natural Resources, Construction and Maintenance occupations in Raven are Construction & Extraction (48 | 8.3%), and Installation, Maintenance & Repair (16 | 2.8%).
Natural Resources, Construction and Maintenance Occupations by Sex
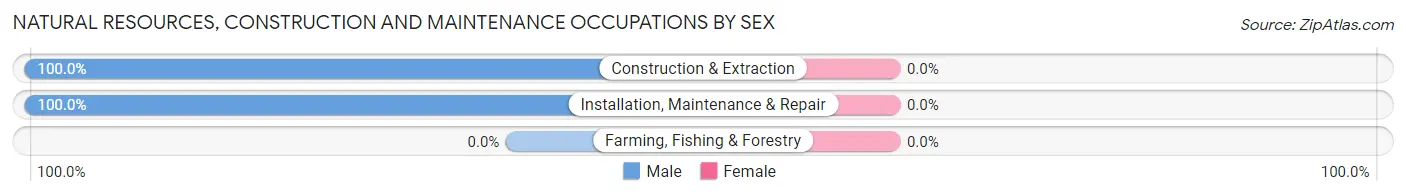
| Occupation | Male | Female |
| Farming, Fishing & Forestry | 0 (0.0%) | 0 (0.0%) |
| Construction & Extraction | 48 (100.0%) | 0 (0.0%) |
| Installation, Maintenance & Repair | 16 (100.0%) | 0 (0.0%) |
| Total (Category) | 64 (100.0%) | 0 (0.0%) |
| Total (Overall) | 248 (43.1%) | 328 (56.9%) |
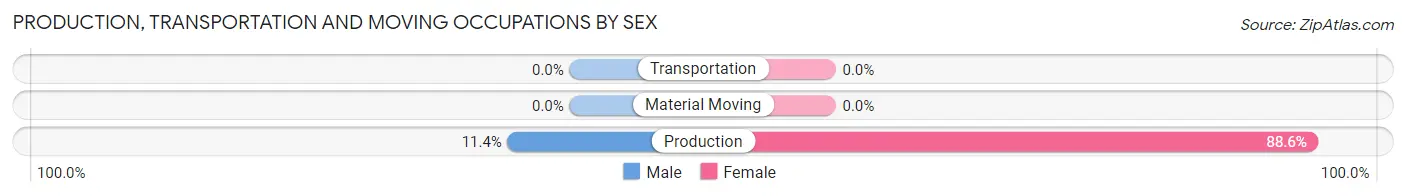
Production, Transportation and Moving Occupations
The most common Production, Transportation and Moving occupations in Raven are , and Production (44 | 7.6%).
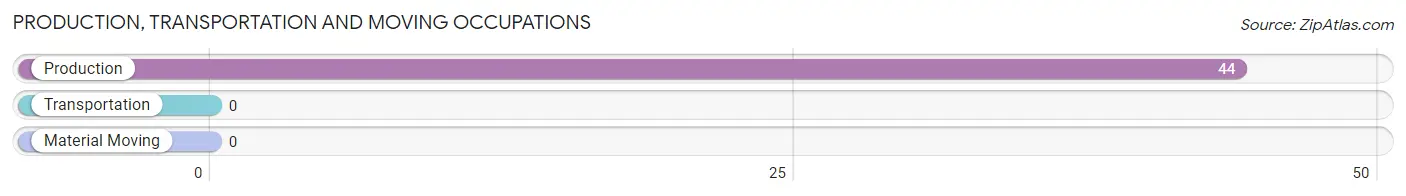
Production, Transportation and Moving Occupations by Sex
| Occupation | Male | Female |
| Production | 5 (11.4%) | 39 (88.6%) |
| Transportation | 0 (0.0%) | 0 (0.0%) |
| Material Moving | 0 (0.0%) | 0 (0.0%) |
| Total (Category) | 5 (11.4%) | 39 (88.6%) |
| Total (Overall) | 248 (43.1%) | 328 (56.9%) |
Employment Industries by Sex in Raven
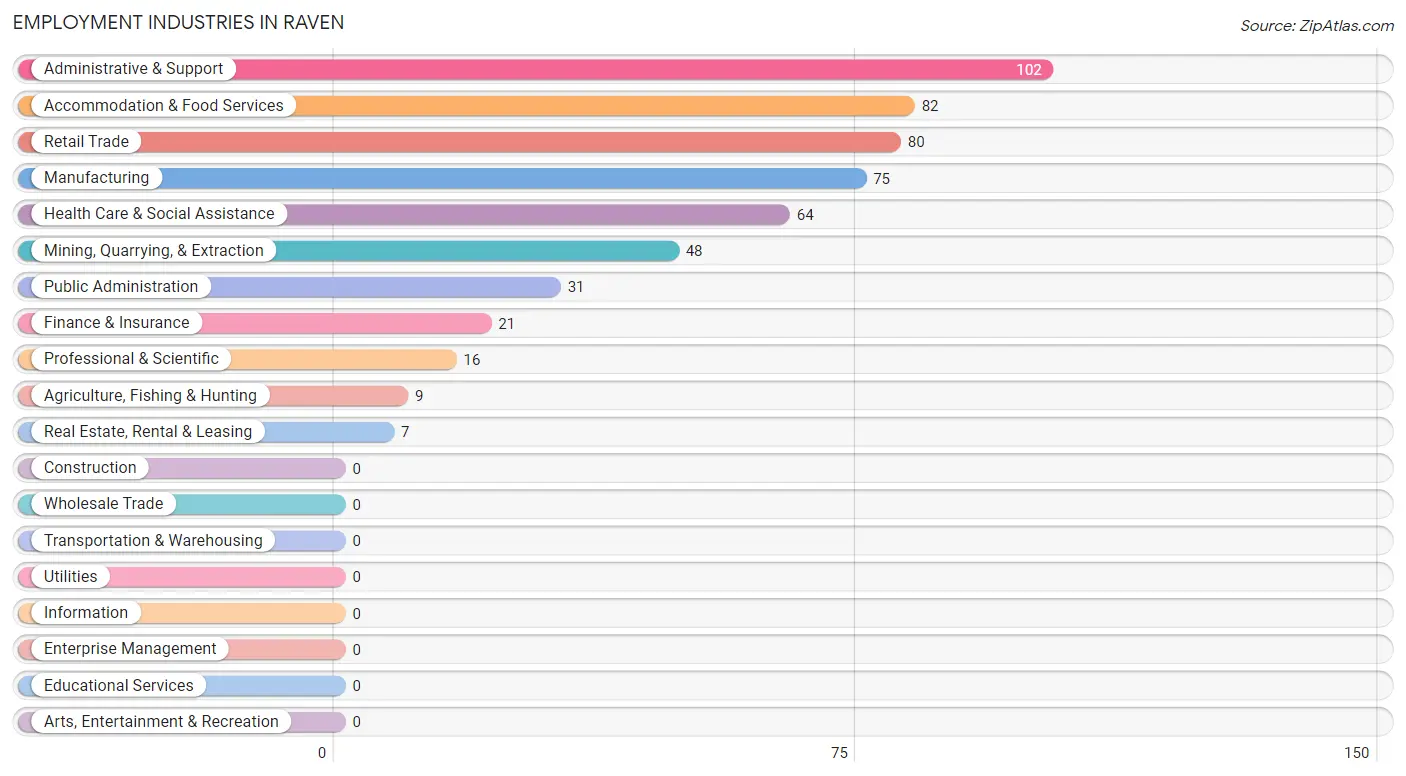
Employment Industries in Raven
The major employment industries in Raven include Administrative & Support (102 | 17.7%), Accommodation & Food Services (82 | 14.2%), Retail Trade (80 | 13.9%), Manufacturing (75 | 13.0%), and Health Care & Social Assistance (64 | 11.1%).
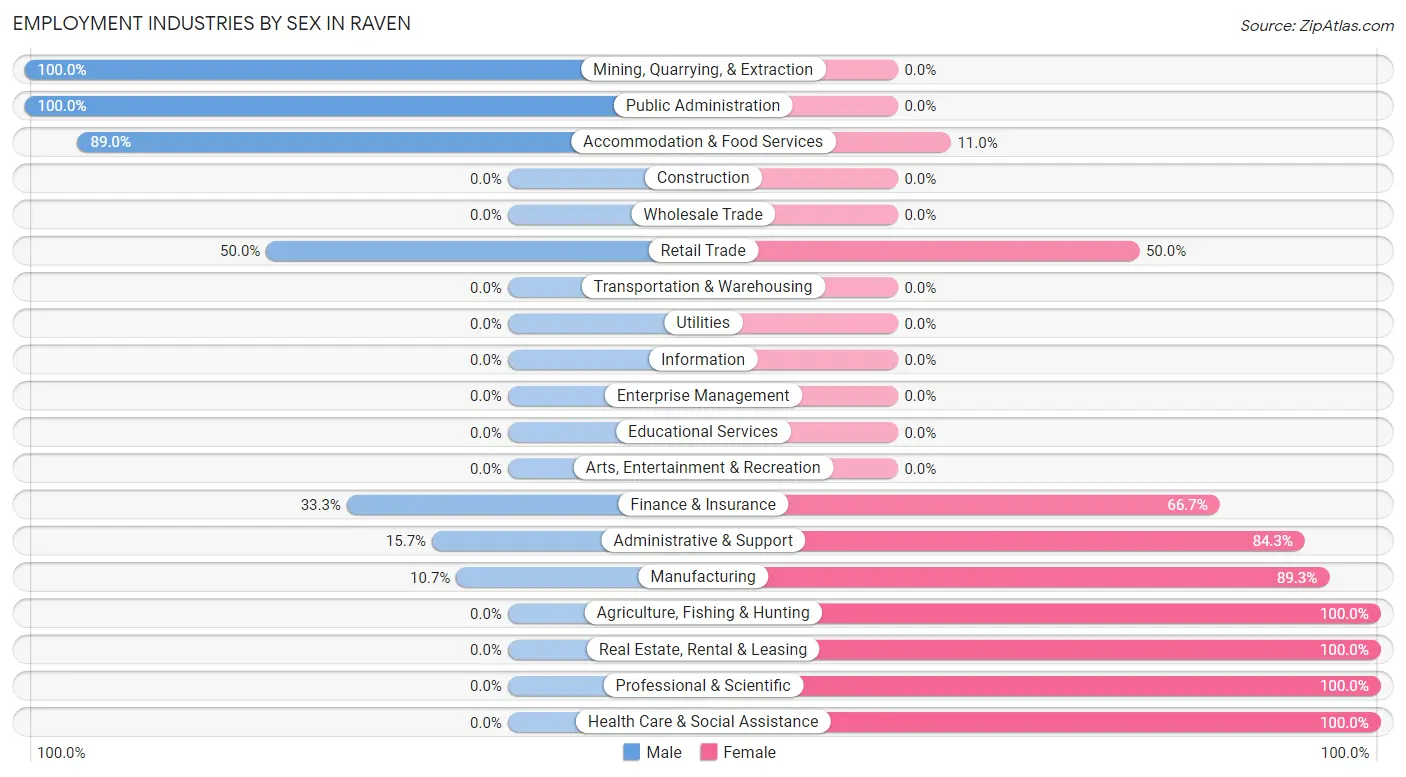
Employment Industries by Sex in Raven
The Raven industries that see more men than women are Mining, Quarrying, & Extraction (100.0%), Public Administration (100.0%), and Accommodation & Food Services (89.0%), whereas the industries that tend to have a higher number of women are Agriculture, Fishing & Hunting (100.0%), Real Estate, Rental & Leasing (100.0%), and Professional & Scientific (100.0%).
| Industry | Male | Female |
| Agriculture, Fishing & Hunting | 0 (0.0%) | 9 (100.0%) |
| Mining, Quarrying, & Extraction | 48 (100.0%) | 0 (0.0%) |
| Construction | 0 (0.0%) | 0 (0.0%) |
| Manufacturing | 8 (10.7%) | 67 (89.3%) |
| Wholesale Trade | 0 (0.0%) | 0 (0.0%) |
| Retail Trade | 40 (50.0%) | 40 (50.0%) |
| Transportation & Warehousing | 0 (0.0%) | 0 (0.0%) |
| Utilities | 0 (0.0%) | 0 (0.0%) |
| Information | 0 (0.0%) | 0 (0.0%) |
| Finance & Insurance | 7 (33.3%) | 14 (66.7%) |
| Real Estate, Rental & Leasing | 0 (0.0%) | 7 (100.0%) |
| Professional & Scientific | 0 (0.0%) | 16 (100.0%) |
| Enterprise Management | 0 (0.0%) | 0 (0.0%) |
| Administrative & Support | 16 (15.7%) | 86 (84.3%) |
| Educational Services | 0 (0.0%) | 0 (0.0%) |
| Health Care & Social Assistance | 0 (0.0%) | 64 (100.0%) |
| Arts, Entertainment & Recreation | 0 (0.0%) | 0 (0.0%) |
| Accommodation & Food Services | 73 (89.0%) | 9 (11.0%) |
| Public Administration | 31 (100.0%) | 0 (0.0%) |
| Total | 248 (43.1%) | 328 (56.9%) |
Education in Raven
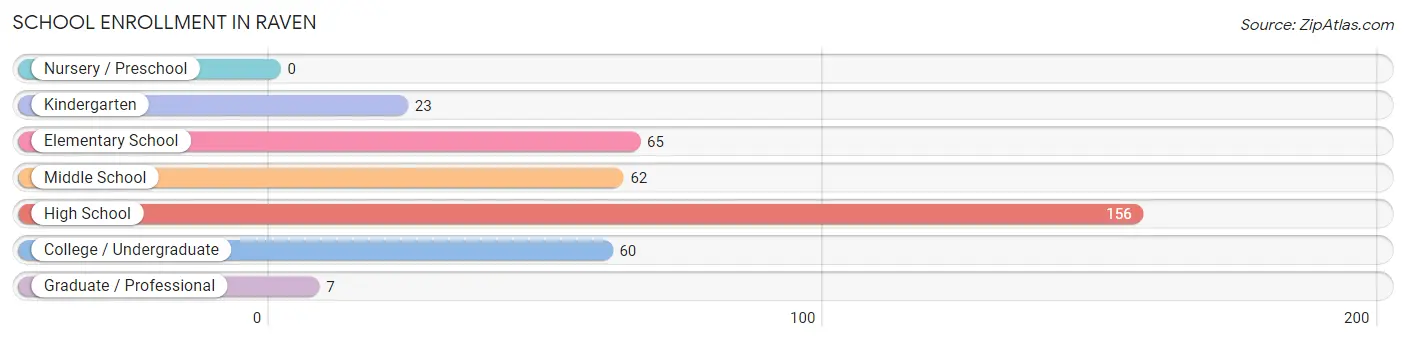
School Enrollment in Raven
The most common levels of schooling among the 373 students in Raven are high school (156 | 41.8%), elementary school (65 | 17.4%), and middle school (62 | 16.6%).
| School Level | # Students | % Students |
| Nursery / Preschool | 0 | 0.0% |
| Kindergarten | 23 | 6.2% |
| Elementary School | 65 | 17.4% |
| Middle School | 62 | 16.6% |
| High School | 156 | 41.8% |
| College / Undergraduate | 60 | 16.1% |
| Graduate / Professional | 7 | 1.9% |
| Total | 373 | 100.0% |
School Enrollment by Age by Funding Source in Raven
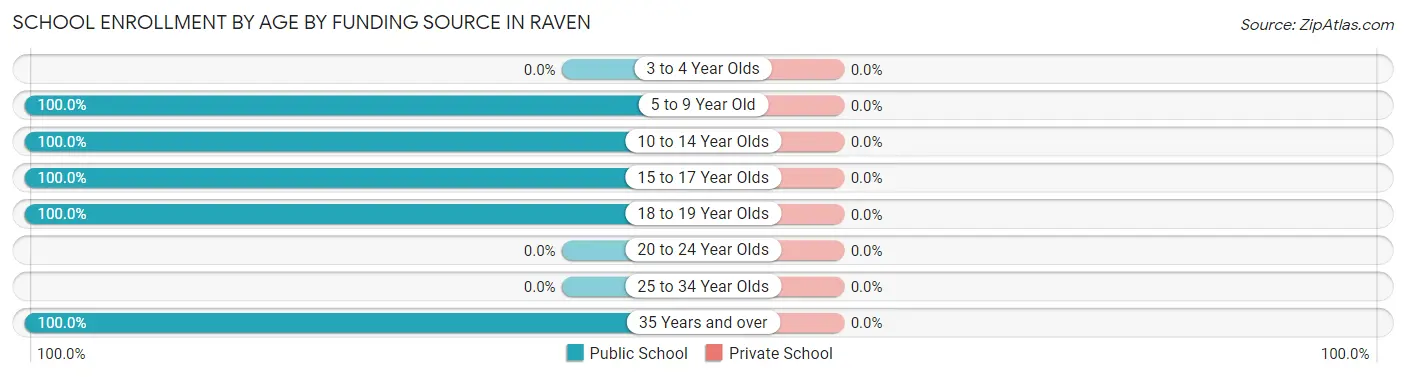
| Age Bracket | Public School | Private School |
| 3 to 4 Year Olds | 0 (0.0%) | 0 (0.0%) |
| 5 to 9 Year Old | 81 (100.0%) | 0 (0.0%) |
| 10 to 14 Year Olds | 79 (100.0%) | 0 (0.0%) |
| 15 to 17 Year Olds | 146 (100.0%) | 0 (0.0%) |
| 18 to 19 Year Olds | 60 (100.0%) | 0 (0.0%) |
| 20 to 24 Year Olds | 0 (0.0%) | 0 (0.0%) |
| 25 to 34 Year Olds | 0 (0.0%) | 0 (0.0%) |
| 35 Years and over | 7 (100.0%) | 0 (0.0%) |
| Total | 373 (100.0%) | 0 (0.0%) |
Educational Attainment by Field of Study in Raven
Arts & humanities (57 | 27.4%), physical & health sciences (49 | 23.6%), business (43 | 20.7%), science & technology (33 | 15.9%), and communications (19 | 9.1%) are the most common fields of study among 208 individuals in Raven who have obtained a bachelor's degree or higher.
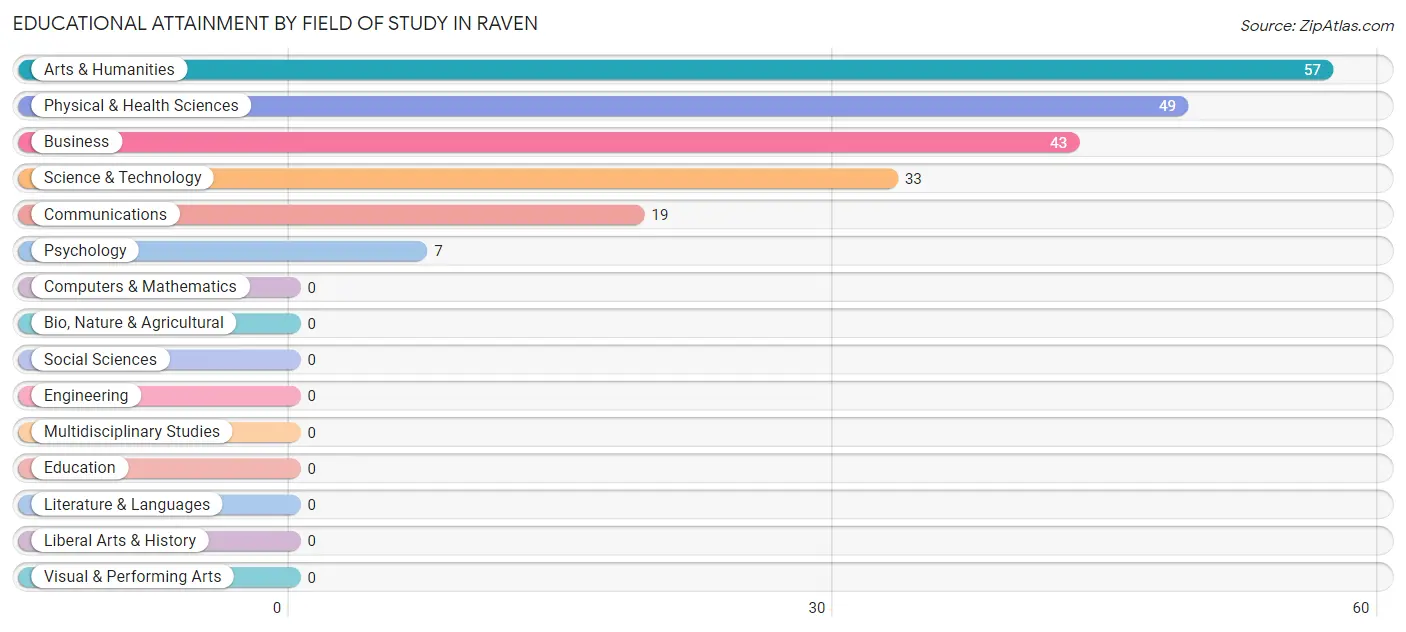
| Field of Study | # Graduates | % Graduates |
| Computers & Mathematics | 0 | 0.0% |
| Bio, Nature & Agricultural | 0 | 0.0% |
| Physical & Health Sciences | 49 | 23.6% |
| Psychology | 7 | 3.4% |
| Social Sciences | 0 | 0.0% |
| Engineering | 0 | 0.0% |
| Multidisciplinary Studies | 0 | 0.0% |
| Science & Technology | 33 | 15.9% |
| Business | 43 | 20.7% |
| Education | 0 | 0.0% |
| Literature & Languages | 0 | 0.0% |
| Liberal Arts & History | 0 | 0.0% |
| Visual & Performing Arts | 0 | 0.0% |
| Communications | 19 | 9.1% |
| Arts & Humanities | 57 | 27.4% |
| Total | 208 | 100.0% |
Transportation & Commute in Raven
Vehicle Availability by Sex in Raven
The most prevalent vehicle ownership categories in Raven are males with 1 vehicle (92, accounting for 37.1%) and females with 1 vehicle (35, making up 28.7%).
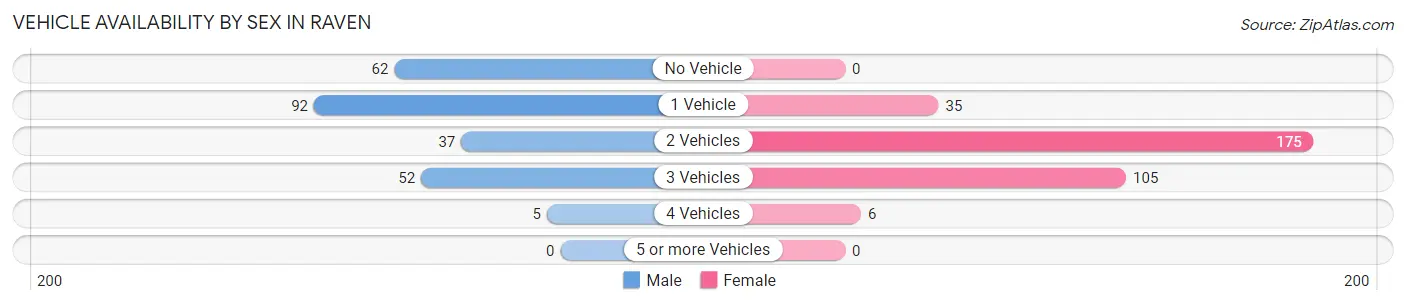
| Vehicles Available | Male | Female |
| No Vehicle | 62 (25.0%) | 0 (0.0%) |
| 1 Vehicle | 92 (37.1%) | 35 (10.9%) |
| 2 Vehicles | 37 (14.9%) | 175 (54.5%) |
| 3 Vehicles | 52 (21.0%) | 105 (32.7%) |
| 4 Vehicles | 5 (2.0%) | 6 (1.9%) |
| 5 or more Vehicles | 0 (0.0%) | 0 (0.0%) |
| Total | 248 (100.0%) | 321 (100.0%) |
Commute Time in Raven
The most frequently occuring commute durations in Raven are 45 to 59 minutes (133 commuters, 23.9%), 5 to 9 minutes (106 commuters, 19.0%), and 35 to 39 minutes (93 commuters, 16.7%).
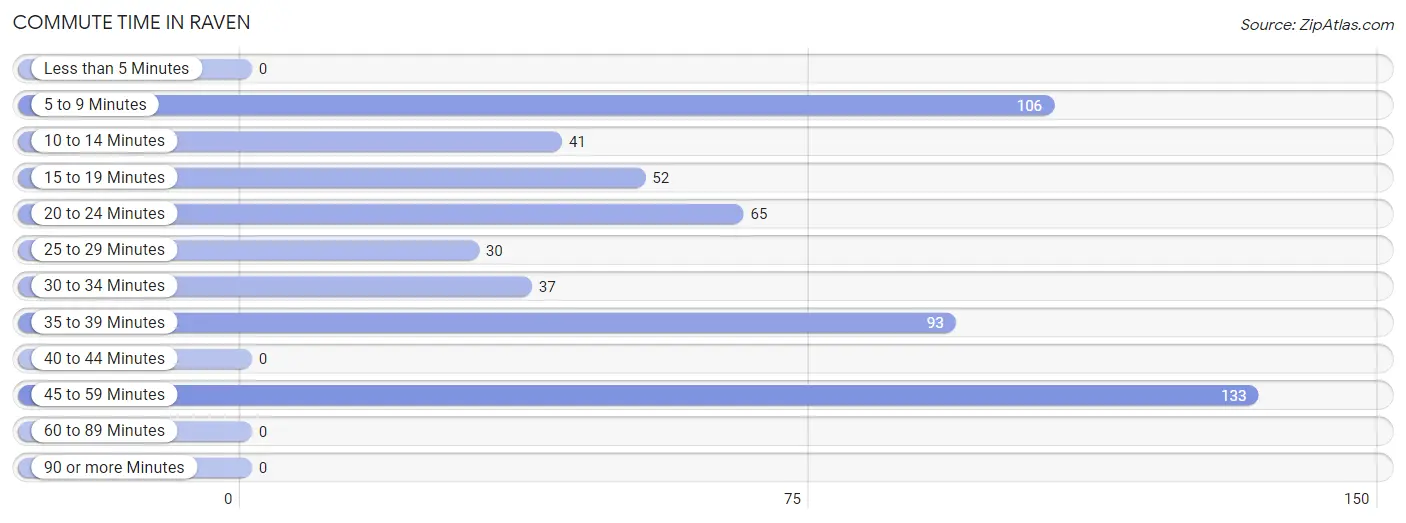
| Commute Time | # Commuters | % Commuters |
| Less than 5 Minutes | 0 | 0.0% |
| 5 to 9 Minutes | 106 | 19.0% |
| 10 to 14 Minutes | 41 | 7.4% |
| 15 to 19 Minutes | 52 | 9.3% |
| 20 to 24 Minutes | 65 | 11.7% |
| 25 to 29 Minutes | 30 | 5.4% |
| 30 to 34 Minutes | 37 | 6.6% |
| 35 to 39 Minutes | 93 | 16.7% |
| 40 to 44 Minutes | 0 | 0.0% |
| 45 to 59 Minutes | 133 | 23.9% |
| 60 to 89 Minutes | 0 | 0.0% |
| 90 or more Minutes | 0 | 0.0% |
Commute Time by Sex in Raven
The most common commute times in Raven are 45 to 59 minutes (61 commuters, 24.6%) for males and 35 to 39 minutes (86 commuters, 27.8%) for females.
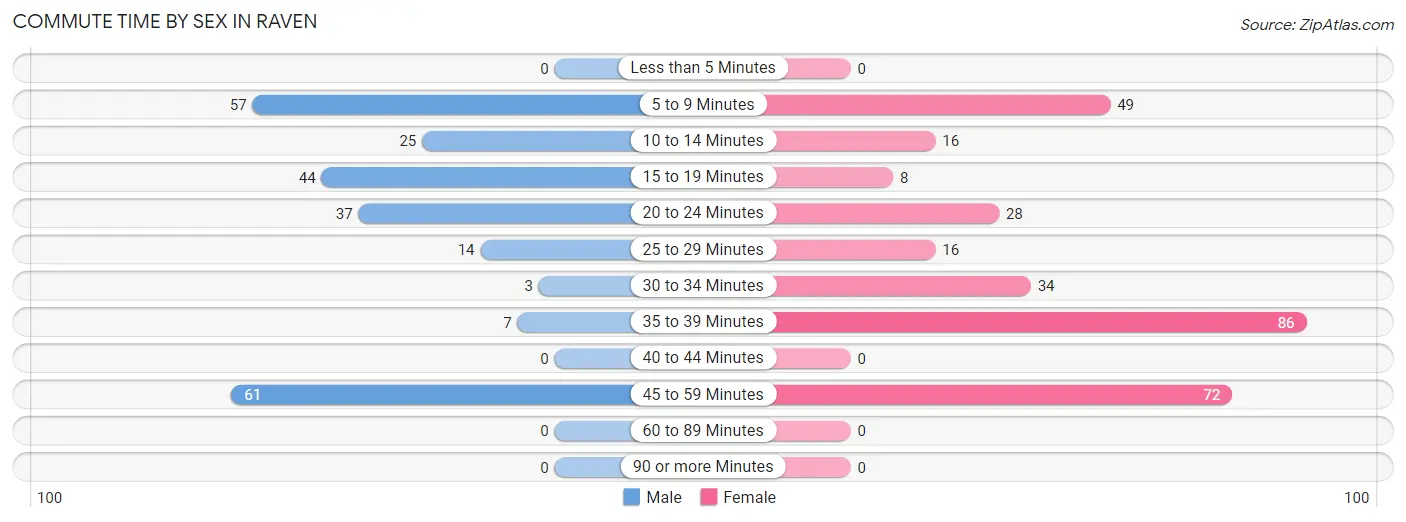
| Commute Time | Male | Female |
| Less than 5 Minutes | 0 (0.0%) | 0 (0.0%) |
| 5 to 9 Minutes | 57 (23.0%) | 49 (15.9%) |
| 10 to 14 Minutes | 25 (10.1%) | 16 (5.2%) |
| 15 to 19 Minutes | 44 (17.7%) | 8 (2.6%) |
| 20 to 24 Minutes | 37 (14.9%) | 28 (9.1%) |
| 25 to 29 Minutes | 14 (5.7%) | 16 (5.2%) |
| 30 to 34 Minutes | 3 (1.2%) | 34 (11.0%) |
| 35 to 39 Minutes | 7 (2.8%) | 86 (27.8%) |
| 40 to 44 Minutes | 0 (0.0%) | 0 (0.0%) |
| 45 to 59 Minutes | 61 (24.6%) | 72 (23.3%) |
| 60 to 89 Minutes | 0 (0.0%) | 0 (0.0%) |
| 90 or more Minutes | 0 (0.0%) | 0 (0.0%) |
Time of Departure to Work by Sex in Raven
The most frequent times of departure to work in Raven are 7:00 AM to 7:29 AM (73, 29.4%) for males and 9:00 AM to 9:59 AM (94, 30.4%) for females.
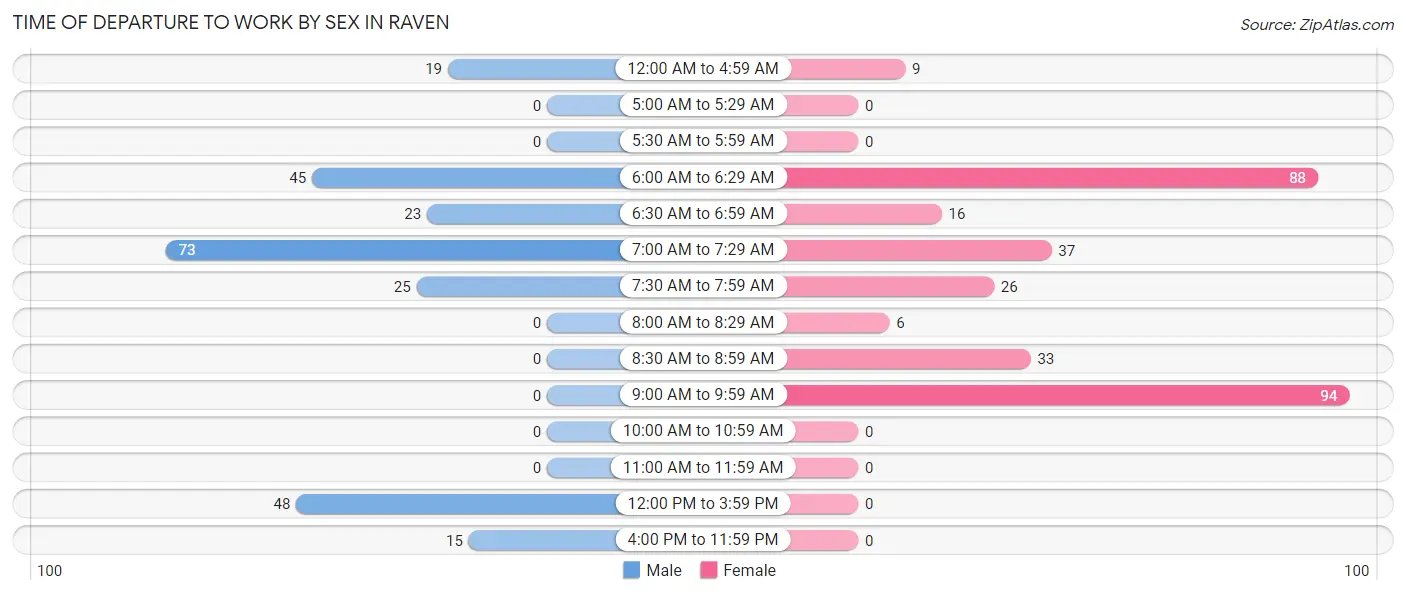
| Time of Departure | Male | Female |
| 12:00 AM to 4:59 AM | 19 (7.7%) | 9 (2.9%) |
| 5:00 AM to 5:29 AM | 0 (0.0%) | 0 (0.0%) |
| 5:30 AM to 5:59 AM | 0 (0.0%) | 0 (0.0%) |
| 6:00 AM to 6:29 AM | 45 (18.1%) | 88 (28.5%) |
| 6:30 AM to 6:59 AM | 23 (9.3%) | 16 (5.2%) |
| 7:00 AM to 7:29 AM | 73 (29.4%) | 37 (12.0%) |
| 7:30 AM to 7:59 AM | 25 (10.1%) | 26 (8.4%) |
| 8:00 AM to 8:29 AM | 0 (0.0%) | 6 (1.9%) |
| 8:30 AM to 8:59 AM | 0 (0.0%) | 33 (10.7%) |
| 9:00 AM to 9:59 AM | 0 (0.0%) | 94 (30.4%) |
| 10:00 AM to 10:59 AM | 0 (0.0%) | 0 (0.0%) |
| 11:00 AM to 11:59 AM | 0 (0.0%) | 0 (0.0%) |
| 12:00 PM to 3:59 PM | 48 (19.4%) | 0 (0.0%) |
| 4:00 PM to 11:59 PM | 15 (6.0%) | 0 (0.0%) |
| Total | 248 (100.0%) | 309 (100.0%) |
Housing Occupancy in Raven
Occupancy by Ownership in Raven
Of the total 784 dwellings in Raven, owner-occupied units account for 478 (61.0%), while renter-occupied units make up 306 (39.0%).
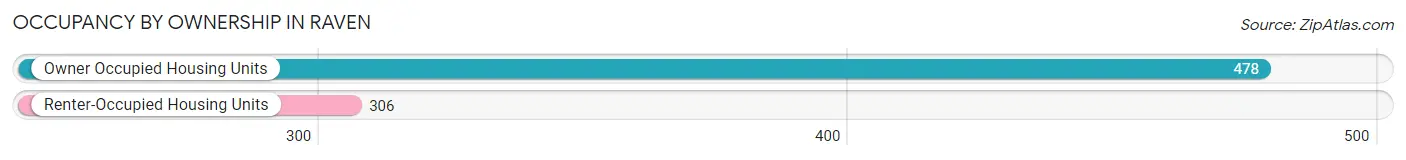
| Occupancy | # Housing Units | % Housing Units |
| Owner Occupied Housing Units | 478 | 61.0% |
| Renter-Occupied Housing Units | 306 | 39.0% |
| Total Occupied Housing Units | 784 | 100.0% |
Occupancy by Household Size in Raven
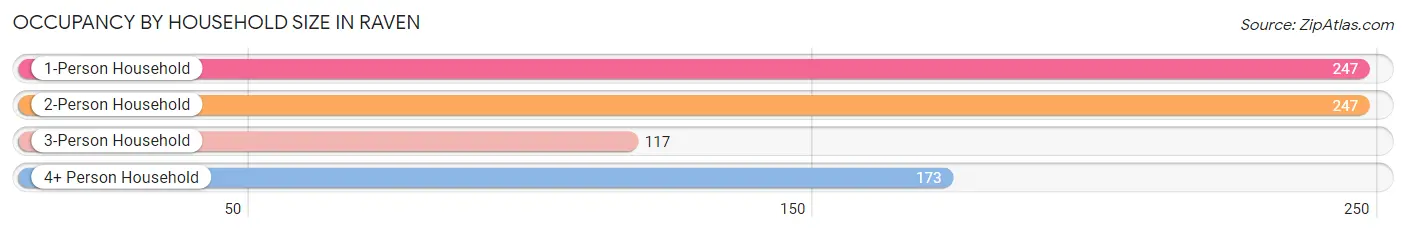
| Household Size | # Housing Units | % Housing Units |
| 1-Person Household | 247 | 31.5% |
| 2-Person Household | 247 | 31.5% |
| 3-Person Household | 117 | 14.9% |
| 4+ Person Household | 173 | 22.1% |
| Total Housing Units | 784 | 100.0% |
Occupancy by Ownership by Household Size in Raven
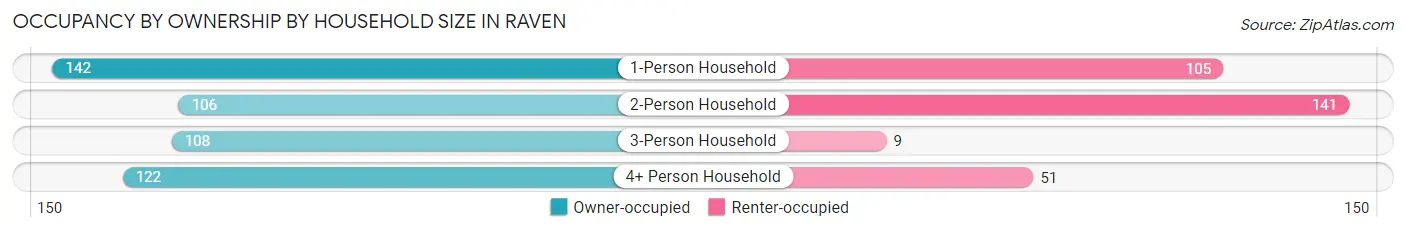
| Household Size | Owner-occupied | Renter-occupied |
| 1-Person Household | 142 (57.5%) | 105 (42.5%) |
| 2-Person Household | 106 (42.9%) | 141 (57.1%) |
| 3-Person Household | 108 (92.3%) | 9 (7.7%) |
| 4+ Person Household | 122 (70.5%) | 51 (29.5%) |
| Total Housing Units | 478 (61.0%) | 306 (39.0%) |
Occupancy by Educational Attainment in Raven
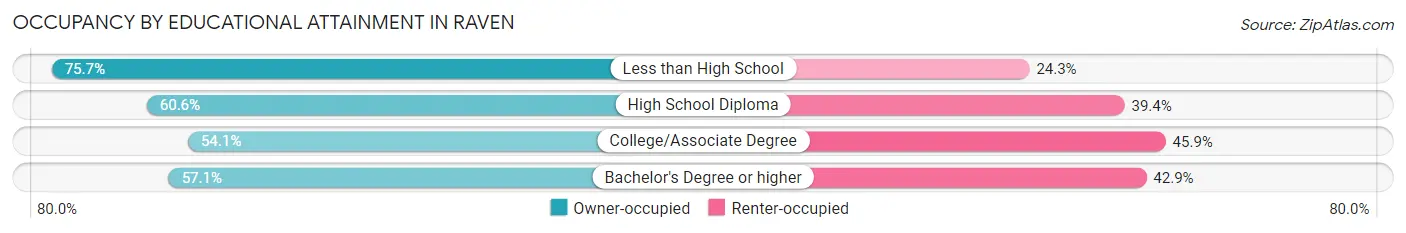
| Household Size | Owner-occupied | Renter-occupied |
| Less than High School | 109 (75.7%) | 35 (24.3%) |
| High School Diploma | 183 (60.6%) | 119 (39.4%) |
| College/Associate Degree | 126 (54.1%) | 107 (45.9%) |
| Bachelor's Degree or higher | 60 (57.1%) | 45 (42.9%) |
Occupancy by Age of Householder in Raven
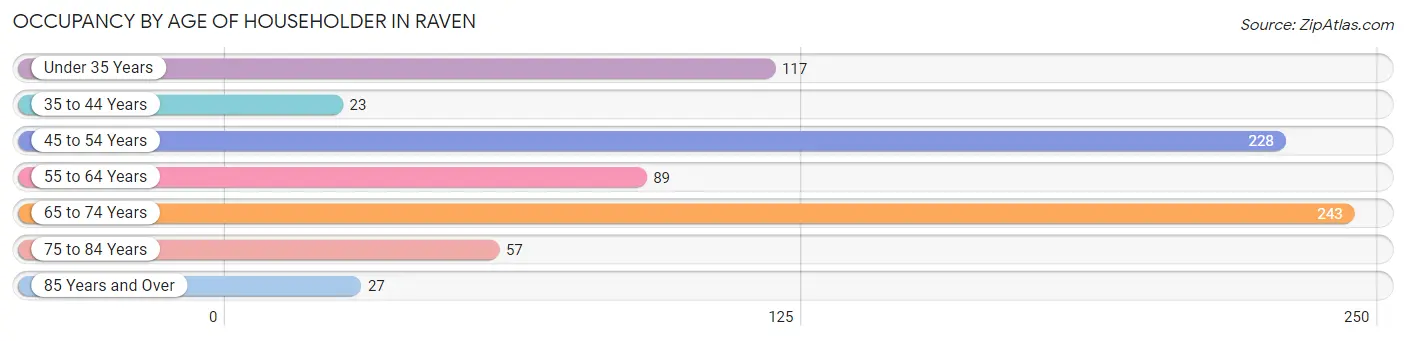
| Age Bracket | # Households | % Households |
| Under 35 Years | 117 | 14.9% |
| 35 to 44 Years | 23 | 2.9% |
| 45 to 54 Years | 228 | 29.1% |
| 55 to 64 Years | 89 | 11.4% |
| 65 to 74 Years | 243 | 31.0% |
| 75 to 84 Years | 57 | 7.3% |
| 85 Years and Over | 27 | 3.4% |
| Total | 784 | 100.0% |
Housing Finances in Raven
Median Income by Occupancy in Raven
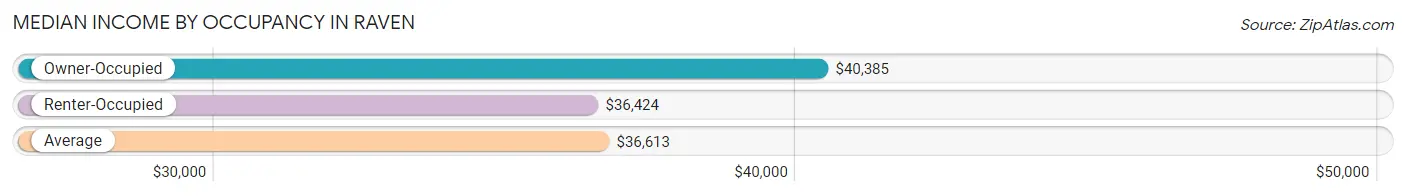
| Occupancy Type | # Households | Median Income |
| Owner-Occupied | 478 (61.0%) | $40,385 |
| Renter-Occupied | 306 (39.0%) | $36,424 |
| Average | 784 (100.0%) | $36,613 |
Occupancy by Householder Income Bracket in Raven
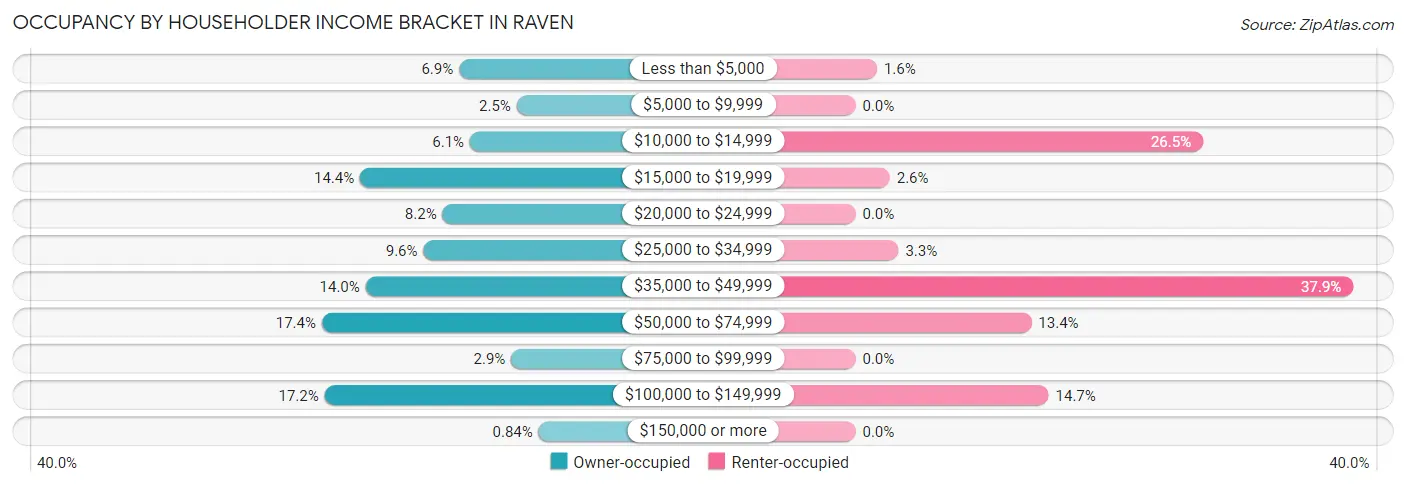
| Income Bracket | Owner-occupied | Renter-occupied |
| Less than $5,000 | 33 (6.9%) | 5 (1.6%) |
| $5,000 to $9,999 | 12 (2.5%) | 0 (0.0%) |
| $10,000 to $14,999 | 29 (6.1%) | 81 (26.5%) |
| $15,000 to $19,999 | 69 (14.4%) | 8 (2.6%) |
| $20,000 to $24,999 | 39 (8.2%) | 0 (0.0%) |
| $25,000 to $34,999 | 46 (9.6%) | 10 (3.3%) |
| $35,000 to $49,999 | 67 (14.0%) | 116 (37.9%) |
| $50,000 to $74,999 | 83 (17.4%) | 41 (13.4%) |
| $75,000 to $99,999 | 14 (2.9%) | 0 (0.0%) |
| $100,000 to $149,999 | 82 (17.2%) | 45 (14.7%) |
| $150,000 or more | 4 (0.8%) | 0 (0.0%) |
| Total | 478 (100.0%) | 306 (100.0%) |
Monthly Housing Cost Tiers in Raven
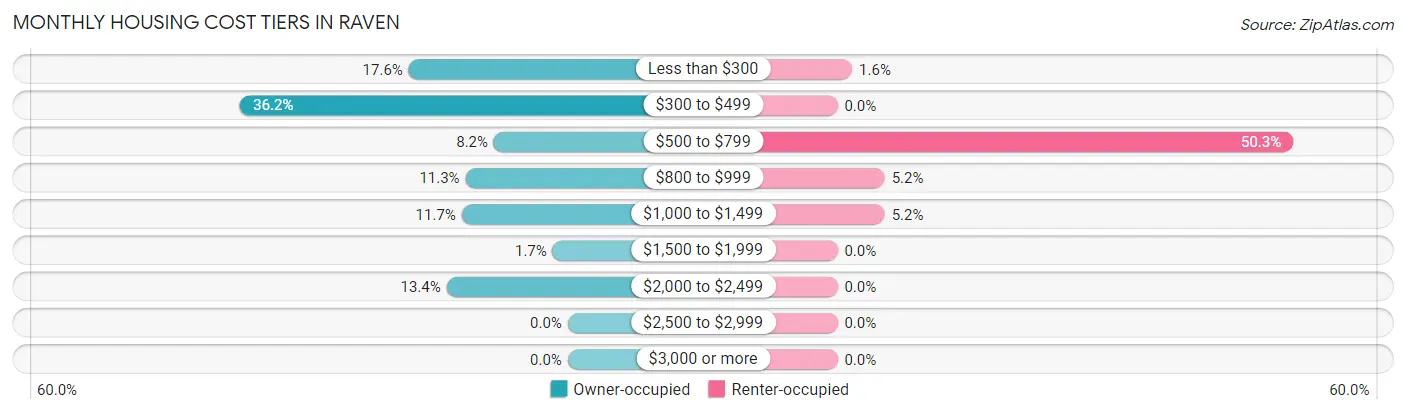
| Monthly Cost | Owner-occupied | Renter-occupied |
| Less than $300 | 84 (17.6%) | 5 (1.6%) |
| $300 to $499 | 173 (36.2%) | 0 (0.0%) |
| $500 to $799 | 39 (8.2%) | 154 (50.3%) |
| $800 to $999 | 54 (11.3%) | 16 (5.2%) |
| $1,000 to $1,499 | 56 (11.7%) | 16 (5.2%) |
| $1,500 to $1,999 | 8 (1.7%) | 0 (0.0%) |
| $2,000 to $2,499 | 64 (13.4%) | 0 (0.0%) |
| $2,500 to $2,999 | 0 (0.0%) | 0 (0.0%) |
| $3,000 or more | 0 (0.0%) | 0 (0.0%) |
| Total | 478 (100.0%) | 306 (100.0%) |
Physical Housing Characteristics in Raven
Housing Structures in Raven
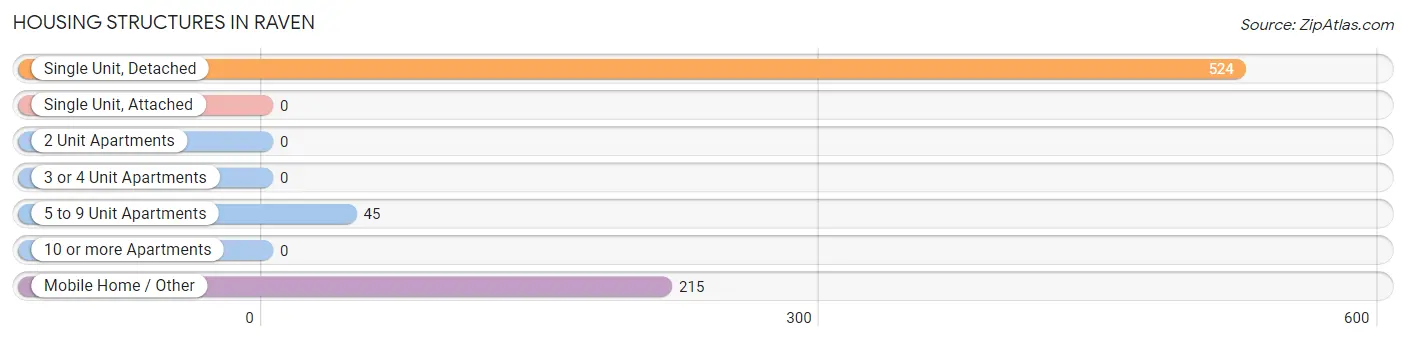
| Structure Type | # Housing Units | % Housing Units |
| Single Unit, Detached | 524 | 66.8% |
| Single Unit, Attached | 0 | 0.0% |
| 2 Unit Apartments | 0 | 0.0% |
| 3 or 4 Unit Apartments | 0 | 0.0% |
| 5 to 9 Unit Apartments | 45 | 5.7% |
| 10 or more Apartments | 0 | 0.0% |
| Mobile Home / Other | 215 | 27.4% |
| Total | 784 | 100.0% |
Housing Structures by Occupancy in Raven
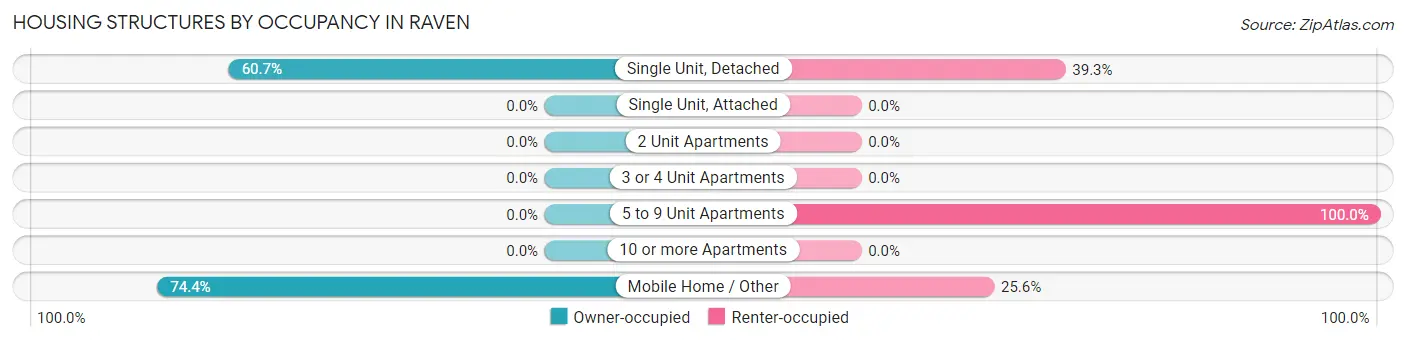
| Structure Type | Owner-occupied | Renter-occupied |
| Single Unit, Detached | 318 (60.7%) | 206 (39.3%) |
| Single Unit, Attached | 0 (0.0%) | 0 (0.0%) |
| 2 Unit Apartments | 0 (0.0%) | 0 (0.0%) |
| 3 or 4 Unit Apartments | 0 (0.0%) | 0 (0.0%) |
| 5 to 9 Unit Apartments | 0 (0.0%) | 45 (100.0%) |
| 10 or more Apartments | 0 (0.0%) | 0 (0.0%) |
| Mobile Home / Other | 160 (74.4%) | 55 (25.6%) |
| Total | 478 (61.0%) | 306 (39.0%) |
Housing Structures by Number of Rooms in Raven
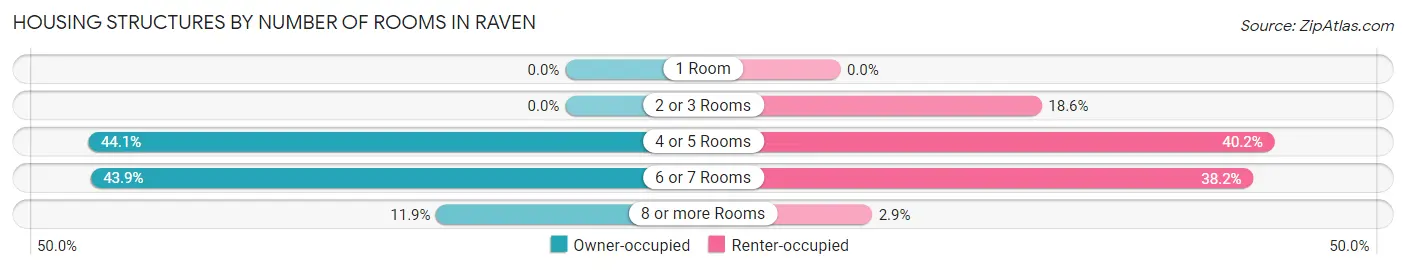
| Number of Rooms | Owner-occupied | Renter-occupied |
| 1 Room | 0 (0.0%) | 0 (0.0%) |
| 2 or 3 Rooms | 0 (0.0%) | 57 (18.6%) |
| 4 or 5 Rooms | 211 (44.1%) | 123 (40.2%) |
| 6 or 7 Rooms | 210 (43.9%) | 117 (38.2%) |
| 8 or more Rooms | 57 (11.9%) | 9 (2.9%) |
| Total | 478 (100.0%) | 306 (100.0%) |
Housing Structure by Heating Type in Raven
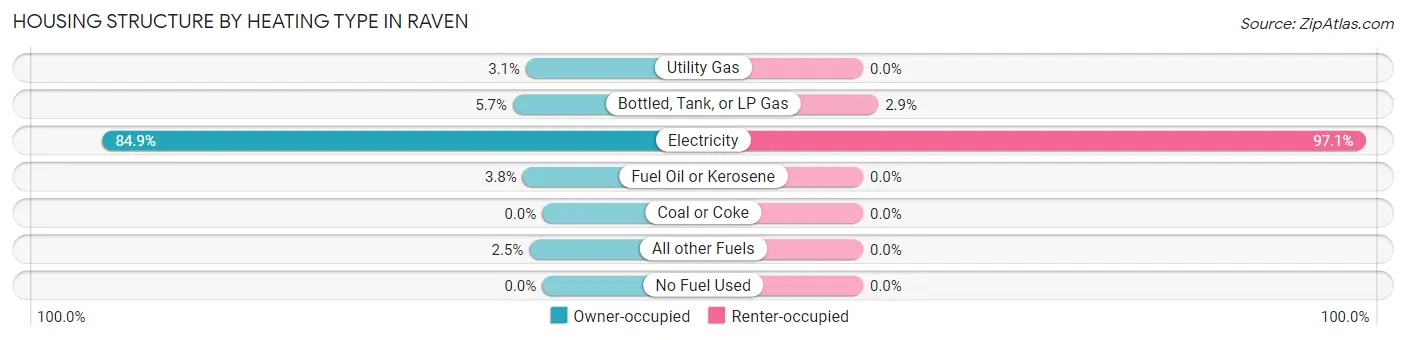
| Heating Type | Owner-occupied | Renter-occupied |
| Utility Gas | 15 (3.1%) | 0 (0.0%) |
| Bottled, Tank, or LP Gas | 27 (5.7%) | 9 (2.9%) |
| Electricity | 406 (84.9%) | 297 (97.1%) |
| Fuel Oil or Kerosene | 18 (3.8%) | 0 (0.0%) |
| Coal or Coke | 0 (0.0%) | 0 (0.0%) |
| All other Fuels | 12 (2.5%) | 0 (0.0%) |
| No Fuel Used | 0 (0.0%) | 0 (0.0%) |
| Total | 478 (100.0%) | 306 (100.0%) |
Household Vehicle Usage in Raven
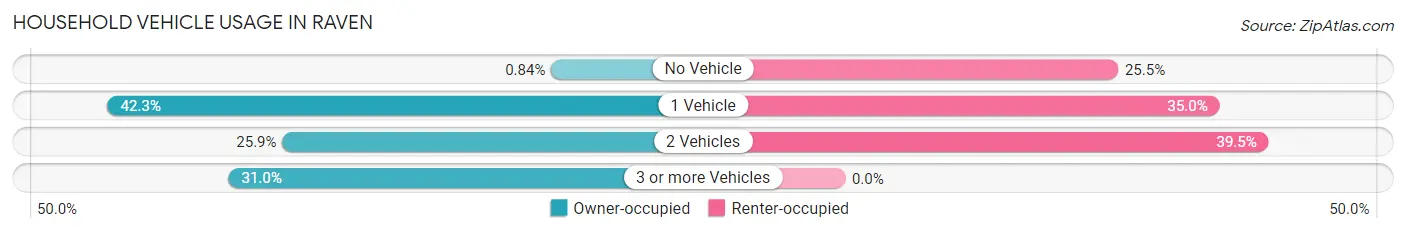
| Vehicles per Household | Owner-occupied | Renter-occupied |
| No Vehicle | 4 (0.8%) | 78 (25.5%) |
| 1 Vehicle | 202 (42.3%) | 107 (35.0%) |
| 2 Vehicles | 124 (25.9%) | 121 (39.5%) |
| 3 or more Vehicles | 148 (31.0%) | 0 (0.0%) |
| Total | 478 (100.0%) | 306 (100.0%) |
Real Estate & Mortgages in Raven
Real Estate and Mortgage Overview in Raven
| Characteristic | Without Mortgage | With Mortgage |
| Housing Units | 300 | 178 |
| Median Property Value | $56,500 | $166,700 |
| Median Household Income | $24,891 | $0 |
| Monthly Housing Costs | $389 | $0 |
| Real Estate Taxes | $371 | $12 |
Property Value by Mortgage Status in Raven
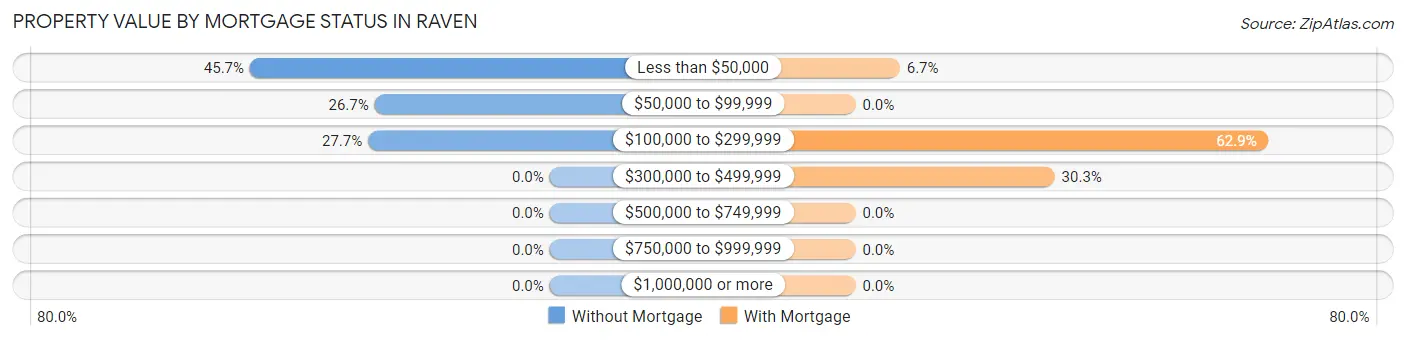
| Property Value | Without Mortgage | With Mortgage |
| Less than $50,000 | 137 (45.7%) | 12 (6.7%) |
| $50,000 to $99,999 | 80 (26.7%) | 0 (0.0%) |
| $100,000 to $299,999 | 83 (27.7%) | 112 (62.9%) |
| $300,000 to $499,999 | 0 (0.0%) | 54 (30.3%) |
| $500,000 to $749,999 | 0 (0.0%) | 0 (0.0%) |
| $750,000 to $999,999 | 0 (0.0%) | 0 (0.0%) |
| $1,000,000 or more | 0 (0.0%) | 0 (0.0%) |
| Total | 300 (100.0%) | 178 (100.0%) |
Household Income by Mortgage Status in Raven
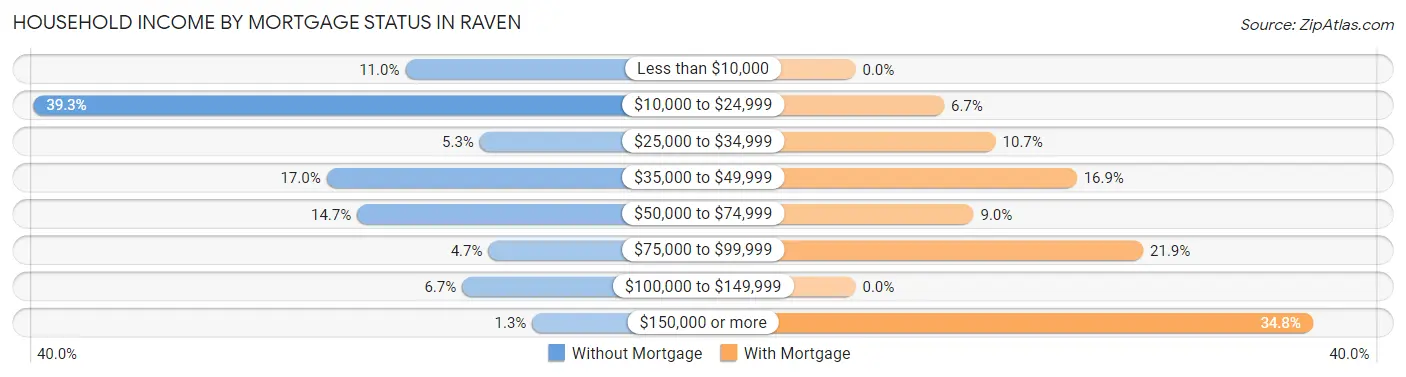
| Household Income | Without Mortgage | With Mortgage |
| Less than $10,000 | 33 (11.0%) | 0 (0.0%) |
| $10,000 to $24,999 | 118 (39.3%) | 12 (6.7%) |
| $25,000 to $34,999 | 16 (5.3%) | 19 (10.7%) |
| $35,000 to $49,999 | 51 (17.0%) | 30 (16.9%) |
| $50,000 to $74,999 | 44 (14.7%) | 16 (9.0%) |
| $75,000 to $99,999 | 14 (4.7%) | 39 (21.9%) |
| $100,000 to $149,999 | 20 (6.7%) | 0 (0.0%) |
| $150,000 or more | 4 (1.3%) | 62 (34.8%) |
| Total | 300 (100.0%) | 178 (100.0%) |
Property Value to Household Income Ratio in Raven
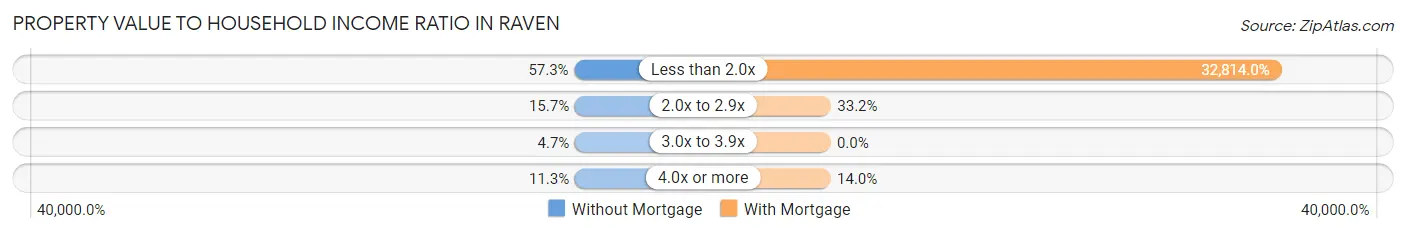
| Value-to-Income Ratio | Without Mortgage | With Mortgage |
| Less than 2.0x | 172 (57.3%) | 58,409 (32,814.0%) |
| 2.0x to 2.9x | 47 (15.7%) | 59 (33.2%) |
| 3.0x to 3.9x | 14 (4.7%) | 0 (0.0%) |
| 4.0x or more | 34 (11.3%) | 25 (14.0%) |
| Total | 300 (100.0%) | 178 (100.0%) |
Real Estate Taxes by Mortgage Status in Raven
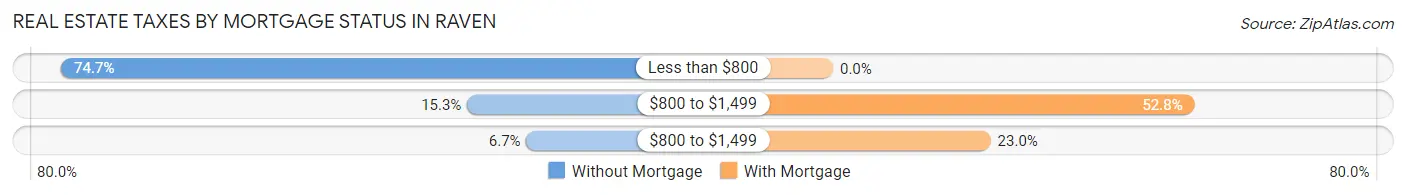
| Property Taxes | Without Mortgage | With Mortgage |
| Less than $800 | 224 (74.7%) | 0 (0.0%) |
| $800 to $1,499 | 46 (15.3%) | 94 (52.8%) |
| $800 to $1,499 | 20 (6.7%) | 41 (23.0%) |
| Total | 300 (100.0%) | 178 (100.0%) |
Health & Disability in Raven
Health Insurance Coverage by Age in Raven
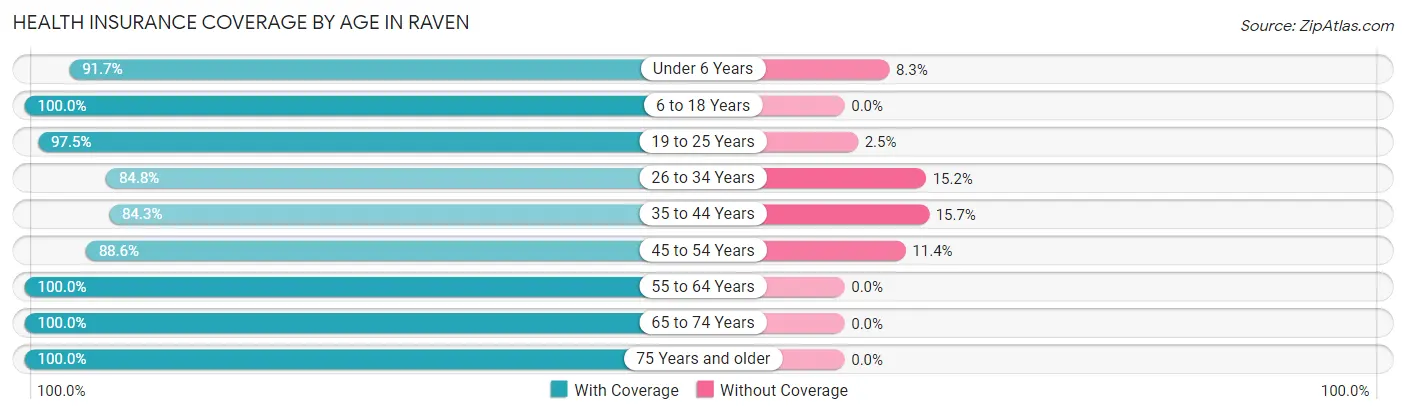
| Age Bracket | With Coverage | Without Coverage |
| Under 6 Years | 143 (91.7%) | 13 (8.3%) |
| 6 to 18 Years | 338 (100.0%) | 0 (0.0%) |
| 19 to 25 Years | 195 (97.5%) | 5 (2.5%) |
| 26 to 34 Years | 162 (84.8%) | 29 (15.2%) |
| 35 to 44 Years | 91 (84.3%) | 17 (15.7%) |
| 45 to 54 Years | 373 (88.6%) | 48 (11.4%) |
| 55 to 64 Years | 156 (100.0%) | 0 (0.0%) |
| 65 to 74 Years | 351 (100.0%) | 0 (0.0%) |
| 75 Years and older | 144 (100.0%) | 0 (0.0%) |
| Total | 1,953 (94.6%) | 112 (5.4%) |
Health Insurance Coverage by Citizenship Status in Raven
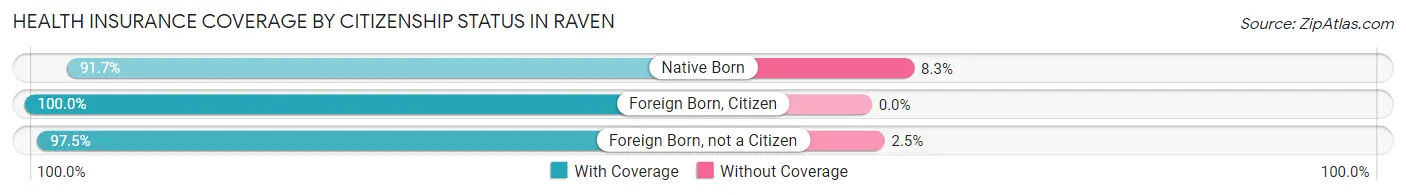
| Citizenship Status | With Coverage | Without Coverage |
| Native Born | 143 (91.7%) | 13 (8.3%) |
| Foreign Born, Citizen | 338 (100.0%) | 0 (0.0%) |
| Foreign Born, not a Citizen | 195 (97.5%) | 5 (2.5%) |
Health Insurance Coverage by Household Income in Raven
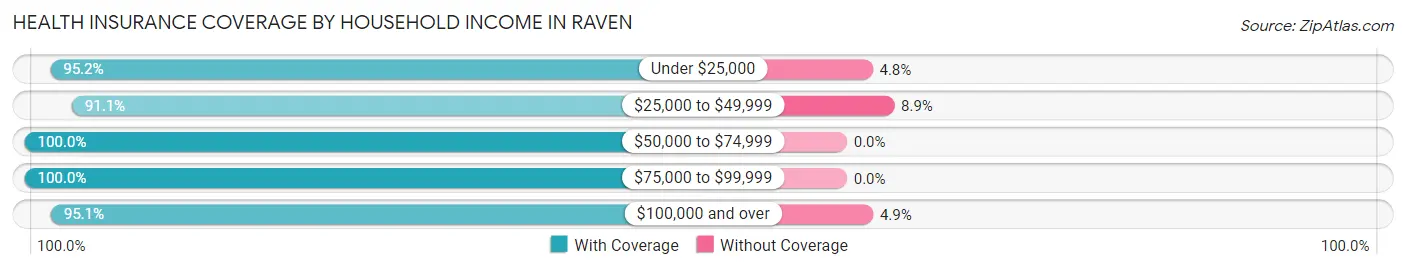
| Household Income | With Coverage | Without Coverage |
| Under $25,000 | 494 (95.2%) | 25 (4.8%) |
| $25,000 to $49,999 | 699 (91.1%) | 68 (8.9%) |
| $50,000 to $74,999 | 372 (100.0%) | 0 (0.0%) |
| $75,000 to $99,999 | 20 (100.0%) | 0 (0.0%) |
| $100,000 and over | 368 (95.1%) | 19 (4.9%) |
Public vs Private Health Insurance Coverage by Age in Raven
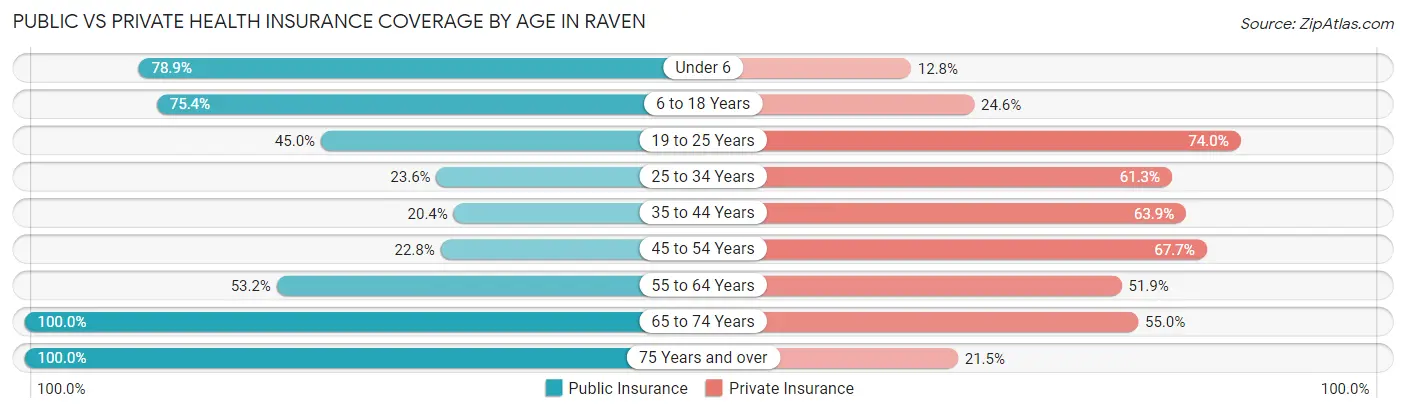
| Age Bracket | Public Insurance | Private Insurance |
| Under 6 | 123 (78.8%) | 20 (12.8%) |
| 6 to 18 Years | 255 (75.4%) | 83 (24.6%) |
| 19 to 25 Years | 90 (45.0%) | 148 (74.0%) |
| 25 to 34 Years | 45 (23.6%) | 117 (61.3%) |
| 35 to 44 Years | 22 (20.4%) | 69 (63.9%) |
| 45 to 54 Years | 96 (22.8%) | 285 (67.7%) |
| 55 to 64 Years | 83 (53.2%) | 81 (51.9%) |
| 65 to 74 Years | 351 (100.0%) | 193 (55.0%) |
| 75 Years and over | 144 (100.0%) | 31 (21.5%) |
| Total | 1,209 (58.6%) | 1,027 (49.7%) |
Disability Status by Sex by Age in Raven
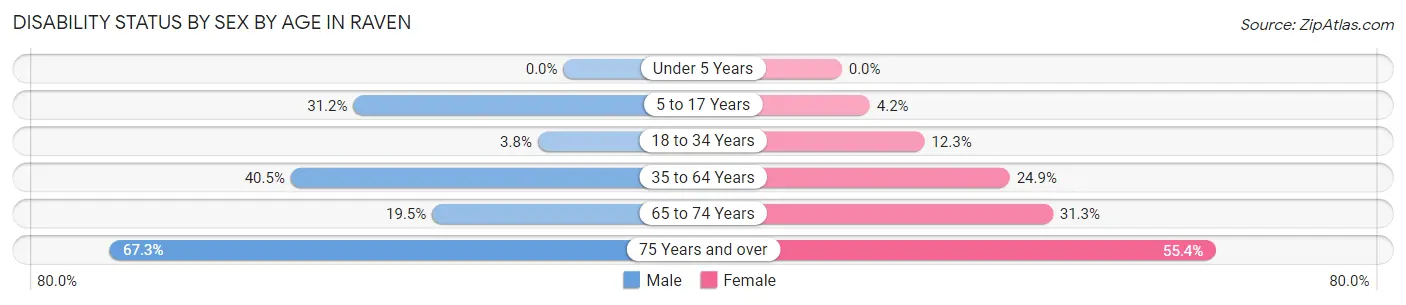
| Age Bracket | Male | Female |
| Under 5 Years | 0 (0.0%) | 0 (0.0%) |
| 5 to 17 Years | 34 (31.2%) | 10 (4.2%) |
| 18 to 34 Years | 9 (3.8%) | 21 (12.3%) |
| 35 to 64 Years | 102 (40.5%) | 108 (24.9%) |
| 65 to 74 Years | 23 (19.5%) | 73 (31.3%) |
| 75 Years and over | 35 (67.3%) | 51 (55.4%) |
Disability Class by Sex by Age in Raven
Disability Class: Hearing Difficulty
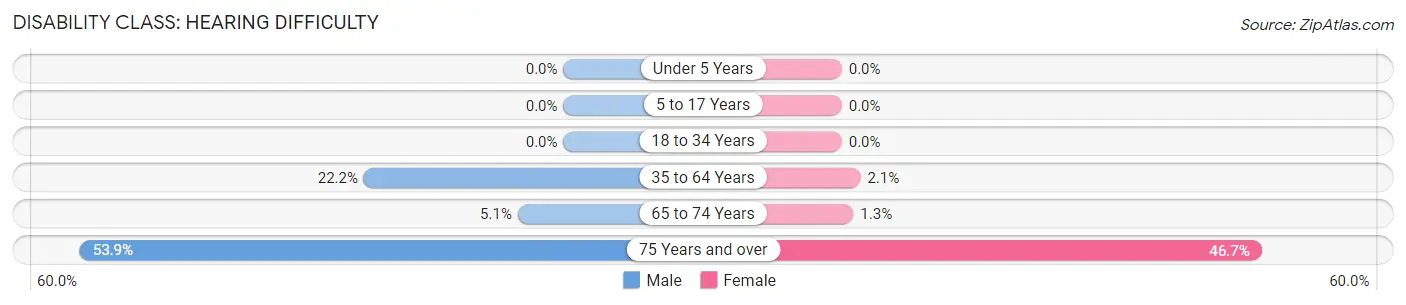
| Age Bracket | Male | Female |
| Under 5 Years | 0 (0.0%) | 0 (0.0%) |
| 5 to 17 Years | 0 (0.0%) | 0 (0.0%) |
| 18 to 34 Years | 0 (0.0%) | 0 (0.0%) |
| 35 to 64 Years | 56 (22.2%) | 9 (2.1%) |
| 65 to 74 Years | 6 (5.1%) | 3 (1.3%) |
| 75 Years and over | 28 (53.8%) | 43 (46.7%) |
Disability Class: Vision Difficulty
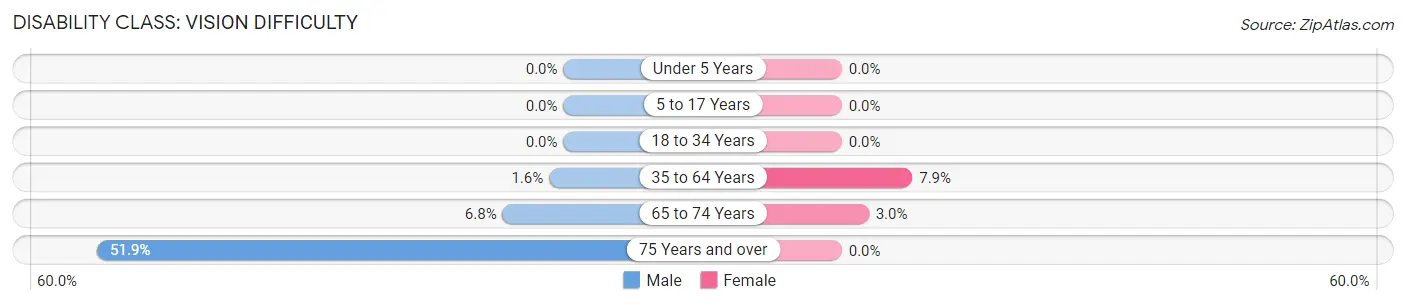
| Age Bracket | Male | Female |
| Under 5 Years | 0 (0.0%) | 0 (0.0%) |
| 5 to 17 Years | 0 (0.0%) | 0 (0.0%) |
| 18 to 34 Years | 0 (0.0%) | 0 (0.0%) |
| 35 to 64 Years | 4 (1.6%) | 34 (7.9%) |
| 65 to 74 Years | 8 (6.8%) | 7 (3.0%) |
| 75 Years and over | 27 (51.9%) | 0 (0.0%) |
Disability Class: Cognitive Difficulty
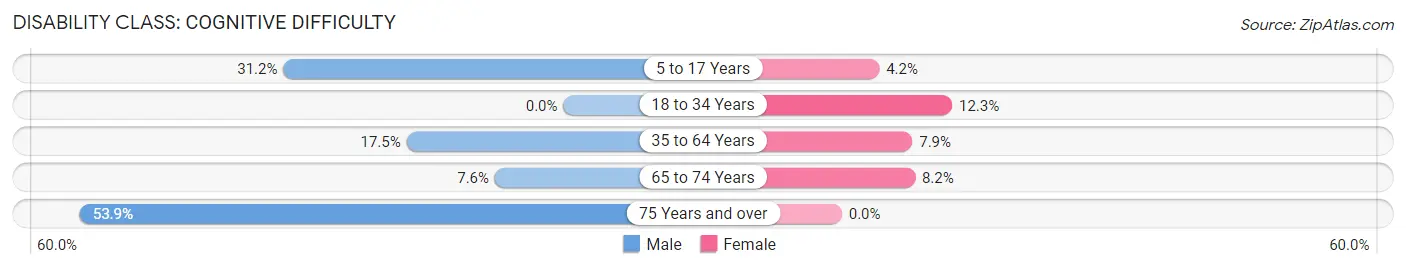
| Age Bracket | Male | Female |
| 5 to 17 Years | 34 (31.2%) | 10 (4.2%) |
| 18 to 34 Years | 0 (0.0%) | 21 (12.3%) |
| 35 to 64 Years | 44 (17.5%) | 34 (7.9%) |
| 65 to 74 Years | 9 (7.6%) | 19 (8.2%) |
| 75 Years and over | 28 (53.8%) | 0 (0.0%) |
Disability Class: Ambulatory Difficulty
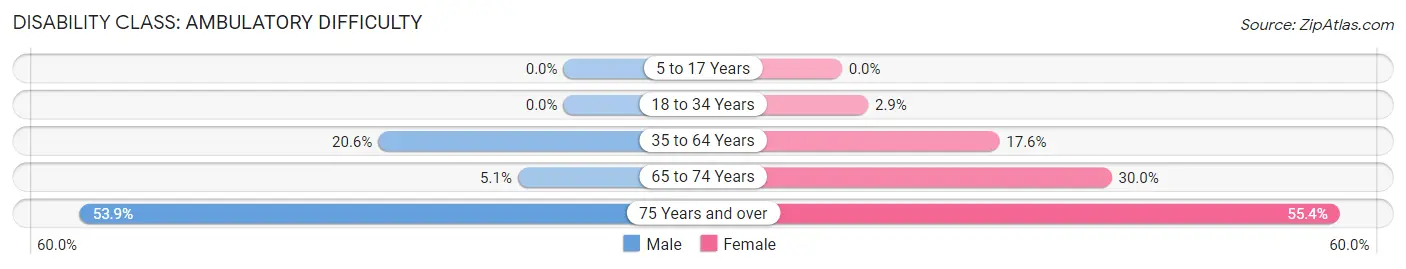
| Age Bracket | Male | Female |
| 5 to 17 Years | 0 (0.0%) | 0 (0.0%) |
| 18 to 34 Years | 0 (0.0%) | 5 (2.9%) |
| 35 to 64 Years | 52 (20.6%) | 76 (17.5%) |
| 65 to 74 Years | 6 (5.1%) | 70 (30.0%) |
| 75 Years and over | 28 (53.8%) | 51 (55.4%) |
Disability Class: Self-Care Difficulty
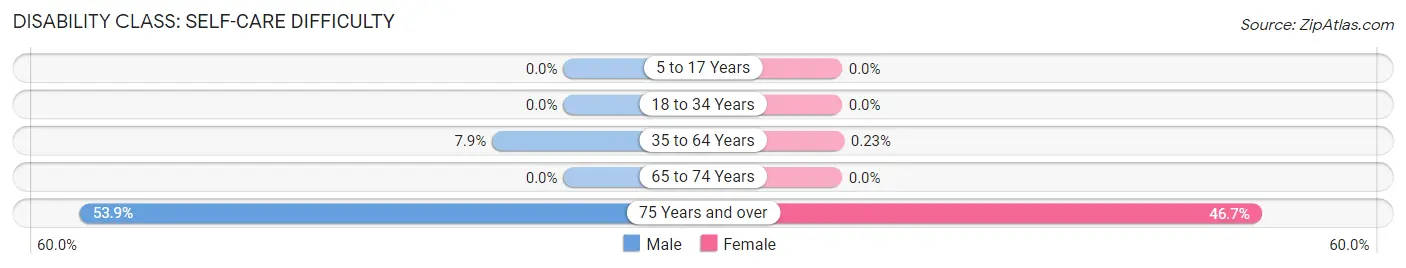
| Age Bracket | Male | Female |
| 5 to 17 Years | 0 (0.0%) | 0 (0.0%) |
| 18 to 34 Years | 0 (0.0%) | 0 (0.0%) |
| 35 to 64 Years | 20 (7.9%) | 1 (0.2%) |
| 65 to 74 Years | 0 (0.0%) | 0 (0.0%) |
| 75 Years and over | 28 (53.8%) | 43 (46.7%) |
Technology Access in Raven
Computing Device Access in Raven
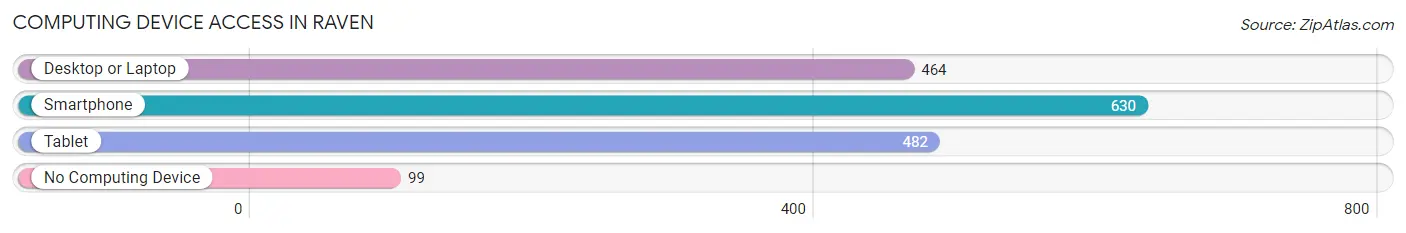
| Device Type | # Households | % Households |
| Desktop or Laptop | 464 | 59.2% |
| Smartphone | 630 | 80.4% |
| Tablet | 482 | 61.5% |
| No Computing Device | 99 | 12.6% |
| Total | 784 | 100.0% |
Internet Access in Raven
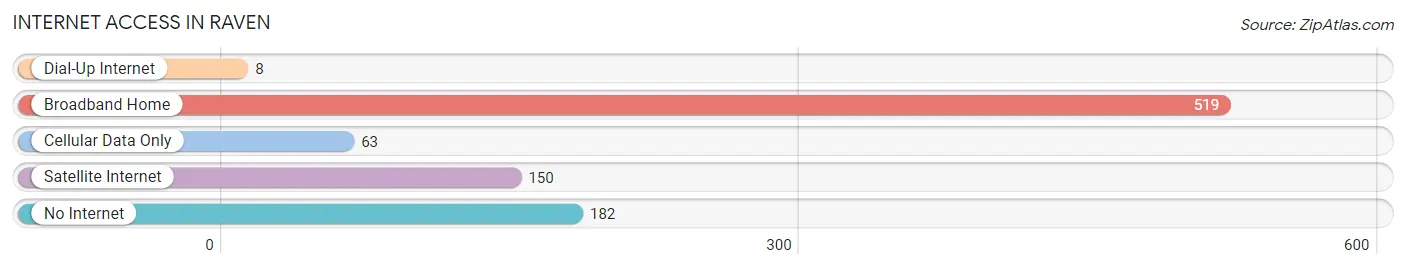
| Internet Type | # Households | % Households |
| Dial-Up Internet | 8 | 1.0% |
| Broadband Home | 519 | 66.2% |
| Cellular Data Only | 63 | 8.0% |
| Satellite Internet | 150 | 19.1% |
| No Internet | 182 | 23.2% |
| Total | 784 | 100.0% |
Raven Summary
Raven, Virginia is a small town located in the southwestern part of the state, in the Appalachian Mountains. It is situated in the county of Tazewell, and is part of the Bluefield, Virginia-West Virginia Metropolitan Statistical Area. The town has a population of just over 1,000 people, and is known for its rural charm and small-town atmosphere.
Geography
Raven is located in the Appalachian Mountains, in the southwestern part of Virginia. It is situated in the county of Tazewell, and is part of the Bluefield, Virginia-West Virginia Metropolitan Statistical Area. The town is located at an elevation of 1,890 feet, and is surrounded by the Appalachian Mountains. The town is located near the border of Virginia and West Virginia, and is just a few miles from the state line. The town is located in a valley, and is surrounded by rolling hills and mountains. The town is located near the Clinch River, and is also close to the New River.
Economy
The economy of Raven is largely based on agriculture and tourism. The town is home to several farms, and the surrounding area is known for its production of tobacco, corn, and hay. The town is also home to several small businesses, including a grocery store, a hardware store, and a few restaurants. The town is also home to a few small manufacturing companies, which produce a variety of products, including furniture and clothing.
The town is also a popular tourist destination, and is home to several attractions, including the Raven Historical Museum, the Raven Country Store, and the Raven Country Club. The town is also home to several outdoor recreation areas, including the Raven State Park, which offers camping, fishing, and hiking.
Demographics
As of the 2010 census, the population of Raven was 1,072. The racial makeup of the town was 97.2% White, 0.7% African American, 0.2% Native American, 0.2% Asian, 0.1% Pacific Islander, 0.7% from other races, and 0.9% from two or more races. Hispanic or Latino of any race were 1.3% of the population.
The median income for a household in Raven was $30,938, and the median income for a family was $37,500. The per capita income for the town was $17,845. About 15.2% of families and 17.7% of the population were below the poverty line, including 25.2% of those under age 18 and 11.2% of those age 65 or over.
Raven is a small town with a rural charm and a small-town atmosphere. The town is home to several farms, businesses, and attractions, and is a popular tourist destination. The town is also home to a diverse population, with a mix of races and ethnicities. The town is a great place to live, work, and visit, and is a great example of the beauty and charm of the Appalachian Mountains.
Common Questions
What is Per Capita Income in Raven?
Per Capita income in Raven is $20,123.
What is the Median Family Income in Raven?
Median Family Income in Raven is $45,078.
What is the Median Household income in Raven?
Median Household Income in Raven is $36,613.
What is Income or Wage Gap in Raven?
Income or Wage Gap in Raven is 28.7%.
Women in Raven earn 71.3 cents for every dollar earned by a man.
What is Inequality or Gini Index in Raven?
Inequality or Gini Index in Raven is 0.44.
What is the Total Population of Raven?
Total Population of Raven is 2,065.
What is the Total Male Population of Raven?
Total Male Population of Raven is 811.
What is the Total Female Population of Raven?
Total Female Population of Raven is 1,254.
What is the Ratio of Males per 100 Females in Raven?
There are 64.67 Males per 100 Females in Raven.
What is the Ratio of Females per 100 Males in Raven?
There are 154.62 Females per 100 Males in Raven.
What is the Median Population Age in Raven?
Median Population Age in Raven is 46.2 Years.
What is the Average Family Size in Raven
Average Family Size in Raven is 3.4 People.
What is the Average Household Size in Raven
Average Household Size in Raven is 2.6 People.
How Large is the Labor Force in Raven?
There are 655 People in the Labor Forcein in Raven.
What is the Percentage of People in the Labor Force in Raven?
39.4% of People are in the Labor Force in Raven.
What is the Unemployment Rate in Raven?
Unemployment Rate in Raven is 12.2%.