Crozet, VA Map & Demographics
Crozet Map
Crozet Overview
$59,604
PER CAPITA INCOME
$146,508
AVG FAMILY INCOME
$106,081
AVG HOUSEHOLD INCOME
45.6%
WAGE / INCOME GAP [ % ]
54.4¢/ $1
WAGE / INCOME GAP [ $ ]
0.46
INEQUALITY / GINI INDEX
8,894
TOTAL POPULATION
4,093
MALE POPULATION
4,801
FEMALE POPULATION
85.25
MALES / 100 FEMALES
117.30
FEMALES / 100 MALES
36.9
MEDIAN AGE
3.1
AVG FAMILY SIZE
2.6
AVG HOUSEHOLD SIZE
4,543
LABOR FORCE [ PEOPLE ]
68.2%
PERCENT IN LABOR FORCE
2.7%
UNEMPLOYMENT RATE
Crozet Zip Codes
Crozet Area Codes
Income in Crozet
Income Overview in Crozet
Per Capita Income in Crozet is $59,604, while median incomes of families and households are $146,508 and $106,081 respectively.
| Characteristic | Number | Measure |
| Per Capita Income | 8,894 | $59,604 |
| Median Family Income | 2,506 | $146,508 |
| Mean Family Income | 2,506 | $181,616 |
| Median Household Income | 3,397 | $106,081 |
| Mean Household Income | 3,397 | $152,003 |
| Income Deficit | 2,506 | $0 |
| Wage / Income Gap (%) | 8,894 | 45.64% |
| Wage / Income Gap ($) | 8,894 | 54.36¢ per $1 |
| Gini / Inequality Index | 8,894 | 0.46 |
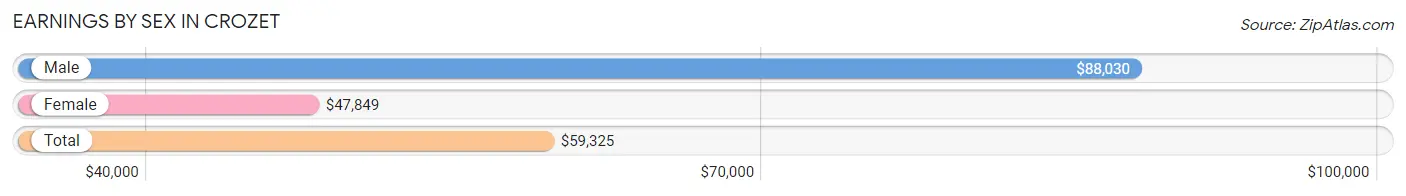
Earnings by Sex in Crozet
Average Earnings in Crozet are $59,325, $88,030 for men and $47,849 for women, a difference of 45.6%.
| Sex | Number | Average Earnings |
| Male | 2,240 (46.6%) | $88,030 |
| Female | 2,564 (53.4%) | $47,849 |
| Total | 4,804 (100.0%) | $59,325 |
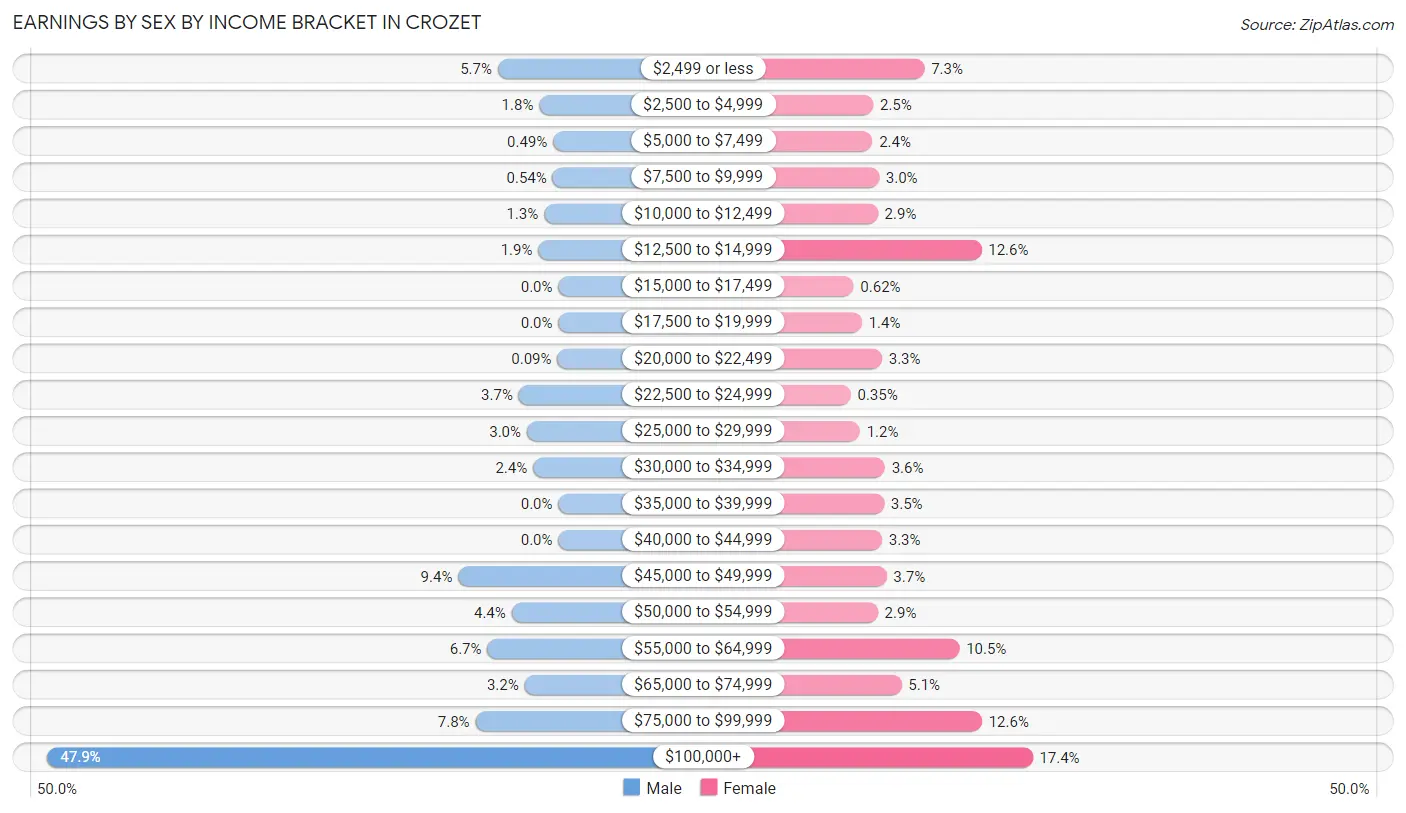
Earnings by Sex by Income Bracket in Crozet
The most common earnings brackets in Crozet are $100,000+ for men (1,072 | 47.9%) and $100,000+ for women (446 | 17.4%).
| Income | Male | Female |
| $2,499 or less | 127 (5.7%) | 186 (7.2%) |
| $2,500 to $4,999 | 40 (1.8%) | 63 (2.5%) |
| $5,000 to $7,499 | 11 (0.5%) | 61 (2.4%) |
| $7,500 to $9,999 | 12 (0.5%) | 77 (3.0%) |
| $10,000 to $12,499 | 30 (1.3%) | 74 (2.9%) |
| $12,500 to $14,999 | 42 (1.9%) | 323 (12.6%) |
| $15,000 to $17,499 | 0 (0.0%) | 16 (0.6%) |
| $17,500 to $19,999 | 0 (0.0%) | 36 (1.4%) |
| $20,000 to $22,499 | 2 (0.1%) | 84 (3.3%) |
| $22,500 to $24,999 | 83 (3.7%) | 9 (0.4%) |
| $25,000 to $29,999 | 66 (2.9%) | 31 (1.2%) |
| $30,000 to $34,999 | 53 (2.4%) | 91 (3.5%) |
| $35,000 to $39,999 | 0 (0.0%) | 89 (3.5%) |
| $40,000 to $44,999 | 0 (0.0%) | 84 (3.3%) |
| $45,000 to $49,999 | 210 (9.4%) | 95 (3.7%) |
| $50,000 to $54,999 | 98 (4.4%) | 74 (2.9%) |
| $55,000 to $64,999 | 149 (6.7%) | 270 (10.5%) |
| $65,000 to $74,999 | 71 (3.2%) | 131 (5.1%) |
| $75,000 to $99,999 | 174 (7.8%) | 324 (12.6%) |
| $100,000+ | 1,072 (47.9%) | 446 (17.4%) |
| Total | 2,240 (100.0%) | 2,564 (100.0%) |
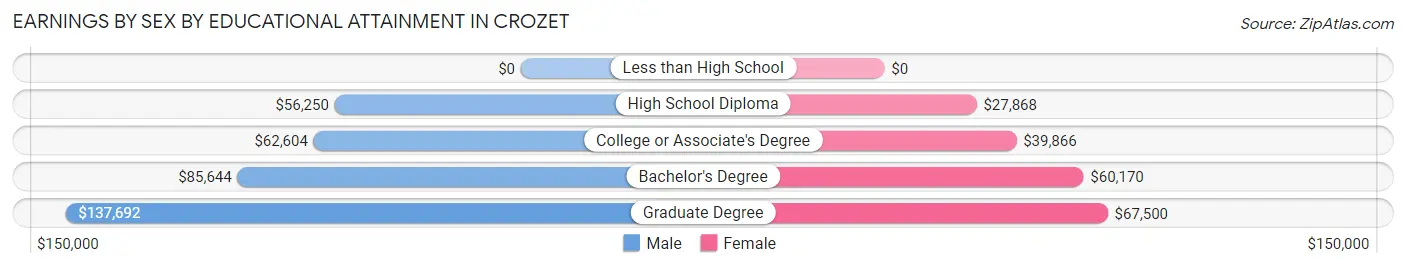
Earnings by Sex by Educational Attainment in Crozet
Average earnings in Crozet are $102,352 for men and $59,155 for women, a difference of 42.2%. Men with an educational attainment of graduate degree enjoy the highest average annual earnings of $137,692, while those with high school diploma education earn the least with $56,250. Women with an educational attainment of graduate degree earn the most with the average annual earnings of $67,500, while those with high school diploma education have the smallest earnings of $27,868.
| Educational Attainment | Male Income | Female Income |
| Less than High School | - | - |
| High School Diploma | $56,250 | $27,868 |
| College or Associate's Degree | $62,604 | $39,866 |
| Bachelor's Degree | $85,644 | $60,170 |
| Graduate Degree | $137,692 | $67,500 |
| Total | $102,352 | $59,155 |
Family Income in Crozet
Family Income Brackets in Crozet
According to the Crozet family income data, there are 669 families falling into the $200,000+ income range, which is the most common income bracket and makes up 26.7% of all families. Conversely, the $10,000 to $14,999 income bracket is the least frequent group with only 10 families (0.4%) belonging to this category.
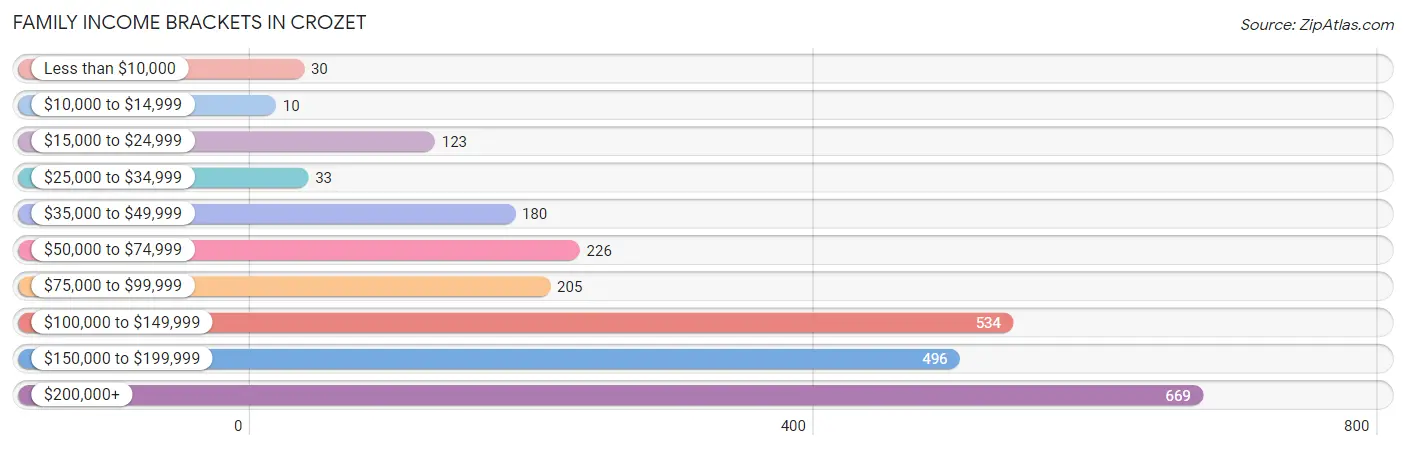
| Income Bracket | # Families | % Families |
| Less than $10,000 | 30 | 1.2% |
| $10,000 to $14,999 | 10 | 0.4% |
| $15,000 to $24,999 | 123 | 4.9% |
| $25,000 to $34,999 | 33 | 1.3% |
| $35,000 to $49,999 | 180 | 7.2% |
| $50,000 to $74,999 | 226 | 9.0% |
| $75,000 to $99,999 | 205 | 8.2% |
| $100,000 to $149,999 | 534 | 21.3% |
| $150,000 to $199,999 | 496 | 19.8% |
| $200,000+ | 669 | 26.7% |
Family Income by Famaliy Size in Crozet
6-person families (110 | 4.4%) account for the highest median family income in Crozet with $250,001 per family, while 2-person families (943 | 37.6%) have the highest median income of $65,156 per family member.
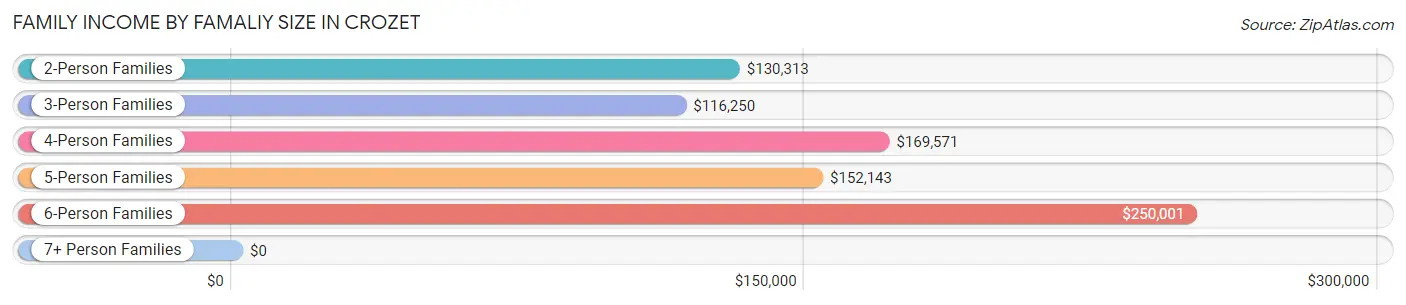
| Income Bracket | # Families | Median Income |
| 2-Person Families | 943 (37.6%) | $130,313 |
| 3-Person Families | 725 (28.9%) | $116,250 |
| 4-Person Families | 496 (19.8%) | $169,571 |
| 5-Person Families | 218 (8.7%) | $152,143 |
| 6-Person Families | 110 (4.4%) | $250,001 |
| 7+ Person Families | 14 (0.6%) | $0 |
| Total | 2,506 (100.0%) | $146,508 |
Family Income by Number of Earners in Crozet
The median family income in Crozet is $146,508, with families comprising 3+ earners (250) having the highest median family income of $171,538, while families with no earners (292) have the lowest median family income of $62,333, accounting for 10.0% and 11.7% of families, respectively.
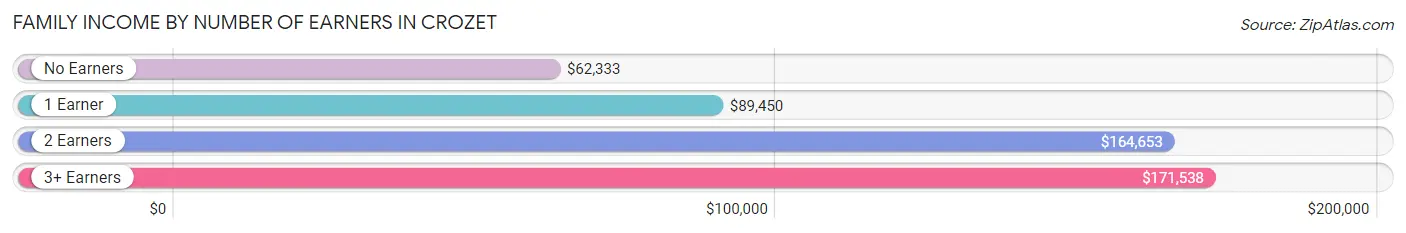
| Number of Earners | # Families | Median Income |
| No Earners | 292 (11.7%) | $62,333 |
| 1 Earner | 575 (22.9%) | $89,450 |
| 2 Earners | 1,389 (55.4%) | $164,653 |
| 3+ Earners | 250 (10.0%) | $171,538 |
| Total | 2,506 (100.0%) | $146,508 |
Household Income in Crozet
Household Income Brackets in Crozet
With 679 households falling in the category, the $200,000+ income range is the most frequent in Crozet, accounting for 20.0% of all households. In contrast, only 48 households (1.4%) fall into the $10,000 to $14,999 income bracket, making it the least populous group.
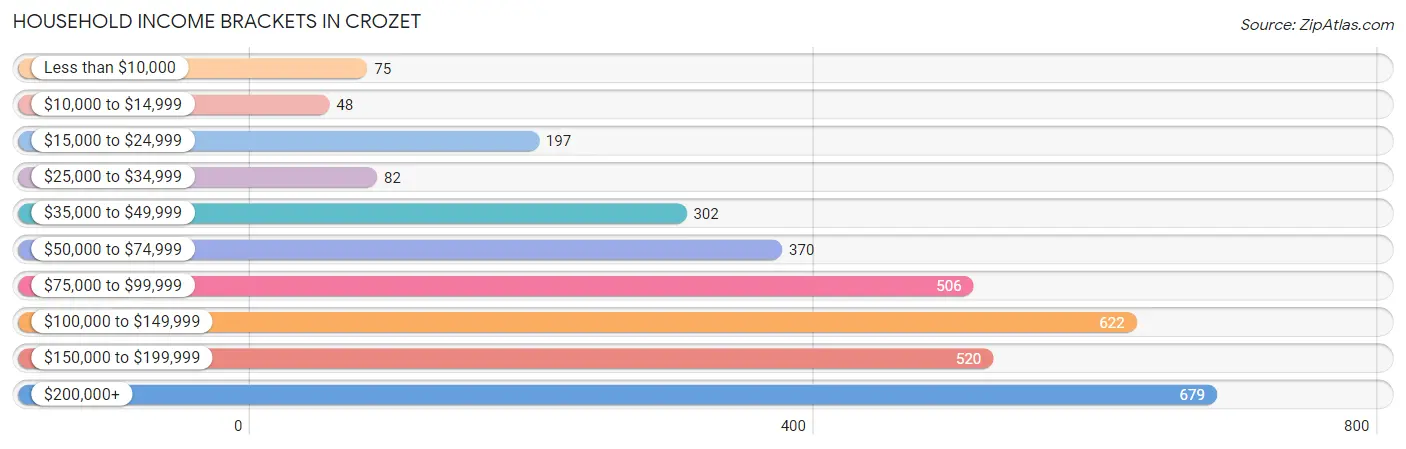
| Income Bracket | # Households | % Households |
| Less than $10,000 | 75 | 2.2% |
| $10,000 to $14,999 | 48 | 1.4% |
| $15,000 to $24,999 | 197 | 5.8% |
| $25,000 to $34,999 | 82 | 2.4% |
| $35,000 to $49,999 | 302 | 8.9% |
| $50,000 to $74,999 | 370 | 10.9% |
| $75,000 to $99,999 | 506 | 14.9% |
| $100,000 to $149,999 | 622 | 18.3% |
| $150,000 to $199,999 | 520 | 15.3% |
| $200,000+ | 679 | 20.0% |
Household Income by Householder Age in Crozet
The median household income in Crozet is $106,081, with the highest median household income of $123,704 found in the 45 to 64 years age bracket for the primary householder. A total of 1,550 households (45.6%) fall into this category. Meanwhile, the 15 to 24 years age bracket for the primary householder has the lowest median household income of $0, with 10 households (0.3%) in this group.
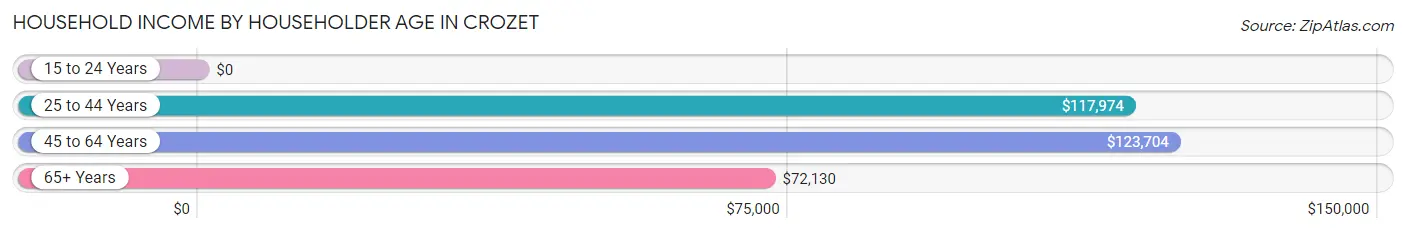
| Income Bracket | # Households | Median Income |
| 15 to 24 Years | 10 (0.3%) | $0 |
| 25 to 44 Years | 1,017 (29.9%) | $117,974 |
| 45 to 64 Years | 1,550 (45.6%) | $123,704 |
| 65+ Years | 820 (24.1%) | $72,130 |
| Total | 3,397 (100.0%) | $106,081 |
Poverty in Crozet
Income Below Poverty by Sex and Age in Crozet
With 2.4% poverty level for males and 9.6% for females among the residents of Crozet, 12 to 14 year old males and 16 and 17 year old females are the most vulnerable to poverty, with 21 males (8.1%) and 69 females (42.9%) in their respective age groups living below the poverty level.
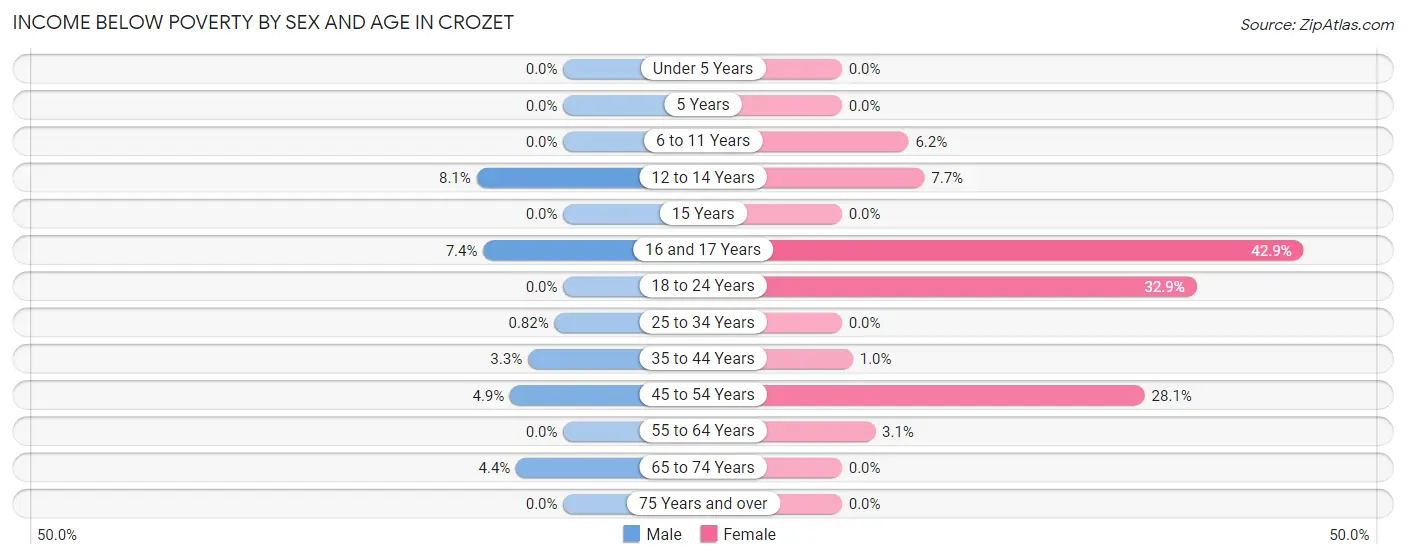
| Age Bracket | Male | Female |
| Under 5 Years | 0 (0.0%) | 0 (0.0%) |
| 5 Years | 0 (0.0%) | 0 (0.0%) |
| 6 to 11 Years | 0 (0.0%) | 18 (6.2%) |
| 12 to 14 Years | 21 (8.1%) | 17 (7.7%) |
| 15 Years | 0 (0.0%) | 0 (0.0%) |
| 16 and 17 Years | 15 (7.4%) | 69 (42.9%) |
| 18 to 24 Years | 0 (0.0%) | 133 (32.9%) |
| 25 to 34 Years | 3 (0.8%) | 0 (0.0%) |
| 35 to 44 Years | 24 (3.3%) | 6 (1.0%) |
| 45 to 54 Years | 22 (4.9%) | 201 (28.1%) |
| 55 to 64 Years | 0 (0.0%) | 19 (3.1%) |
| 65 to 74 Years | 11 (4.4%) | 0 (0.0%) |
| 75 Years and over | 0 (0.0%) | 0 (0.0%) |
| Total | 96 (2.4%) | 463 (9.6%) |
Income Above Poverty by Sex and Age in Crozet
According to the poverty statistics in Crozet, males aged under 5 years and females aged under 5 years are the age groups that are most secure financially, with 100.0% of males and 100.0% of females in these age groups living above the poverty line.
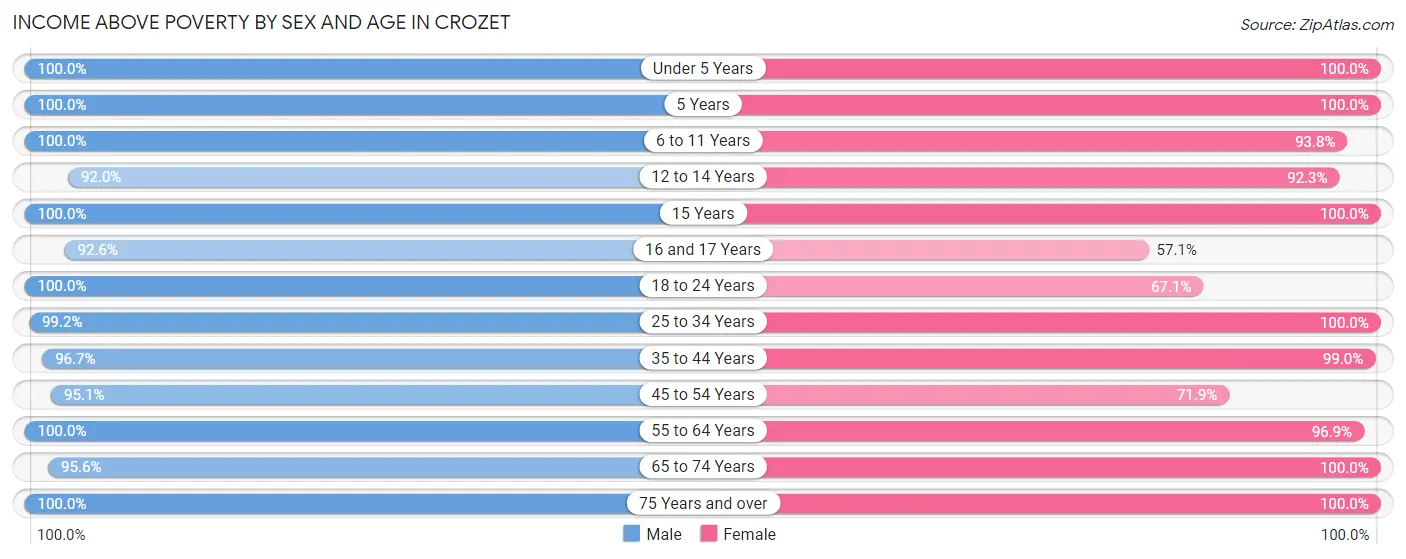
| Age Bracket | Male | Female |
| Under 5 Years | 507 (100.0%) | 264 (100.0%) |
| 5 Years | 144 (100.0%) | 139 (100.0%) |
| 6 to 11 Years | 228 (100.0%) | 273 (93.8%) |
| 12 to 14 Years | 240 (91.9%) | 205 (92.3%) |
| 15 Years | 77 (100.0%) | 100 (100.0%) |
| 16 and 17 Years | 187 (92.6%) | 92 (57.1%) |
| 18 to 24 Years | 125 (100.0%) | 271 (67.1%) |
| 25 to 34 Years | 362 (99.2%) | 592 (100.0%) |
| 35 to 44 Years | 708 (96.7%) | 585 (99.0%) |
| 45 to 54 Years | 423 (95.1%) | 514 (71.9%) |
| 55 to 64 Years | 519 (100.0%) | 595 (96.9%) |
| 65 to 74 Years | 240 (95.6%) | 398 (100.0%) |
| 75 Years and over | 237 (100.0%) | 310 (100.0%) |
| Total | 3,997 (97.7%) | 4,338 (90.4%) |
Income Below Poverty Among Married-Couple Families in Crozet
The poverty statistics for married-couple families in Crozet show that 1.6% or 32 of the total 1,996 families live below the poverty line. Families with 3 or 4 children have the highest poverty rate of 9.3%, comprising of 22 families. On the other hand, families with 1 or 2 children have the lowest poverty rate of 0.0%, which includes 0 families.
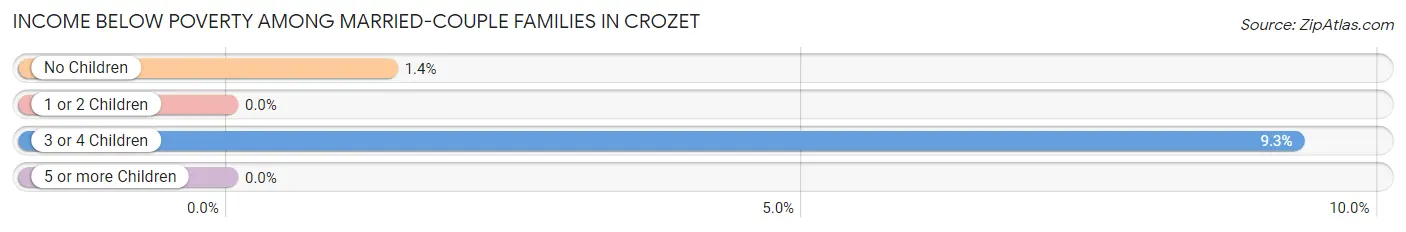
| Children | Above Poverty | Below Poverty |
| No Children | 711 (98.6%) | 10 (1.4%) |
| 1 or 2 Children | 1,031 (100.0%) | 0 (0.0%) |
| 3 or 4 Children | 215 (90.7%) | 22 (9.3%) |
| 5 or more Children | 7 (100.0%) | 0 (0.0%) |
| Total | 1,964 (98.4%) | 32 (1.6%) |
Income Below Poverty Among Single-Parent Households in Crozet
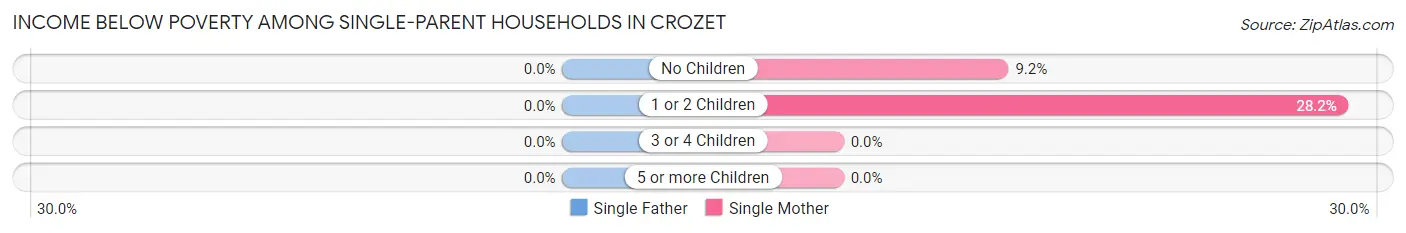
| Children | Single Father | Single Mother |
| No Children | 0 (0.0%) | 7 (9.2%) |
| 1 or 2 Children | 0 (0.0%) | 77 (28.2%) |
| 3 or 4 Children | 0 (0.0%) | 0 (0.0%) |
| 5 or more Children | 0 (0.0%) | 0 (0.0%) |
| Total | 0 (0.0%) | 84 (24.1%) |
Income Below Poverty Among Married-Couple vs Single-Parent Households in Crozet
The poverty data for Crozet shows that 32 of the married-couple family households (1.6%) and 84 of the single-parent households (16.5%) are living below the poverty level. Within the married-couple family households, those with 3 or 4 children have the highest poverty rate, with 22 households (9.3%) falling below the poverty line. Among the single-parent households, those with 1 or 2 children have the highest poverty rate, with 77 household (24.8%) living below poverty.
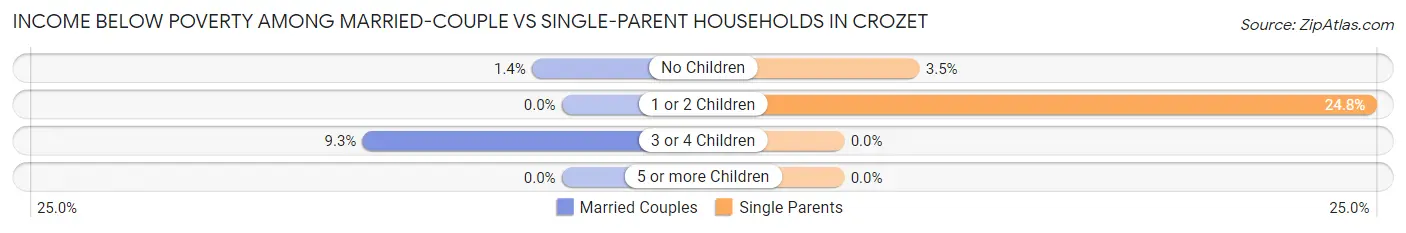
| Children | Married-Couple Families | Single-Parent Households |
| No Children | 10 (1.4%) | 7 (3.5%) |
| 1 or 2 Children | 0 (0.0%) | 77 (24.8%) |
| 3 or 4 Children | 22 (9.3%) | 0 (0.0%) |
| 5 or more Children | 0 (0.0%) | 0 (0.0%) |
| Total | 32 (1.6%) | 84 (16.5%) |
Race in Crozet
The most populous races in Crozet are White / Caucasian (8,156 | 91.7%), Asian (285 | 3.2%), and Two or more Races (232 | 2.6%).
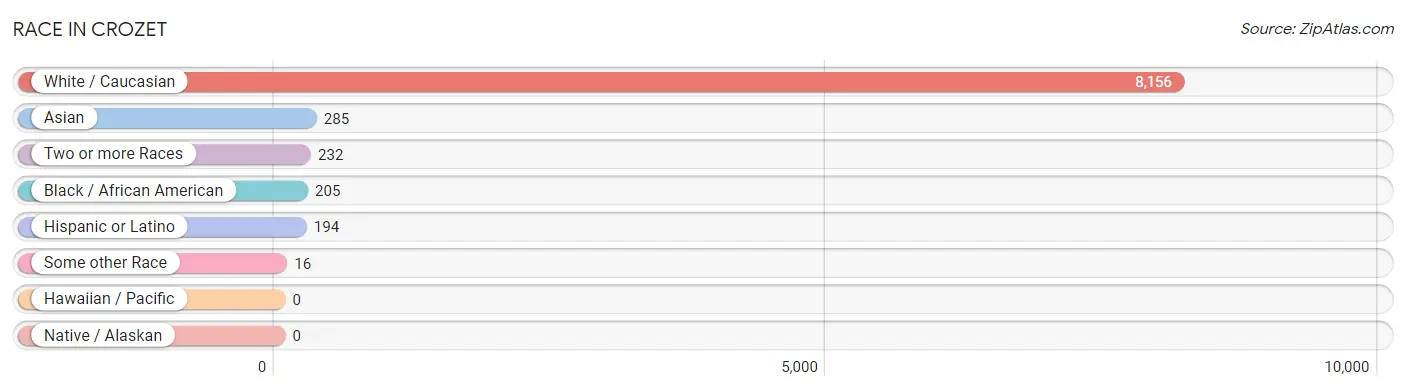
| Race | # Population | % Population |
| Asian | 285 | 3.2% |
| Black / African American | 205 | 2.3% |
| Hawaiian / Pacific | 0 | 0.0% |
| Hispanic or Latino | 194 | 2.2% |
| Native / Alaskan | 0 | 0.0% |
| White / Caucasian | 8,156 | 91.7% |
| Two or more Races | 232 | 2.6% |
| Some other Race | 16 | 0.2% |
| Total | 8,894 | 100.0% |
Ancestry in Crozet
The most populous ancestries reported in Crozet are German (1,623 | 18.2%), English (1,420 | 16.0%), Irish (1,014 | 11.4%), American (548 | 6.2%), and European (532 | 6.0%), together accounting for 57.8% of all Crozet residents.
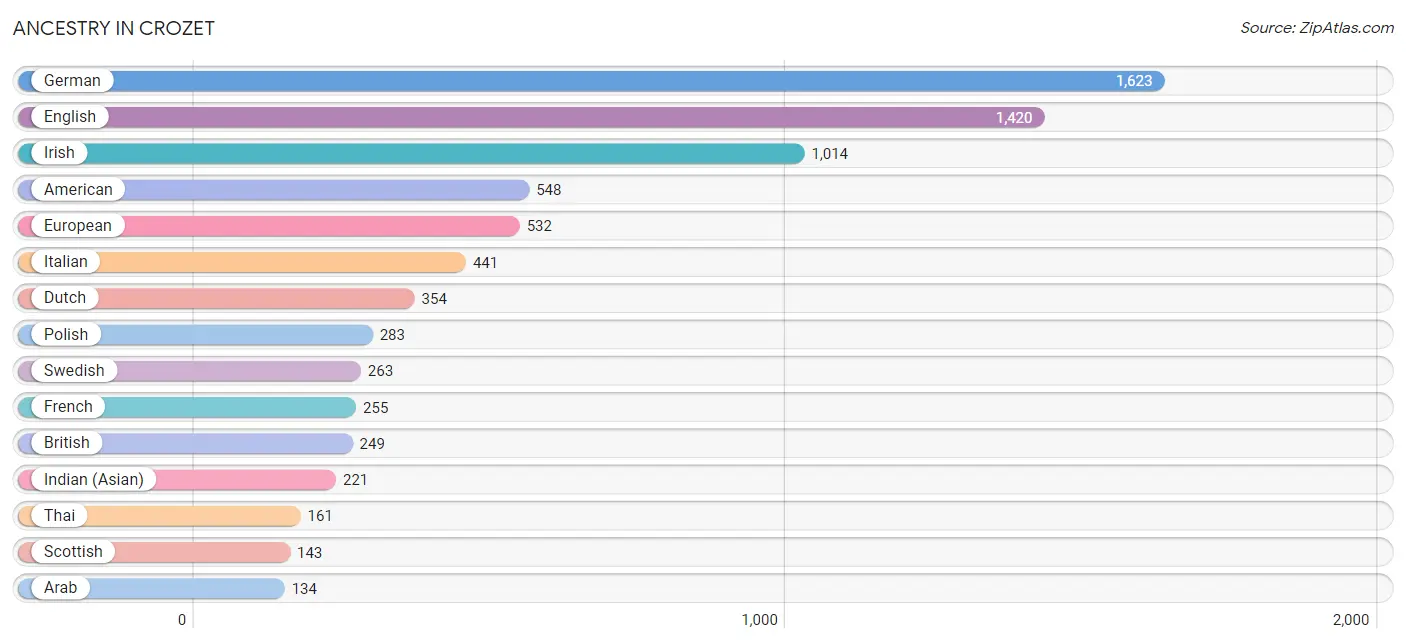
| Ancestry | # Population | % Population |
| American | 548 | 6.2% |
| Arab | 134 | 1.5% |
| Austrian | 59 | 0.7% |
| Bhutanese | 36 | 0.4% |
| Brazilian | 39 | 0.4% |
| British | 249 | 2.8% |
| Bulgarian | 57 | 0.6% |
| Burmese | 3 | 0.0% |
| Canadian | 52 | 0.6% |
| Central American | 77 | 0.9% |
| Colombian | 33 | 0.4% |
| Czech | 8 | 0.1% |
| Danish | 35 | 0.4% |
| Dominican | 8 | 0.1% |
| Dutch | 354 | 4.0% |
| English | 1,420 | 16.0% |
| European | 532 | 6.0% |
| Finnish | 10 | 0.1% |
| French | 255 | 2.9% |
| German | 1,623 | 18.2% |
| Greek | 41 | 0.5% |
| Hungarian | 31 | 0.4% |
| Indian (Asian) | 221 | 2.5% |
| Irish | 1,014 | 11.4% |
| Italian | 441 | 5.0% |
| Japanese | 25 | 0.3% |
| Korean | 4 | 0.0% |
| Lebanese | 134 | 1.5% |
| Lithuanian | 3 | 0.0% |
| Mexican | 37 | 0.4% |
| Norwegian | 67 | 0.7% |
| Pakistani | 25 | 0.3% |
| Panamanian | 77 | 0.9% |
| Pennsylvania German | 4 | 0.0% |
| Peruvian | 9 | 0.1% |
| Polish | 283 | 3.2% |
| Portuguese | 30 | 0.3% |
| Puerto Rican | 30 | 0.3% |
| Romanian | 15 | 0.2% |
| Russian | 28 | 0.3% |
| Scandinavian | 51 | 0.6% |
| Scotch-Irish | 112 | 1.3% |
| Scottish | 143 | 1.6% |
| Slovak | 54 | 0.6% |
| South American | 42 | 0.5% |
| Swedish | 263 | 3.0% |
| Swiss | 3 | 0.0% |
| Thai | 161 | 1.8% |
| Turkish | 21 | 0.2% |
| Ukrainian | 12 | 0.1% |
| Welsh | 24 | 0.3% | View All 51 Rows |
Immigrants in Crozet
The most numerous immigrant groups reported in Crozet came from Asia (268 | 3.0%), Eastern Asia (172 | 1.9%), China (157 | 1.8%), South Central Asia (96 | 1.1%), and Latin America (86 | 1.0%), together accounting for 8.8% of all Crozet residents.
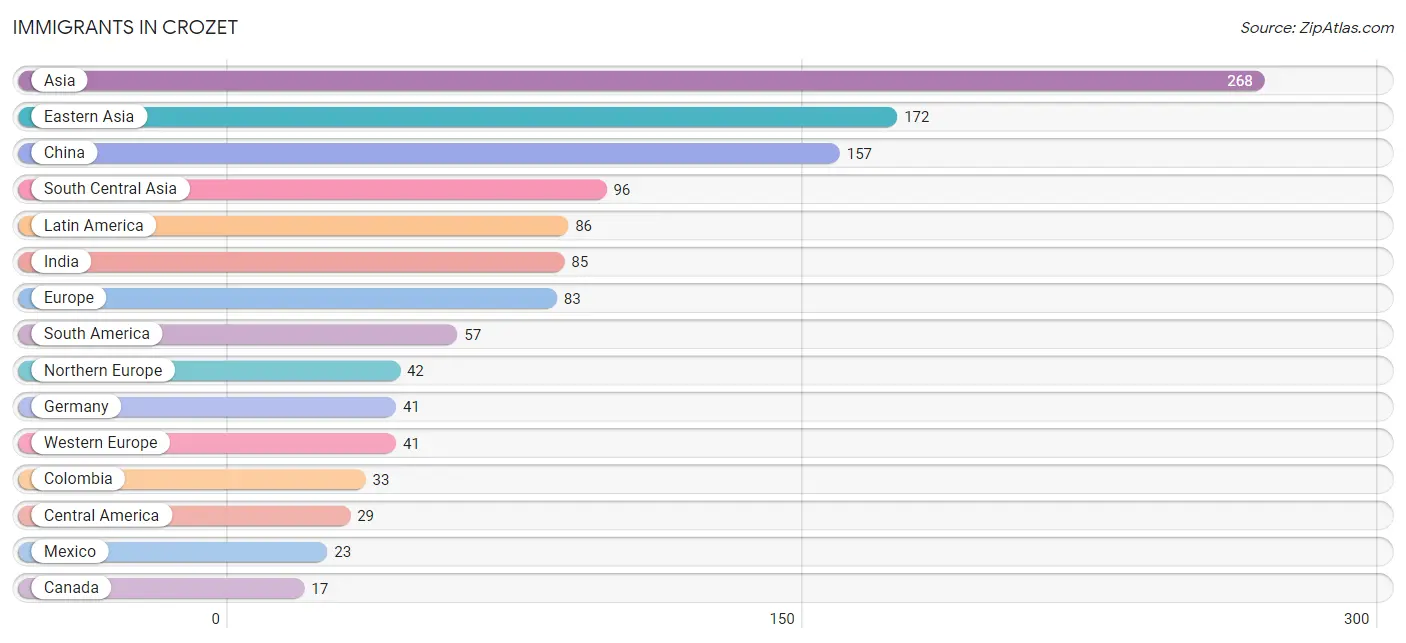
| Immigration Origin | # Population | % Population |
| Asia | 268 | 3.0% |
| Brazil | 15 | 0.2% |
| Canada | 17 | 0.2% |
| Central America | 29 | 0.3% |
| China | 157 | 1.8% |
| Colombia | 33 | 0.4% |
| Eastern Asia | 172 | 1.9% |
| Europe | 83 | 0.9% |
| Germany | 41 | 0.5% |
| India | 85 | 1.0% |
| Ireland | 15 | 0.2% |
| Japan | 12 | 0.1% |
| Korea | 3 | 0.0% |
| Latin America | 86 | 1.0% |
| Mexico | 23 | 0.3% |
| Northern Europe | 42 | 0.5% |
| Panama | 6 | 0.1% |
| Peru | 9 | 0.1% |
| Scotland | 6 | 0.1% |
| South America | 57 | 0.6% |
| South Central Asia | 96 | 1.1% |
| Uzbekistan | 11 | 0.1% |
| Western Europe | 41 | 0.5% | View All 23 Rows |
Sex and Age in Crozet
Sex and Age in Crozet
The most populous age groups in Crozet are Under 5 Years (507 | 12.4%) for men and 15 to 19 Years (492 | 10.2%) for women.
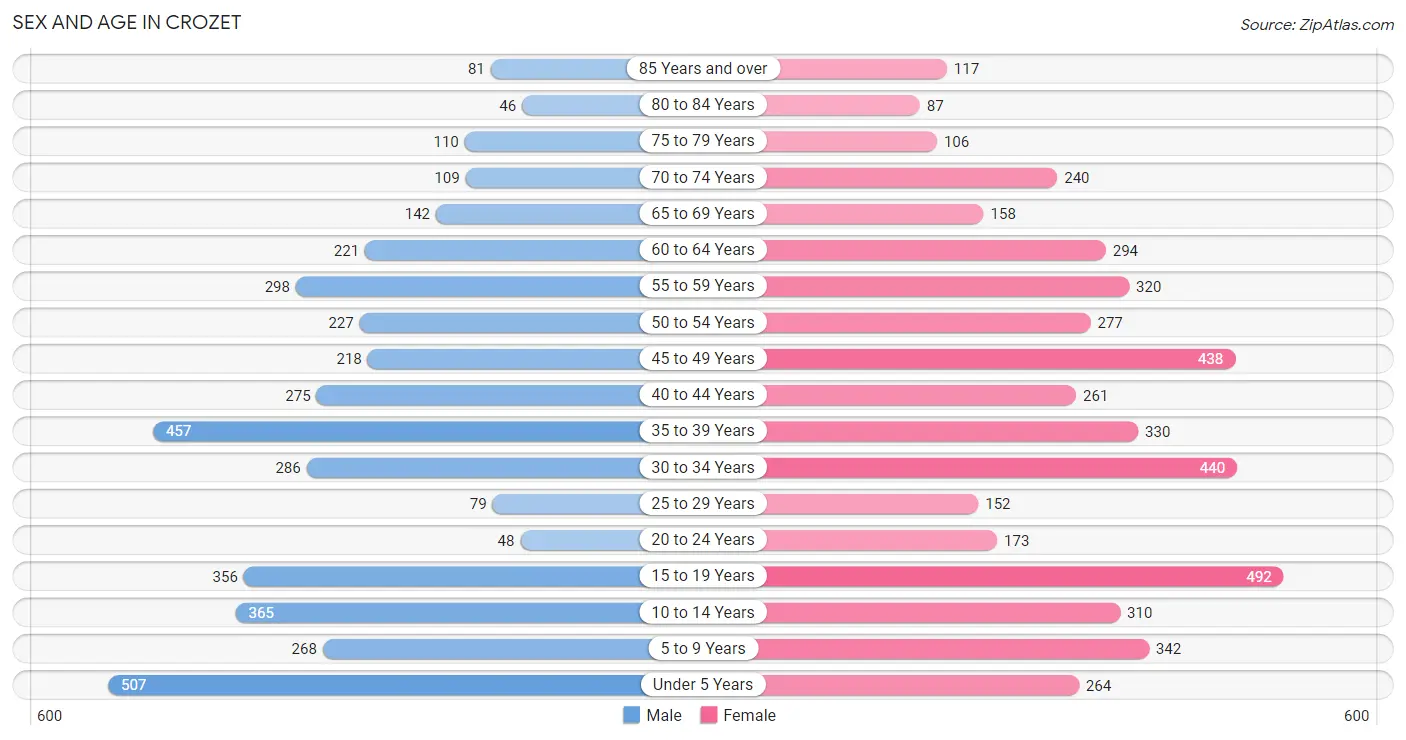
| Age Bracket | Male | Female |
| Under 5 Years | 507 (12.4%) | 264 (5.5%) |
| 5 to 9 Years | 268 (6.6%) | 342 (7.1%) |
| 10 to 14 Years | 365 (8.9%) | 310 (6.5%) |
| 15 to 19 Years | 356 (8.7%) | 492 (10.2%) |
| 20 to 24 Years | 48 (1.2%) | 173 (3.6%) |
| 25 to 29 Years | 79 (1.9%) | 152 (3.2%) |
| 30 to 34 Years | 286 (7.0%) | 440 (9.2%) |
| 35 to 39 Years | 457 (11.2%) | 330 (6.9%) |
| 40 to 44 Years | 275 (6.7%) | 261 (5.4%) |
| 45 to 49 Years | 218 (5.3%) | 438 (9.1%) |
| 50 to 54 Years | 227 (5.6%) | 277 (5.8%) |
| 55 to 59 Years | 298 (7.3%) | 320 (6.7%) |
| 60 to 64 Years | 221 (5.4%) | 294 (6.1%) |
| 65 to 69 Years | 142 (3.5%) | 158 (3.3%) |
| 70 to 74 Years | 109 (2.7%) | 240 (5.0%) |
| 75 to 79 Years | 110 (2.7%) | 106 (2.2%) |
| 80 to 84 Years | 46 (1.1%) | 87 (1.8%) |
| 85 Years and over | 81 (2.0%) | 117 (2.4%) |
| Total | 4,093 (100.0%) | 4,801 (100.0%) |
Families and Households in Crozet
Median Family Size in Crozet
The median family size in Crozet is 3.12 persons per family, with married-couple families (1,996 | 79.6%) accounting for the largest median family size of 3.26 persons per family. On the other hand, single male/father families (161 | 6.4%) represent the smallest median family size with 2.29 persons per family.
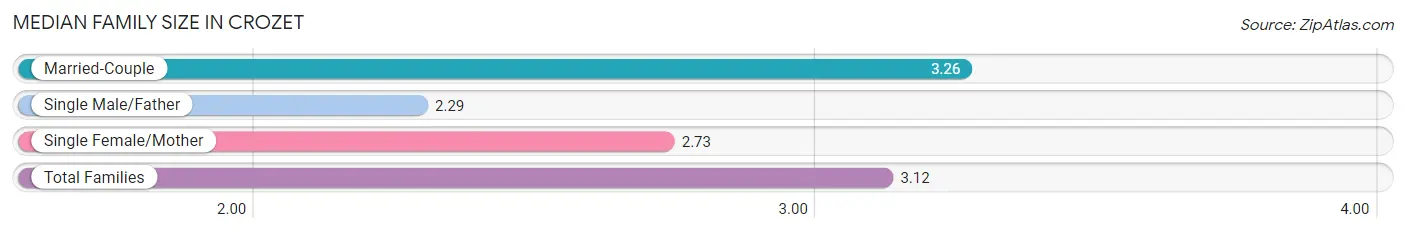
| Family Type | # Families | Family Size |
| Married-Couple | 1,996 (79.6%) | 3.26 |
| Single Male/Father | 161 (6.4%) | 2.29 |
| Single Female/Mother | 349 (13.9%) | 2.73 |
| Total Families | 2,506 (100.0%) | 3.12 |
Median Household Size in Crozet
The median household size in Crozet is 2.62 persons per household, with married-couple households (1,996 | 58.8%) accounting for the largest median household size of 3.27 persons per household. non-family households (891 | 26.2%) represent the smallest median household size with 1.15 persons per household.
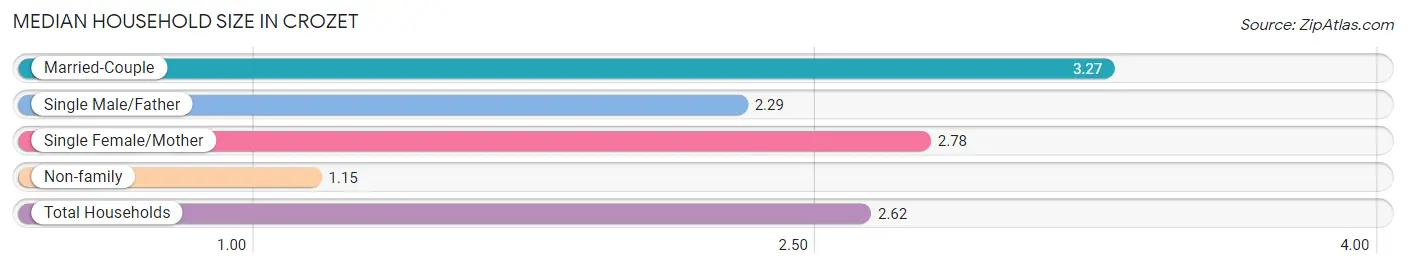
| Household Type | # Households | Household Size |
| Married-Couple | 1,996 (58.8%) | 3.27 |
| Single Male/Father | 161 (4.7%) | 2.29 |
| Single Female/Mother | 349 (10.3%) | 2.78 |
| Non-family | 891 (26.2%) | 1.15 |
| Total Households | 3,397 (100.0%) | 2.62 |
Household Size by Marriage Status in Crozet
Out of a total of 3,397 households in Crozet, 2,506 (73.8%) are family households, while 891 (26.2%) are nonfamily households. The most numerous type of family households are 2-person households, comprising 929, and the most common type of nonfamily households are 1-person households, comprising 775.
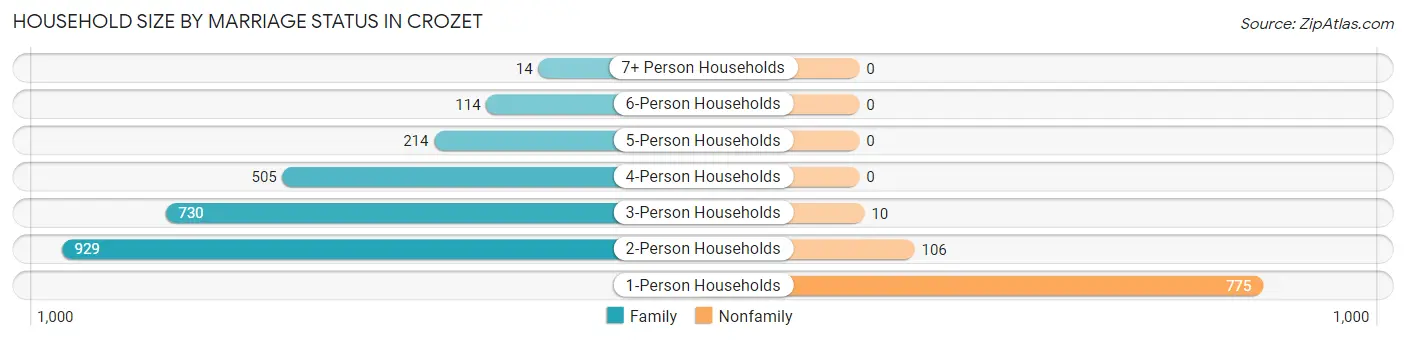
| Household Size | Family Households | Nonfamily Households |
| 1-Person Households | - | 775 (22.8%) |
| 2-Person Households | 929 (27.4%) | 106 (3.1%) |
| 3-Person Households | 730 (21.5%) | 10 (0.3%) |
| 4-Person Households | 505 (14.9%) | 0 (0.0%) |
| 5-Person Households | 214 (6.3%) | 0 (0.0%) |
| 6-Person Households | 114 (3.4%) | 0 (0.0%) |
| 7+ Person Households | 14 (0.4%) | 0 (0.0%) |
| Total | 2,506 (73.8%) | 891 (26.2%) |
Female Fertility in Crozet
Fertility by Age in Crozet
Average fertility rate in Crozet is 18.0 births per 1,000 women. Women in the age bracket of 20 to 34 years have the highest fertility rate with 54.0 births per 1,000 women. Women in the age bracket of 20 to 34 years acount for 100.0% of all women with births.
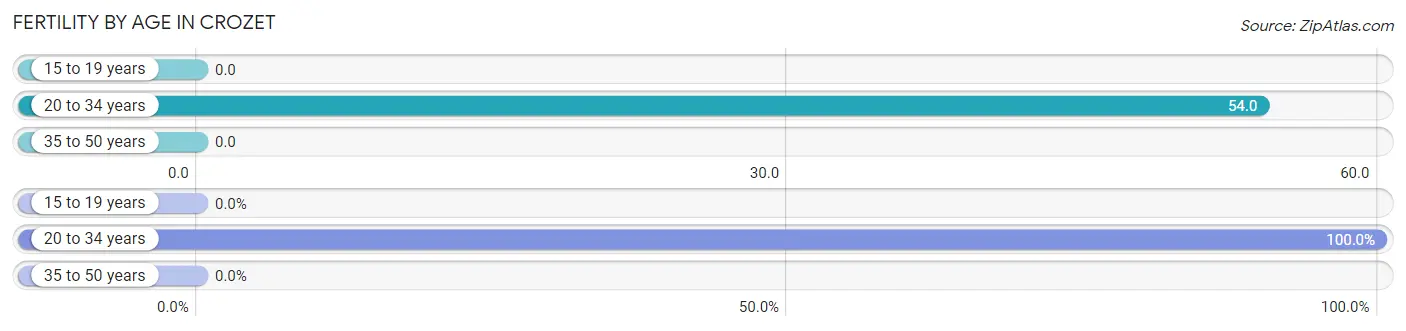
| Age Bracket | Women with Births | Births / 1,000 Women |
| 15 to 19 years | 0 (0.0%) | 0.0 |
| 20 to 34 years | 41 (100.0%) | 54.0 |
| 35 to 50 years | 0 (0.0%) | 0.0 |
| Total | 41 (100.0%) | 18.0 |
Fertility by Age by Marriage Status in Crozet
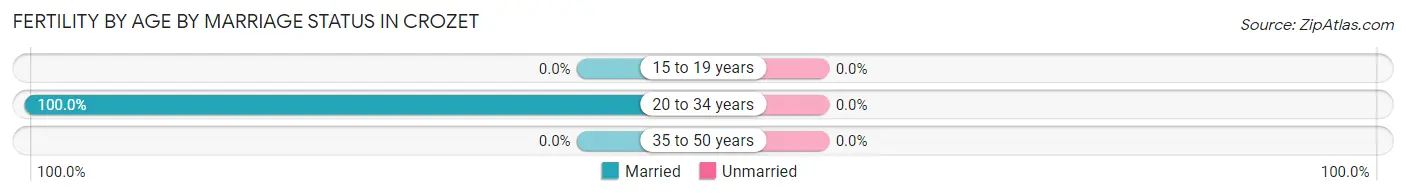
| Age Bracket | Married | Unmarried |
| 15 to 19 years | 0 (0.0%) | 0 (0.0%) |
| 20 to 34 years | 41 (100.0%) | 0 (0.0%) |
| 35 to 50 years | 0 (0.0%) | 0 (0.0%) |
| Total | 41 (100.0%) | 0 (0.0%) |
Fertility by Education in Crozet
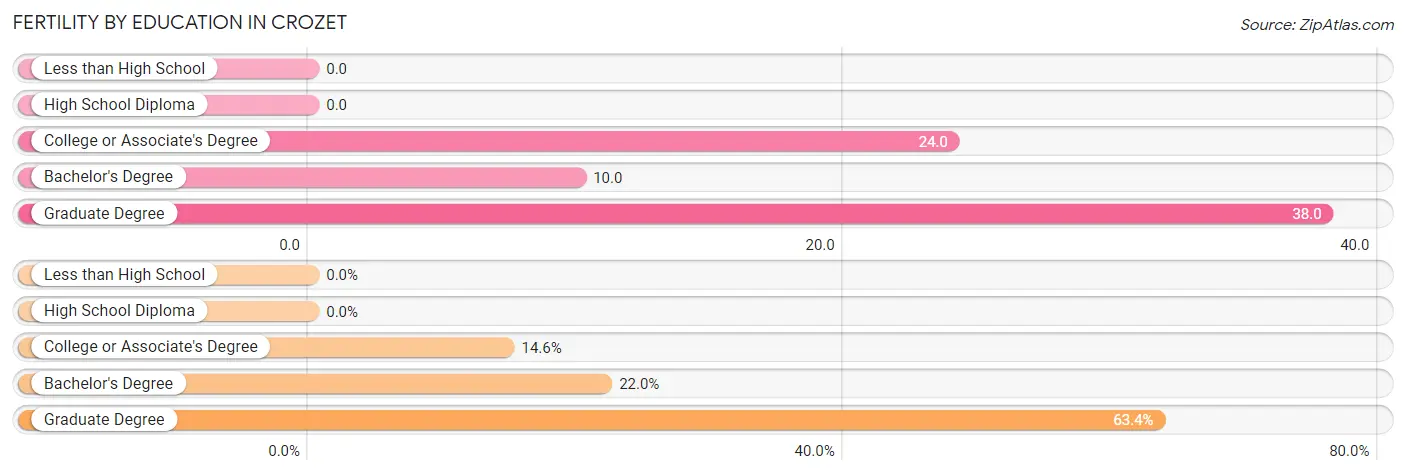
| Educational Attainment | Women with Births | Births / 1,000 Women |
| Less than High School | 0 (0.0%) | 0.0 |
| High School Diploma | 0 (0.0%) | 0.0 |
| College or Associate's Degree | 6 (14.6%) | 24.0 |
| Bachelor's Degree | 9 (22.0%) | 10.0 |
| Graduate Degree | 26 (63.4%) | 38.0 |
| Total | 41 (100.0%) | 18.0 |
Fertility by Education by Marriage Status in Crozet
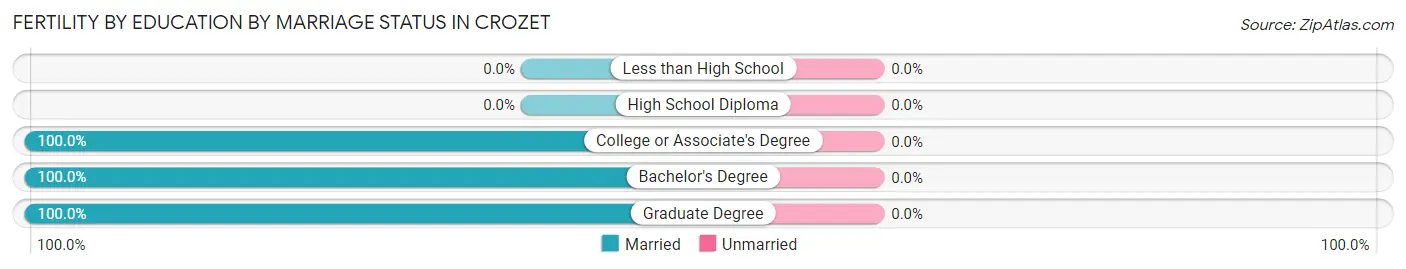
| Educational Attainment | Married | Unmarried |
| Less than High School | 0 (0.0%) | 0 (0.0%) |
| High School Diploma | 0 (0.0%) | 0 (0.0%) |
| College or Associate's Degree | 6 (100.0%) | 0 (0.0%) |
| Bachelor's Degree | 9 (100.0%) | 0 (0.0%) |
| Graduate Degree | 26 (100.0%) | 0 (0.0%) |
| Total | 41 (100.0%) | 0 (0.0%) |
Employment Characteristics in Crozet
Employment by Class of Employer in Crozet
Among the 4,390 employed individuals in Crozet, private company employees (2,112 | 48.1%), not-for-profit organizations (664 | 15.1%), and state government employees (640 | 14.6%) make up the most common classes of employment.
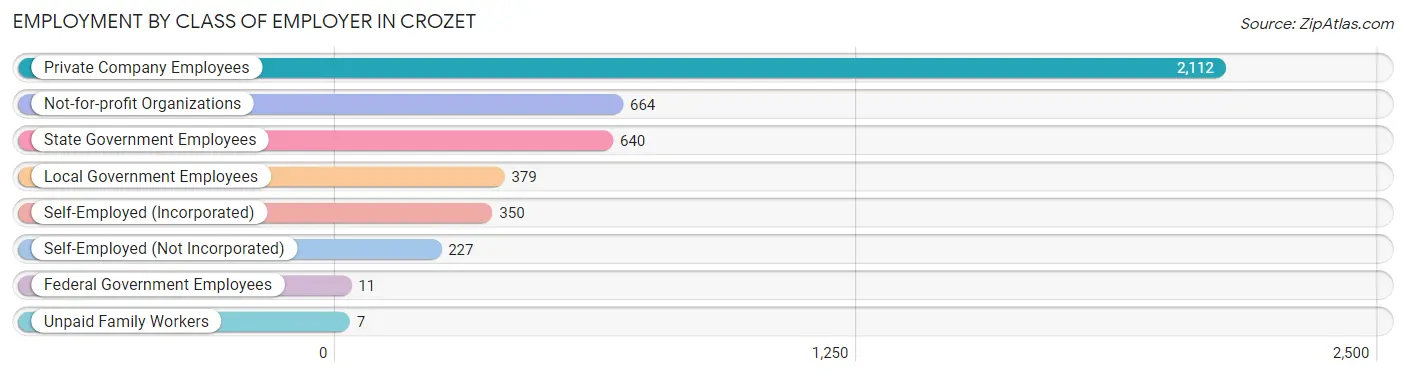
| Employer Class | # Employees | % Employees |
| Private Company Employees | 2,112 | 48.1% |
| Self-Employed (Incorporated) | 350 | 8.0% |
| Self-Employed (Not Incorporated) | 227 | 5.2% |
| Not-for-profit Organizations | 664 | 15.1% |
| Local Government Employees | 379 | 8.6% |
| State Government Employees | 640 | 14.6% |
| Federal Government Employees | 11 | 0.3% |
| Unpaid Family Workers | 7 | 0.2% |
| Total | 4,390 | 100.0% |
Employment Status by Age in Crozet
According to the labor force statistics for Crozet, out of the total population over 16 years of age (6,661), 68.2% or 4,543 individuals are in the labor force, with 2.7% or 123 of them unemployed. The age group with the highest labor force participation rate is 35 to 44 years, with 93.7% or 1,240 individuals in the labor force. Within the labor force, the 16 to 19 years age range has the highest percentage of unemployed individuals, with 16.2% or 47 of them being unemployed.
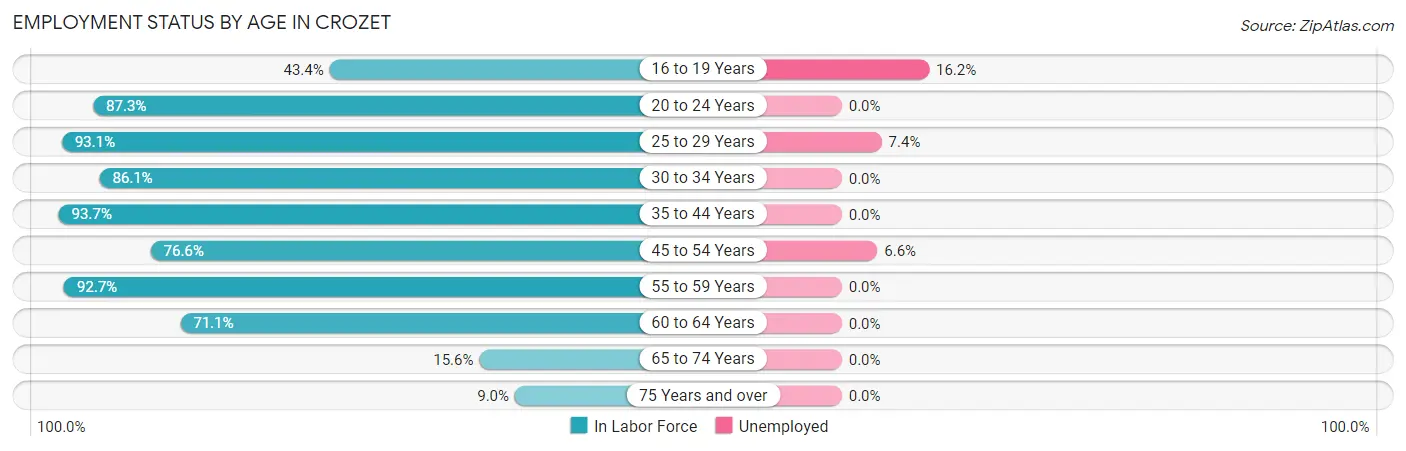
| Age Bracket | In Labor Force | Unemployed |
| 16 to 19 Years | 291 (43.4%) | 47 (16.2%) |
| 20 to 24 Years | 193 (87.3%) | 0 (0.0%) |
| 25 to 29 Years | 215 (93.1%) | 16 (7.4%) |
| 30 to 34 Years | 625 (86.1%) | 0 (0.0%) |
| 35 to 44 Years | 1,240 (93.7%) | 0 (0.0%) |
| 45 to 54 Years | 889 (76.6%) | 59 (6.6%) |
| 55 to 59 Years | 573 (92.7%) | 0 (0.0%) |
| 60 to 64 Years | 366 (71.1%) | 0 (0.0%) |
| 65 to 74 Years | 101 (15.6%) | 0 (0.0%) |
| 75 Years and over | 49 (9.0%) | 0 (0.0%) |
| Total | 4,543 (68.2%) | 123 (2.7%) |
Employment Status by Educational Attainment in Crozet
According to labor force statistics for Crozet, 85.4% of individuals (3,905) out of the total population between 25 and 64 years of age (4,573) are in the labor force, with 1.9% or 74 of them being unemployed. The group with the highest labor force participation rate are those with the educational attainment of bachelor's degree or higher, with 90.3% or 3,208 individuals in the labor force. Within the labor force, individuals with bachelor's degree or higher education have the highest percentage of unemployment, with 2.3% or 74 of them being unemployed.
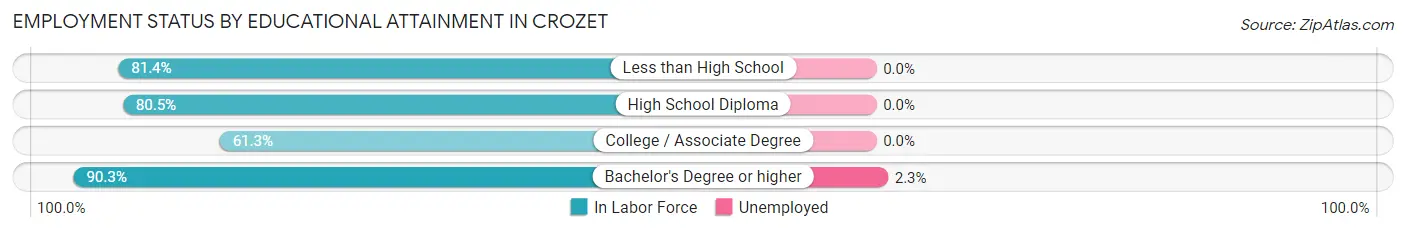
| Educational Attainment | In Labor Force | Unemployed |
| Less than High School | 149 (81.4%) | 0 (0.0%) |
| High School Diploma | 149 (80.5%) | 0 (0.0%) |
| College / Associate Degree | 400 (61.3%) | 0 (0.0%) |
| Bachelor's Degree or higher | 3,208 (90.3%) | 82 (2.3%) |
| Total | 3,905 (85.4%) | 87 (1.9%) |
Employment Occupations by Sex in Crozet
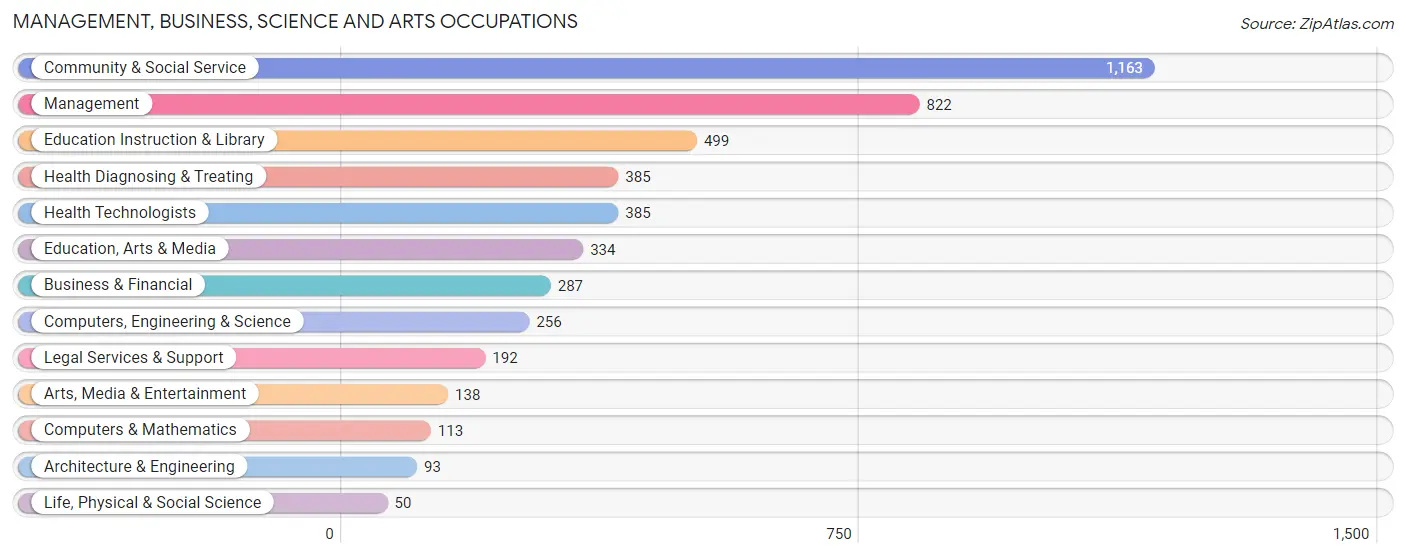
Management, Business, Science and Arts Occupations
The most common Management, Business, Science and Arts occupations in Crozet are Community & Social Service (1,163 | 26.3%), Management (822 | 18.6%), Education Instruction & Library (499 | 11.3%), Health Diagnosing & Treating (385 | 8.7%), and Health Technologists (385 | 8.7%).
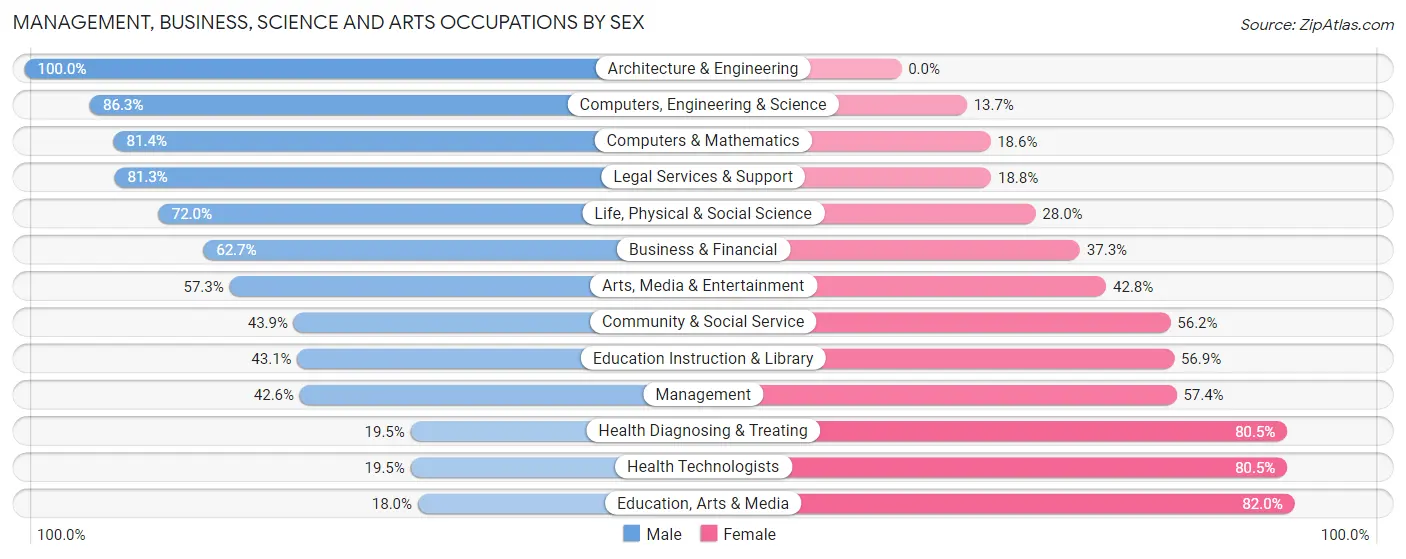
Management, Business, Science and Arts Occupations by Sex
Within the Management, Business, Science and Arts occupations in Crozet, the most male-oriented occupations are Architecture & Engineering (100.0%), Computers, Engineering & Science (86.3%), and Computers & Mathematics (81.4%), while the most female-oriented occupations are Education, Arts & Media (82.0%), Health Diagnosing & Treating (80.5%), and Health Technologists (80.5%).
| Occupation | Male | Female |
| Management | 350 (42.6%) | 472 (57.4%) |
| Business & Financial | 180 (62.7%) | 107 (37.3%) |
| Computers, Engineering & Science | 221 (86.3%) | 35 (13.7%) |
| Computers & Mathematics | 92 (81.4%) | 21 (18.6%) |
| Architecture & Engineering | 93 (100.0%) | 0 (0.0%) |
| Life, Physical & Social Science | 36 (72.0%) | 14 (28.0%) |
| Community & Social Service | 510 (43.9%) | 653 (56.1%) |
| Education, Arts & Media | 60 (18.0%) | 274 (82.0%) |
| Legal Services & Support | 156 (81.2%) | 36 (18.8%) |
| Education Instruction & Library | 215 (43.1%) | 284 (56.9%) |
| Arts, Media & Entertainment | 79 (57.3%) | 59 (42.7%) |
| Health Diagnosing & Treating | 75 (19.5%) | 310 (80.5%) |
| Health Technologists | 75 (19.5%) | 310 (80.5%) |
| Total (Category) | 1,336 (45.9%) | 1,577 (54.1%) |
| Total (Overall) | 2,064 (46.7%) | 2,355 (53.3%) |
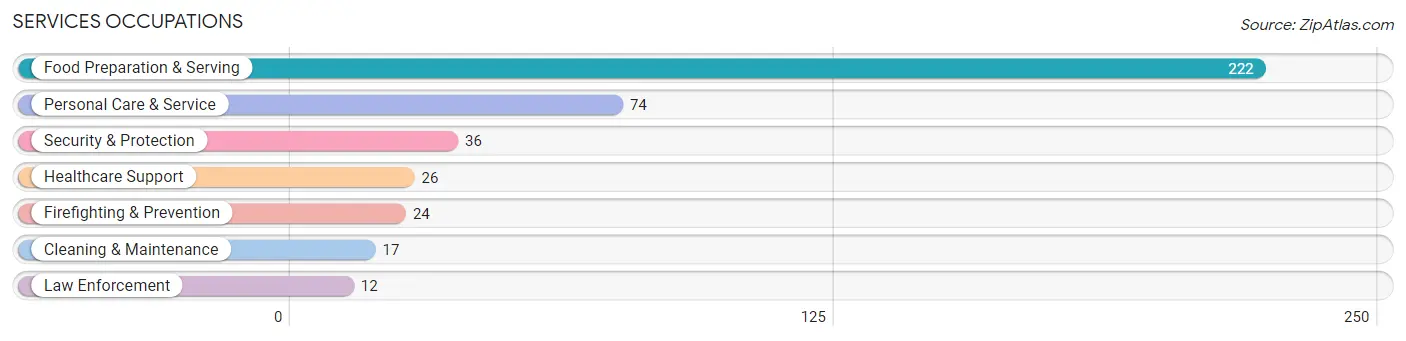
Services Occupations
The most common Services occupations in Crozet are Food Preparation & Serving (222 | 5.0%), Personal Care & Service (74 | 1.7%), Security & Protection (36 | 0.8%), Healthcare Support (26 | 0.6%), and Firefighting & Prevention (24 | 0.5%).
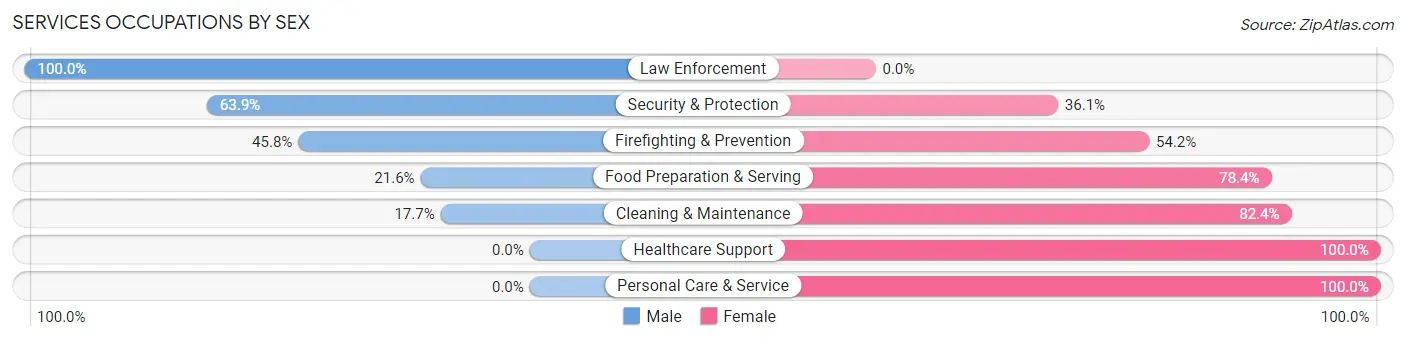
Services Occupations by Sex
Within the Services occupations in Crozet, the most male-oriented occupations are Law Enforcement (100.0%), Security & Protection (63.9%), and Firefighting & Prevention (45.8%), while the most female-oriented occupations are Healthcare Support (100.0%), Personal Care & Service (100.0%), and Cleaning & Maintenance (82.4%).
| Occupation | Male | Female |
| Healthcare Support | 0 (0.0%) | 26 (100.0%) |
| Security & Protection | 23 (63.9%) | 13 (36.1%) |
| Firefighting & Prevention | 11 (45.8%) | 13 (54.2%) |
| Law Enforcement | 12 (100.0%) | 0 (0.0%) |
| Food Preparation & Serving | 48 (21.6%) | 174 (78.4%) |
| Cleaning & Maintenance | 3 (17.6%) | 14 (82.4%) |
| Personal Care & Service | 0 (0.0%) | 74 (100.0%) |
| Total (Category) | 74 (19.7%) | 301 (80.3%) |
| Total (Overall) | 2,064 (46.7%) | 2,355 (53.3%) |
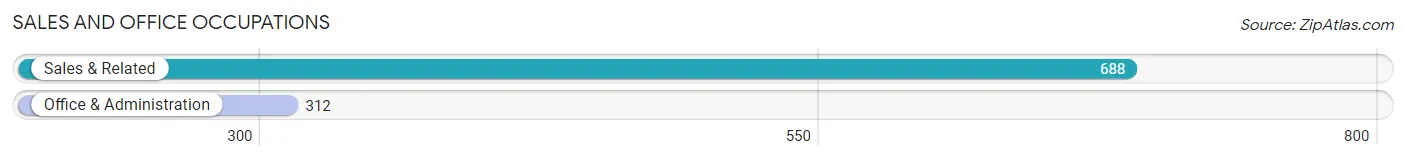
Sales and Office Occupations
The most common Sales and Office occupations in Crozet are Sales & Related (688 | 15.6%), and Office & Administration (312 | 7.1%).
Sales and Office Occupations by Sex
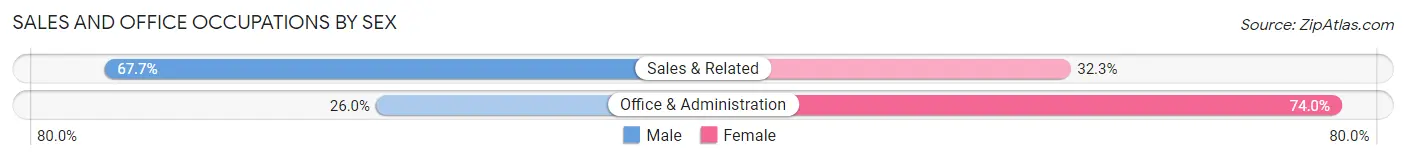
| Occupation | Male | Female |
| Sales & Related | 466 (67.7%) | 222 (32.3%) |
| Office & Administration | 81 (26.0%) | 231 (74.0%) |
| Total (Category) | 547 (54.7%) | 453 (45.3%) |
| Total (Overall) | 2,064 (46.7%) | 2,355 (53.3%) |
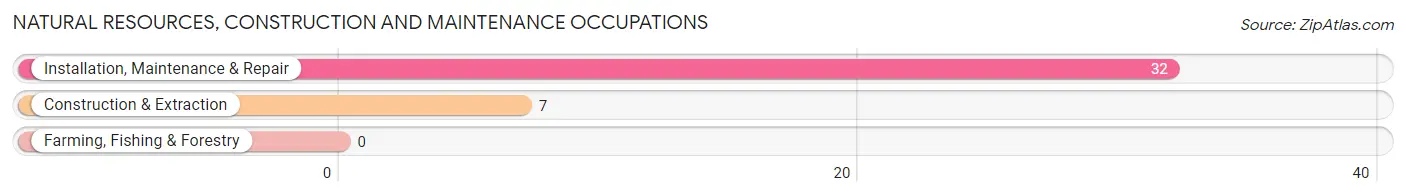
Natural Resources, Construction and Maintenance Occupations
The most common Natural Resources, Construction and Maintenance occupations in Crozet are Installation, Maintenance & Repair (32 | 0.7%), and Construction & Extraction (7 | 0.2%).
Natural Resources, Construction and Maintenance Occupations by Sex
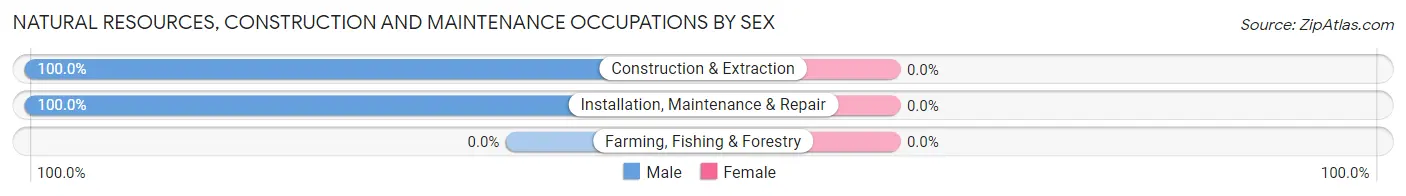
| Occupation | Male | Female |
| Farming, Fishing & Forestry | 0 (0.0%) | 0 (0.0%) |
| Construction & Extraction | 7 (100.0%) | 0 (0.0%) |
| Installation, Maintenance & Repair | 32 (100.0%) | 0 (0.0%) |
| Total (Category) | 39 (100.0%) | 0 (0.0%) |
| Total (Overall) | 2,064 (46.7%) | 2,355 (53.3%) |
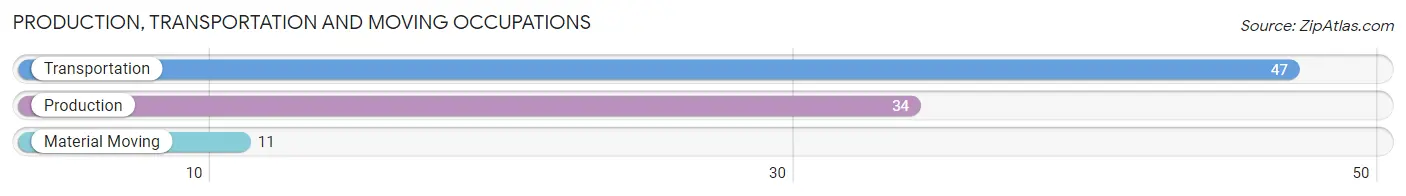
Production, Transportation and Moving Occupations
The most common Production, Transportation and Moving occupations in Crozet are Transportation (47 | 1.1%), Production (34 | 0.8%), and Material Moving (11 | 0.3%).
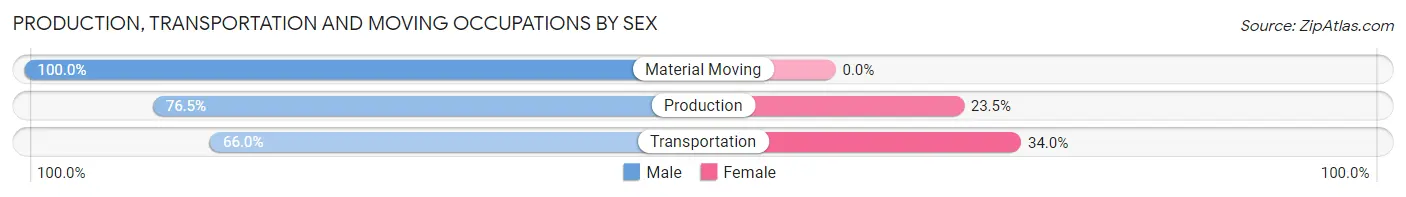
Production, Transportation and Moving Occupations by Sex
| Occupation | Male | Female |
| Production | 26 (76.5%) | 8 (23.5%) |
| Transportation | 31 (66.0%) | 16 (34.0%) |
| Material Moving | 11 (100.0%) | 0 (0.0%) |
| Total (Category) | 68 (73.9%) | 24 (26.1%) |
| Total (Overall) | 2,064 (46.7%) | 2,355 (53.3%) |
Employment Industries by Sex in Crozet
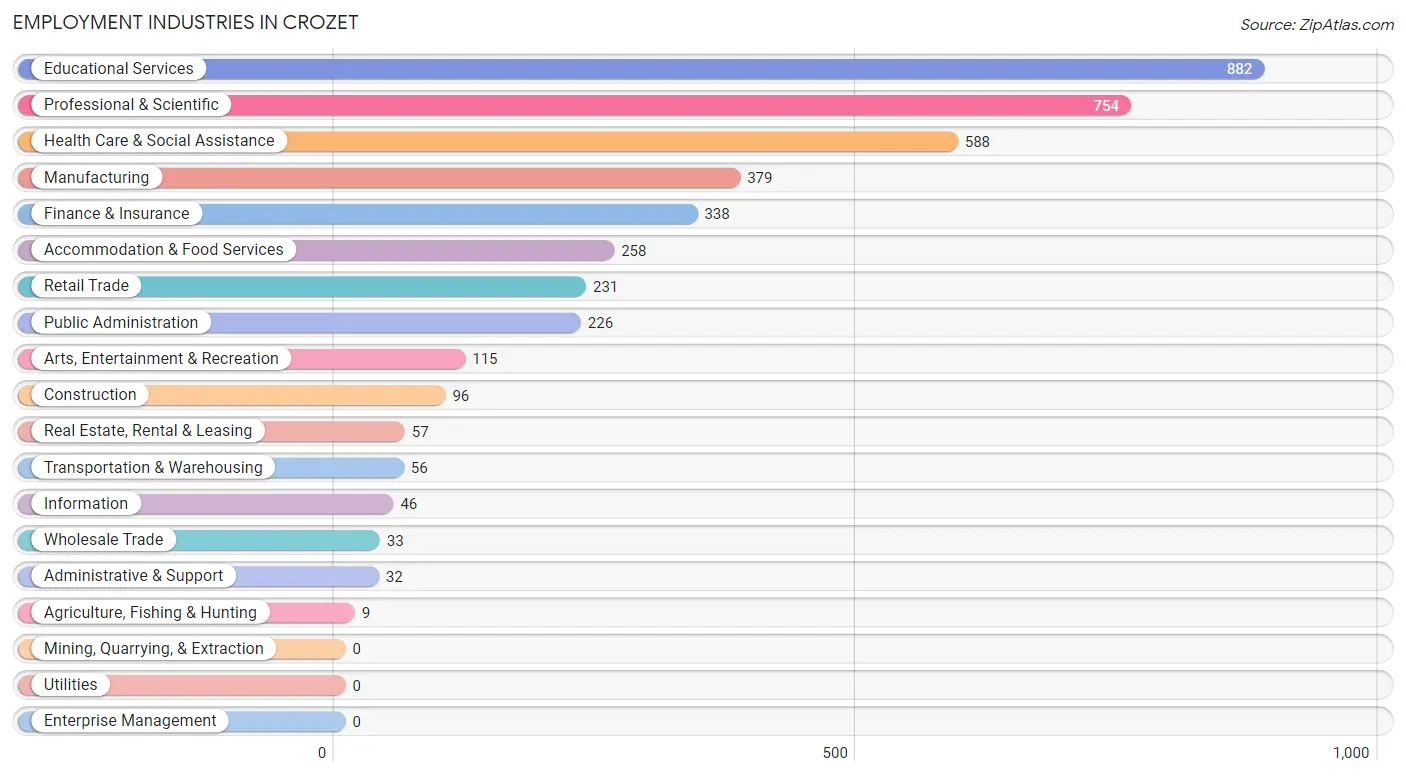
Employment Industries in Crozet
The major employment industries in Crozet include Educational Services (882 | 20.0%), Professional & Scientific (754 | 17.1%), Health Care & Social Assistance (588 | 13.3%), Manufacturing (379 | 8.6%), and Finance & Insurance (338 | 7.6%).
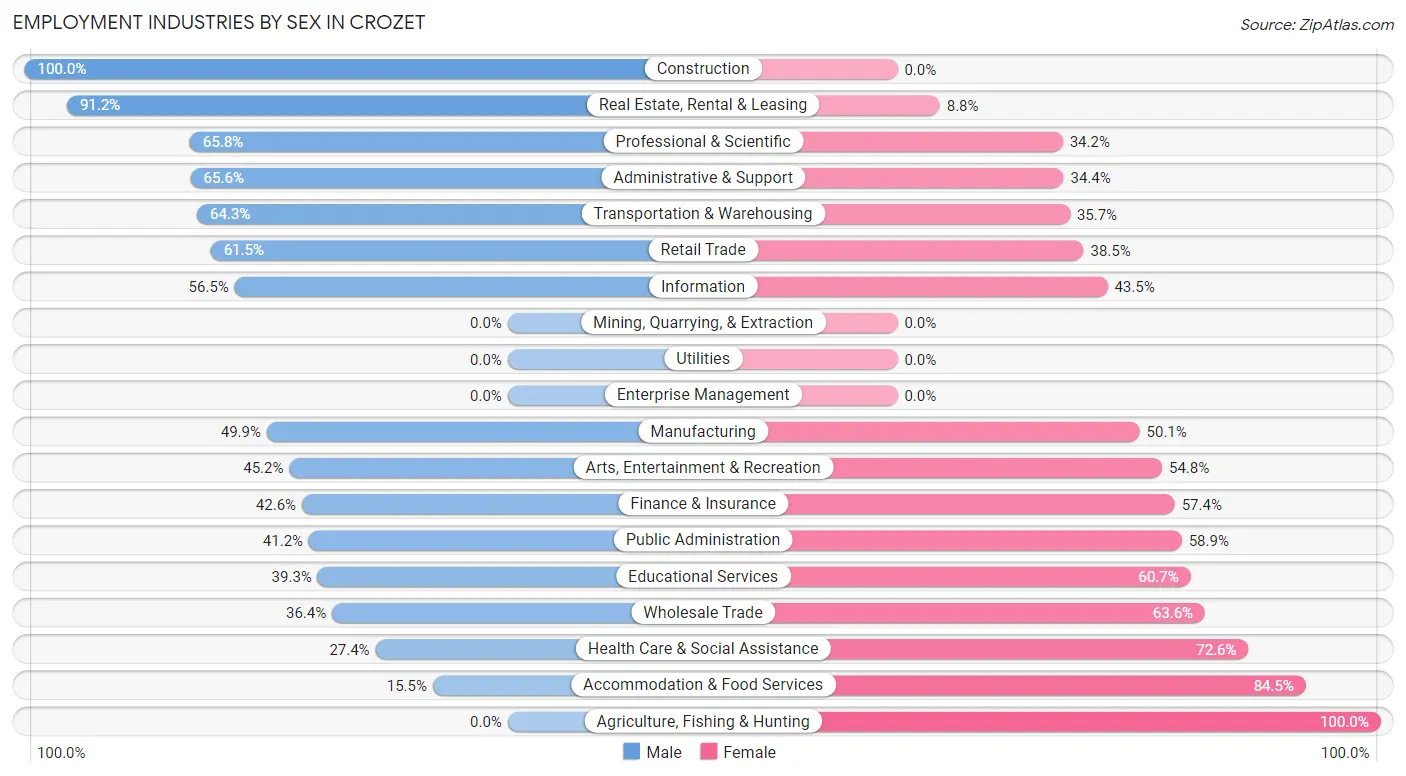
Employment Industries by Sex in Crozet
The Crozet industries that see more men than women are Construction (100.0%), Real Estate, Rental & Leasing (91.2%), and Professional & Scientific (65.8%), whereas the industries that tend to have a higher number of women are Agriculture, Fishing & Hunting (100.0%), Accommodation & Food Services (84.5%), and Health Care & Social Assistance (72.6%).
| Industry | Male | Female |
| Agriculture, Fishing & Hunting | 0 (0.0%) | 9 (100.0%) |
| Mining, Quarrying, & Extraction | 0 (0.0%) | 0 (0.0%) |
| Construction | 96 (100.0%) | 0 (0.0%) |
| Manufacturing | 189 (49.9%) | 190 (50.1%) |
| Wholesale Trade | 12 (36.4%) | 21 (63.6%) |
| Retail Trade | 142 (61.5%) | 89 (38.5%) |
| Transportation & Warehousing | 36 (64.3%) | 20 (35.7%) |
| Utilities | 0 (0.0%) | 0 (0.0%) |
| Information | 26 (56.5%) | 20 (43.5%) |
| Finance & Insurance | 144 (42.6%) | 194 (57.4%) |
| Real Estate, Rental & Leasing | 52 (91.2%) | 5 (8.8%) |
| Professional & Scientific | 496 (65.8%) | 258 (34.2%) |
| Enterprise Management | 0 (0.0%) | 0 (0.0%) |
| Administrative & Support | 21 (65.6%) | 11 (34.4%) |
| Educational Services | 347 (39.3%) | 535 (60.7%) |
| Health Care & Social Assistance | 161 (27.4%) | 427 (72.6%) |
| Arts, Entertainment & Recreation | 52 (45.2%) | 63 (54.8%) |
| Accommodation & Food Services | 40 (15.5%) | 218 (84.5%) |
| Public Administration | 93 (41.1%) | 133 (58.9%) |
| Total | 2,064 (46.7%) | 2,355 (53.3%) |
Education in Crozet
School Enrollment in Crozet
The most common levels of schooling among the 2,474 students in Crozet are high school (685 | 27.7%), middle school (596 | 24.1%), and elementary school (290 | 11.7%).
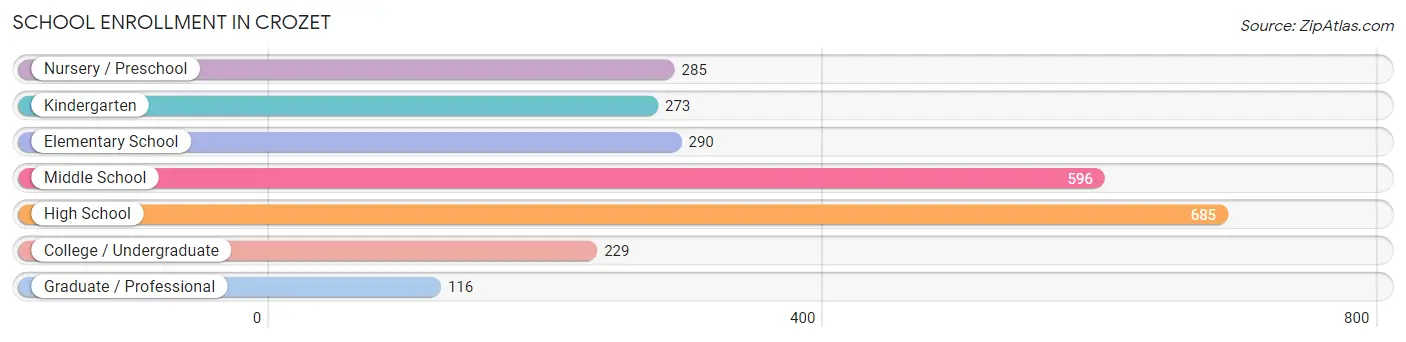
| School Level | # Students | % Students |
| Nursery / Preschool | 285 | 11.5% |
| Kindergarten | 273 | 11.0% |
| Elementary School | 290 | 11.7% |
| Middle School | 596 | 24.1% |
| High School | 685 | 27.7% |
| College / Undergraduate | 229 | 9.3% |
| Graduate / Professional | 116 | 4.7% |
| Total | 2,474 | 100.0% |
School Enrollment by Age by Funding Source in Crozet
Out of a total of 2,474 students who are enrolled in schools in Crozet, 490 (19.8%) attend a private institution, while the remaining 1,984 (80.2%) are enrolled in public schools. The age group of 3 to 4 year olds has the highest likelihood of being enrolled in private schools, with 195 (81.9% in the age bracket) enrolled. Conversely, the age group of 18 to 19 year olds has the lowest likelihood of being enrolled in a private school, with 167 (100.0% in the age bracket) attending a public institution.
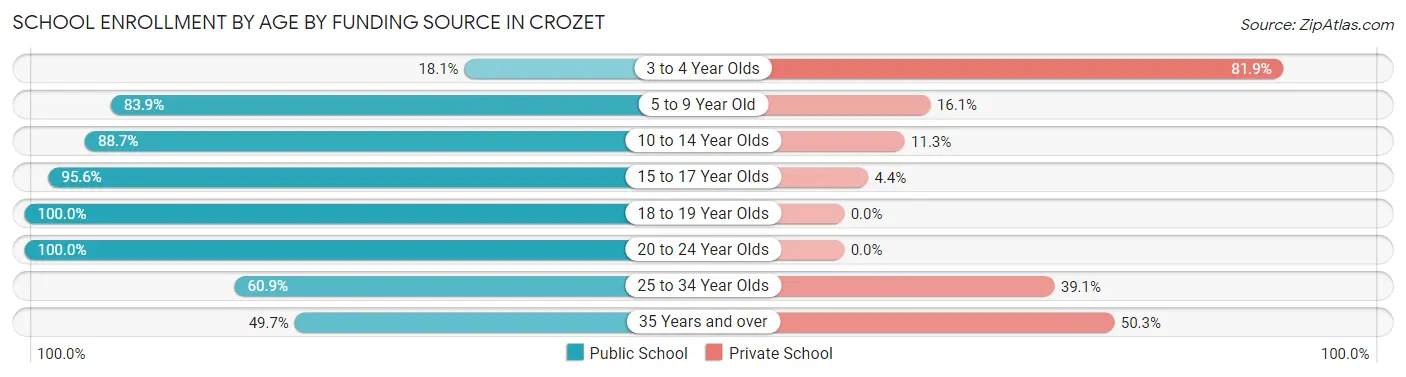
| Age Bracket | Public School | Private School |
| 3 to 4 Year Olds | 43 (18.1%) | 195 (81.9%) |
| 5 to 9 Year Old | 512 (83.9%) | 98 (16.1%) |
| 10 to 14 Year Olds | 599 (88.7%) | 76 (11.3%) |
| 15 to 17 Year Olds | 495 (95.6%) | 23 (4.4%) |
| 18 to 19 Year Olds | 167 (100.0%) | 0 (0.0%) |
| 20 to 24 Year Olds | 59 (100.0%) | 0 (0.0%) |
| 25 to 34 Year Olds | 28 (60.9%) | 18 (39.1%) |
| 35 Years and over | 80 (49.7%) | 81 (50.3%) |
| Total | 1,984 (80.2%) | 490 (19.8%) |
Educational Attainment by Field of Study in Crozet
Business (795 | 17.2%), science & technology (478 | 10.3%), bio, nature & agricultural (445 | 9.6%), social sciences (428 | 9.2%), and psychology (410 | 8.8%) are the most common fields of study among 4,635 individuals in Crozet who have obtained a bachelor's degree or higher.
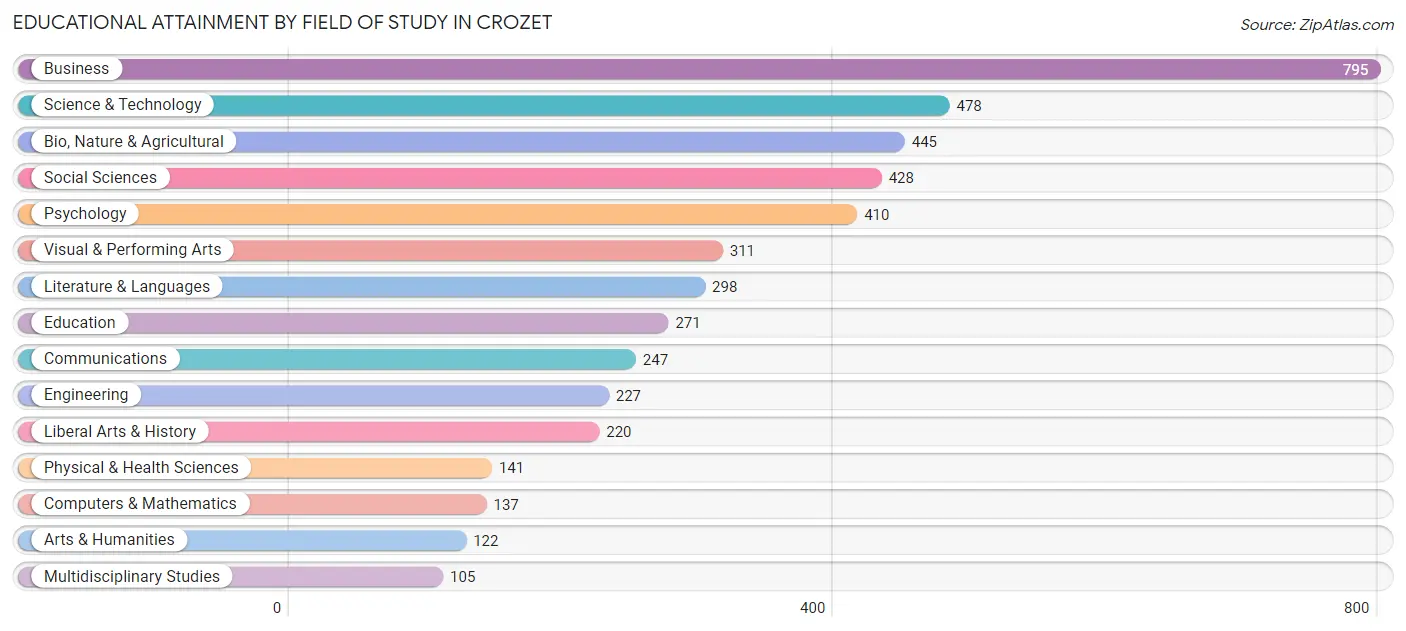
| Field of Study | # Graduates | % Graduates |
| Computers & Mathematics | 137 | 3.0% |
| Bio, Nature & Agricultural | 445 | 9.6% |
| Physical & Health Sciences | 141 | 3.0% |
| Psychology | 410 | 8.8% |
| Social Sciences | 428 | 9.2% |
| Engineering | 227 | 4.9% |
| Multidisciplinary Studies | 105 | 2.3% |
| Science & Technology | 478 | 10.3% |
| Business | 795 | 17.2% |
| Education | 271 | 5.9% |
| Literature & Languages | 298 | 6.4% |
| Liberal Arts & History | 220 | 4.8% |
| Visual & Performing Arts | 311 | 6.7% |
| Communications | 247 | 5.3% |
| Arts & Humanities | 122 | 2.6% |
| Total | 4,635 | 100.0% |
Transportation & Commute in Crozet
Vehicle Availability by Sex in Crozet
The most prevalent vehicle ownership categories in Crozet are males with 2 vehicles (1,216, accounting for 59.1%) and females with 2 vehicles (1,207, making up 52.2%).
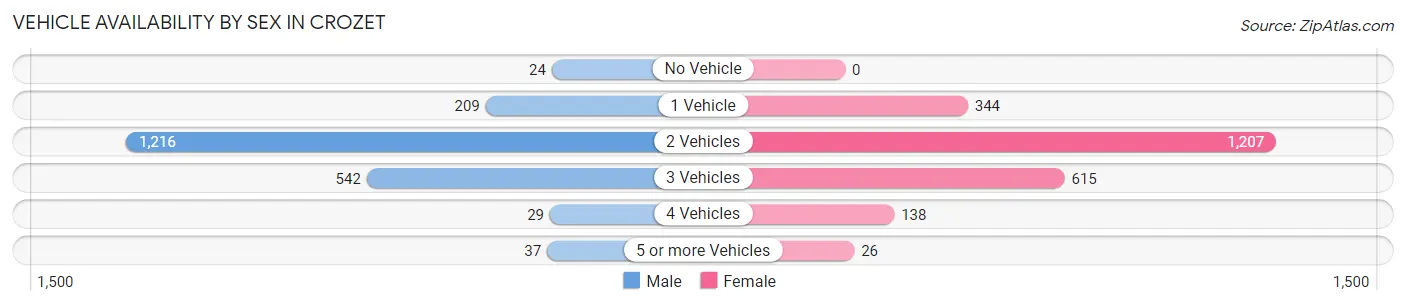
| Vehicles Available | Male | Female |
| No Vehicle | 24 (1.2%) | 0 (0.0%) |
| 1 Vehicle | 209 (10.2%) | 344 (14.8%) |
| 2 Vehicles | 1,216 (59.1%) | 1,207 (51.8%) |
| 3 Vehicles | 542 (26.4%) | 615 (26.4%) |
| 4 Vehicles | 29 (1.4%) | 138 (5.9%) |
| 5 or more Vehicles | 37 (1.8%) | 26 (1.1%) |
| Total | 2,057 (100.0%) | 2,330 (100.0%) |
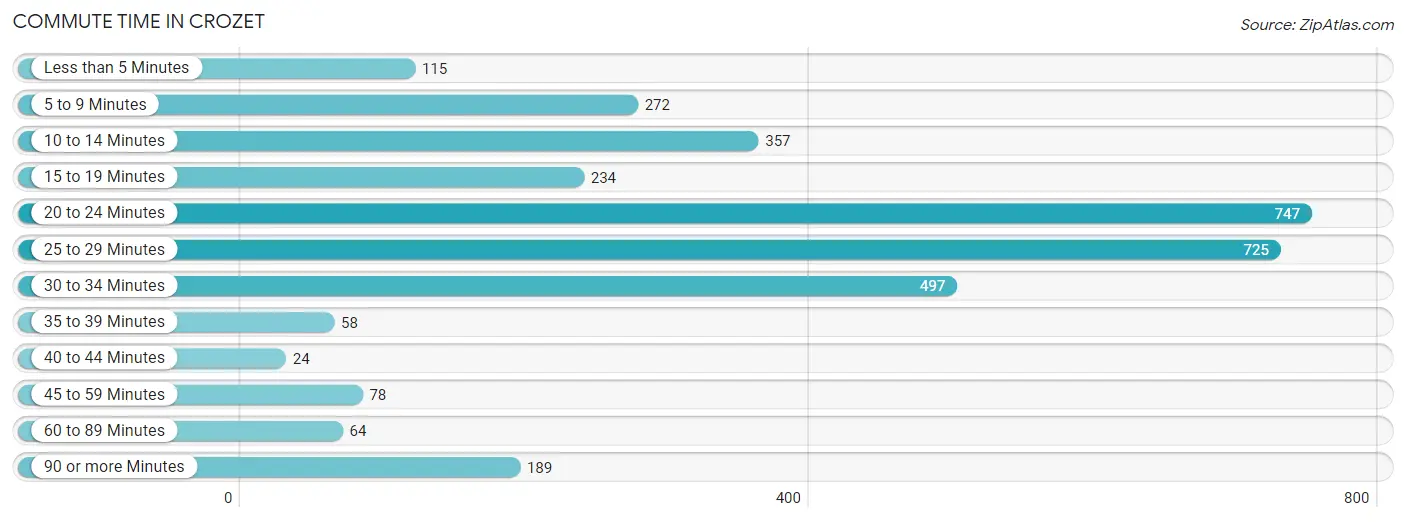
Commute Time in Crozet
The most frequently occuring commute durations in Crozet are 20 to 24 minutes (747 commuters, 22.2%), 25 to 29 minutes (725 commuters, 21.6%), and 30 to 34 minutes (497 commuters, 14.8%).
| Commute Time | # Commuters | % Commuters |
| Less than 5 Minutes | 115 | 3.4% |
| 5 to 9 Minutes | 272 | 8.1% |
| 10 to 14 Minutes | 357 | 10.6% |
| 15 to 19 Minutes | 234 | 7.0% |
| 20 to 24 Minutes | 747 | 22.2% |
| 25 to 29 Minutes | 725 | 21.6% |
| 30 to 34 Minutes | 497 | 14.8% |
| 35 to 39 Minutes | 58 | 1.7% |
| 40 to 44 Minutes | 24 | 0.7% |
| 45 to 59 Minutes | 78 | 2.3% |
| 60 to 89 Minutes | 64 | 1.9% |
| 90 or more Minutes | 189 | 5.6% |
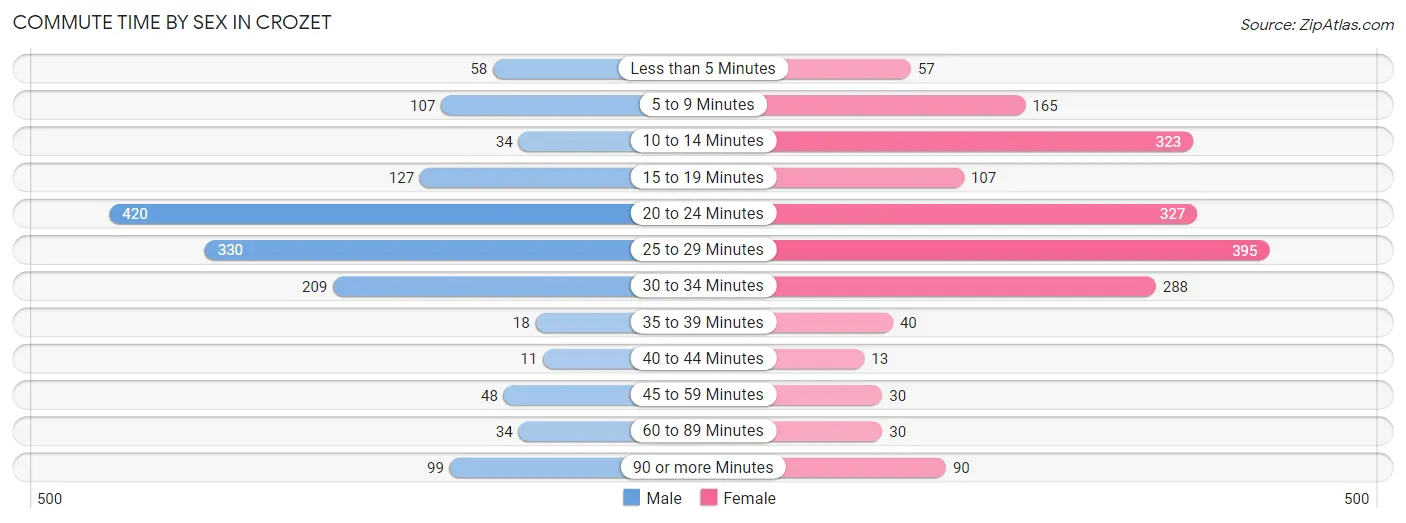
Commute Time by Sex in Crozet
The most common commute times in Crozet are 20 to 24 minutes (420 commuters, 28.1%) for males and 25 to 29 minutes (395 commuters, 21.2%) for females.
| Commute Time | Male | Female |
| Less than 5 Minutes | 58 (3.9%) | 57 (3.1%) |
| 5 to 9 Minutes | 107 (7.2%) | 165 (8.8%) |
| 10 to 14 Minutes | 34 (2.3%) | 323 (17.3%) |
| 15 to 19 Minutes | 127 (8.5%) | 107 (5.7%) |
| 20 to 24 Minutes | 420 (28.1%) | 327 (17.5%) |
| 25 to 29 Minutes | 330 (22.1%) | 395 (21.2%) |
| 30 to 34 Minutes | 209 (14.0%) | 288 (15.4%) |
| 35 to 39 Minutes | 18 (1.2%) | 40 (2.1%) |
| 40 to 44 Minutes | 11 (0.7%) | 13 (0.7%) |
| 45 to 59 Minutes | 48 (3.2%) | 30 (1.6%) |
| 60 to 89 Minutes | 34 (2.3%) | 30 (1.6%) |
| 90 or more Minutes | 99 (6.6%) | 90 (4.8%) |
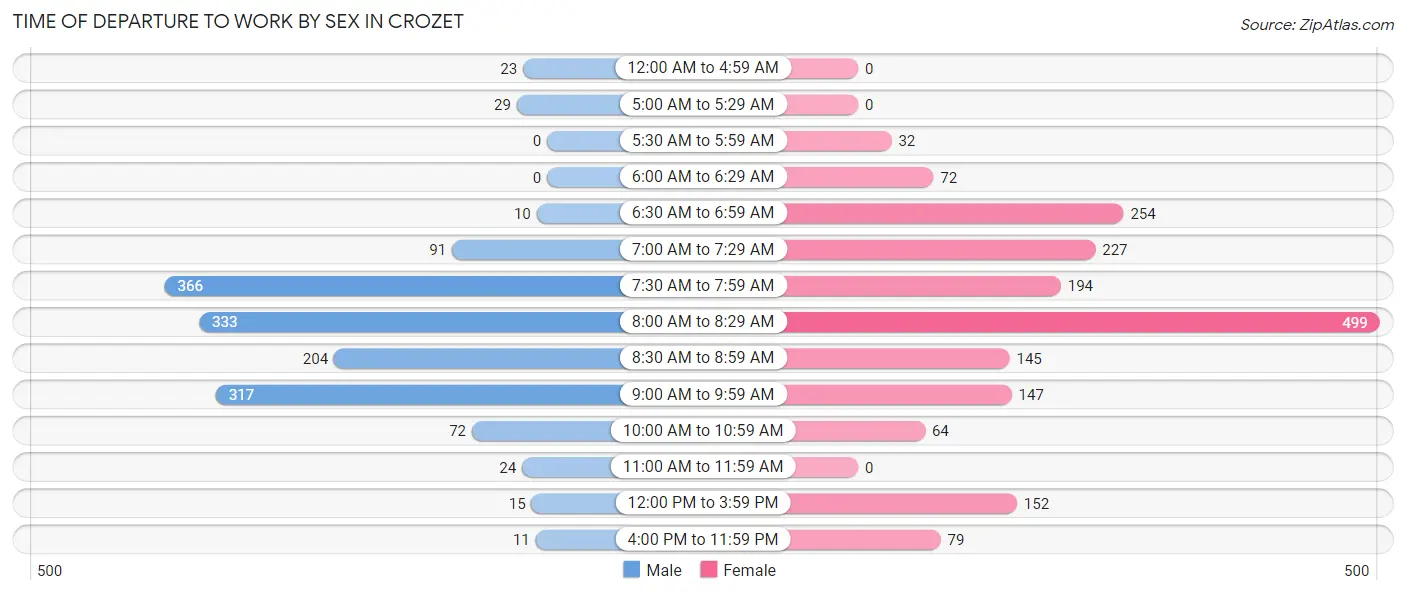
Time of Departure to Work by Sex in Crozet
The most frequent times of departure to work in Crozet are 7:30 AM to 7:59 AM (366, 24.5%) for males and 8:00 AM to 8:29 AM (499, 26.8%) for females.
| Time of Departure | Male | Female |
| 12:00 AM to 4:59 AM | 23 (1.5%) | 0 (0.0%) |
| 5:00 AM to 5:29 AM | 29 (1.9%) | 0 (0.0%) |
| 5:30 AM to 5:59 AM | 0 (0.0%) | 32 (1.7%) |
| 6:00 AM to 6:29 AM | 0 (0.0%) | 72 (3.9%) |
| 6:30 AM to 6:59 AM | 10 (0.7%) | 254 (13.6%) |
| 7:00 AM to 7:29 AM | 91 (6.1%) | 227 (12.2%) |
| 7:30 AM to 7:59 AM | 366 (24.5%) | 194 (10.4%) |
| 8:00 AM to 8:29 AM | 333 (22.3%) | 499 (26.8%) |
| 8:30 AM to 8:59 AM | 204 (13.7%) | 145 (7.8%) |
| 9:00 AM to 9:59 AM | 317 (21.2%) | 147 (7.9%) |
| 10:00 AM to 10:59 AM | 72 (4.8%) | 64 (3.4%) |
| 11:00 AM to 11:59 AM | 24 (1.6%) | 0 (0.0%) |
| 12:00 PM to 3:59 PM | 15 (1.0%) | 152 (8.2%) |
| 4:00 PM to 11:59 PM | 11 (0.7%) | 79 (4.2%) |
| Total | 1,495 (100.0%) | 1,865 (100.0%) |
Housing Occupancy in Crozet
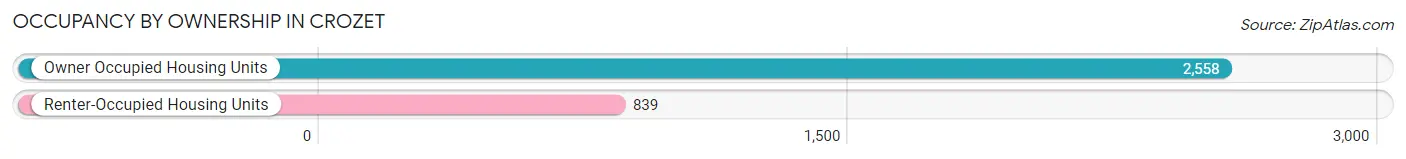
Occupancy by Ownership in Crozet
Of the total 3,397 dwellings in Crozet, owner-occupied units account for 2,558 (75.3%), while renter-occupied units make up 839 (24.7%).
| Occupancy | # Housing Units | % Housing Units |
| Owner Occupied Housing Units | 2,558 | 75.3% |
| Renter-Occupied Housing Units | 839 | 24.7% |
| Total Occupied Housing Units | 3,397 | 100.0% |
Occupancy by Household Size in Crozet
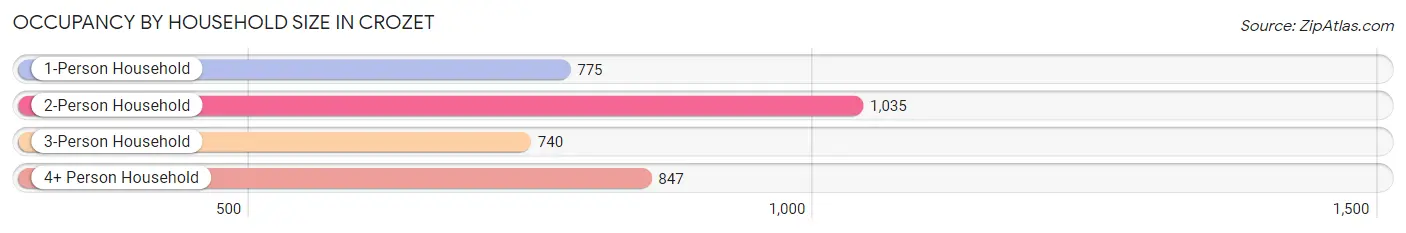
| Household Size | # Housing Units | % Housing Units |
| 1-Person Household | 775 | 22.8% |
| 2-Person Household | 1,035 | 30.5% |
| 3-Person Household | 740 | 21.8% |
| 4+ Person Household | 847 | 24.9% |
| Total Housing Units | 3,397 | 100.0% |
Occupancy by Ownership by Household Size in Crozet
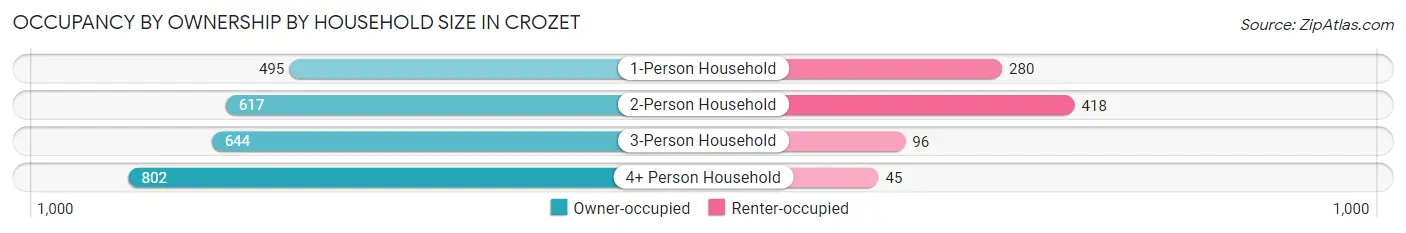
| Household Size | Owner-occupied | Renter-occupied |
| 1-Person Household | 495 (63.9%) | 280 (36.1%) |
| 2-Person Household | 617 (59.6%) | 418 (40.4%) |
| 3-Person Household | 644 (87.0%) | 96 (13.0%) |
| 4+ Person Household | 802 (94.7%) | 45 (5.3%) |
| Total Housing Units | 2,558 (75.3%) | 839 (24.7%) |
Occupancy by Educational Attainment in Crozet
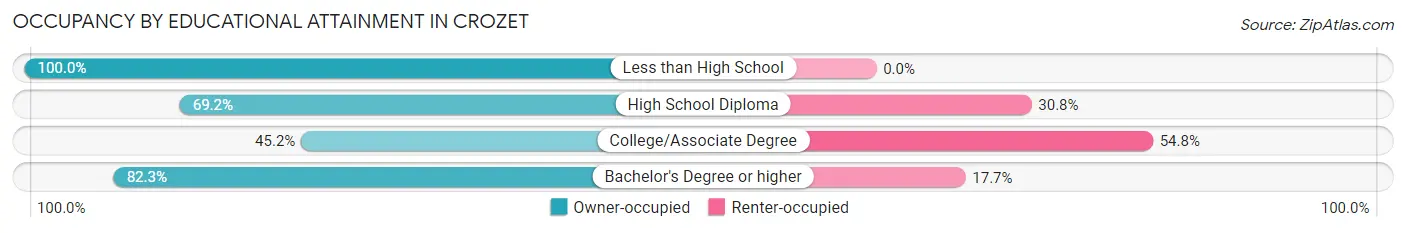
| Household Size | Owner-occupied | Renter-occupied |
| Less than High School | 43 (100.0%) | 0 (0.0%) |
| High School Diploma | 162 (69.2%) | 72 (30.8%) |
| College/Associate Degree | 262 (45.2%) | 318 (54.8%) |
| Bachelor's Degree or higher | 2,091 (82.3%) | 449 (17.7%) |
Occupancy by Age of Householder in Crozet
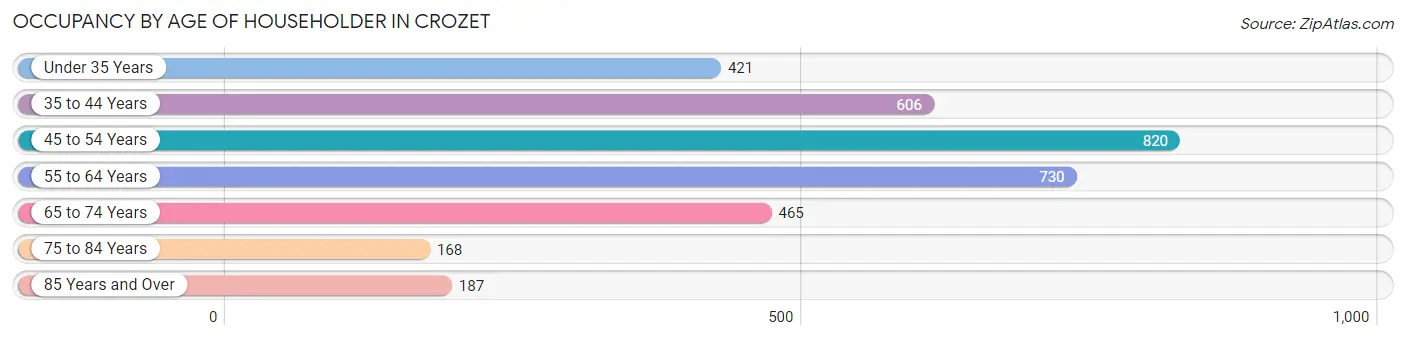
| Age Bracket | # Households | % Households |
| Under 35 Years | 421 | 12.4% |
| 35 to 44 Years | 606 | 17.8% |
| 45 to 54 Years | 820 | 24.1% |
| 55 to 64 Years | 730 | 21.5% |
| 65 to 74 Years | 465 | 13.7% |
| 75 to 84 Years | 168 | 5.0% |
| 85 Years and Over | 187 | 5.5% |
| Total | 3,397 | 100.0% |
Housing Finances in Crozet
Median Income by Occupancy in Crozet
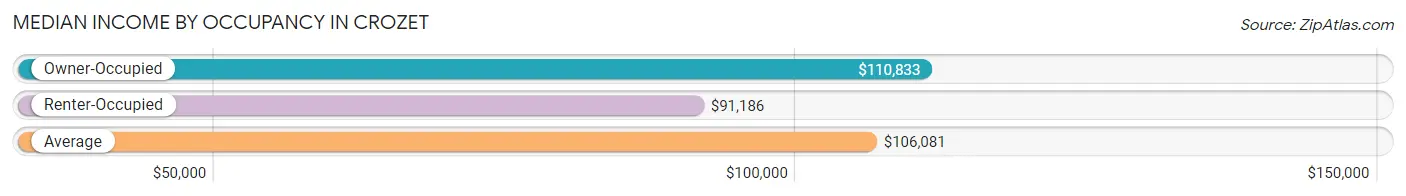
| Occupancy Type | # Households | Median Income |
| Owner-Occupied | 2,558 (75.3%) | $110,833 |
| Renter-Occupied | 839 (24.7%) | $91,186 |
| Average | 3,397 (100.0%) | $106,081 |
Occupancy by Householder Income Bracket in Crozet
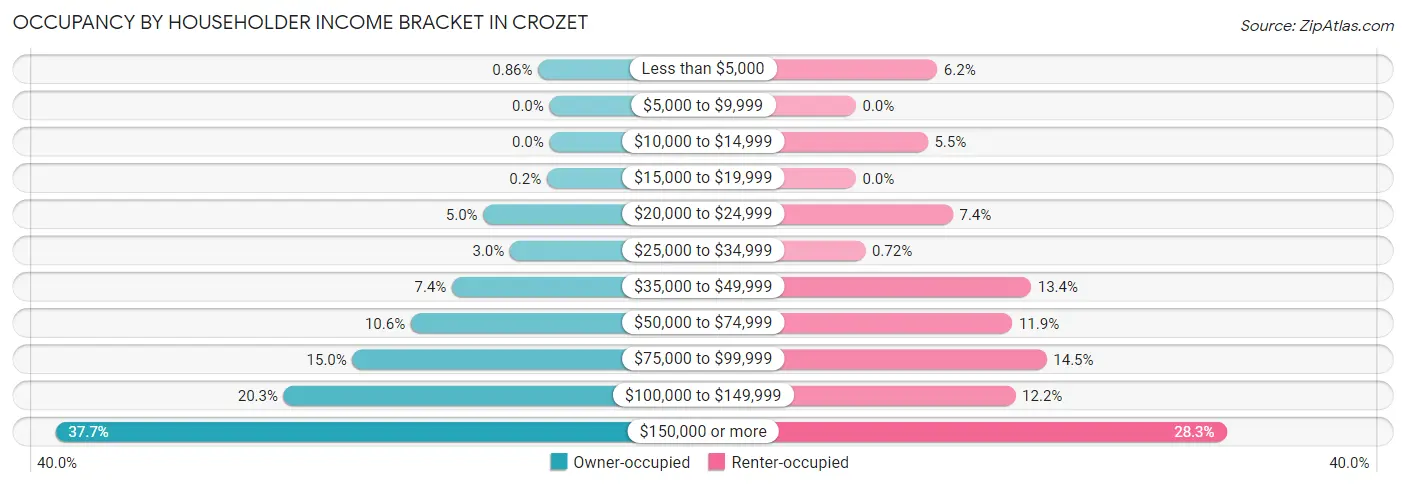
| Income Bracket | Owner-occupied | Renter-occupied |
| Less than $5,000 | 22 (0.9%) | 52 (6.2%) |
| $5,000 to $9,999 | 0 (0.0%) | 0 (0.0%) |
| $10,000 to $14,999 | 0 (0.0%) | 46 (5.5%) |
| $15,000 to $19,999 | 5 (0.2%) | 0 (0.0%) |
| $20,000 to $24,999 | 129 (5.0%) | 62 (7.4%) |
| $25,000 to $34,999 | 77 (3.0%) | 6 (0.7%) |
| $35,000 to $49,999 | 190 (7.4%) | 112 (13.4%) |
| $50,000 to $74,999 | 270 (10.6%) | 100 (11.9%) |
| $75,000 to $99,999 | 384 (15.0%) | 122 (14.5%) |
| $100,000 to $149,999 | 518 (20.3%) | 102 (12.2%) |
| $150,000 or more | 963 (37.7%) | 237 (28.2%) |
| Total | 2,558 (100.0%) | 839 (100.0%) |
Monthly Housing Cost Tiers in Crozet
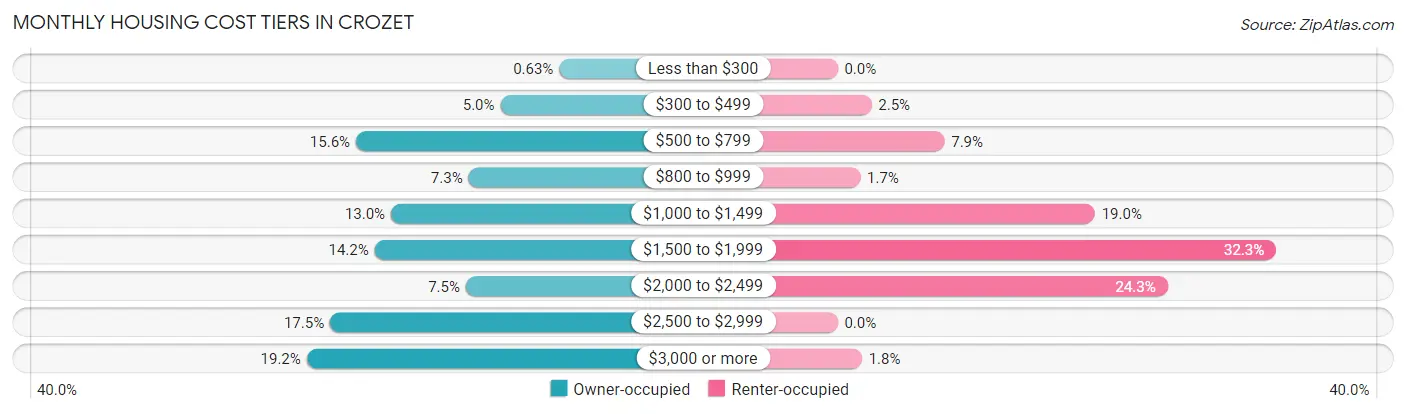
| Monthly Cost | Owner-occupied | Renter-occupied |
| Less than $300 | 16 (0.6%) | 0 (0.0%) |
| $300 to $499 | 127 (5.0%) | 21 (2.5%) |
| $500 to $799 | 399 (15.6%) | 66 (7.9%) |
| $800 to $999 | 187 (7.3%) | 14 (1.7%) |
| $1,000 to $1,499 | 333 (13.0%) | 159 (19.0%) |
| $1,500 to $1,999 | 364 (14.2%) | 271 (32.3%) |
| $2,000 to $2,499 | 192 (7.5%) | 204 (24.3%) |
| $2,500 to $2,999 | 448 (17.5%) | 0 (0.0%) |
| $3,000 or more | 492 (19.2%) | 15 (1.8%) |
| Total | 2,558 (100.0%) | 839 (100.0%) |
Physical Housing Characteristics in Crozet
Housing Structures in Crozet
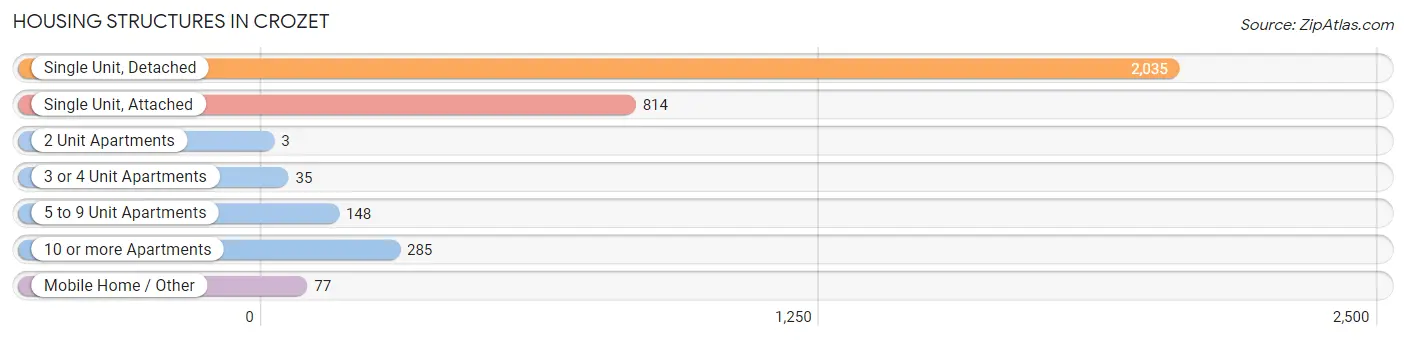
| Structure Type | # Housing Units | % Housing Units |
| Single Unit, Detached | 2,035 | 59.9% |
| Single Unit, Attached | 814 | 24.0% |
| 2 Unit Apartments | 3 | 0.1% |
| 3 or 4 Unit Apartments | 35 | 1.0% |
| 5 to 9 Unit Apartments | 148 | 4.4% |
| 10 or more Apartments | 285 | 8.4% |
| Mobile Home / Other | 77 | 2.3% |
| Total | 3,397 | 100.0% |
Housing Structures by Occupancy in Crozet
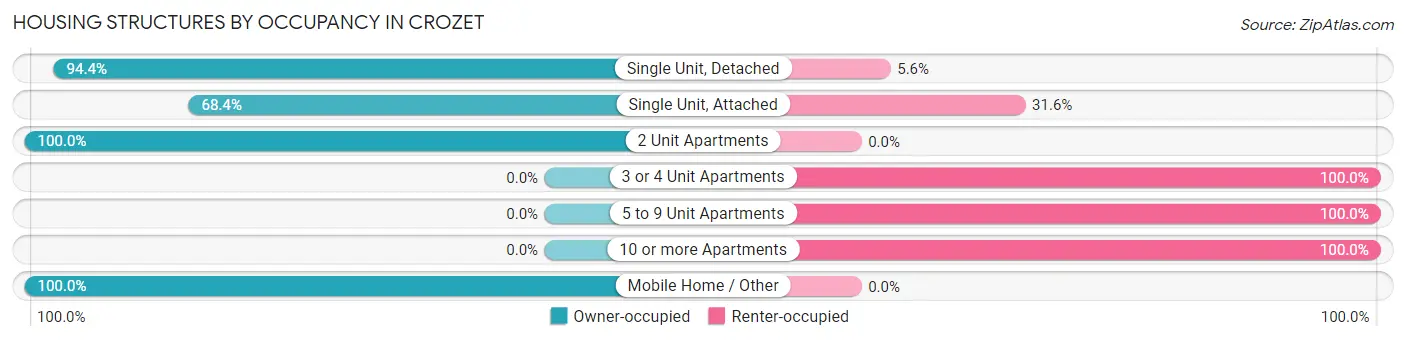
| Structure Type | Owner-occupied | Renter-occupied |
| Single Unit, Detached | 1,921 (94.4%) | 114 (5.6%) |
| Single Unit, Attached | 557 (68.4%) | 257 (31.6%) |
| 2 Unit Apartments | 3 (100.0%) | 0 (0.0%) |
| 3 or 4 Unit Apartments | 0 (0.0%) | 35 (100.0%) |
| 5 to 9 Unit Apartments | 0 (0.0%) | 148 (100.0%) |
| 10 or more Apartments | 0 (0.0%) | 285 (100.0%) |
| Mobile Home / Other | 77 (100.0%) | 0 (0.0%) |
| Total | 2,558 (75.3%) | 839 (24.7%) |
Housing Structures by Number of Rooms in Crozet
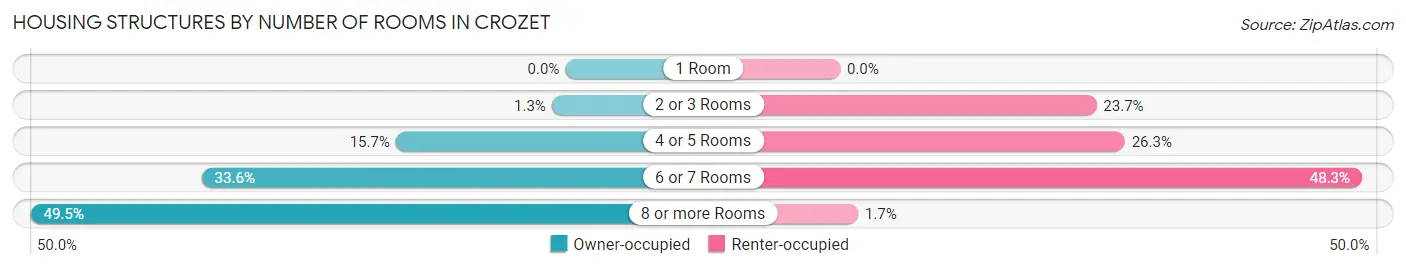
| Number of Rooms | Owner-occupied | Renter-occupied |
| 1 Room | 0 (0.0%) | 0 (0.0%) |
| 2 or 3 Rooms | 32 (1.3%) | 199 (23.7%) |
| 4 or 5 Rooms | 401 (15.7%) | 221 (26.3%) |
| 6 or 7 Rooms | 860 (33.6%) | 405 (48.3%) |
| 8 or more Rooms | 1,265 (49.4%) | 14 (1.7%) |
| Total | 2,558 (100.0%) | 839 (100.0%) |
Housing Structure by Heating Type in Crozet
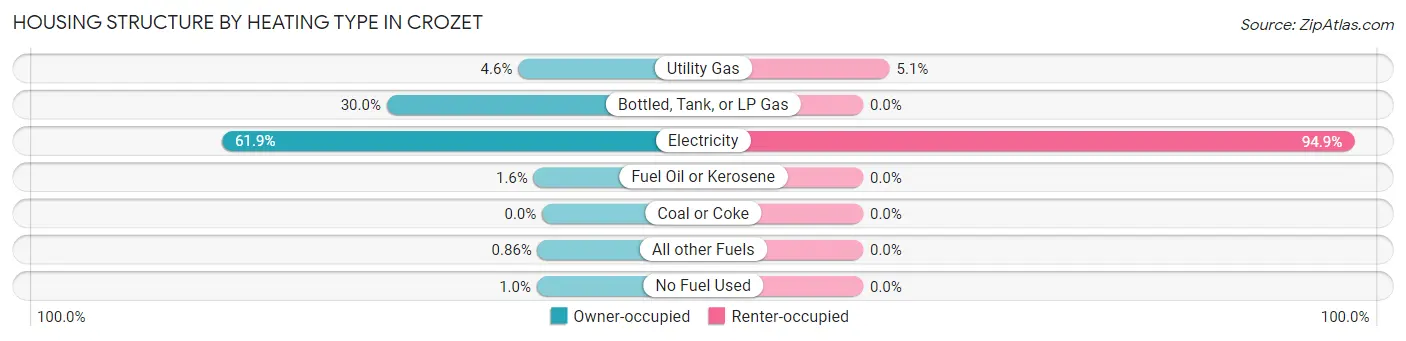
| Heating Type | Owner-occupied | Renter-occupied |
| Utility Gas | 118 (4.6%) | 43 (5.1%) |
| Bottled, Tank, or LP Gas | 768 (30.0%) | 0 (0.0%) |
| Electricity | 1,582 (61.9%) | 796 (94.9%) |
| Fuel Oil or Kerosene | 42 (1.6%) | 0 (0.0%) |
| Coal or Coke | 0 (0.0%) | 0 (0.0%) |
| All other Fuels | 22 (0.9%) | 0 (0.0%) |
| No Fuel Used | 26 (1.0%) | 0 (0.0%) |
| Total | 2,558 (100.0%) | 839 (100.0%) |
Household Vehicle Usage in Crozet
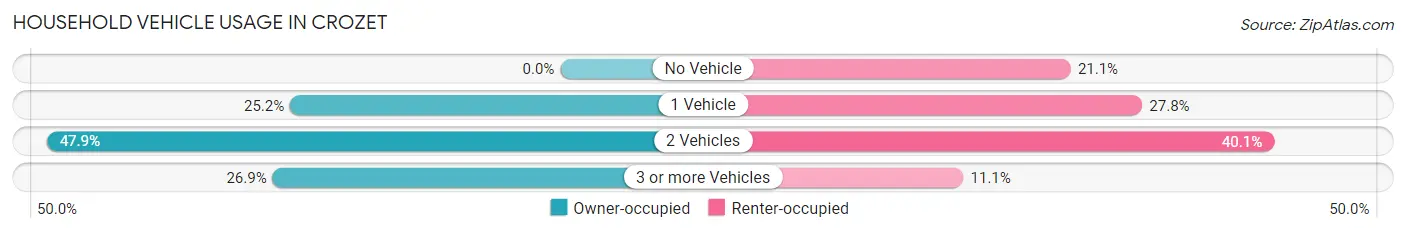
| Vehicles per Household | Owner-occupied | Renter-occupied |
| No Vehicle | 0 (0.0%) | 177 (21.1%) |
| 1 Vehicle | 645 (25.2%) | 233 (27.8%) |
| 2 Vehicles | 1,226 (47.9%) | 336 (40.1%) |
| 3 or more Vehicles | 687 (26.9%) | 93 (11.1%) |
| Total | 2,558 (100.0%) | 839 (100.0%) |
Real Estate & Mortgages in Crozet
Real Estate and Mortgage Overview in Crozet
| Characteristic | Without Mortgage | With Mortgage |
| Housing Units | 684 | 1,874 |
| Median Property Value | $544,000 | $487,600 |
| Median Household Income | $68,409 | $869 |
| Monthly Housing Costs | $676 | $492 |
| Real Estate Taxes | $3,891 | $10 |
Property Value by Mortgage Status in Crozet
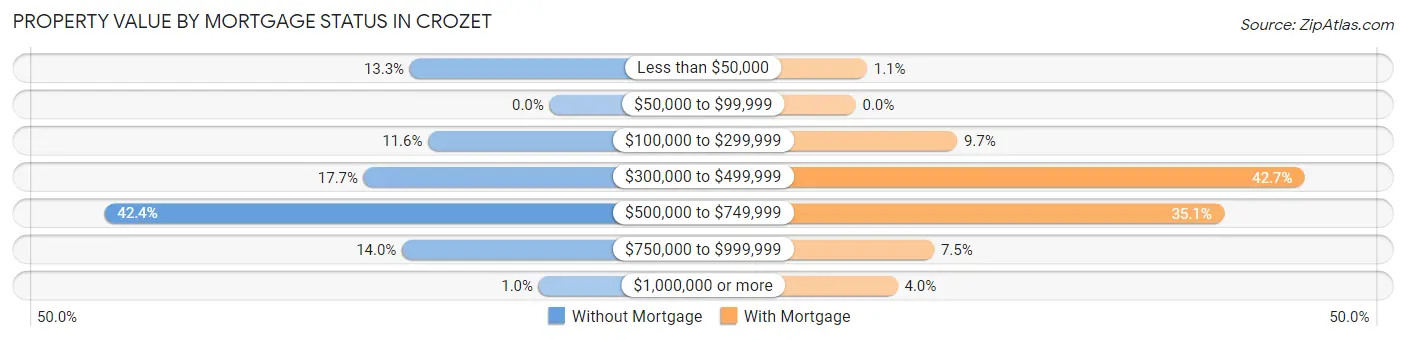
| Property Value | Without Mortgage | With Mortgage |
| Less than $50,000 | 91 (13.3%) | 20 (1.1%) |
| $50,000 to $99,999 | 0 (0.0%) | 0 (0.0%) |
| $100,000 to $299,999 | 79 (11.6%) | 181 (9.7%) |
| $300,000 to $499,999 | 121 (17.7%) | 801 (42.7%) |
| $500,000 to $749,999 | 290 (42.4%) | 657 (35.1%) |
| $750,000 to $999,999 | 96 (14.0%) | 140 (7.5%) |
| $1,000,000 or more | 7 (1.0%) | 75 (4.0%) |
| Total | 684 (100.0%) | 1,874 (100.0%) |
Household Income by Mortgage Status in Crozet
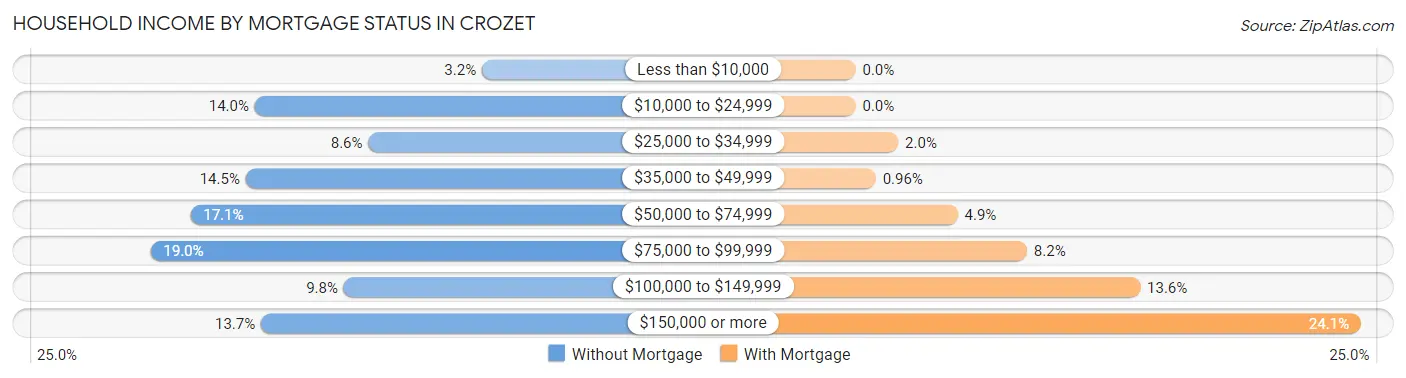
| Household Income | Without Mortgage | With Mortgage |
| Less than $10,000 | 22 (3.2%) | 0 (0.0%) |
| $10,000 to $24,999 | 96 (14.0%) | 0 (0.0%) |
| $25,000 to $34,999 | 59 (8.6%) | 38 (2.0%) |
| $35,000 to $49,999 | 99 (14.5%) | 18 (1.0%) |
| $50,000 to $74,999 | 117 (17.1%) | 91 (4.9%) |
| $75,000 to $99,999 | 130 (19.0%) | 153 (8.2%) |
| $100,000 to $149,999 | 67 (9.8%) | 254 (13.6%) |
| $150,000 or more | 94 (13.7%) | 451 (24.1%) |
| Total | 684 (100.0%) | 1,874 (100.0%) |
Property Value to Household Income Ratio in Crozet
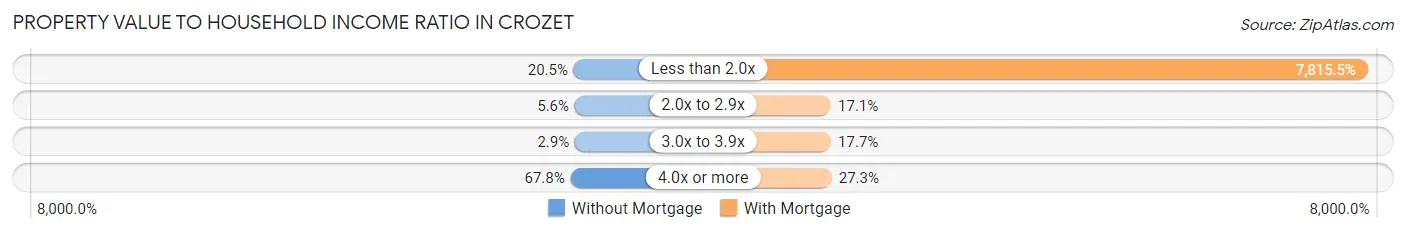
| Value-to-Income Ratio | Without Mortgage | With Mortgage |
| Less than 2.0x | 140 (20.5%) | 146,463 (7,815.5%) |
| 2.0x to 2.9x | 38 (5.6%) | 320 (17.1%) |
| 3.0x to 3.9x | 20 (2.9%) | 332 (17.7%) |
| 4.0x or more | 464 (67.8%) | 511 (27.3%) |
| Total | 684 (100.0%) | 1,874 (100.0%) |
Real Estate Taxes by Mortgage Status in Crozet
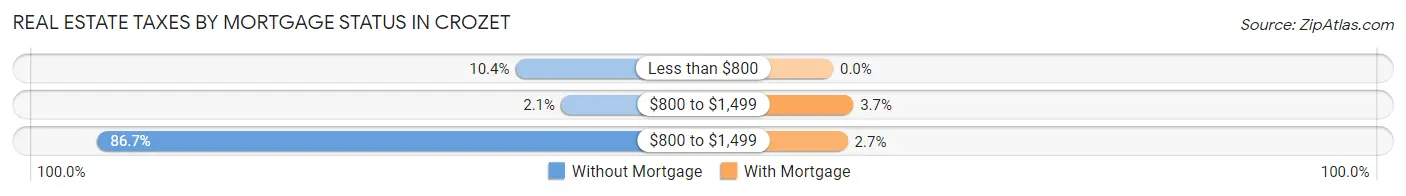
| Property Taxes | Without Mortgage | With Mortgage |
| Less than $800 | 71 (10.4%) | 0 (0.0%) |
| $800 to $1,499 | 14 (2.1%) | 69 (3.7%) |
| $800 to $1,499 | 593 (86.7%) | 50 (2.7%) |
| Total | 684 (100.0%) | 1,874 (100.0%) |
Health & Disability in Crozet
Health Insurance Coverage by Age in Crozet
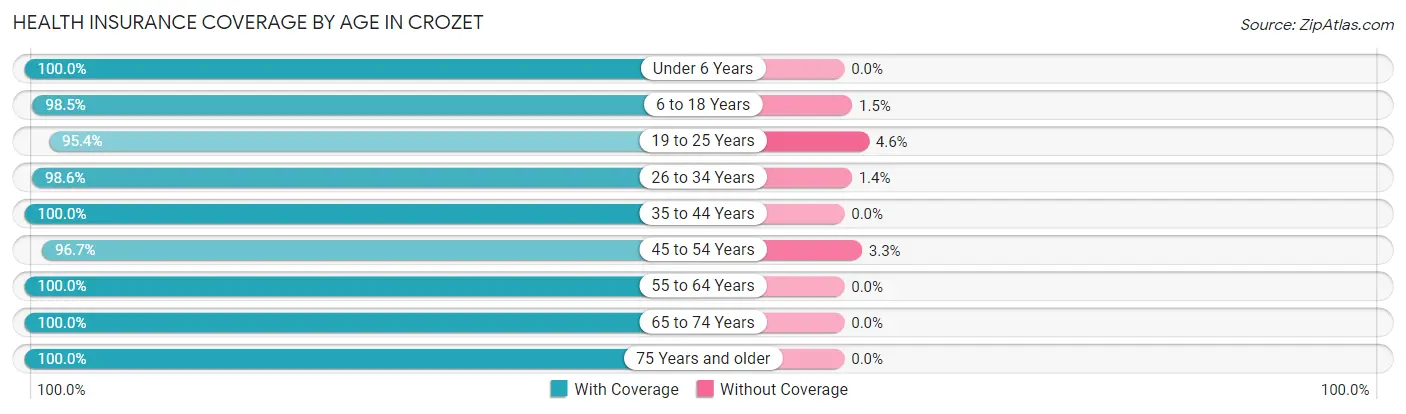
| Age Bracket | With Coverage | Without Coverage |
| Under 6 Years | 1,054 (100.0%) | 0 (0.0%) |
| 6 to 18 Years | 1,760 (98.5%) | 26 (1.5%) |
| 19 to 25 Years | 292 (95.4%) | 14 (4.6%) |
| 26 to 34 Years | 923 (98.6%) | 13 (1.4%) |
| 35 to 44 Years | 1,323 (100.0%) | 0 (0.0%) |
| 45 to 54 Years | 1,122 (96.7%) | 38 (3.3%) |
| 55 to 64 Years | 1,133 (100.0%) | 0 (0.0%) |
| 65 to 74 Years | 649 (100.0%) | 0 (0.0%) |
| 75 Years and older | 547 (100.0%) | 0 (0.0%) |
| Total | 8,803 (99.0%) | 91 (1.0%) |
Health Insurance Coverage by Citizenship Status in Crozet

| Citizenship Status | With Coverage | Without Coverage |
| Native Born | 1,054 (100.0%) | 0 (0.0%) |
| Foreign Born, Citizen | 1,760 (98.5%) | 26 (1.5%) |
| Foreign Born, not a Citizen | 292 (95.4%) | 14 (4.6%) |
Health Insurance Coverage by Household Income in Crozet
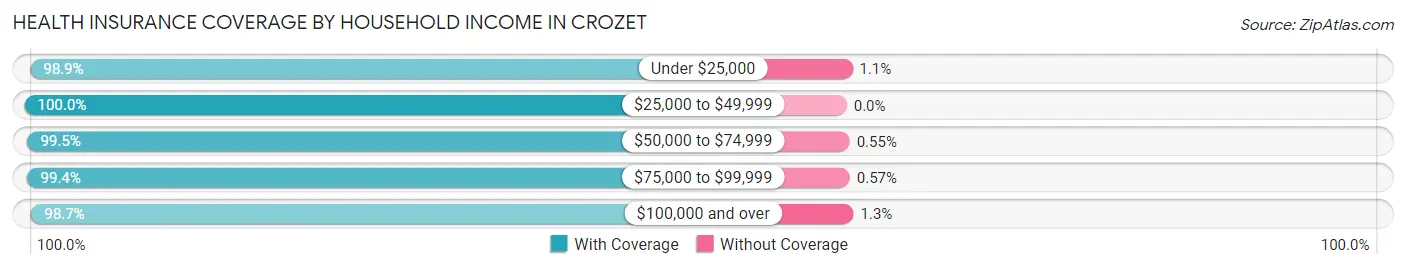
| Household Income | With Coverage | Without Coverage |
| Under $25,000 | 649 (98.9%) | 7 (1.1%) |
| $25,000 to $49,999 | 684 (100.0%) | 0 (0.0%) |
| $50,000 to $74,999 | 722 (99.5%) | 4 (0.5%) |
| $75,000 to $99,999 | 1,041 (99.4%) | 6 (0.6%) |
| $100,000 and over | 5,699 (98.7%) | 74 (1.3%) |
Public vs Private Health Insurance Coverage by Age in Crozet
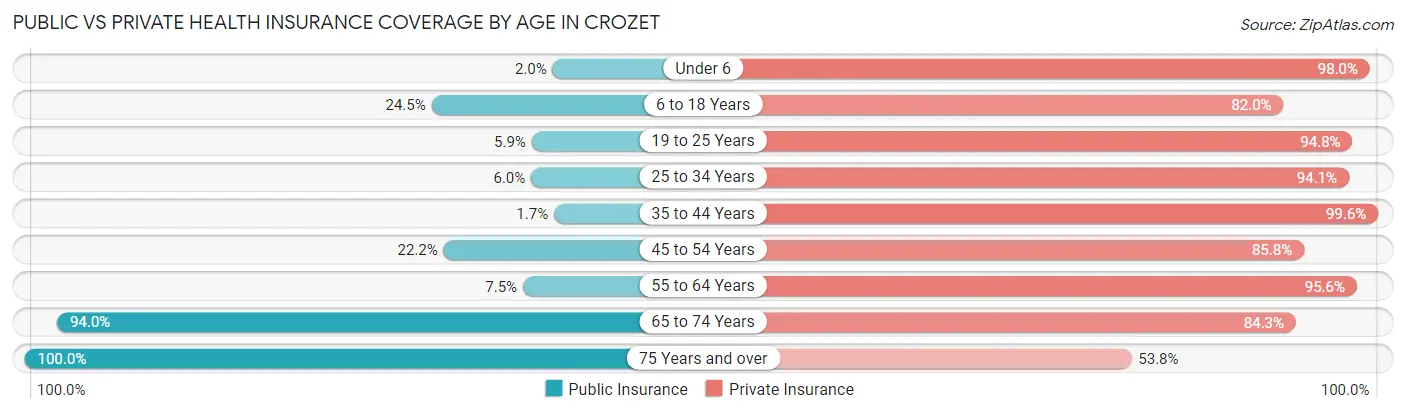
| Age Bracket | Public Insurance | Private Insurance |
| Under 6 | 21 (2.0%) | 1,033 (98.0%) |
| 6 to 18 Years | 437 (24.5%) | 1,464 (82.0%) |
| 19 to 25 Years | 18 (5.9%) | 290 (94.8%) |
| 25 to 34 Years | 56 (6.0%) | 881 (94.1%) |
| 35 to 44 Years | 23 (1.7%) | 1,317 (99.6%) |
| 45 to 54 Years | 258 (22.2%) | 995 (85.8%) |
| 55 to 64 Years | 85 (7.5%) | 1,083 (95.6%) |
| 65 to 74 Years | 610 (94.0%) | 547 (84.3%) |
| 75 Years and over | 547 (100.0%) | 294 (53.7%) |
| Total | 2,055 (23.1%) | 7,904 (88.9%) |
Disability Status by Sex by Age in Crozet
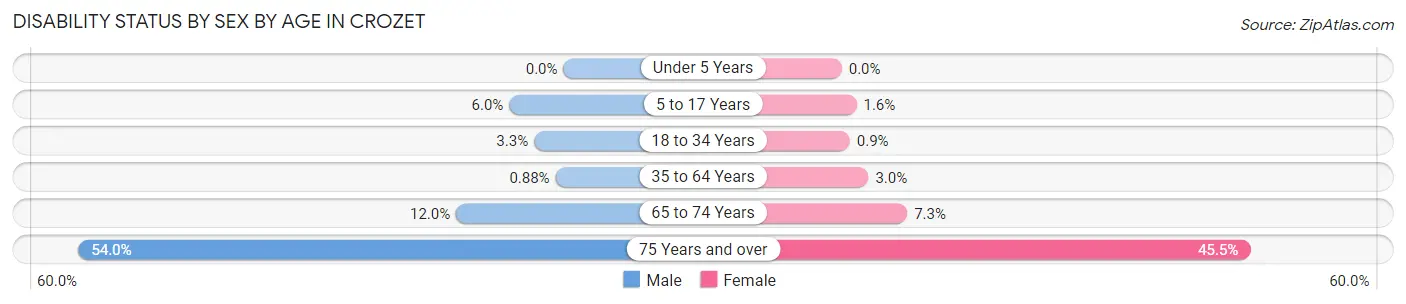
| Age Bracket | Male | Female |
| Under 5 Years | 0 (0.0%) | 0 (0.0%) |
| 5 to 17 Years | 55 (6.0%) | 15 (1.6%) |
| 18 to 34 Years | 16 (3.3%) | 9 (0.9%) |
| 35 to 64 Years | 15 (0.9%) | 57 (3.0%) |
| 65 to 74 Years | 30 (11.9%) | 29 (7.3%) |
| 75 Years and over | 128 (54.0%) | 141 (45.5%) |
Disability Class by Sex by Age in Crozet
Disability Class: Hearing Difficulty
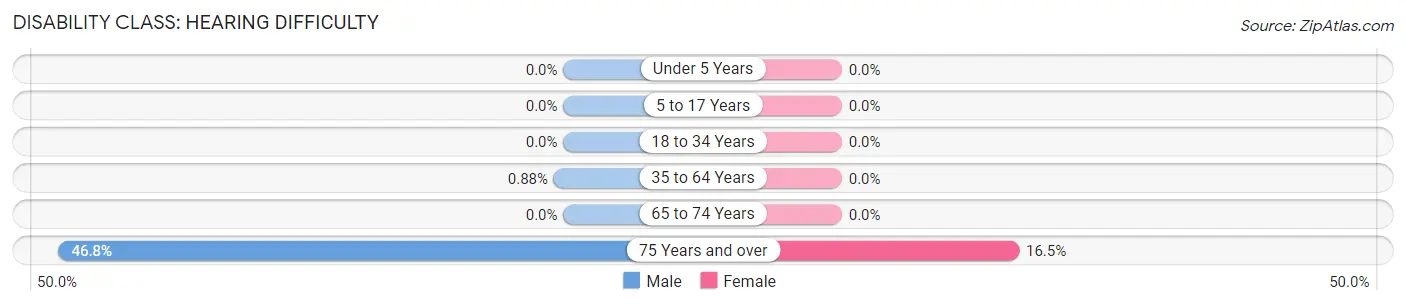
| Age Bracket | Male | Female |
| Under 5 Years | 0 (0.0%) | 0 (0.0%) |
| 5 to 17 Years | 0 (0.0%) | 0 (0.0%) |
| 18 to 34 Years | 0 (0.0%) | 0 (0.0%) |
| 35 to 64 Years | 15 (0.9%) | 0 (0.0%) |
| 65 to 74 Years | 0 (0.0%) | 0 (0.0%) |
| 75 Years and over | 111 (46.8%) | 51 (16.5%) |
Disability Class: Vision Difficulty
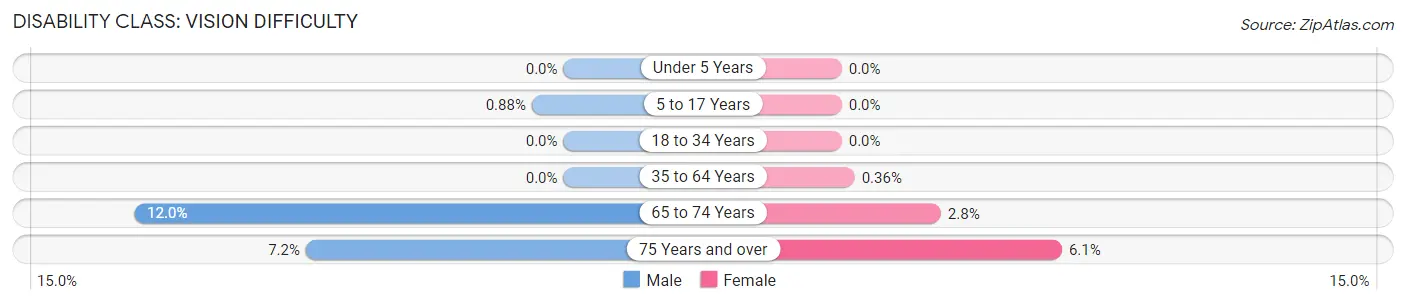
| Age Bracket | Male | Female |
| Under 5 Years | 0 (0.0%) | 0 (0.0%) |
| 5 to 17 Years | 8 (0.9%) | 0 (0.0%) |
| 18 to 34 Years | 0 (0.0%) | 0 (0.0%) |
| 35 to 64 Years | 0 (0.0%) | 7 (0.4%) |
| 65 to 74 Years | 30 (11.9%) | 11 (2.8%) |
| 75 Years and over | 17 (7.2%) | 19 (6.1%) |
Disability Class: Cognitive Difficulty
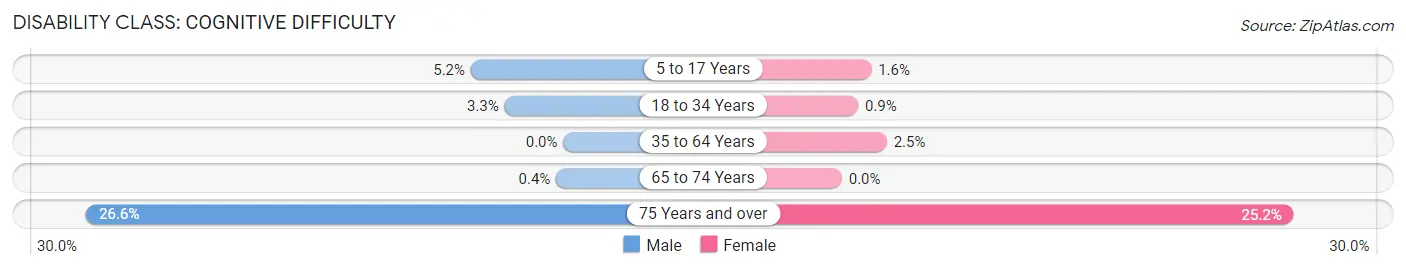
| Age Bracket | Male | Female |
| 5 to 17 Years | 47 (5.1%) | 15 (1.6%) |
| 18 to 34 Years | 16 (3.3%) | 9 (0.9%) |
| 35 to 64 Years | 0 (0.0%) | 48 (2.5%) |
| 65 to 74 Years | 1 (0.4%) | 0 (0.0%) |
| 75 Years and over | 63 (26.6%) | 78 (25.2%) |
Disability Class: Ambulatory Difficulty
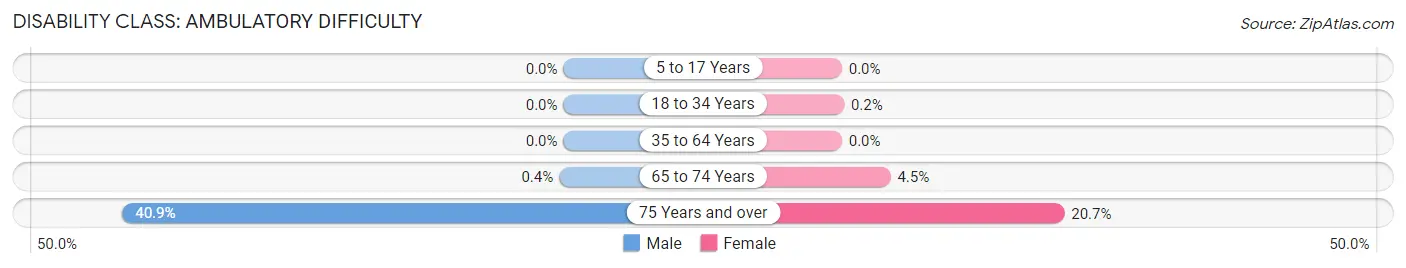
| Age Bracket | Male | Female |
| 5 to 17 Years | 0 (0.0%) | 0 (0.0%) |
| 18 to 34 Years | 0 (0.0%) | 2 (0.2%) |
| 35 to 64 Years | 0 (0.0%) | 0 (0.0%) |
| 65 to 74 Years | 1 (0.4%) | 18 (4.5%) |
| 75 Years and over | 97 (40.9%) | 64 (20.6%) |
Disability Class: Self-Care Difficulty
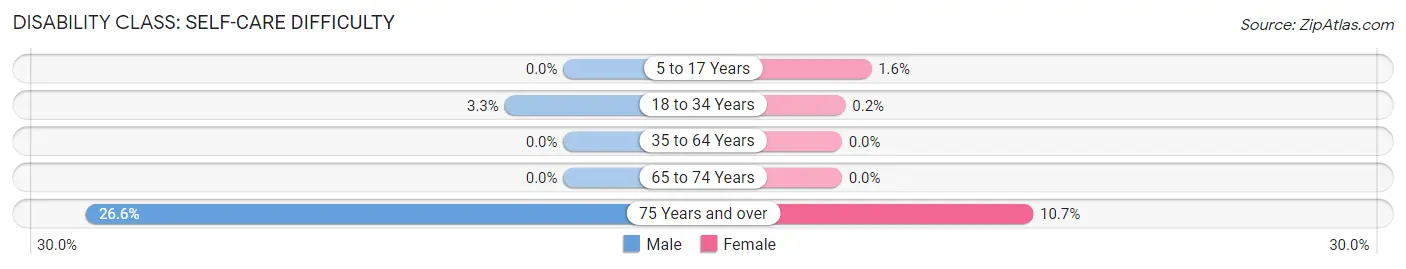
| Age Bracket | Male | Female |
| 5 to 17 Years | 0 (0.0%) | 15 (1.6%) |
| 18 to 34 Years | 16 (3.3%) | 2 (0.2%) |
| 35 to 64 Years | 0 (0.0%) | 0 (0.0%) |
| 65 to 74 Years | 0 (0.0%) | 0 (0.0%) |
| 75 Years and over | 63 (26.6%) | 33 (10.6%) |
Technology Access in Crozet
Computing Device Access in Crozet
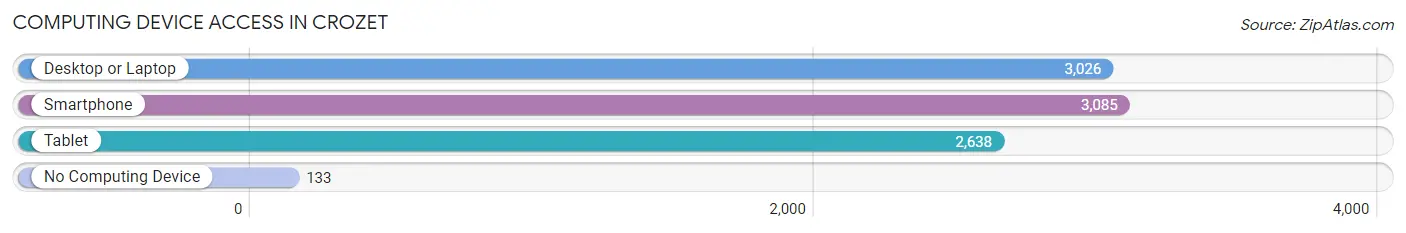
| Device Type | # Households | % Households |
| Desktop or Laptop | 3,026 | 89.1% |
| Smartphone | 3,085 | 90.8% |
| Tablet | 2,638 | 77.7% |
| No Computing Device | 133 | 3.9% |
| Total | 3,397 | 100.0% |
Internet Access in Crozet
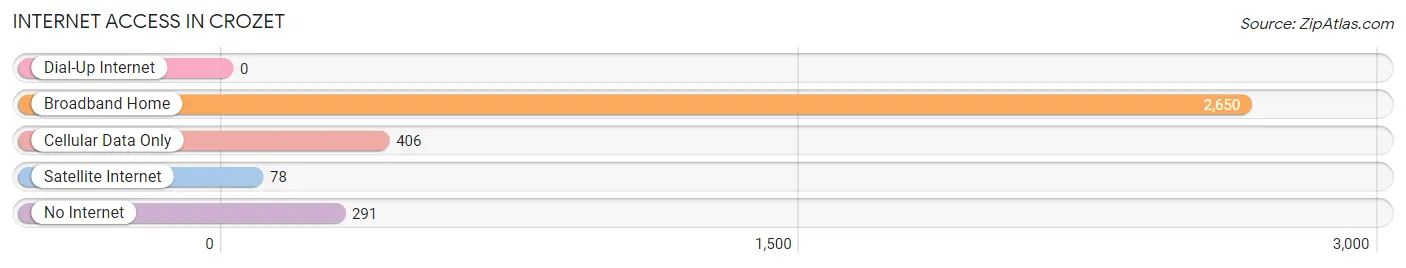
| Internet Type | # Households | % Households |
| Dial-Up Internet | 0 | 0.0% |
| Broadband Home | 2,650 | 78.0% |
| Cellular Data Only | 406 | 11.9% |
| Satellite Internet | 78 | 2.3% |
| No Internet | 291 | 8.6% |
| Total | 3,397 | 100.0% |
Crozet Summary
Crozet, Virginia is a small town located in Albemarle County, Virginia, about 12 miles west of Charlottesville. It is part of the Charlottesville Metropolitan Statistical Area and is home to approximately 6,000 people. The town was founded in 1878 and is named after Colonel Claudius Crozet, a French engineer who served in the United States Army during the War of 1812.
History
Crozet was founded in 1878 by the Chesapeake and Ohio Railway. The town was named after Colonel Claudius Crozet, a French engineer who served in the United States Army during the War of 1812. The town was originally a stop on the railroad line and was used as a shipping point for local farmers. The town grew slowly over the years and by the early 1900s, it had become a popular summer resort destination for people from nearby cities.
In the early 20th century, the town was home to a number of businesses, including a hotel, a bank, a post office, a general store, and a blacksmith shop. The town also had a number of churches, including the Crozet Methodist Church, which was founded in 1883.
In the 1950s, the town began to experience a period of growth and development. The Chesapeake and Ohio Railway was replaced by the Charlottesville and Albemarle Railway, which provided better access to the town. The town also saw the construction of a number of new homes and businesses.
Geography
Crozet is located in Albemarle County, Virginia, about 12 miles west of Charlottesville. The town is situated in the foothills of the Blue Ridge Mountains and is surrounded by rolling hills and farmland. The town is located at the intersection of U.S. Route 250 and State Route 240.
The climate in Crozet is mild and humid, with temperatures ranging from the low 30s in the winter to the mid-80s in the summer. The town receives an average of 43 inches of precipitation per year, with most of it falling in the form of rain.
Economy
Crozet’s economy is largely based on agriculture and tourism. The town is home to a number of farms, which produce a variety of crops, including apples, peaches, and hay. The town is also home to a number of wineries, which produce a variety of wines.
The town is also home to a number of businesses, including restaurants, shops, and a number of professional services. The town is also home to a number of small manufacturing companies, which produce a variety of products, including furniture, clothing, and electronics.
Demographics
As of the 2010 census, the population of Crozet was 6,051. The racial makeup of the town was 87.3% White, 8.2% African American, 0.3% Native American, 1.2% Asian, 0.1% Pacific Islander, and 2.9% from other races. The median household income in the town was $63,917, and the median family income was $76,917.
Conclusion
Crozet, Virginia is a small town located in Albemarle County, Virginia, about 12 miles west of Charlottesville. It is part of the Charlottesville Metropolitan Statistical Area and is home to approximately 6,000 people. The town was founded in 1878 and is named after Colonel Claudius Crozet, a French engineer who served in the United States Army during the War of 1812. The town’s economy is largely based on agriculture and tourism, and the town is home to a number of businesses, including restaurants, shops, and a number of professional services. As of the 2010 census, the population of Crozet was 6,051, and the median household income in the town was $63,917.
Common Questions
What is Per Capita Income in Crozet?
Per Capita income in Crozet is $59,604.
What is the Median Family Income in Crozet?
Median Family Income in Crozet is $146,508.
What is the Median Household income in Crozet?
Median Household Income in Crozet is $106,081.
What is Income or Wage Gap in Crozet?
Income or Wage Gap in Crozet is 45.6%.
Women in Crozet earn 54.4 cents for every dollar earned by a man.
What is Inequality or Gini Index in Crozet?
Inequality or Gini Index in Crozet is 0.46.
What is the Total Population of Crozet?
Total Population of Crozet is 8,894.
What is the Total Male Population of Crozet?
Total Male Population of Crozet is 4,093.
What is the Total Female Population of Crozet?
Total Female Population of Crozet is 4,801.
What is the Ratio of Males per 100 Females in Crozet?
There are 85.25 Males per 100 Females in Crozet.
What is the Ratio of Females per 100 Males in Crozet?
There are 117.30 Females per 100 Males in Crozet.
What is the Median Population Age in Crozet?
Median Population Age in Crozet is 36.9 Years.
What is the Average Family Size in Crozet
Average Family Size in Crozet is 3.1 People.
What is the Average Household Size in Crozet
Average Household Size in Crozet is 2.6 People.
How Large is the Labor Force in Crozet?
There are 4,543 People in the Labor Forcein in Crozet.
What is the Percentage of People in the Labor Force in Crozet?
68.2% of People are in the Labor Force in Crozet.
What is the Unemployment Rate in Crozet?
Unemployment Rate in Crozet is 2.7%.