Westlake Corner, VA Map & Demographics
Westlake Corner Map
Westlake Corner Overview
$57,721
PER CAPITA INCOME
$76,848
AVG FAMILY INCOME
$69,297
AVG HOUSEHOLD INCOME
40.6%
WAGE / INCOME GAP [ % ]
59.4¢/ $1
WAGE / INCOME GAP [ $ ]
0.40
INEQUALITY / GINI INDEX
1,815
TOTAL POPULATION
708
MALE POPULATION
1,107
FEMALE POPULATION
63.96
MALES / 100 FEMALES
156.36
FEMALES / 100 MALES
59.9
MEDIAN AGE
3.0
AVG FAMILY SIZE
2.5
AVG HOUSEHOLD SIZE
780
LABOR FORCE [ PEOPLE ]
46.9%
PERCENT IN LABOR FORCE
Income in Westlake Corner
Income Overview in Westlake Corner
Per Capita Income in Westlake Corner is $57,721, while median incomes of families and households are $76,848 and $69,297 respectively.
| Characteristic | Number | Measure |
| Per Capita Income | 1,815 | $57,721 |
| Median Family Income | 508 | $76,848 |
| Mean Family Income | 508 | $106,002 |
| Median Household Income | 713 | $69,297 |
| Mean Household Income | 713 | $99,872 |
| Income Deficit | 508 | $0 |
| Wage / Income Gap (%) | 1,815 | 40.63% |
| Wage / Income Gap ($) | 1,815 | 59.37¢ per $1 |
| Gini / Inequality Index | 1,815 | 0.40 |
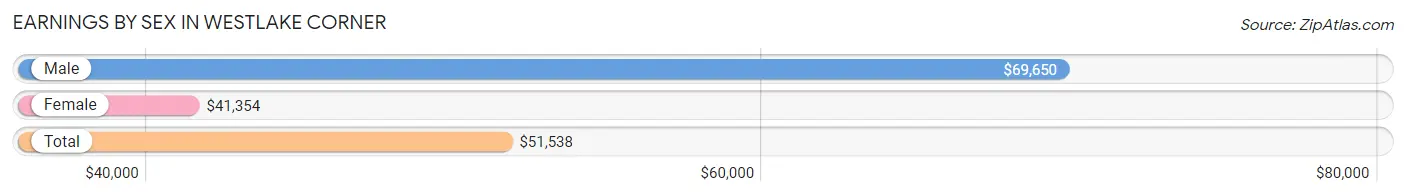
Earnings by Sex in Westlake Corner
Average Earnings in Westlake Corner are $51,538, $69,650 for men and $41,354 for women, a difference of 40.6%.
| Sex | Number | Average Earnings |
| Male | 193 (24.2%) | $69,650 |
| Female | 605 (75.8%) | $41,354 |
| Total | 798 (100.0%) | $51,538 |
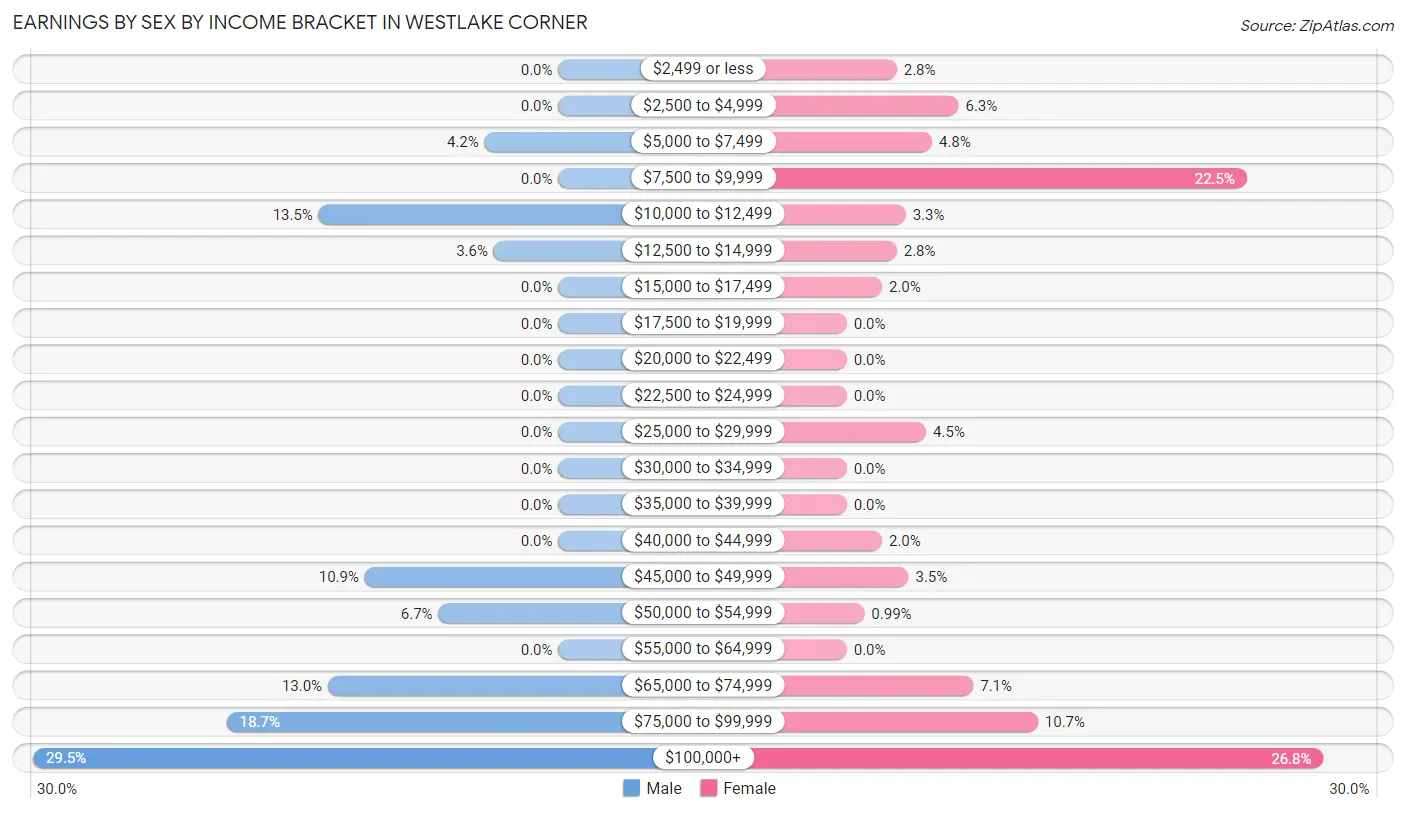
Earnings by Sex by Income Bracket in Westlake Corner
The most common earnings brackets in Westlake Corner are $100,000+ for men (57 | 29.5%) and $100,000+ for women (162 | 26.8%).
| Income | Male | Female |
| $2,499 or less | 0 (0.0%) | 17 (2.8%) |
| $2,500 to $4,999 | 0 (0.0%) | 38 (6.3%) |
| $5,000 to $7,499 | 8 (4.2%) | 29 (4.8%) |
| $7,500 to $9,999 | 0 (0.0%) | 136 (22.5%) |
| $10,000 to $12,499 | 26 (13.5%) | 20 (3.3%) |
| $12,500 to $14,999 | 7 (3.6%) | 17 (2.8%) |
| $15,000 to $17,499 | 0 (0.0%) | 12 (2.0%) |
| $17,500 to $19,999 | 0 (0.0%) | 0 (0.0%) |
| $20,000 to $22,499 | 0 (0.0%) | 0 (0.0%) |
| $22,500 to $24,999 | 0 (0.0%) | 0 (0.0%) |
| $25,000 to $29,999 | 0 (0.0%) | 27 (4.5%) |
| $30,000 to $34,999 | 0 (0.0%) | 0 (0.0%) |
| $35,000 to $39,999 | 0 (0.0%) | 0 (0.0%) |
| $40,000 to $44,999 | 0 (0.0%) | 12 (2.0%) |
| $45,000 to $49,999 | 21 (10.9%) | 21 (3.5%) |
| $50,000 to $54,999 | 13 (6.7%) | 6 (1.0%) |
| $55,000 to $64,999 | 0 (0.0%) | 0 (0.0%) |
| $65,000 to $74,999 | 25 (13.0%) | 43 (7.1%) |
| $75,000 to $99,999 | 36 (18.6%) | 65 (10.7%) |
| $100,000+ | 57 (29.5%) | 162 (26.8%) |
| Total | 193 (100.0%) | 605 (100.0%) |
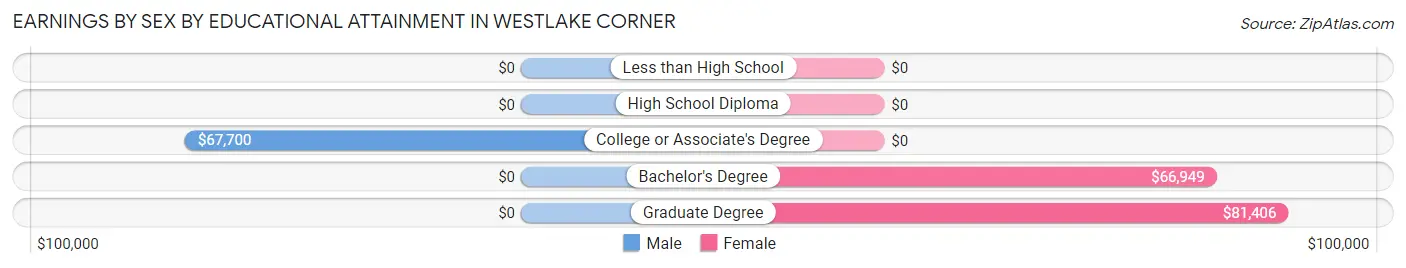
Earnings by Sex by Educational Attainment in Westlake Corner
Average earnings in Westlake Corner are $69,650 for men and $65,588 for women, a difference of 5.8%. Men with an educational attainment of college or associate's degree enjoy the highest average annual earnings of $67,700, while those with college or associate's degree education earn the least with $67,700. Women with an educational attainment of graduate degree earn the most with the average annual earnings of $81,406, while those with bachelor's degree education have the smallest earnings of $66,949.
| Educational Attainment | Male Income | Female Income |
| Less than High School | - | - |
| High School Diploma | - | - |
| College or Associate's Degree | $67,700 | $0 |
| Bachelor's Degree | - | - |
| Graduate Degree | - | - |
| Total | $69,650 | $65,588 |
Family Income in Westlake Corner
Family Income Brackets in Westlake Corner
According to the Westlake Corner family income data, there are 174 families falling into the $50,000 to $74,999 income range, which is the most common income bracket and makes up 34.3% of all families.
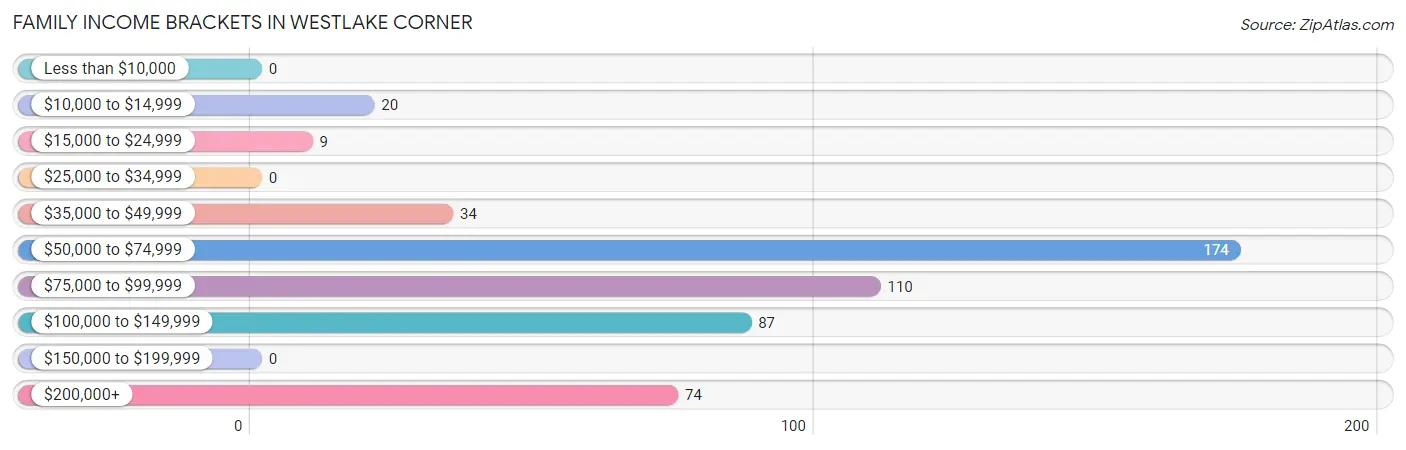
| Income Bracket | # Families | % Families |
| Less than $10,000 | 0 | 0.0% |
| $10,000 to $14,999 | 20 | 3.9% |
| $15,000 to $24,999 | 9 | 1.8% |
| $25,000 to $34,999 | 0 | 0.0% |
| $35,000 to $49,999 | 34 | 6.7% |
| $50,000 to $74,999 | 174 | 34.3% |
| $75,000 to $99,999 | 110 | 21.7% |
| $100,000 to $149,999 | 87 | 17.1% |
| $150,000 to $199,999 | 0 | 0.0% |
| $200,000+ | 74 | 14.6% |
Family Income by Famaliy Size in Westlake Corner
4-person families (90 | 17.7%) account for the highest median family income in Westlake Corner with $123,083 per family, while 2-person families (351 | 69.1%) have the highest median income of $37,527 per family member.
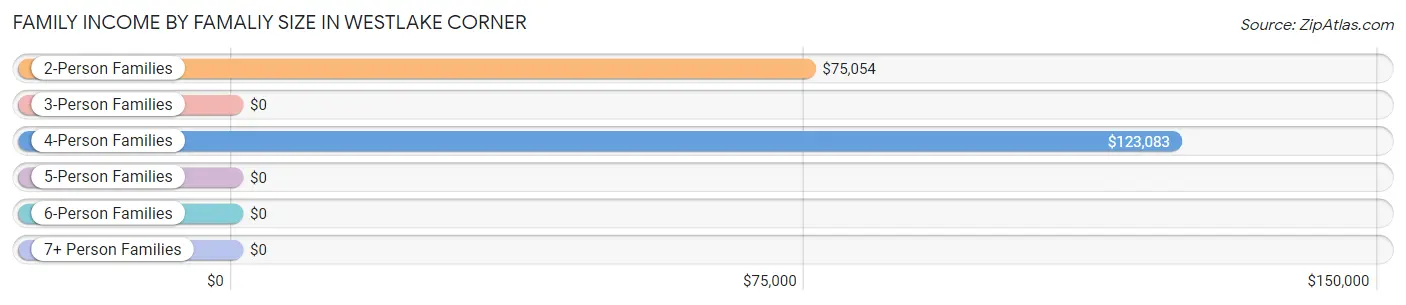
| Income Bracket | # Families | Median Income |
| 2-Person Families | 351 (69.1%) | $75,054 |
| 3-Person Families | 46 (9.1%) | $0 |
| 4-Person Families | 90 (17.7%) | $123,083 |
| 5-Person Families | 21 (4.1%) | $0 |
| 6-Person Families | 0 (0.0%) | $0 |
| 7+ Person Families | 0 (0.0%) | $0 |
| Total | 508 (100.0%) | $76,848 |
Family Income by Number of Earners in Westlake Corner
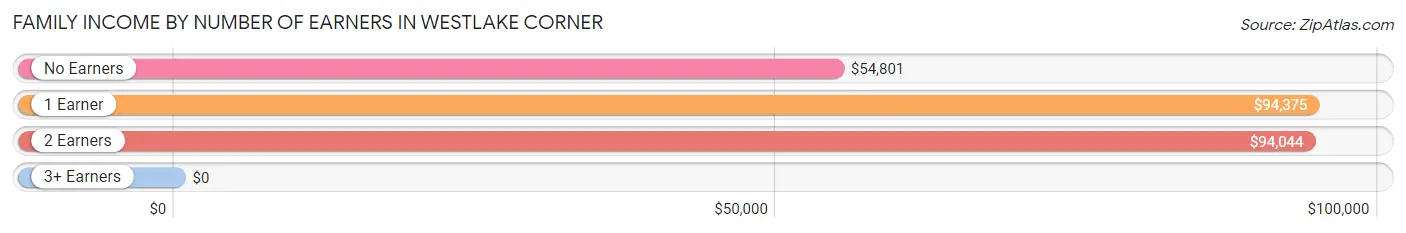
| Number of Earners | # Families | Median Income |
| No Earners | 246 (48.4%) | $54,801 |
| 1 Earner | 87 (17.1%) | $94,375 |
| 2 Earners | 142 (28.0%) | $94,044 |
| 3+ Earners | 33 (6.5%) | $0 |
| Total | 508 (100.0%) | $76,848 |
Household Income in Westlake Corner
Household Income Brackets in Westlake Corner
With 256 households falling in the category, the $50,000 to $74,999 income range is the most frequent in Westlake Corner, accounting for 35.9% of all households.
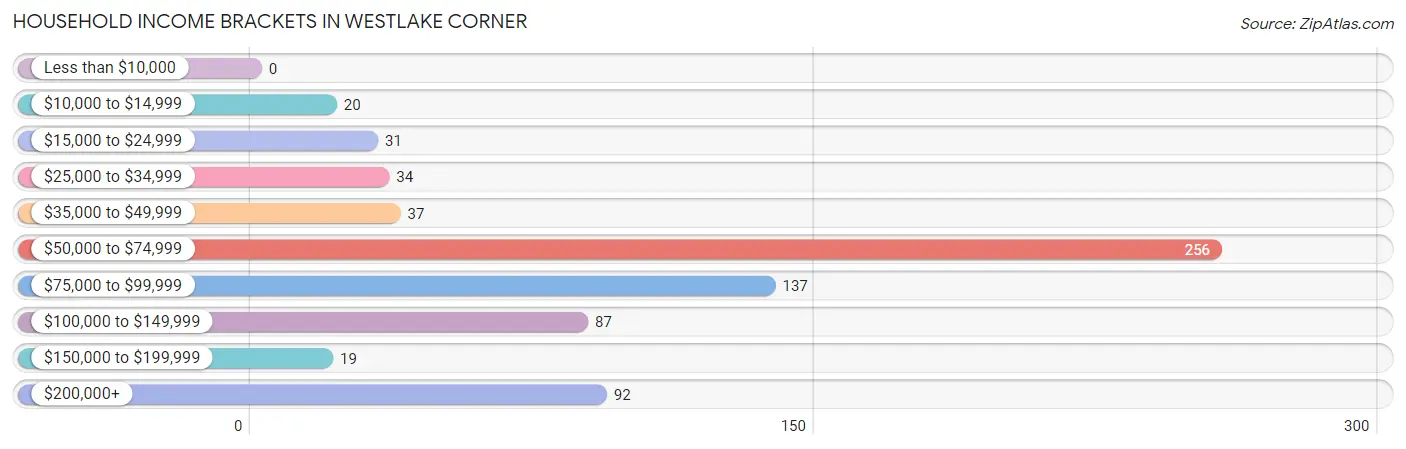
| Income Bracket | # Households | % Households |
| Less than $10,000 | 0 | 0.0% |
| $10,000 to $14,999 | 20 | 2.8% |
| $15,000 to $24,999 | 31 | 4.3% |
| $25,000 to $34,999 | 34 | 4.8% |
| $35,000 to $49,999 | 37 | 5.2% |
| $50,000 to $74,999 | 256 | 35.9% |
| $75,000 to $99,999 | 137 | 19.2% |
| $100,000 to $149,999 | 87 | 12.2% |
| $150,000 to $199,999 | 19 | 2.7% |
| $200,000+ | 92 | 12.9% |
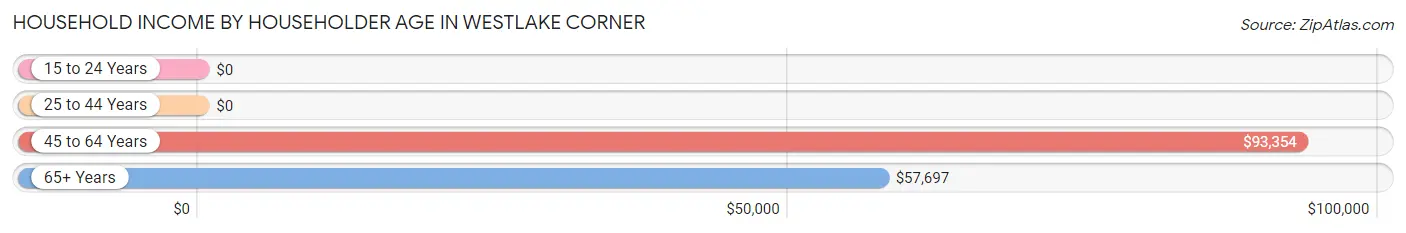
Household Income by Householder Age in Westlake Corner
The median household income in Westlake Corner is $69,297, with the highest median household income of $93,354 found in the 45 to 64 years age bracket for the primary householder. A total of 295 households (41.4%) fall into this category. Meanwhile, the 15 to 24 years age bracket for the primary householder has the lowest median household income of $0, with 16 households (2.2%) in this group.
| Income Bracket | # Households | Median Income |
| 15 to 24 Years | 16 (2.2%) | $0 |
| 25 to 44 Years | 39 (5.5%) | $0 |
| 45 to 64 Years | 295 (41.4%) | $93,354 |
| 65+ Years | 363 (50.9%) | $57,697 |
| Total | 713 (100.0%) | $69,297 |
Poverty in Westlake Corner
Income Below Poverty by Sex and Age in Westlake Corner
With 8.6% poverty level for males and 5.0% for females among the residents of Westlake Corner, 25 to 34 year old males and 16 and 17 year old females are the most vulnerable to poverty, with 26 males (52.0%) and 13 females (100.0%) in their respective age groups living below the poverty level.
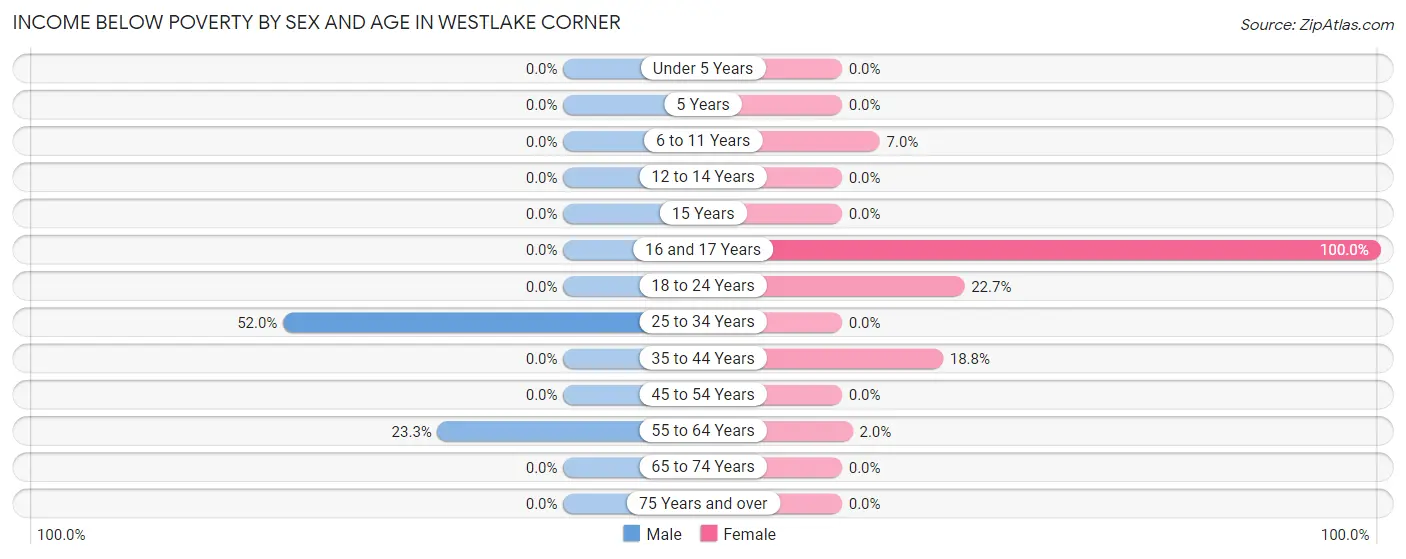
| Age Bracket | Male | Female |
| Under 5 Years | 0 (0.0%) | 0 (0.0%) |
| 5 Years | 0 (0.0%) | 0 (0.0%) |
| 6 to 11 Years | 0 (0.0%) | 4 (7.0%) |
| 12 to 14 Years | 0 (0.0%) | 0 (0.0%) |
| 15 Years | 0 (0.0%) | 0 (0.0%) |
| 16 and 17 Years | 0 (0.0%) | 13 (100.0%) |
| 18 to 24 Years | 0 (0.0%) | 20 (22.7%) |
| 25 to 34 Years | 26 (52.0%) | 0 (0.0%) |
| 35 to 44 Years | 0 (0.0%) | 9 (18.8%) |
| 45 to 54 Years | 0 (0.0%) | 0 (0.0%) |
| 55 to 64 Years | 35 (23.3%) | 9 (2.0%) |
| 65 to 74 Years | 0 (0.0%) | 0 (0.0%) |
| 75 Years and over | 0 (0.0%) | 0 (0.0%) |
| Total | 61 (8.6%) | 55 (5.0%) |
Income Above Poverty by Sex and Age in Westlake Corner
According to the poverty statistics in Westlake Corner, males aged 6 to 11 years and females aged 12 to 14 years are the age groups that are most secure financially, with 100.0% of males and 100.0% of females in these age groups living above the poverty line.
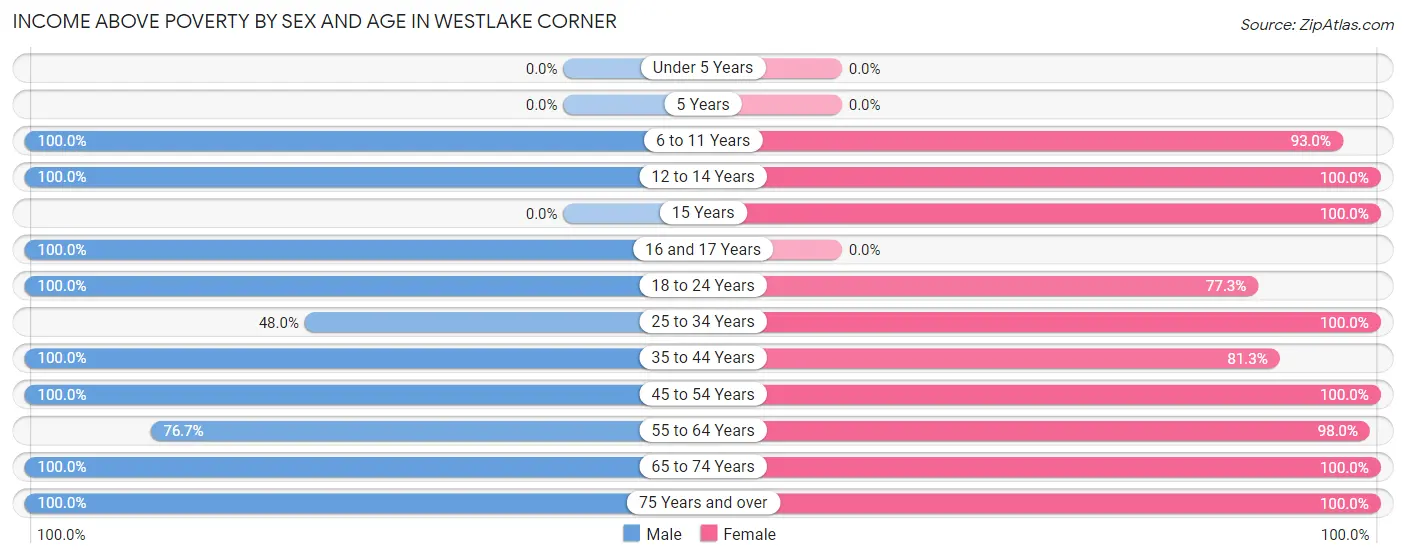
| Age Bracket | Male | Female |
| Under 5 Years | 0 (0.0%) | 0 (0.0%) |
| 5 Years | 0 (0.0%) | 0 (0.0%) |
| 6 to 11 Years | 20 (100.0%) | 53 (93.0%) |
| 12 to 14 Years | 30 (100.0%) | 23 (100.0%) |
| 15 Years | 0 (0.0%) | 22 (100.0%) |
| 16 and 17 Years | 29 (100.0%) | 0 (0.0%) |
| 18 to 24 Years | 41 (100.0%) | 68 (77.3%) |
| 25 to 34 Years | 24 (48.0%) | 12 (100.0%) |
| 35 to 44 Years | 6 (100.0%) | 39 (81.2%) |
| 45 to 54 Years | 88 (100.0%) | 77 (100.0%) |
| 55 to 64 Years | 115 (76.7%) | 444 (98.0%) |
| 65 to 74 Years | 121 (100.0%) | 184 (100.0%) |
| 75 Years and over | 173 (100.0%) | 130 (100.0%) |
| Total | 647 (91.4%) | 1,052 (95.0%) |
Income Below Poverty Among Married-Couple Families in Westlake Corner
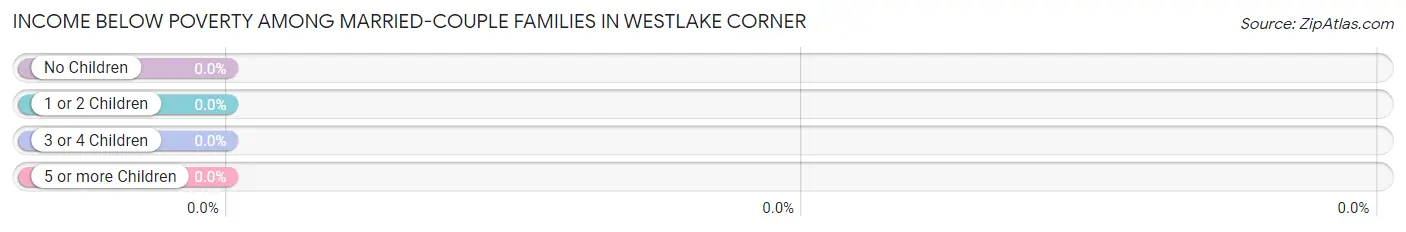
| Children | Above Poverty | Below Poverty |
| No Children | 336 (100.0%) | 0 (0.0%) |
| 1 or 2 Children | 43 (100.0%) | 0 (0.0%) |
| 3 or 4 Children | 21 (100.0%) | 0 (0.0%) |
| 5 or more Children | 0 (0.0%) | 0 (0.0%) |
| Total | 400 (100.0%) | 0 (0.0%) |
Income Below Poverty Among Single-Parent Households in Westlake Corner
According to the poverty data in Westlake Corner, 54.0% or 20 single-father households and 12.7% or 9 single-mother households are living below the poverty line. Among single-father households, those with no children have the highest poverty rate, with 20 households (54.0%) experiencing poverty. Likewise, among single-mother households, those with 1 or 2 children have the highest poverty rate, with 9 households (36.0%) falling below the poverty line.
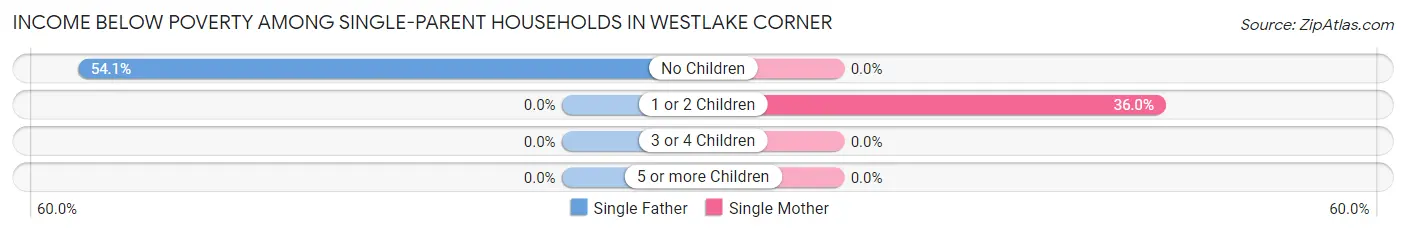
| Children | Single Father | Single Mother |
| No Children | 20 (54.0%) | 0 (0.0%) |
| 1 or 2 Children | 0 (0.0%) | 9 (36.0%) |
| 3 or 4 Children | 0 (0.0%) | 0 (0.0%) |
| 5 or more Children | 0 (0.0%) | 0 (0.0%) |
| Total | 20 (54.0%) | 9 (12.7%) |
Income Below Poverty Among Married-Couple vs Single-Parent Households in Westlake Corner
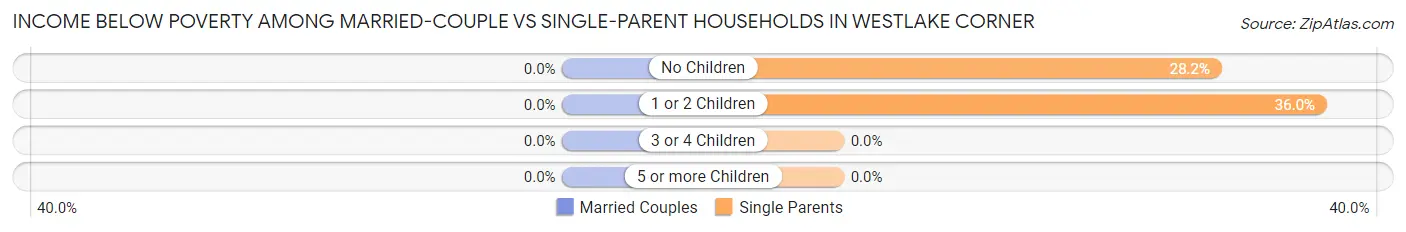
| Children | Married-Couple Families | Single-Parent Households |
| No Children | 0 (0.0%) | 20 (28.2%) |
| 1 or 2 Children | 0 (0.0%) | 9 (36.0%) |
| 3 or 4 Children | 0 (0.0%) | 0 (0.0%) |
| 5 or more Children | 0 (0.0%) | 0 (0.0%) |
| Total | 0 (0.0%) | 29 (26.9%) |
Race in Westlake Corner
The most populous races in Westlake Corner are White / Caucasian (1,785 | 98.4%), Two or more Races (22 | 1.2%), and Asian (8 | 0.4%).
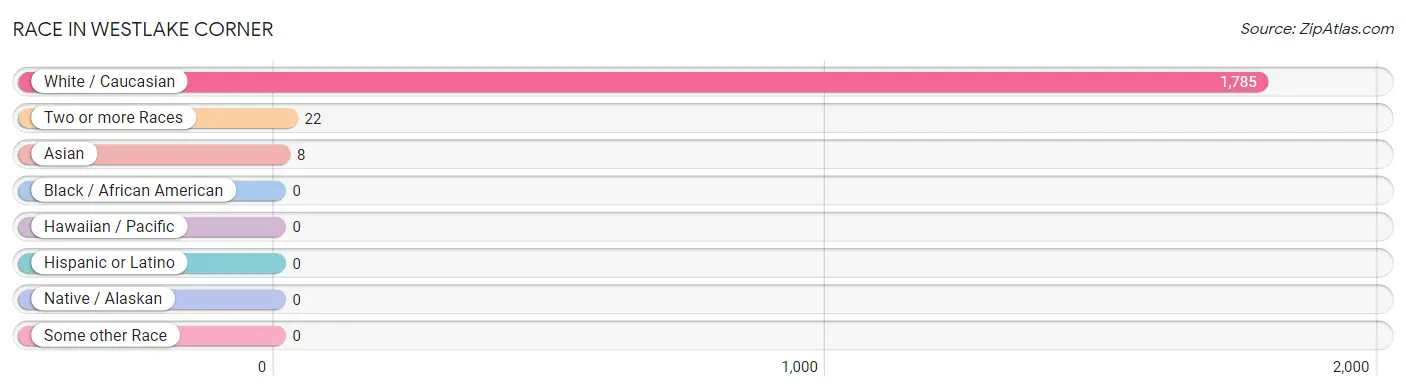
| Race | # Population | % Population |
| Asian | 8 | 0.4% |
| Black / African American | 0 | 0.0% |
| Hawaiian / Pacific | 0 | 0.0% |
| Hispanic or Latino | 0 | 0.0% |
| Native / Alaskan | 0 | 0.0% |
| White / Caucasian | 1,785 | 98.4% |
| Two or more Races | 22 | 1.2% |
| Some other Race | 0 | 0.0% |
| Total | 1,815 | 100.0% |
Ancestry in Westlake Corner
The most populous ancestries reported in Westlake Corner are English (441 | 24.3%), German (359 | 19.8%), Scottish (196 | 10.8%), American (182 | 10.0%), and Swedish (128 | 7.0%), together accounting for 72.0% of all Westlake Corner residents.
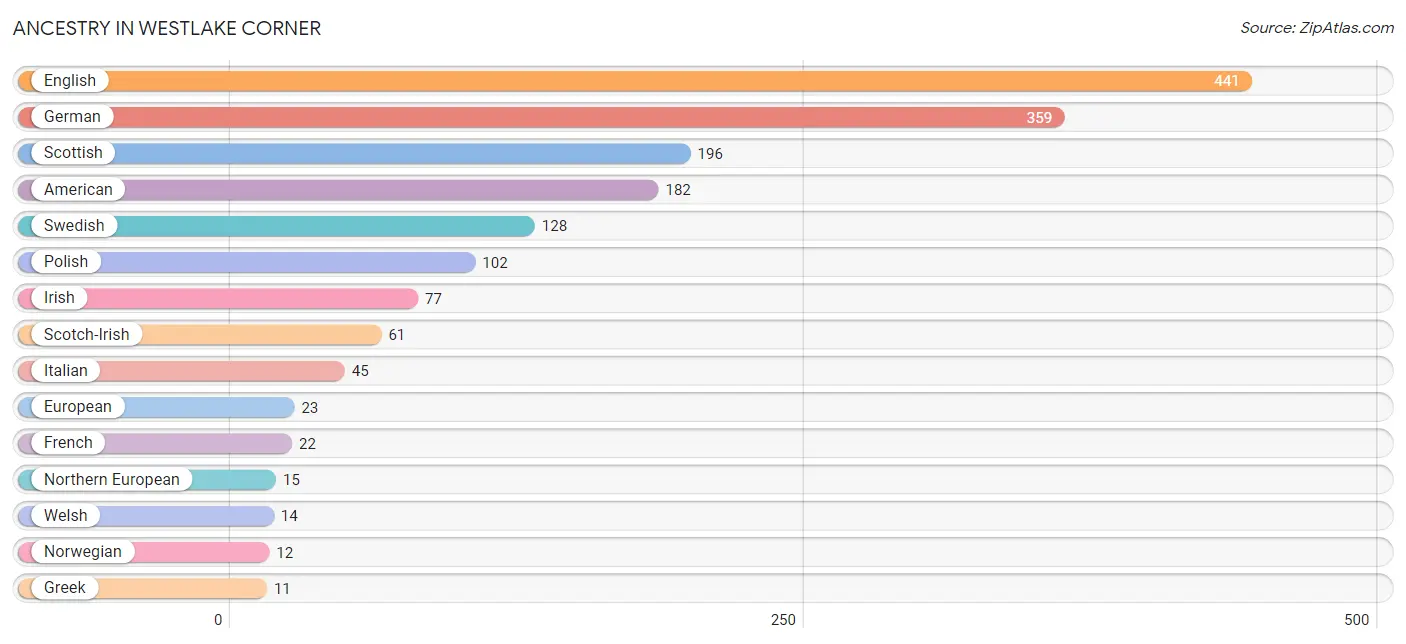
| Ancestry | # Population | % Population |
| American | 182 | 10.0% |
| Burmese | 8 | 0.4% |
| Czechoslovakian | 6 | 0.3% |
| English | 441 | 24.3% |
| European | 23 | 1.3% |
| French | 22 | 1.2% |
| German | 359 | 19.8% |
| Greek | 11 | 0.6% |
| Irish | 77 | 4.2% |
| Italian | 45 | 2.5% |
| Northern European | 15 | 0.8% |
| Norwegian | 12 | 0.7% |
| Polish | 102 | 5.6% |
| Scotch-Irish | 61 | 3.4% |
| Scottish | 196 | 10.8% |
| Swedish | 128 | 7.0% |
| Welsh | 14 | 0.8% | View All 17 Rows |
Immigrants in Westlake Corner
The most numerous immigrant groups reported in Westlake Corner came from Europe (27 | 1.5%), Northern Europe (27 | 1.5%), Sweden (27 | 1.5%), Asia (8 | 0.4%), and Eastern Asia (8 | 0.4%), together accounting for 5.4% of all Westlake Corner residents.
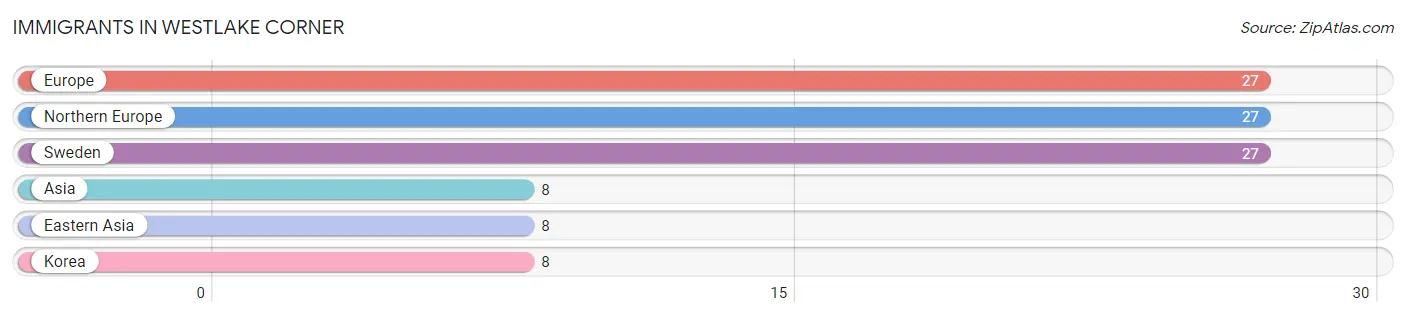
| Immigration Origin | # Population | % Population |
| Asia | 8 | 0.4% |
| Eastern Asia | 8 | 0.4% |
| Europe | 27 | 1.5% |
| Korea | 8 | 0.4% |
| Northern Europe | 27 | 1.5% |
| Sweden | 27 | 1.5% | View All 6 Rows |
Sex and Age in Westlake Corner
Sex and Age in Westlake Corner
The most populous age groups in Westlake Corner are 85 Years and over (134 | 18.9%) for men and 55 to 59 Years (235 | 21.2%) for women.
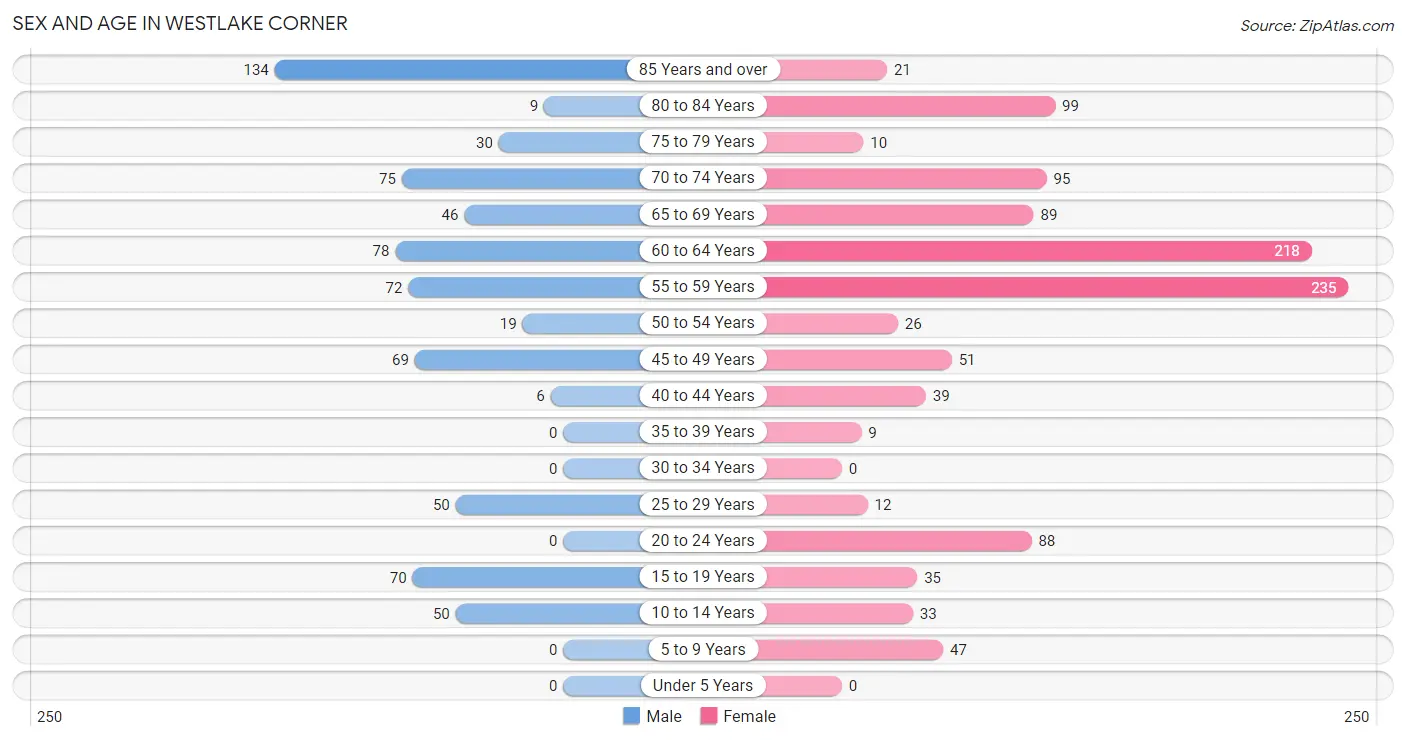
| Age Bracket | Male | Female |
| Under 5 Years | 0 (0.0%) | 0 (0.0%) |
| 5 to 9 Years | 0 (0.0%) | 47 (4.3%) |
| 10 to 14 Years | 50 (7.1%) | 33 (3.0%) |
| 15 to 19 Years | 70 (9.9%) | 35 (3.2%) |
| 20 to 24 Years | 0 (0.0%) | 88 (8.0%) |
| 25 to 29 Years | 50 (7.1%) | 12 (1.1%) |
| 30 to 34 Years | 0 (0.0%) | 0 (0.0%) |
| 35 to 39 Years | 0 (0.0%) | 9 (0.8%) |
| 40 to 44 Years | 6 (0.9%) | 39 (3.5%) |
| 45 to 49 Years | 69 (9.8%) | 51 (4.6%) |
| 50 to 54 Years | 19 (2.7%) | 26 (2.4%) |
| 55 to 59 Years | 72 (10.2%) | 235 (21.2%) |
| 60 to 64 Years | 78 (11.0%) | 218 (19.7%) |
| 65 to 69 Years | 46 (6.5%) | 89 (8.0%) |
| 70 to 74 Years | 75 (10.6%) | 95 (8.6%) |
| 75 to 79 Years | 30 (4.2%) | 10 (0.9%) |
| 80 to 84 Years | 9 (1.3%) | 99 (8.9%) |
| 85 Years and over | 134 (18.9%) | 21 (1.9%) |
| Total | 708 (100.0%) | 1,107 (100.0%) |
Families and Households in Westlake Corner
Median Family Size in Westlake Corner
The median family size in Westlake Corner is 3.04 persons per family, with single female/mother families (71 | 14.0%) accounting for the largest median family size of 6.49 persons per family. On the other hand, single male/father families (37 | 7.3%) represent the smallest median family size with 2.08 persons per family.
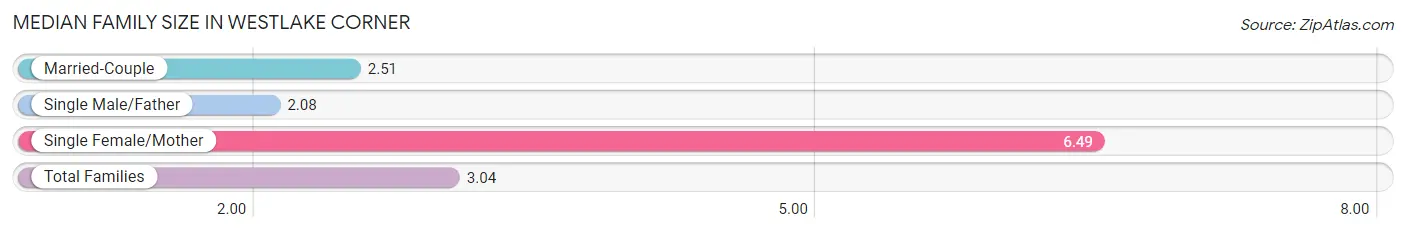
| Family Type | # Families | Family Size |
| Married-Couple | 400 (78.7%) | 2.51 |
| Single Male/Father | 37 (7.3%) | 2.08 |
| Single Female/Mother | 71 (14.0%) | 6.49 |
| Total Families | 508 (100.0%) | 3.04 |
Median Household Size in Westlake Corner
The median household size in Westlake Corner is 2.53 persons per household, with single female/mother households (71 | 10.0%) accounting for the largest median household size of 7.11 persons per household. non-family households (205 | 28.7%) represent the smallest median household size with 1.07 persons per household.
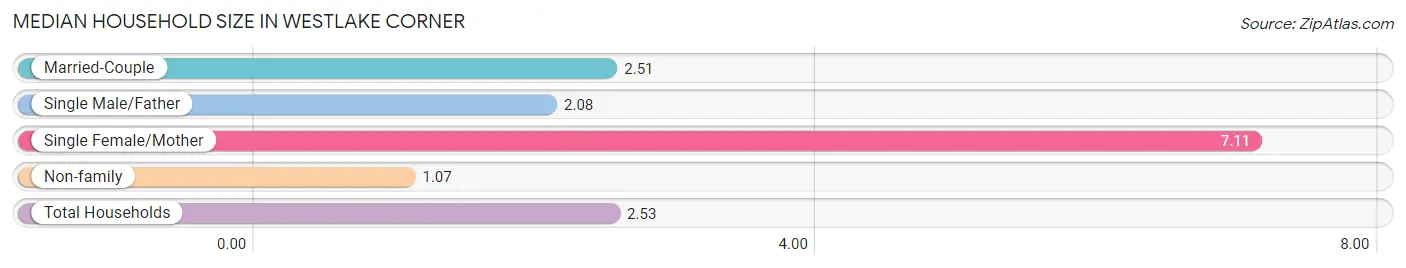
| Household Type | # Households | Household Size |
| Married-Couple | 400 (56.1%) | 2.51 |
| Single Male/Father | 37 (5.2%) | 2.08 |
| Single Female/Mother | 71 (10.0%) | 7.11 |
| Non-family | 205 (28.7%) | 1.07 |
| Total Households | 713 (100.0%) | 2.53 |
Household Size by Marriage Status in Westlake Corner
Out of a total of 713 households in Westlake Corner, 508 (71.3%) are family households, while 205 (28.7%) are nonfamily households. The most numerous type of family households are 2-person households, comprising 351, and the most common type of nonfamily households are 1-person households, comprising 192.
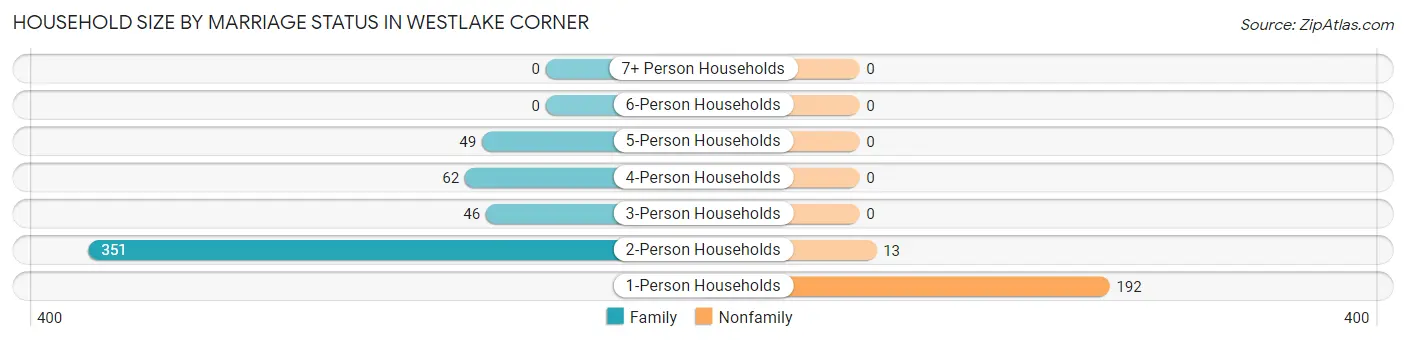
| Household Size | Family Households | Nonfamily Households |
| 1-Person Households | - | 192 (26.9%) |
| 2-Person Households | 351 (49.2%) | 13 (1.8%) |
| 3-Person Households | 46 (6.5%) | 0 (0.0%) |
| 4-Person Households | 62 (8.7%) | 0 (0.0%) |
| 5-Person Households | 49 (6.9%) | 0 (0.0%) |
| 6-Person Households | 0 (0.0%) | 0 (0.0%) |
| 7+ Person Households | 0 (0.0%) | 0 (0.0%) |
| Total | 508 (71.3%) | 205 (28.7%) |
Female Fertility in Westlake Corner
Fertility by Age in Westlake Corner
| Age Bracket | Women with Births | Births / 1,000 Women |
| 15 to 19 years | 0 (0.0%) | 0.0 |
| 20 to 34 years | 0 (0.0%) | 0.0 |
| 35 to 50 years | 0 (0.0%) | 0.0 |
| Total | 0 (0.0%) | 0.0 |
Fertility by Age by Marriage Status in Westlake Corner
| Age Bracket | Married | Unmarried |
| 15 to 19 years | 0 (0.0%) | 0 (0.0%) |
| 20 to 34 years | 0 (0.0%) | 0 (0.0%) |
| 35 to 50 years | 0 (0.0%) | 0 (0.0%) |
| Total | 0 (0.0%) | 0 (0.0%) |
Fertility by Education in Westlake Corner
| Educational Attainment | Women with Births | Births / 1,000 Women |
| Less than High School | 0 (0.0%) | 0.0 |
| High School Diploma | 0 (0.0%) | 0.0 |
| College or Associate's Degree | 0 (0.0%) | 0.0 |
| Bachelor's Degree | 0 (0.0%) | 0.0 |
| Graduate Degree | 0 (0.0%) | 0.0 |
| Total | 0 (0.0%) | 0.0 |
Fertility by Education by Marriage Status in Westlake Corner
| Educational Attainment | Married | Unmarried |
| Less than High School | 0 (0.0%) | 0 (0.0%) |
| High School Diploma | 0 (0.0%) | 0 (0.0%) |
| College or Associate's Degree | 0 (0.0%) | 0 (0.0%) |
| Bachelor's Degree | 0 (0.0%) | 0 (0.0%) |
| Graduate Degree | 0 (0.0%) | 0 (0.0%) |
| Total | 0 (0.0%) | 0 (0.0%) |
Employment Characteristics in Westlake Corner
Employment by Class of Employer in Westlake Corner
Among the 631 employed individuals in Westlake Corner, private company employees (443 | 70.2%), not-for-profit organizations (86 | 13.6%), and self-employed (not incorporated) (44 | 7.0%) make up the most common classes of employment.
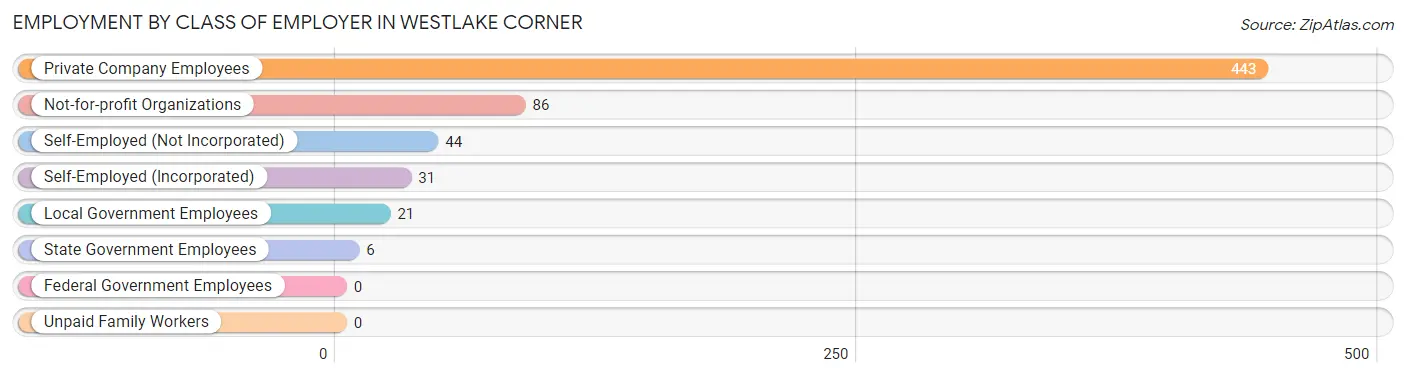
| Employer Class | # Employees | % Employees |
| Private Company Employees | 443 | 70.2% |
| Self-Employed (Incorporated) | 31 | 4.9% |
| Self-Employed (Not Incorporated) | 44 | 7.0% |
| Not-for-profit Organizations | 86 | 13.6% |
| Local Government Employees | 21 | 3.3% |
| State Government Employees | 6 | 0.9% |
| Federal Government Employees | 0 | 0.0% |
| Unpaid Family Workers | 0 | 0.0% |
| Total | 631 | 100.0% |
Employment Status by Age in Westlake Corner
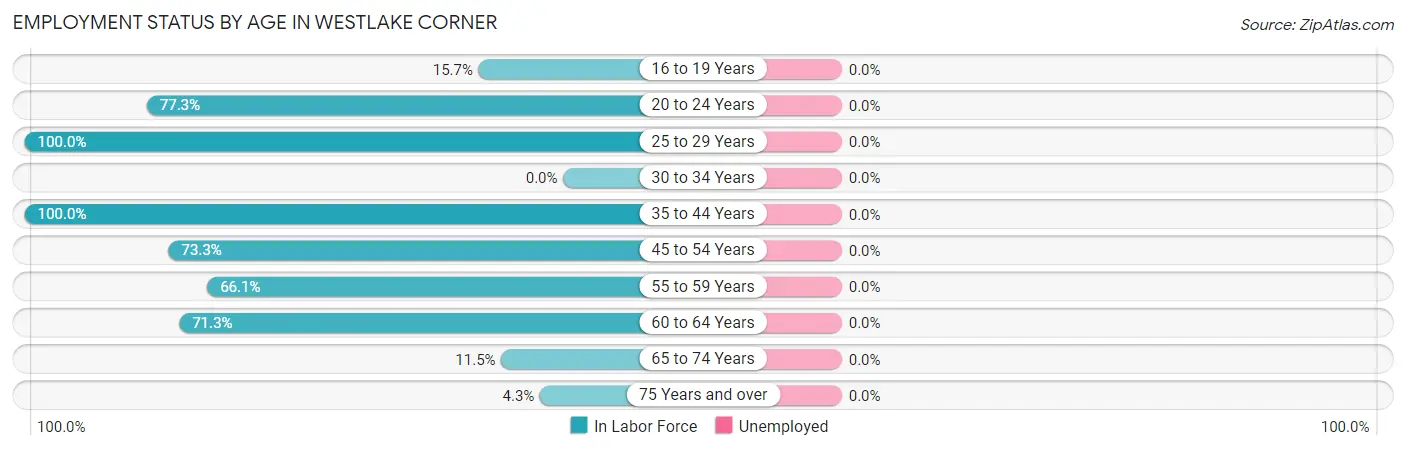
| Age Bracket | In Labor Force | Unemployed |
| 16 to 19 Years | 13 (15.7%) | 0 (0.0%) |
| 20 to 24 Years | 68 (77.3%) | 0 (0.0%) |
| 25 to 29 Years | 62 (100.0%) | 0 (0.0%) |
| 30 to 34 Years | 0 (0.0%) | 0 (0.0%) |
| 35 to 44 Years | 54 (100.0%) | 0 (0.0%) |
| 45 to 54 Years | 121 (73.3%) | 0 (0.0%) |
| 55 to 59 Years | 203 (66.1%) | 0 (0.0%) |
| 60 to 64 Years | 211 (71.3%) | 0 (0.0%) |
| 65 to 74 Years | 35 (11.5%) | 0 (0.0%) |
| 75 Years and over | 13 (4.3%) | 0 (0.0%) |
| Total | 780 (46.9%) | 0 (0.0%) |
Employment Status by Educational Attainment in Westlake Corner
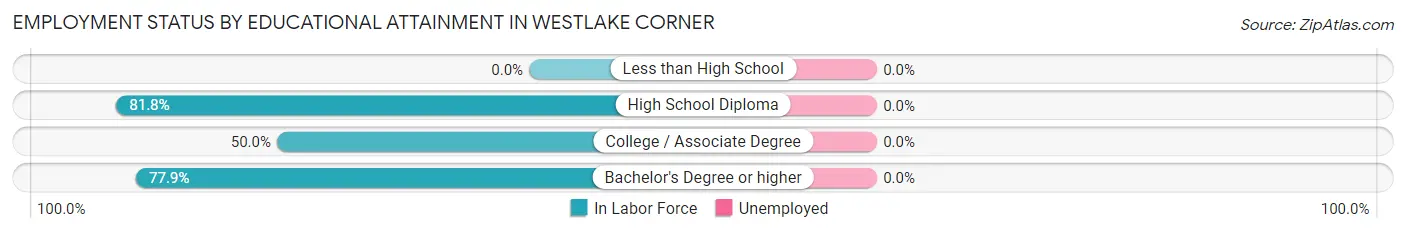
| Educational Attainment | In Labor Force | Unemployed |
| Less than High School | 0 (0.0%) | 0 (0.0%) |
| High School Diploma | 378 (81.8%) | 0 (0.0%) |
| College / Associate Degree | 79 (50.0%) | 0 (0.0%) |
| Bachelor's Degree or higher | 194 (77.9%) | 0 (0.0%) |
| Total | 651 (73.6%) | 0 (0.0%) |
Employment Occupations by Sex in Westlake Corner
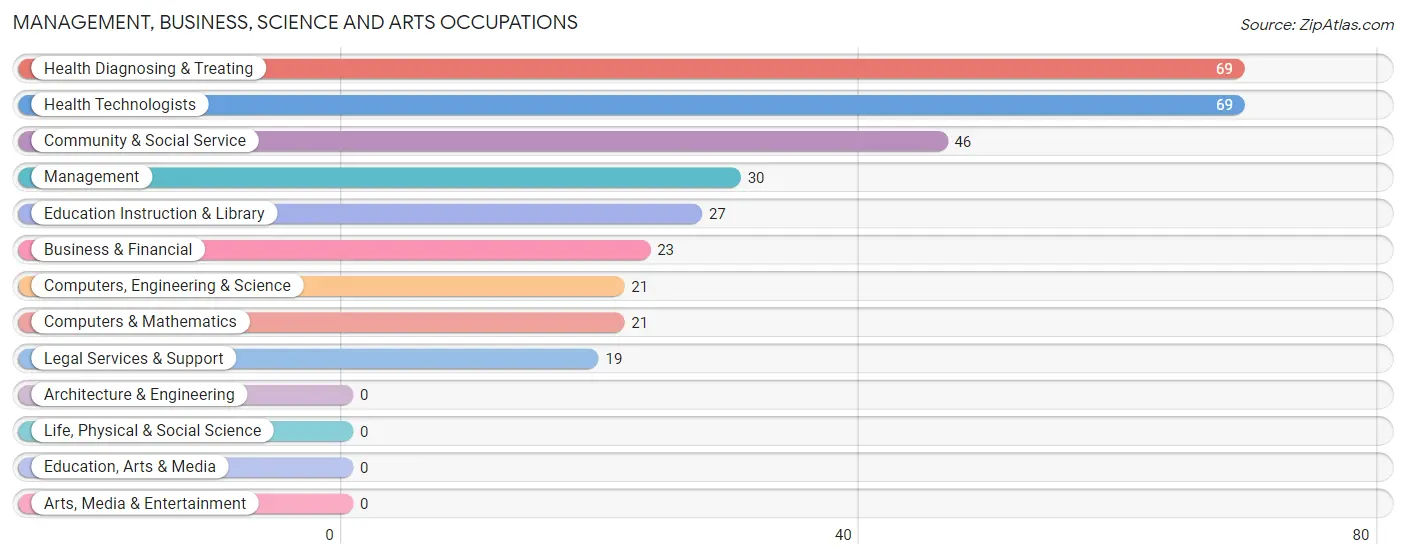
Management, Business, Science and Arts Occupations
The most common Management, Business, Science and Arts occupations in Westlake Corner are Health Diagnosing & Treating (69 | 8.8%), Health Technologists (69 | 8.8%), Community & Social Service (46 | 5.9%), Management (30 | 3.8%), and Education Instruction & Library (27 | 3.5%).
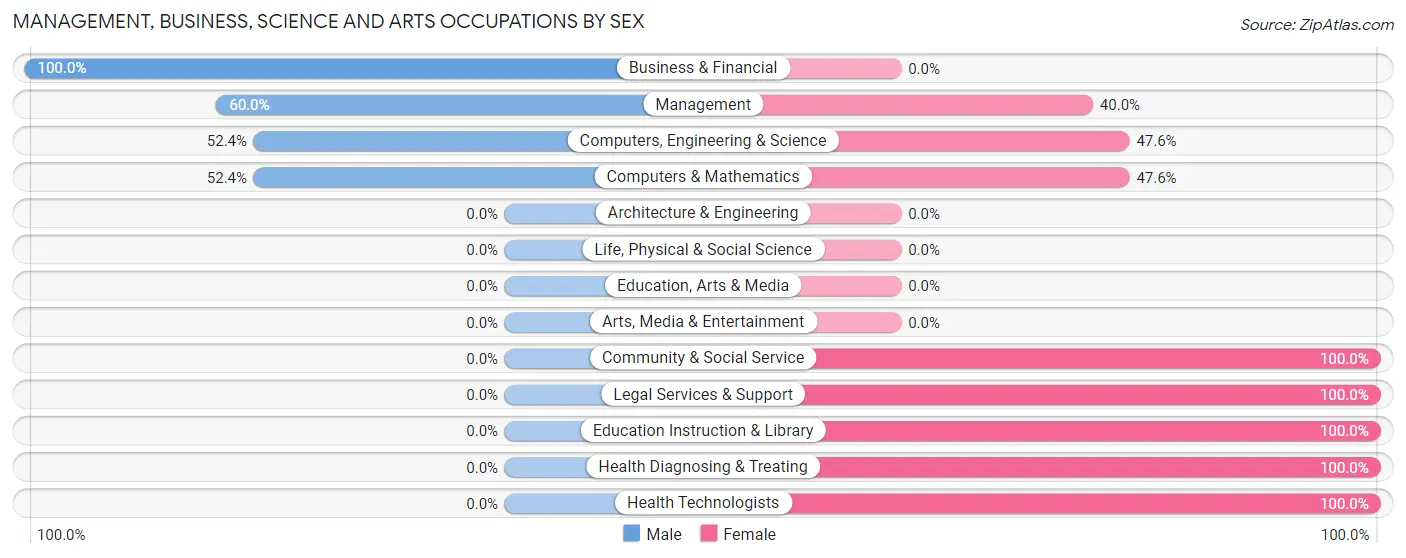
Management, Business, Science and Arts Occupations by Sex
Within the Management, Business, Science and Arts occupations in Westlake Corner, the most male-oriented occupations are Business & Financial (100.0%), Management (60.0%), and Computers, Engineering & Science (52.4%), while the most female-oriented occupations are Community & Social Service (100.0%), Legal Services & Support (100.0%), and Education Instruction & Library (100.0%).
| Occupation | Male | Female |
| Management | 18 (60.0%) | 12 (40.0%) |
| Business & Financial | 23 (100.0%) | 0 (0.0%) |
| Computers, Engineering & Science | 11 (52.4%) | 10 (47.6%) |
| Computers & Mathematics | 11 (52.4%) | 10 (47.6%) |
| Architecture & Engineering | 0 (0.0%) | 0 (0.0%) |
| Life, Physical & Social Science | 0 (0.0%) | 0 (0.0%) |
| Community & Social Service | 0 (0.0%) | 46 (100.0%) |
| Education, Arts & Media | 0 (0.0%) | 0 (0.0%) |
| Legal Services & Support | 0 (0.0%) | 19 (100.0%) |
| Education Instruction & Library | 0 (0.0%) | 27 (100.0%) |
| Arts, Media & Entertainment | 0 (0.0%) | 0 (0.0%) |
| Health Diagnosing & Treating | 0 (0.0%) | 69 (100.0%) |
| Health Technologists | 0 (0.0%) | 69 (100.0%) |
| Total (Category) | 52 (27.5%) | 137 (72.5%) |
| Total (Overall) | 193 (24.7%) | 587 (75.3%) |
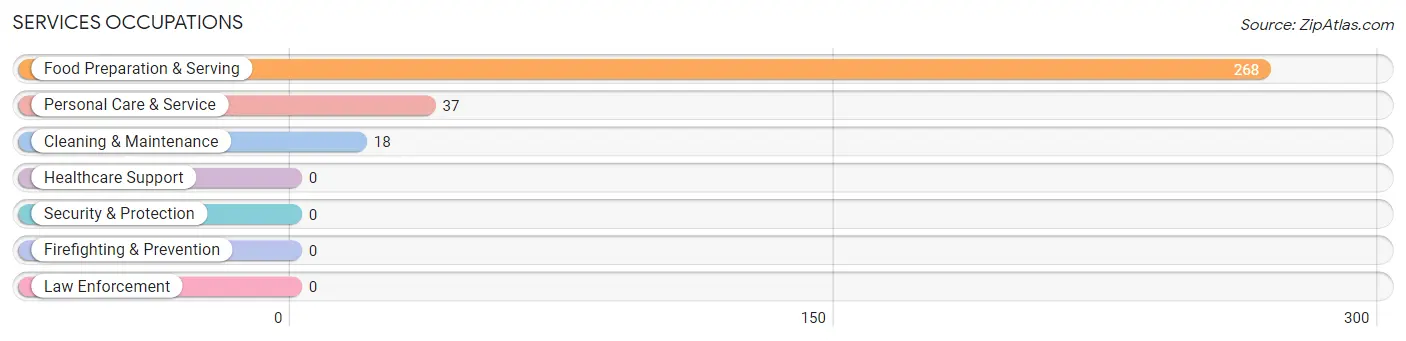
Services Occupations
The most common Services occupations in Westlake Corner are Food Preparation & Serving (268 | 34.4%), Personal Care & Service (37 | 4.7%), and Cleaning & Maintenance (18 | 2.3%).
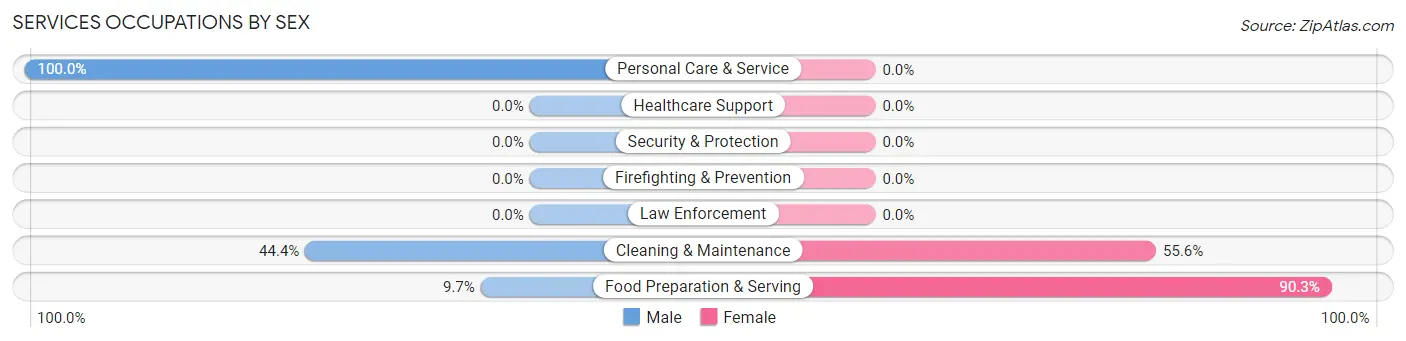
Services Occupations by Sex
Within the Services occupations in Westlake Corner, the most male-oriented occupations are Personal Care & Service (100.0%), Cleaning & Maintenance (44.4%), and Food Preparation & Serving (9.7%), while the most female-oriented occupations are Food Preparation & Serving (90.3%), and Cleaning & Maintenance (55.6%).
| Occupation | Male | Female |
| Healthcare Support | 0 (0.0%) | 0 (0.0%) |
| Security & Protection | 0 (0.0%) | 0 (0.0%) |
| Firefighting & Prevention | 0 (0.0%) | 0 (0.0%) |
| Law Enforcement | 0 (0.0%) | 0 (0.0%) |
| Food Preparation & Serving | 26 (9.7%) | 242 (90.3%) |
| Cleaning & Maintenance | 8 (44.4%) | 10 (55.6%) |
| Personal Care & Service | 37 (100.0%) | 0 (0.0%) |
| Total (Category) | 71 (22.0%) | 252 (78.0%) |
| Total (Overall) | 193 (24.7%) | 587 (75.3%) |
Sales and Office Occupations
The most common Sales and Office occupations in Westlake Corner are Office & Administration (53 | 6.8%), and Sales & Related (11 | 1.4%).
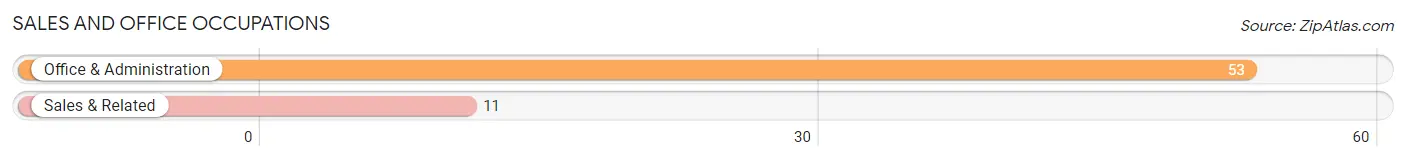
Sales and Office Occupations by Sex
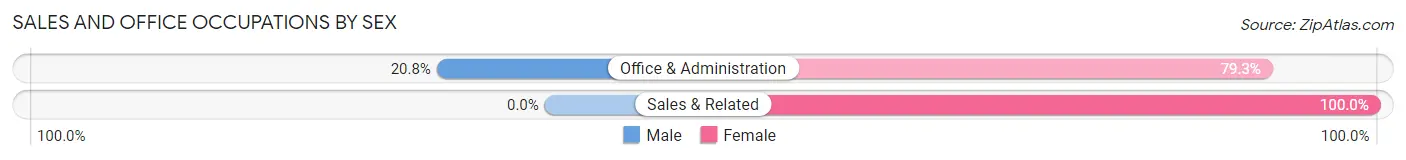
| Occupation | Male | Female |
| Sales & Related | 0 (0.0%) | 11 (100.0%) |
| Office & Administration | 11 (20.7%) | 42 (79.2%) |
| Total (Category) | 11 (17.2%) | 53 (82.8%) |
| Total (Overall) | 193 (24.7%) | 587 (75.3%) |
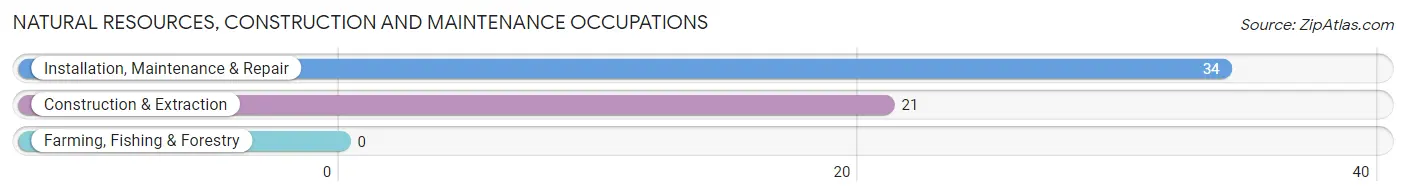
Natural Resources, Construction and Maintenance Occupations
The most common Natural Resources, Construction and Maintenance occupations in Westlake Corner are Installation, Maintenance & Repair (34 | 4.4%), and Construction & Extraction (21 | 2.7%).
Natural Resources, Construction and Maintenance Occupations by Sex
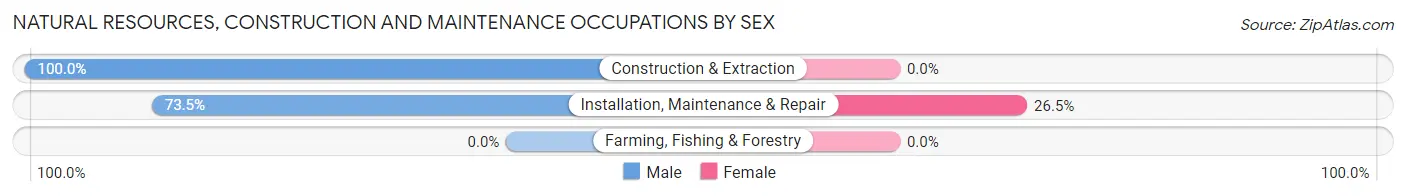
| Occupation | Male | Female |
| Farming, Fishing & Forestry | 0 (0.0%) | 0 (0.0%) |
| Construction & Extraction | 21 (100.0%) | 0 (0.0%) |
| Installation, Maintenance & Repair | 25 (73.5%) | 9 (26.5%) |
| Total (Category) | 46 (83.6%) | 9 (16.4%) |
| Total (Overall) | 193 (24.7%) | 587 (75.3%) |
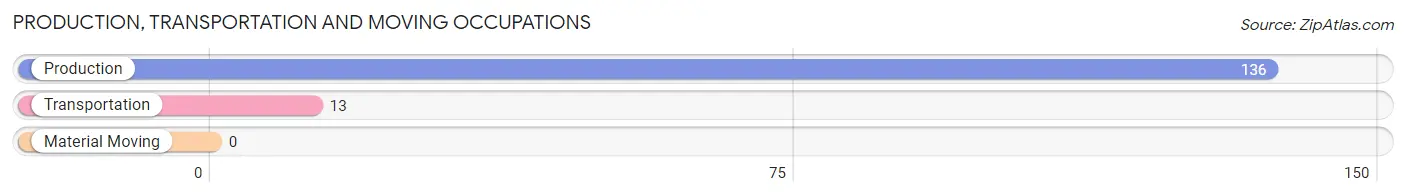
Production, Transportation and Moving Occupations
The most common Production, Transportation and Moving occupations in Westlake Corner are Production (136 | 17.4%), and Transportation (13 | 1.7%).
Production, Transportation and Moving Occupations by Sex
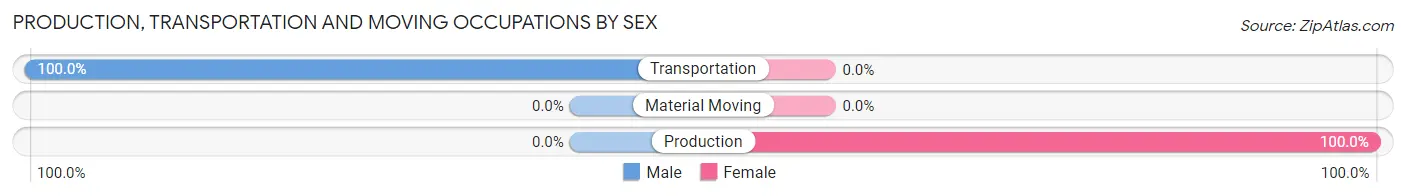
| Occupation | Male | Female |
| Production | 0 (0.0%) | 136 (100.0%) |
| Transportation | 13 (100.0%) | 0 (0.0%) |
| Material Moving | 0 (0.0%) | 0 (0.0%) |
| Total (Category) | 13 (8.7%) | 136 (91.3%) |
| Total (Overall) | 193 (24.7%) | 587 (75.3%) |
Employment Industries by Sex in Westlake Corner
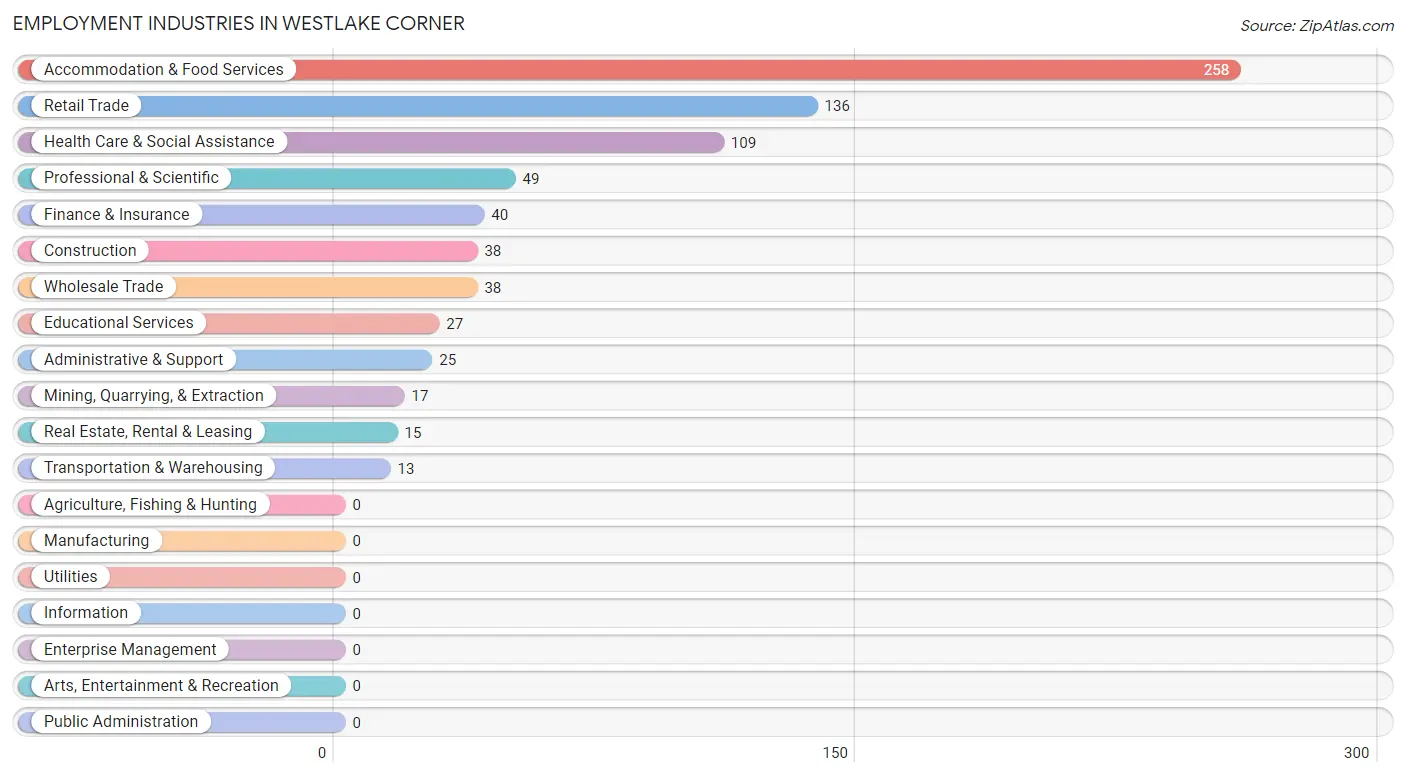
Employment Industries in Westlake Corner
The major employment industries in Westlake Corner include Accommodation & Food Services (258 | 33.1%), Retail Trade (136 | 17.4%), Health Care & Social Assistance (109 | 14.0%), Professional & Scientific (49 | 6.3%), and Finance & Insurance (40 | 5.1%).
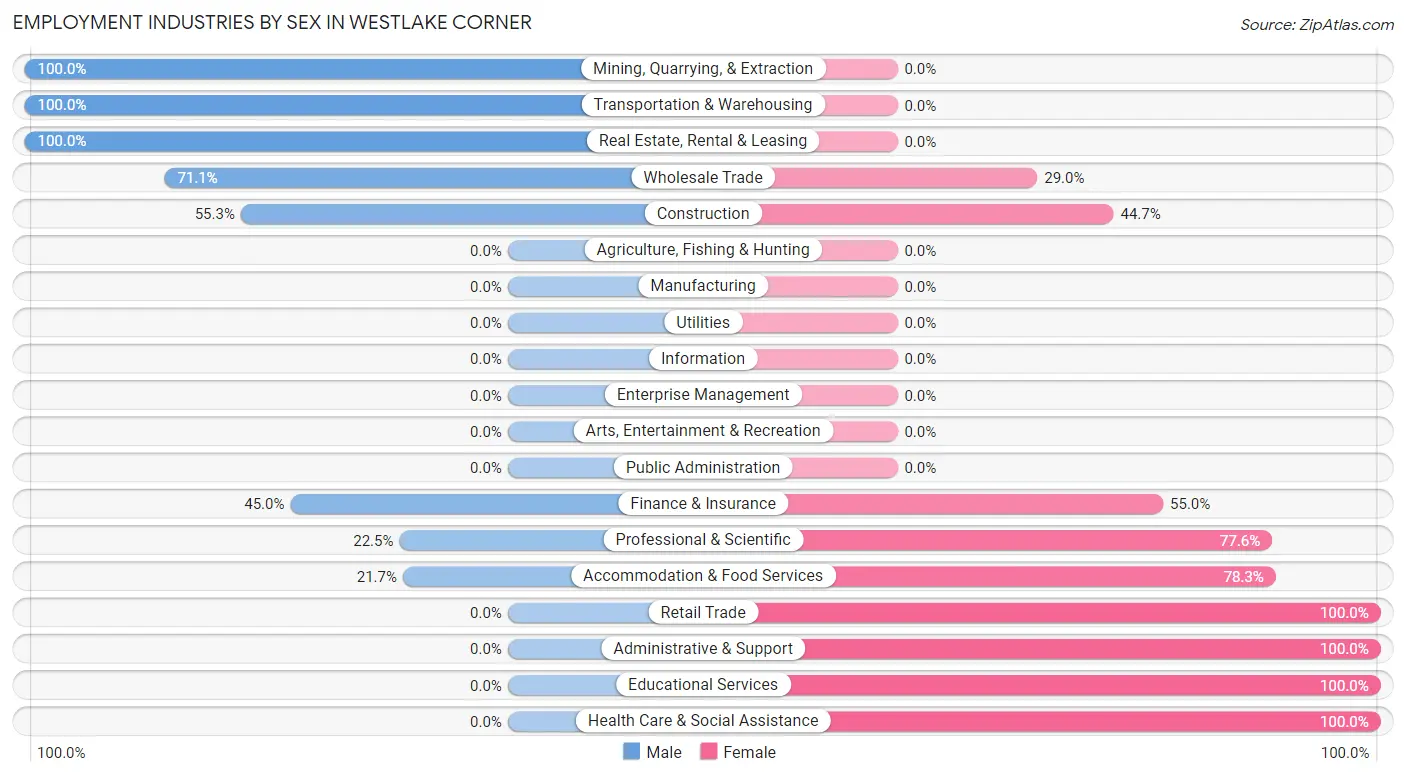
Employment Industries by Sex in Westlake Corner
The Westlake Corner industries that see more men than women are Mining, Quarrying, & Extraction (100.0%), Transportation & Warehousing (100.0%), and Real Estate, Rental & Leasing (100.0%), whereas the industries that tend to have a higher number of women are Retail Trade (100.0%), Administrative & Support (100.0%), and Educational Services (100.0%).
| Industry | Male | Female |
| Agriculture, Fishing & Hunting | 0 (0.0%) | 0 (0.0%) |
| Mining, Quarrying, & Extraction | 17 (100.0%) | 0 (0.0%) |
| Construction | 21 (55.3%) | 17 (44.7%) |
| Manufacturing | 0 (0.0%) | 0 (0.0%) |
| Wholesale Trade | 27 (71.1%) | 11 (28.9%) |
| Retail Trade | 0 (0.0%) | 136 (100.0%) |
| Transportation & Warehousing | 13 (100.0%) | 0 (0.0%) |
| Utilities | 0 (0.0%) | 0 (0.0%) |
| Information | 0 (0.0%) | 0 (0.0%) |
| Finance & Insurance | 18 (45.0%) | 22 (55.0%) |
| Real Estate, Rental & Leasing | 15 (100.0%) | 0 (0.0%) |
| Professional & Scientific | 11 (22.5%) | 38 (77.5%) |
| Enterprise Management | 0 (0.0%) | 0 (0.0%) |
| Administrative & Support | 0 (0.0%) | 25 (100.0%) |
| Educational Services | 0 (0.0%) | 27 (100.0%) |
| Health Care & Social Assistance | 0 (0.0%) | 109 (100.0%) |
| Arts, Entertainment & Recreation | 0 (0.0%) | 0 (0.0%) |
| Accommodation & Food Services | 56 (21.7%) | 202 (78.3%) |
| Public Administration | 0 (0.0%) | 0 (0.0%) |
| Total | 193 (24.7%) | 587 (75.3%) |
Education in Westlake Corner
School Enrollment in Westlake Corner
The most common levels of schooling among the 279 students in Westlake Corner are high school (126 | 45.2%), elementary school (53 | 19.0%), and college / undergraduate (52 | 18.6%).
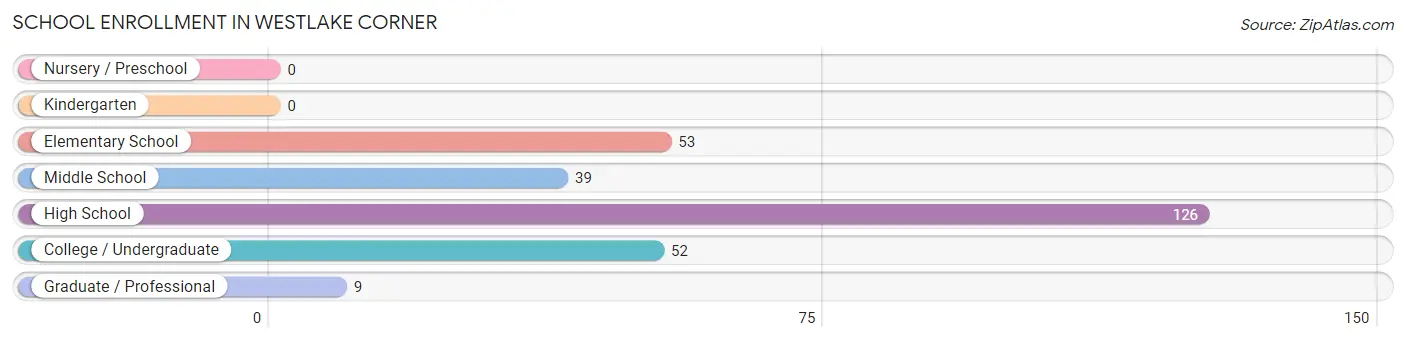
| School Level | # Students | % Students |
| Nursery / Preschool | 0 | 0.0% |
| Kindergarten | 0 | 0.0% |
| Elementary School | 53 | 19.0% |
| Middle School | 39 | 14.0% |
| High School | 126 | 45.2% |
| College / Undergraduate | 52 | 18.6% |
| Graduate / Professional | 9 | 3.2% |
| Total | 279 | 100.0% |
School Enrollment by Age by Funding Source in Westlake Corner
Out of a total of 279 students who are enrolled in schools in Westlake Corner, 32 (11.5%) attend a private institution, while the remaining 247 (88.5%) are enrolled in public schools. The age group of 35 years and over has the highest likelihood of being enrolled in private schools, with 9 (100.0% in the age bracket) enrolled. Conversely, the age group of 5 to 9 year old has the lowest likelihood of being enrolled in a private school, with 47 (100.0% in the age bracket) attending a public institution.
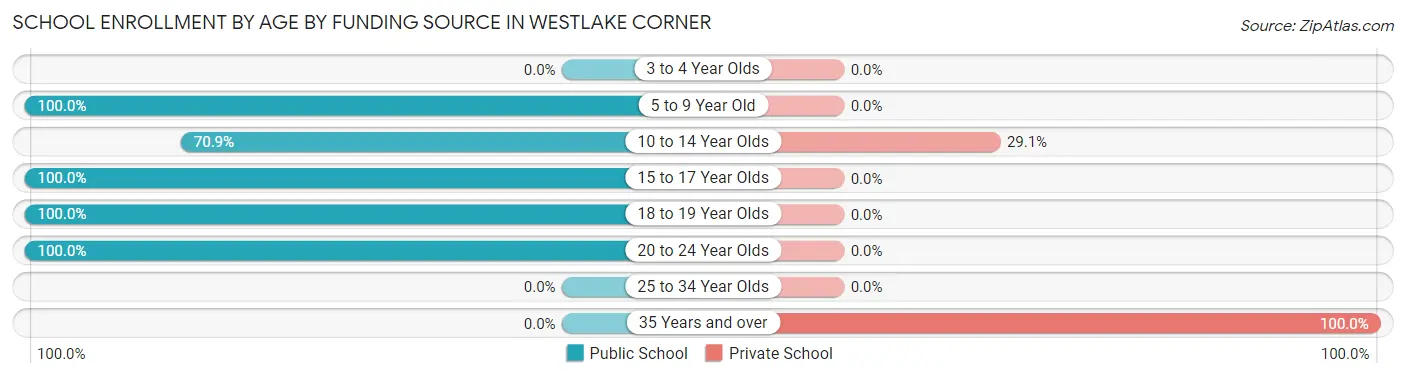
| Age Bracket | Public School | Private School |
| 3 to 4 Year Olds | 0 (0.0%) | 0 (0.0%) |
| 5 to 9 Year Old | 47 (100.0%) | 0 (0.0%) |
| 10 to 14 Year Olds | 56 (70.9%) | 23 (29.1%) |
| 15 to 17 Year Olds | 51 (100.0%) | 0 (0.0%) |
| 18 to 19 Year Olds | 41 (100.0%) | 0 (0.0%) |
| 20 to 24 Year Olds | 52 (100.0%) | 0 (0.0%) |
| 25 to 34 Year Olds | 0 (0.0%) | 0 (0.0%) |
| 35 Years and over | 0 (0.0%) | 9 (100.0%) |
| Total | 247 (88.5%) | 32 (11.5%) |
Educational Attainment by Field of Study in Westlake Corner
Science & technology (147 | 33.0%), engineering (64 | 14.3%), computers & mathematics (58 | 13.0%), education (45 | 10.1%), and bio, nature & agricultural (38 | 8.5%) are the most common fields of study among 446 individuals in Westlake Corner who have obtained a bachelor's degree or higher.
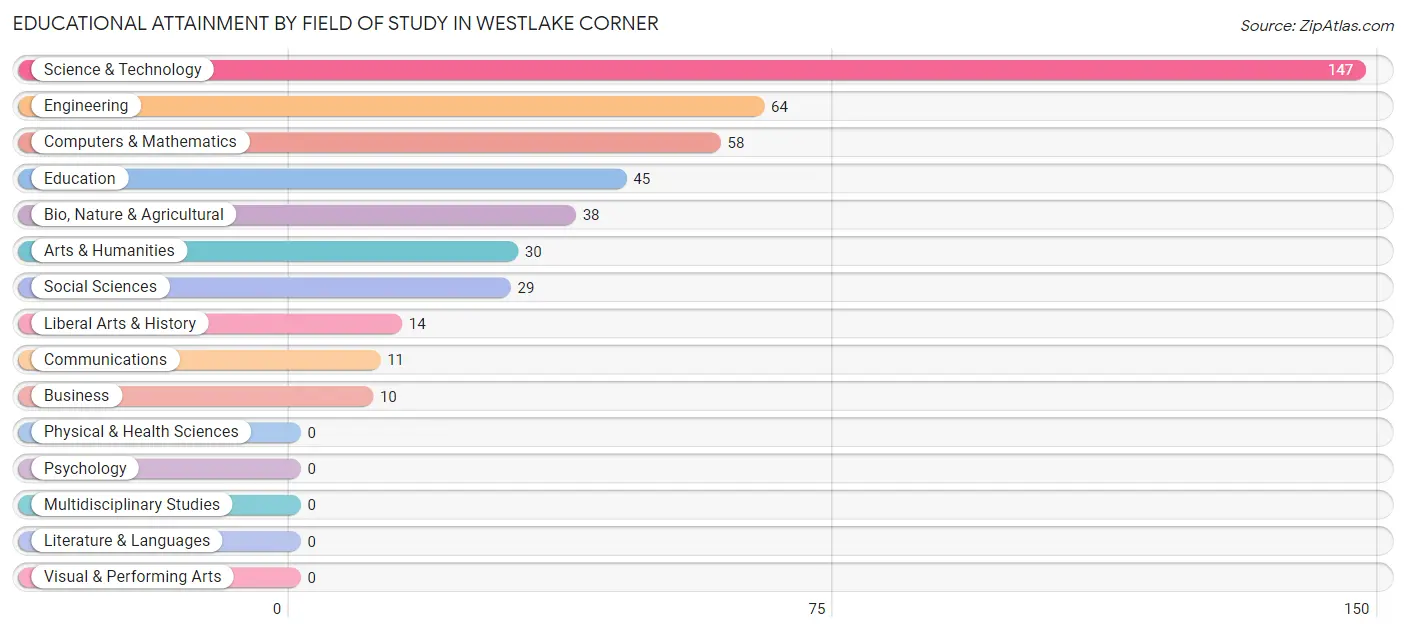
| Field of Study | # Graduates | % Graduates |
| Computers & Mathematics | 58 | 13.0% |
| Bio, Nature & Agricultural | 38 | 8.5% |
| Physical & Health Sciences | 0 | 0.0% |
| Psychology | 0 | 0.0% |
| Social Sciences | 29 | 6.5% |
| Engineering | 64 | 14.3% |
| Multidisciplinary Studies | 0 | 0.0% |
| Science & Technology | 147 | 33.0% |
| Business | 10 | 2.2% |
| Education | 45 | 10.1% |
| Literature & Languages | 0 | 0.0% |
| Liberal Arts & History | 14 | 3.1% |
| Visual & Performing Arts | 0 | 0.0% |
| Communications | 11 | 2.5% |
| Arts & Humanities | 30 | 6.7% |
| Total | 446 | 100.0% |
Transportation & Commute in Westlake Corner
Vehicle Availability by Sex in Westlake Corner
The most prevalent vehicle ownership categories in Westlake Corner are males with 3 vehicles (82, accounting for 42.5%) and females with 3 vehicles (279, making up 18.7%).
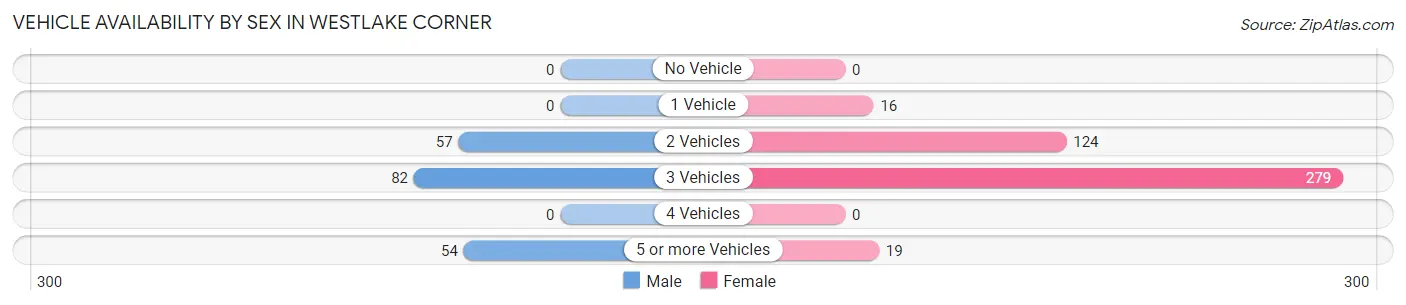
| Vehicles Available | Male | Female |
| No Vehicle | 0 (0.0%) | 0 (0.0%) |
| 1 Vehicle | 0 (0.0%) | 16 (3.6%) |
| 2 Vehicles | 57 (29.5%) | 124 (28.3%) |
| 3 Vehicles | 82 (42.5%) | 279 (63.7%) |
| 4 Vehicles | 0 (0.0%) | 0 (0.0%) |
| 5 or more Vehicles | 54 (28.0%) | 19 (4.3%) |
| Total | 193 (100.0%) | 438 (100.0%) |
Commute Time in Westlake Corner
The most frequently occuring commute durations in Westlake Corner are 5 to 9 minutes (276 commuters, 51.8%), 45 to 59 minutes (116 commuters, 21.8%), and 35 to 39 minutes (36 commuters, 6.8%).
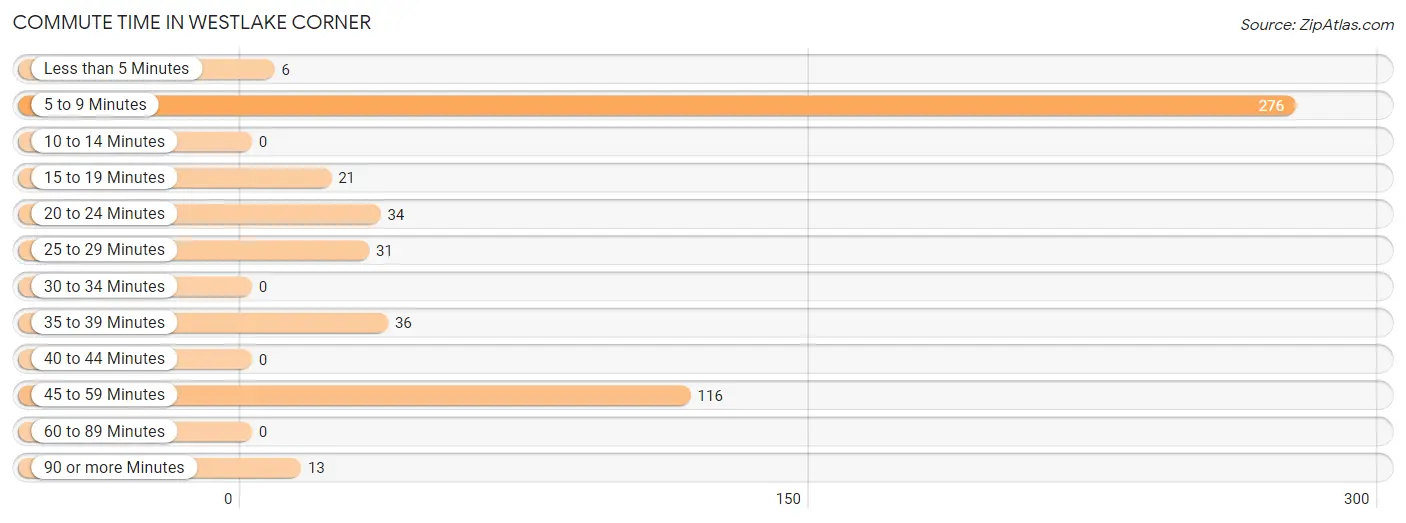
| Commute Time | # Commuters | % Commuters |
| Less than 5 Minutes | 6 | 1.1% |
| 5 to 9 Minutes | 276 | 51.8% |
| 10 to 14 Minutes | 0 | 0.0% |
| 15 to 19 Minutes | 21 | 3.9% |
| 20 to 24 Minutes | 34 | 6.4% |
| 25 to 29 Minutes | 31 | 5.8% |
| 30 to 34 Minutes | 0 | 0.0% |
| 35 to 39 Minutes | 36 | 6.8% |
| 40 to 44 Minutes | 0 | 0.0% |
| 45 to 59 Minutes | 116 | 21.8% |
| 60 to 89 Minutes | 0 | 0.0% |
| 90 or more Minutes | 13 | 2.4% |
Commute Time by Sex in Westlake Corner
The most common commute times in Westlake Corner are 5 to 9 minutes (77 commuters, 47.2%) for males and 5 to 9 minutes (199 commuters, 53.8%) for females.
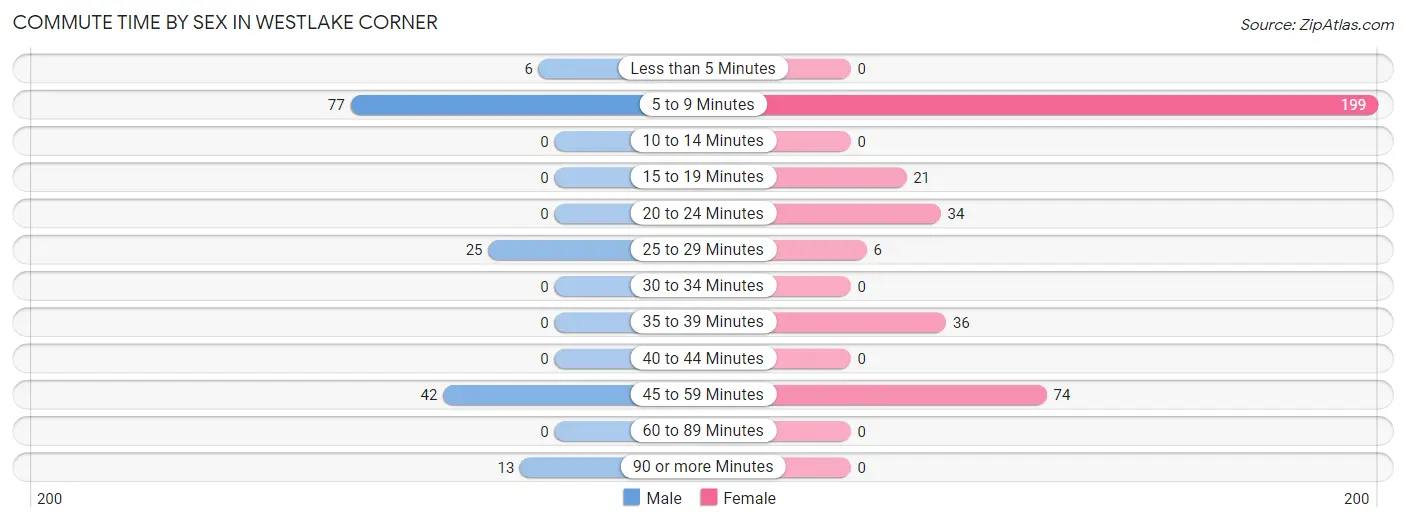
| Commute Time | Male | Female |
| Less than 5 Minutes | 6 (3.7%) | 0 (0.0%) |
| 5 to 9 Minutes | 77 (47.2%) | 199 (53.8%) |
| 10 to 14 Minutes | 0 (0.0%) | 0 (0.0%) |
| 15 to 19 Minutes | 0 (0.0%) | 21 (5.7%) |
| 20 to 24 Minutes | 0 (0.0%) | 34 (9.2%) |
| 25 to 29 Minutes | 25 (15.3%) | 6 (1.6%) |
| 30 to 34 Minutes | 0 (0.0%) | 0 (0.0%) |
| 35 to 39 Minutes | 0 (0.0%) | 36 (9.7%) |
| 40 to 44 Minutes | 0 (0.0%) | 0 (0.0%) |
| 45 to 59 Minutes | 42 (25.8%) | 74 (20.0%) |
| 60 to 89 Minutes | 0 (0.0%) | 0 (0.0%) |
| 90 or more Minutes | 13 (8.0%) | 0 (0.0%) |
Time of Departure to Work by Sex in Westlake Corner
The most frequent times of departure to work in Westlake Corner are 7:30 AM to 7:59 AM (39, 23.9%) for males and 7:00 AM to 7:29 AM (231, 62.4%) for females.
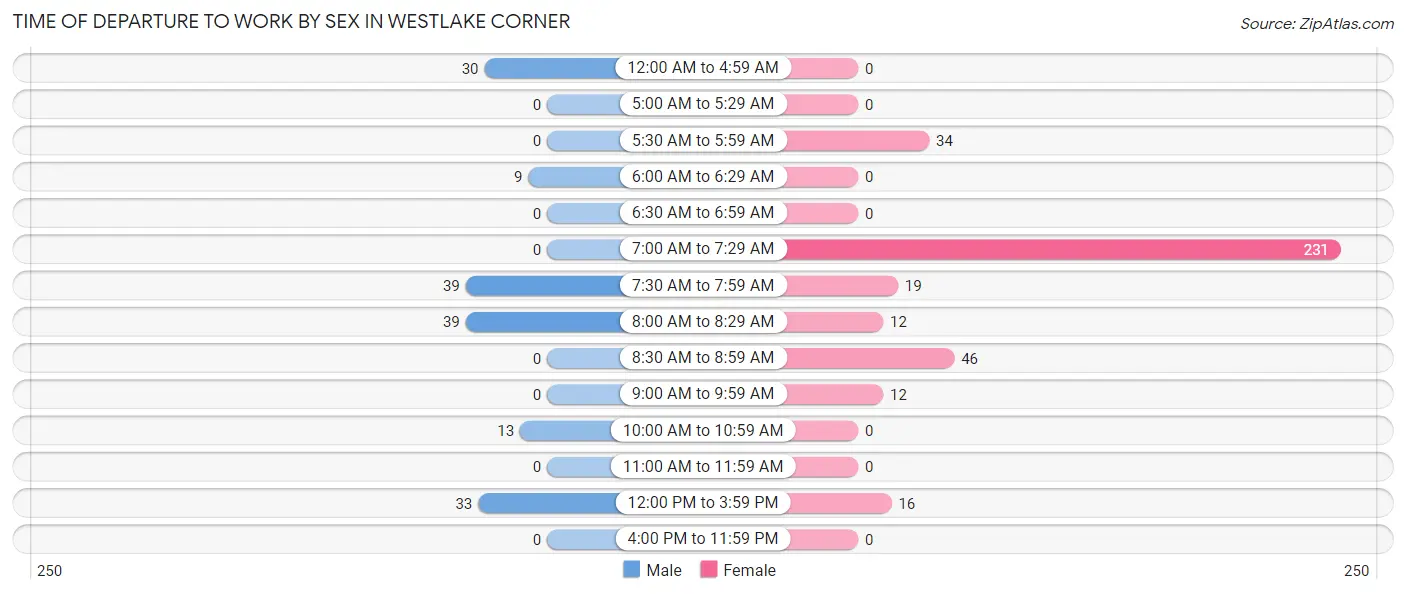
| Time of Departure | Male | Female |
| 12:00 AM to 4:59 AM | 30 (18.4%) | 0 (0.0%) |
| 5:00 AM to 5:29 AM | 0 (0.0%) | 0 (0.0%) |
| 5:30 AM to 5:59 AM | 0 (0.0%) | 34 (9.2%) |
| 6:00 AM to 6:29 AM | 9 (5.5%) | 0 (0.0%) |
| 6:30 AM to 6:59 AM | 0 (0.0%) | 0 (0.0%) |
| 7:00 AM to 7:29 AM | 0 (0.0%) | 231 (62.4%) |
| 7:30 AM to 7:59 AM | 39 (23.9%) | 19 (5.1%) |
| 8:00 AM to 8:29 AM | 39 (23.9%) | 12 (3.2%) |
| 8:30 AM to 8:59 AM | 0 (0.0%) | 46 (12.4%) |
| 9:00 AM to 9:59 AM | 0 (0.0%) | 12 (3.2%) |
| 10:00 AM to 10:59 AM | 13 (8.0%) | 0 (0.0%) |
| 11:00 AM to 11:59 AM | 0 (0.0%) | 0 (0.0%) |
| 12:00 PM to 3:59 PM | 33 (20.3%) | 16 (4.3%) |
| 4:00 PM to 11:59 PM | 0 (0.0%) | 0 (0.0%) |
| Total | 163 (100.0%) | 370 (100.0%) |
Housing Occupancy in Westlake Corner
Occupancy by Ownership in Westlake Corner
Of the total 713 dwellings in Westlake Corner, owner-occupied units account for 568 (79.7%), while renter-occupied units make up 145 (20.3%).
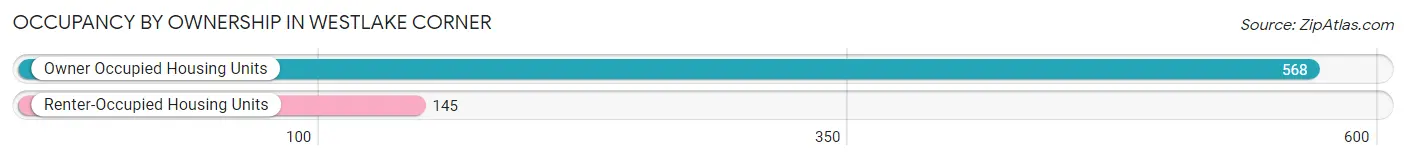
| Occupancy | # Housing Units | % Housing Units |
| Owner Occupied Housing Units | 568 | 79.7% |
| Renter-Occupied Housing Units | 145 | 20.3% |
| Total Occupied Housing Units | 713 | 100.0% |
Occupancy by Household Size in Westlake Corner
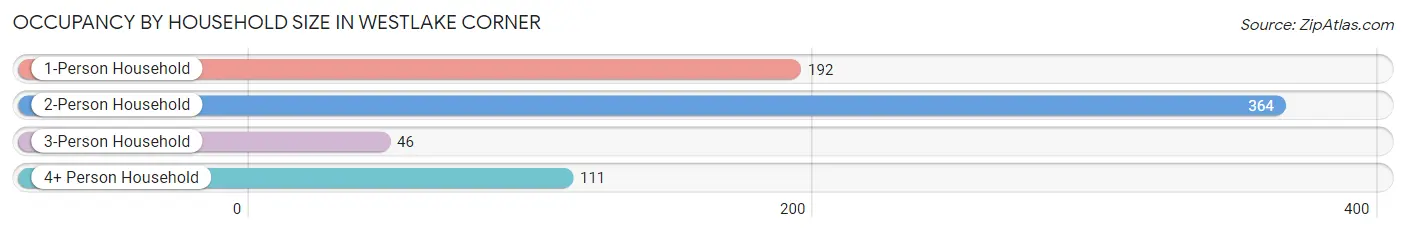
| Household Size | # Housing Units | % Housing Units |
| 1-Person Household | 192 | 26.9% |
| 2-Person Household | 364 | 51.0% |
| 3-Person Household | 46 | 6.5% |
| 4+ Person Household | 111 | 15.6% |
| Total Housing Units | 713 | 100.0% |
Occupancy by Ownership by Household Size in Westlake Corner
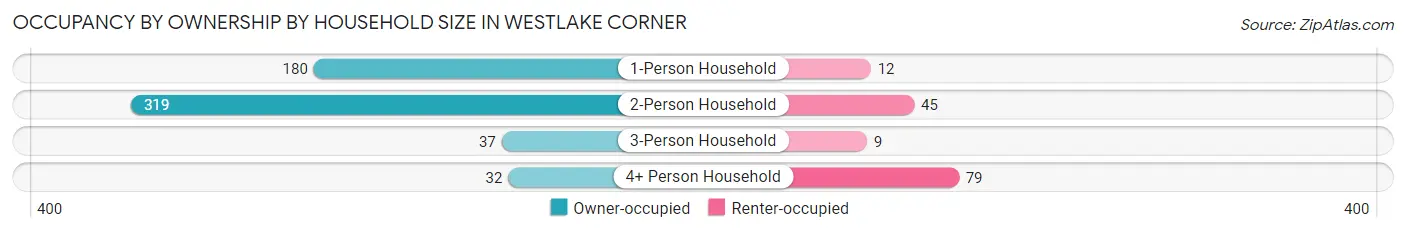
| Household Size | Owner-occupied | Renter-occupied |
| 1-Person Household | 180 (93.8%) | 12 (6.2%) |
| 2-Person Household | 319 (87.6%) | 45 (12.4%) |
| 3-Person Household | 37 (80.4%) | 9 (19.6%) |
| 4+ Person Household | 32 (28.8%) | 79 (71.2%) |
| Total Housing Units | 568 (79.7%) | 145 (20.3%) |
Occupancy by Educational Attainment in Westlake Corner
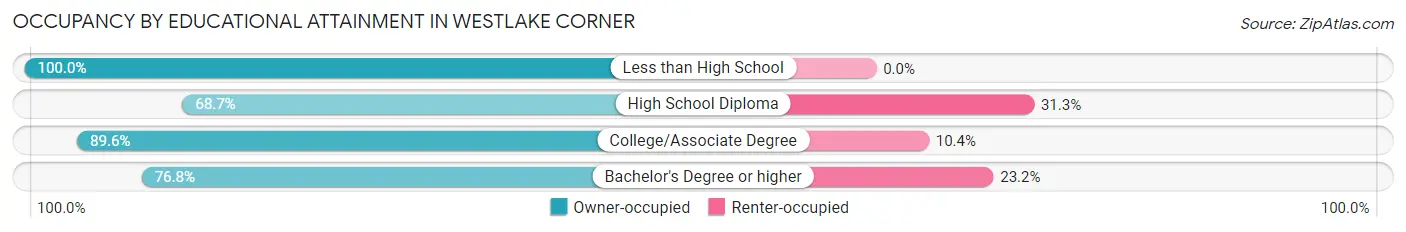
| Household Size | Owner-occupied | Renter-occupied |
| Less than High School | 13 (100.0%) | 0 (0.0%) |
| High School Diploma | 101 (68.7%) | 46 (31.3%) |
| College/Associate Degree | 206 (89.6%) | 24 (10.4%) |
| Bachelor's Degree or higher | 248 (76.8%) | 75 (23.2%) |
Occupancy by Age of Householder in Westlake Corner
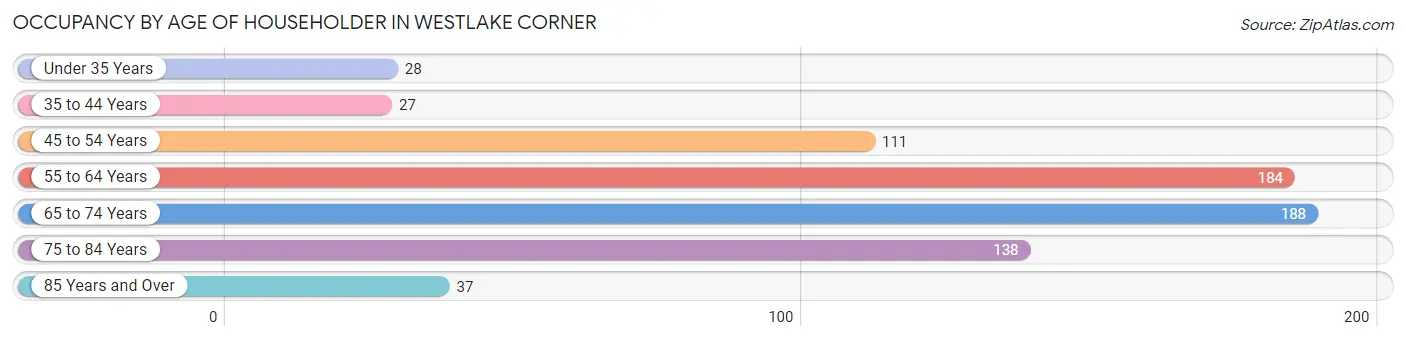
| Age Bracket | # Households | % Households |
| Under 35 Years | 28 | 3.9% |
| 35 to 44 Years | 27 | 3.8% |
| 45 to 54 Years | 111 | 15.6% |
| 55 to 64 Years | 184 | 25.8% |
| 65 to 74 Years | 188 | 26.4% |
| 75 to 84 Years | 138 | 19.4% |
| 85 Years and Over | 37 | 5.2% |
| Total | 713 | 100.0% |
Housing Finances in Westlake Corner
Median Income by Occupancy in Westlake Corner
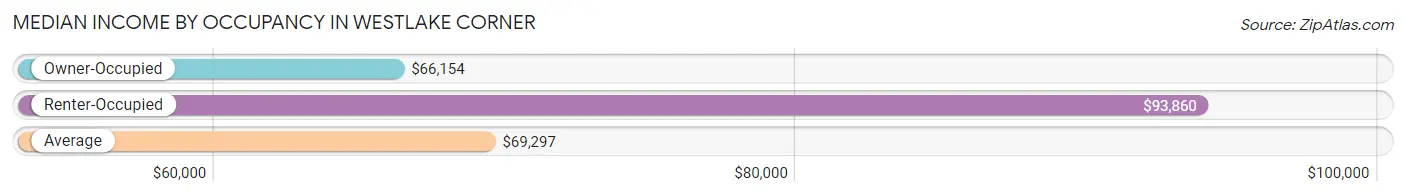
| Occupancy Type | # Households | Median Income |
| Owner-Occupied | 568 (79.7%) | $66,154 |
| Renter-Occupied | 145 (20.3%) | $93,860 |
| Average | 713 (100.0%) | $69,297 |
Occupancy by Householder Income Bracket in Westlake Corner
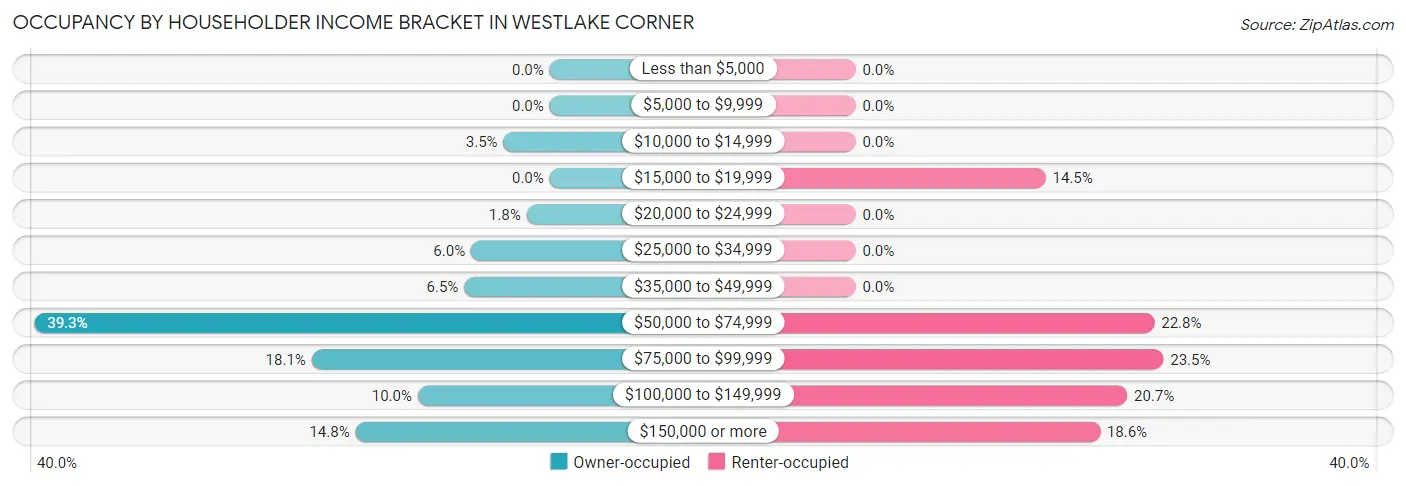
| Income Bracket | Owner-occupied | Renter-occupied |
| Less than $5,000 | 0 (0.0%) | 0 (0.0%) |
| $5,000 to $9,999 | 0 (0.0%) | 0 (0.0%) |
| $10,000 to $14,999 | 20 (3.5%) | 0 (0.0%) |
| $15,000 to $19,999 | 0 (0.0%) | 21 (14.5%) |
| $20,000 to $24,999 | 10 (1.8%) | 0 (0.0%) |
| $25,000 to $34,999 | 34 (6.0%) | 0 (0.0%) |
| $35,000 to $49,999 | 37 (6.5%) | 0 (0.0%) |
| $50,000 to $74,999 | 223 (39.3%) | 33 (22.8%) |
| $75,000 to $99,999 | 103 (18.1%) | 34 (23.4%) |
| $100,000 to $149,999 | 57 (10.0%) | 30 (20.7%) |
| $150,000 or more | 84 (14.8%) | 27 (18.6%) |
| Total | 568 (100.0%) | 145 (100.0%) |
Monthly Housing Cost Tiers in Westlake Corner
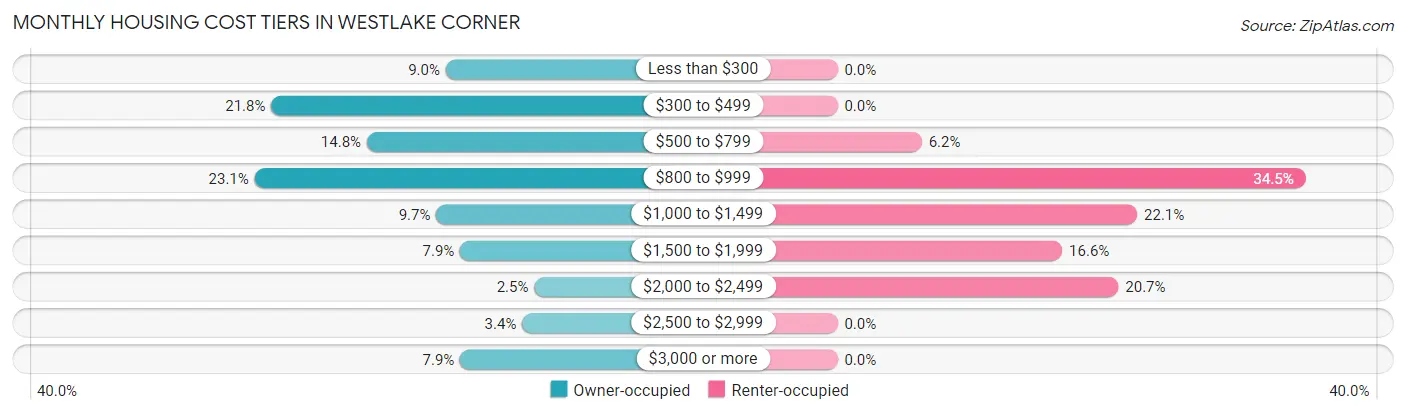
| Monthly Cost | Owner-occupied | Renter-occupied |
| Less than $300 | 51 (9.0%) | 0 (0.0%) |
| $300 to $499 | 124 (21.8%) | 0 (0.0%) |
| $500 to $799 | 84 (14.8%) | 9 (6.2%) |
| $800 to $999 | 131 (23.1%) | 50 (34.5%) |
| $1,000 to $1,499 | 55 (9.7%) | 32 (22.1%) |
| $1,500 to $1,999 | 45 (7.9%) | 24 (16.6%) |
| $2,000 to $2,499 | 14 (2.5%) | 30 (20.7%) |
| $2,500 to $2,999 | 19 (3.4%) | 0 (0.0%) |
| $3,000 or more | 45 (7.9%) | 0 (0.0%) |
| Total | 568 (100.0%) | 145 (100.0%) |
Physical Housing Characteristics in Westlake Corner
Housing Structures in Westlake Corner
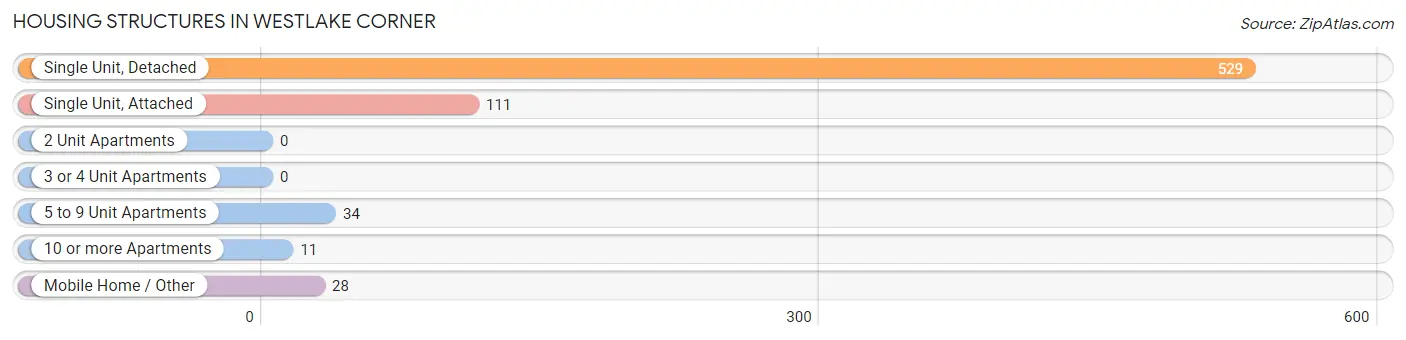
| Structure Type | # Housing Units | % Housing Units |
| Single Unit, Detached | 529 | 74.2% |
| Single Unit, Attached | 111 | 15.6% |
| 2 Unit Apartments | 0 | 0.0% |
| 3 or 4 Unit Apartments | 0 | 0.0% |
| 5 to 9 Unit Apartments | 34 | 4.8% |
| 10 or more Apartments | 11 | 1.5% |
| Mobile Home / Other | 28 | 3.9% |
| Total | 713 | 100.0% |
Housing Structures by Occupancy in Westlake Corner
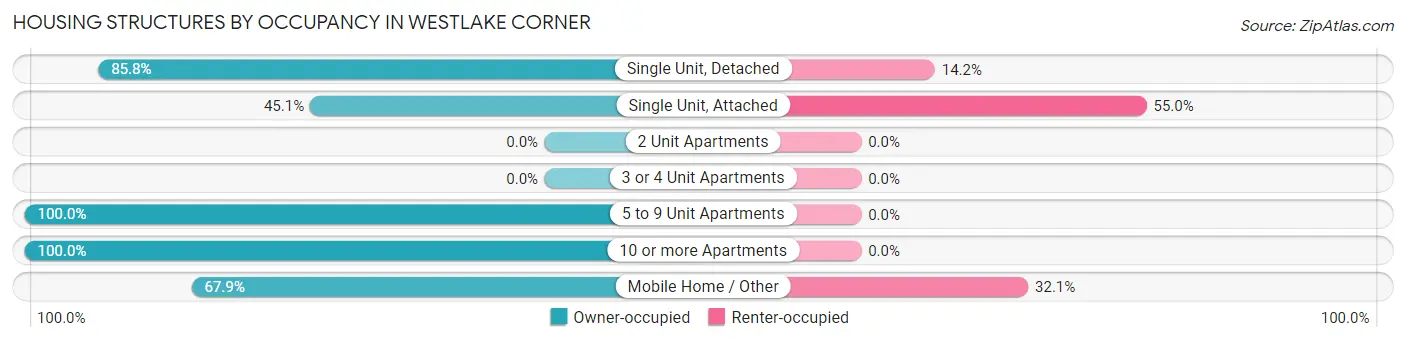
| Structure Type | Owner-occupied | Renter-occupied |
| Single Unit, Detached | 454 (85.8%) | 75 (14.2%) |
| Single Unit, Attached | 50 (45.1%) | 61 (54.9%) |
| 2 Unit Apartments | 0 (0.0%) | 0 (0.0%) |
| 3 or 4 Unit Apartments | 0 (0.0%) | 0 (0.0%) |
| 5 to 9 Unit Apartments | 34 (100.0%) | 0 (0.0%) |
| 10 or more Apartments | 11 (100.0%) | 0 (0.0%) |
| Mobile Home / Other | 19 (67.9%) | 9 (32.1%) |
| Total | 568 (79.7%) | 145 (20.3%) |
Housing Structures by Number of Rooms in Westlake Corner
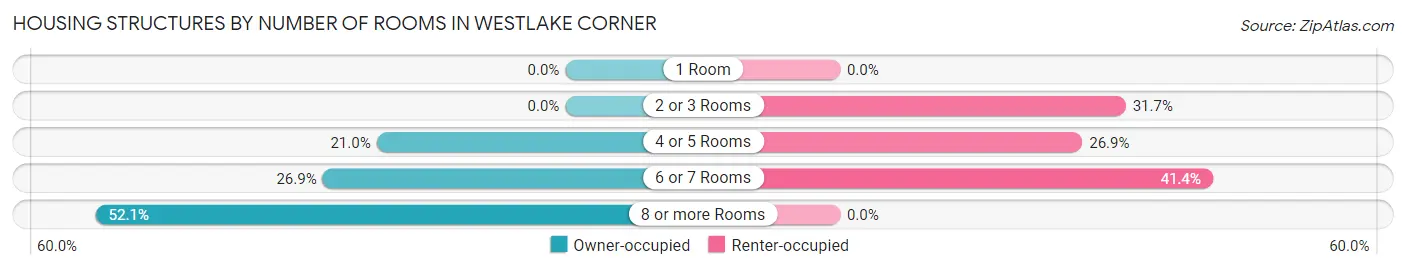
| Number of Rooms | Owner-occupied | Renter-occupied |
| 1 Room | 0 (0.0%) | 0 (0.0%) |
| 2 or 3 Rooms | 0 (0.0%) | 46 (31.7%) |
| 4 or 5 Rooms | 119 (20.9%) | 39 (26.9%) |
| 6 or 7 Rooms | 153 (26.9%) | 60 (41.4%) |
| 8 or more Rooms | 296 (52.1%) | 0 (0.0%) |
| Total | 568 (100.0%) | 145 (100.0%) |
Housing Structure by Heating Type in Westlake Corner
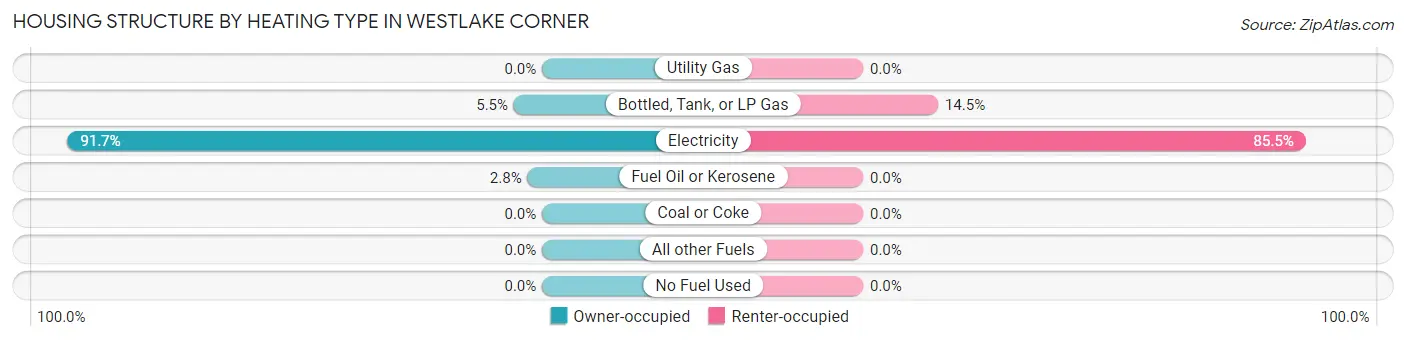
| Heating Type | Owner-occupied | Renter-occupied |
| Utility Gas | 0 (0.0%) | 0 (0.0%) |
| Bottled, Tank, or LP Gas | 31 (5.5%) | 21 (14.5%) |
| Electricity | 521 (91.7%) | 124 (85.5%) |
| Fuel Oil or Kerosene | 16 (2.8%) | 0 (0.0%) |
| Coal or Coke | 0 (0.0%) | 0 (0.0%) |
| All other Fuels | 0 (0.0%) | 0 (0.0%) |
| No Fuel Used | 0 (0.0%) | 0 (0.0%) |
| Total | 568 (100.0%) | 145 (100.0%) |
Household Vehicle Usage in Westlake Corner
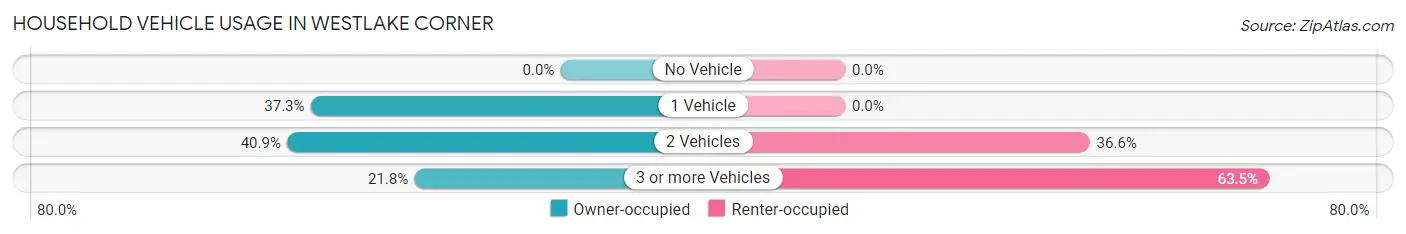
| Vehicles per Household | Owner-occupied | Renter-occupied |
| No Vehicle | 0 (0.0%) | 0 (0.0%) |
| 1 Vehicle | 212 (37.3%) | 0 (0.0%) |
| 2 Vehicles | 232 (40.8%) | 53 (36.5%) |
| 3 or more Vehicles | 124 (21.8%) | 92 (63.4%) |
| Total | 568 (100.0%) | 145 (100.0%) |
Real Estate & Mortgages in Westlake Corner
Real Estate and Mortgage Overview in Westlake Corner
| Characteristic | Without Mortgage | With Mortgage |
| Housing Units | 263 | 305 |
| Median Property Value | $366,100 | $399,500 |
| Median Household Income | $58,705 | $66 |
| Monthly Housing Costs | $464 | $45 |
| Real Estate Taxes | $1,782 | $0 |
Property Value by Mortgage Status in Westlake Corner
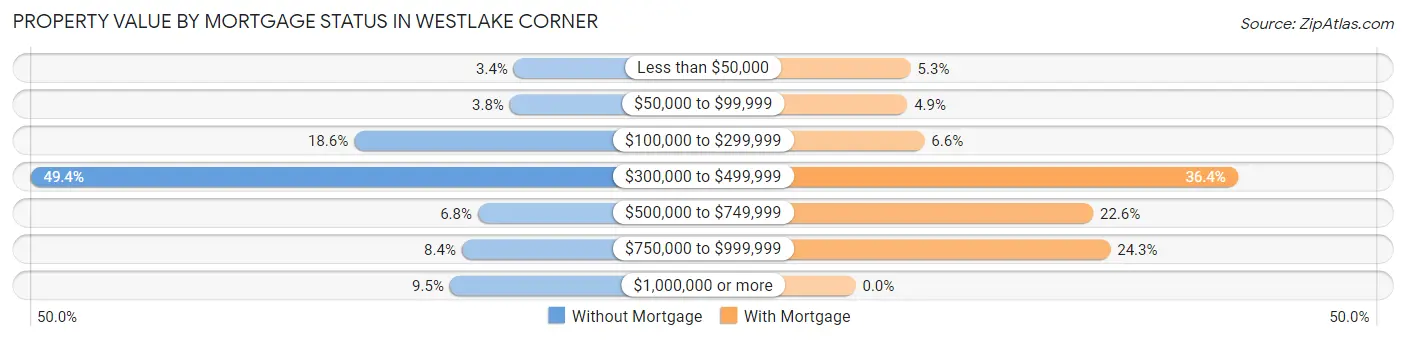
| Property Value | Without Mortgage | With Mortgage |
| Less than $50,000 | 9 (3.4%) | 16 (5.2%) |
| $50,000 to $99,999 | 10 (3.8%) | 15 (4.9%) |
| $100,000 to $299,999 | 49 (18.6%) | 20 (6.6%) |
| $300,000 to $499,999 | 130 (49.4%) | 111 (36.4%) |
| $500,000 to $749,999 | 18 (6.8%) | 69 (22.6%) |
| $750,000 to $999,999 | 22 (8.4%) | 74 (24.3%) |
| $1,000,000 or more | 25 (9.5%) | 0 (0.0%) |
| Total | 263 (100.0%) | 305 (100.0%) |
Household Income by Mortgage Status in Westlake Corner
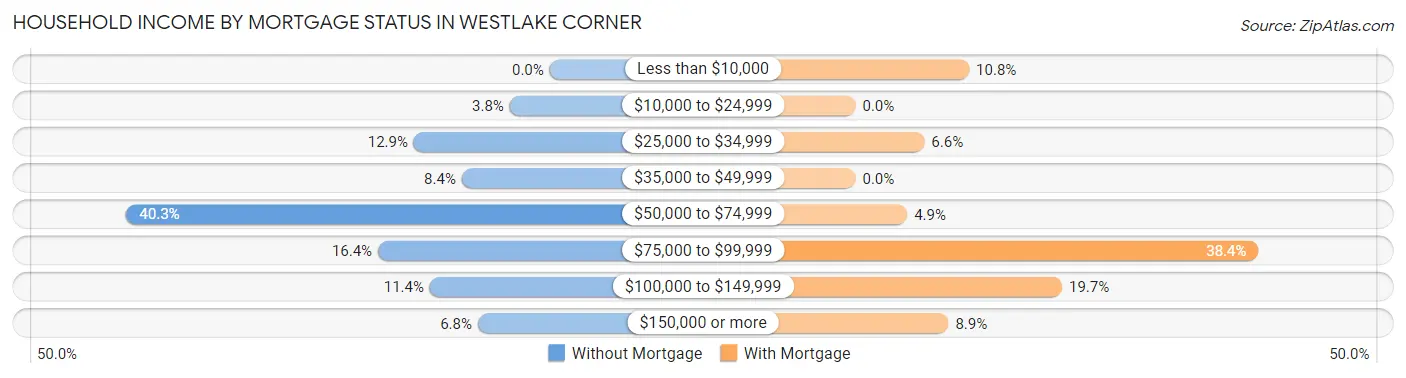
| Household Income | Without Mortgage | With Mortgage |
| Less than $10,000 | 0 (0.0%) | 33 (10.8%) |
| $10,000 to $24,999 | 10 (3.8%) | 0 (0.0%) |
| $25,000 to $34,999 | 34 (12.9%) | 20 (6.6%) |
| $35,000 to $49,999 | 22 (8.4%) | 0 (0.0%) |
| $50,000 to $74,999 | 106 (40.3%) | 15 (4.9%) |
| $75,000 to $99,999 | 43 (16.4%) | 117 (38.4%) |
| $100,000 to $149,999 | 30 (11.4%) | 60 (19.7%) |
| $150,000 or more | 18 (6.8%) | 27 (8.8%) |
| Total | 263 (100.0%) | 305 (100.0%) |
Property Value to Household Income Ratio in Westlake Corner
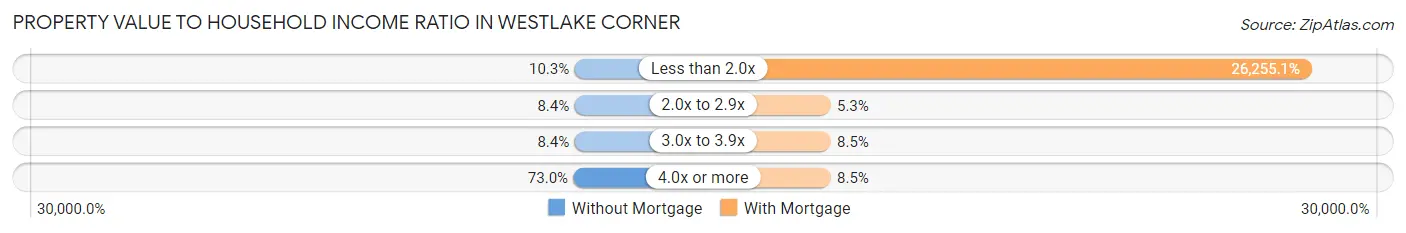
| Value-to-Income Ratio | Without Mortgage | With Mortgage |
| Less than 2.0x | 27 (10.3%) | 80,078 (26,255.1%) |
| 2.0x to 2.9x | 22 (8.4%) | 16 (5.2%) |
| 3.0x to 3.9x | 22 (8.4%) | 26 (8.5%) |
| 4.0x or more | 192 (73.0%) | 26 (8.5%) |
| Total | 263 (100.0%) | 305 (100.0%) |
Real Estate Taxes by Mortgage Status in Westlake Corner
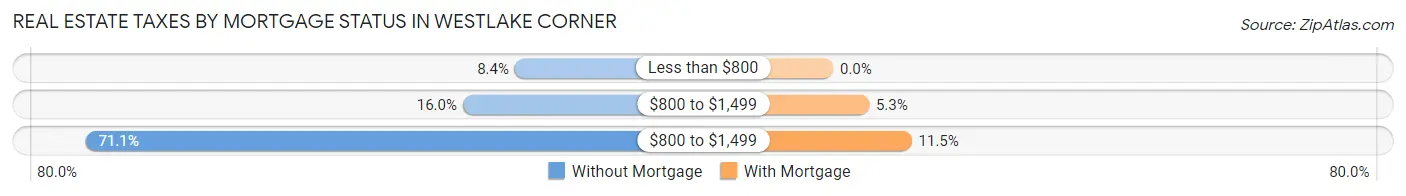
| Property Taxes | Without Mortgage | With Mortgage |
| Less than $800 | 22 (8.4%) | 0 (0.0%) |
| $800 to $1,499 | 42 (16.0%) | 16 (5.2%) |
| $800 to $1,499 | 187 (71.1%) | 35 (11.5%) |
| Total | 263 (100.0%) | 305 (100.0%) |
Health & Disability in Westlake Corner
Health Insurance Coverage by Age in Westlake Corner
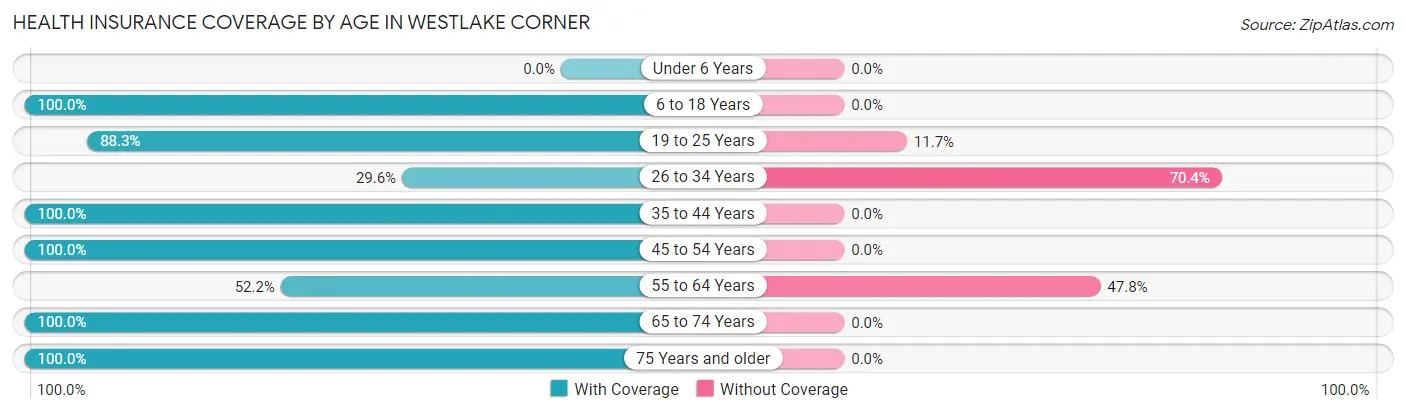
| Age Bracket | With Coverage | Without Coverage |
| Under 6 Years | 0 (0.0%) | 0 (0.0%) |
| 6 to 18 Years | 194 (100.0%) | 0 (0.0%) |
| 19 to 25 Years | 121 (88.3%) | 16 (11.7%) |
| 26 to 34 Years | 16 (29.6%) | 38 (70.4%) |
| 35 to 44 Years | 54 (100.0%) | 0 (0.0%) |
| 45 to 54 Years | 165 (100.0%) | 0 (0.0%) |
| 55 to 64 Years | 315 (52.2%) | 288 (47.8%) |
| 65 to 74 Years | 305 (100.0%) | 0 (0.0%) |
| 75 Years and older | 303 (100.0%) | 0 (0.0%) |
| Total | 1,473 (81.2%) | 342 (18.8%) |
Health Insurance Coverage by Citizenship Status in Westlake Corner
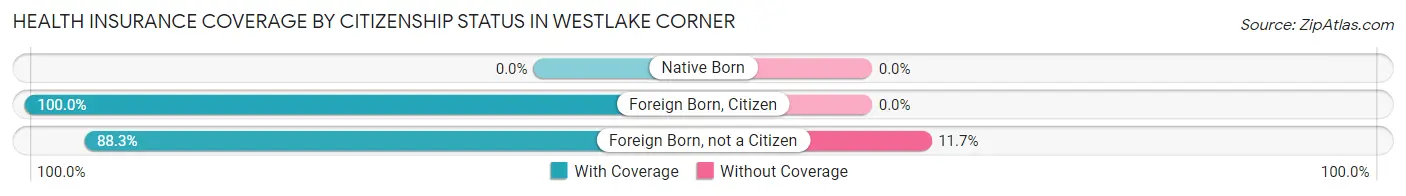
| Citizenship Status | With Coverage | Without Coverage |
| Native Born | 0 (0.0%) | 0 (0.0%) |
| Foreign Born, Citizen | 194 (100.0%) | 0 (0.0%) |
| Foreign Born, not a Citizen | 121 (88.3%) | 16 (11.7%) |
Health Insurance Coverage by Household Income in Westlake Corner
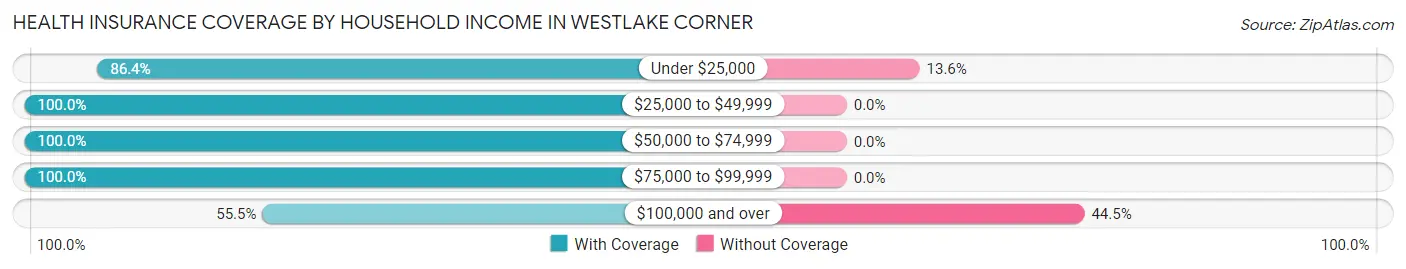
| Household Income | With Coverage | Without Coverage |
| Under $25,000 | 76 (86.4%) | 12 (13.6%) |
| $25,000 to $49,999 | 106 (100.0%) | 0 (0.0%) |
| $50,000 to $74,999 | 568 (100.0%) | 0 (0.0%) |
| $75,000 to $99,999 | 303 (100.0%) | 0 (0.0%) |
| $100,000 and over | 411 (55.5%) | 330 (44.5%) |
Public vs Private Health Insurance Coverage by Age in Westlake Corner
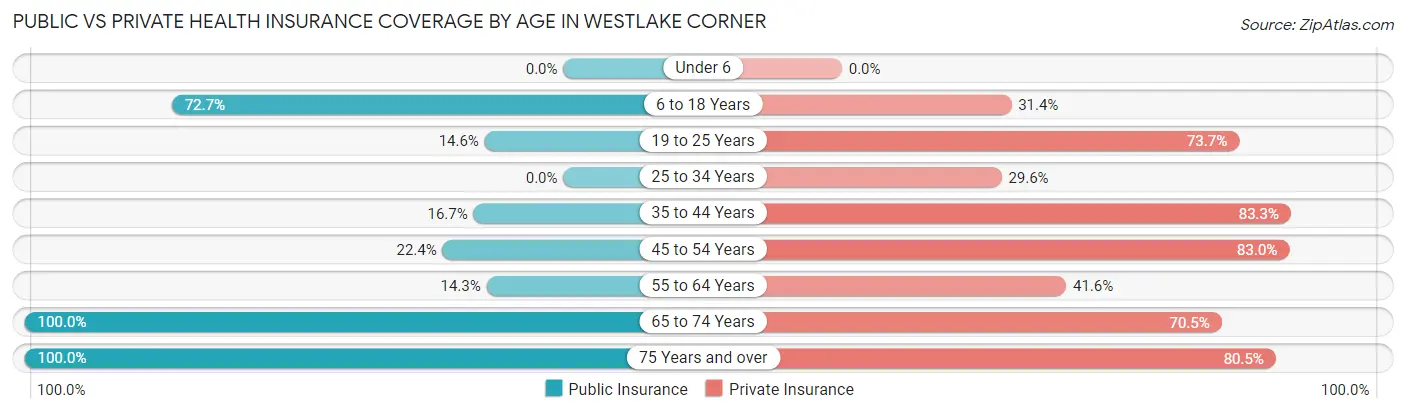
| Age Bracket | Public Insurance | Private Insurance |
| Under 6 | 0 (0.0%) | 0 (0.0%) |
| 6 to 18 Years | 141 (72.7%) | 61 (31.4%) |
| 19 to 25 Years | 20 (14.6%) | 101 (73.7%) |
| 25 to 34 Years | 0 (0.0%) | 16 (29.6%) |
| 35 to 44 Years | 9 (16.7%) | 45 (83.3%) |
| 45 to 54 Years | 37 (22.4%) | 137 (83.0%) |
| 55 to 64 Years | 86 (14.3%) | 251 (41.6%) |
| 65 to 74 Years | 305 (100.0%) | 215 (70.5%) |
| 75 Years and over | 303 (100.0%) | 244 (80.5%) |
| Total | 901 (49.6%) | 1,070 (59.0%) |
Disability Status by Sex by Age in Westlake Corner
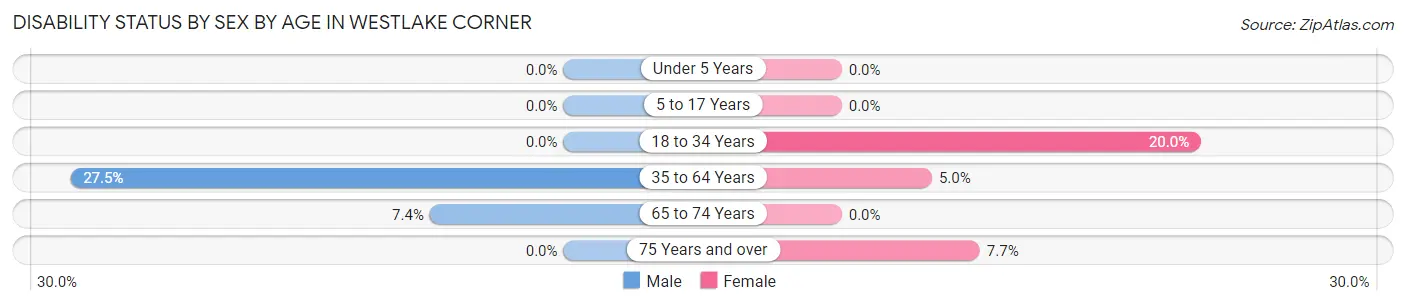
| Age Bracket | Male | Female |
| Under 5 Years | 0 (0.0%) | 0 (0.0%) |
| 5 to 17 Years | 0 (0.0%) | 0 (0.0%) |
| 18 to 34 Years | 0 (0.0%) | 20 (20.0%) |
| 35 to 64 Years | 67 (27.5%) | 29 (5.0%) |
| 65 to 74 Years | 9 (7.4%) | 0 (0.0%) |
| 75 Years and over | 0 (0.0%) | 10 (7.7%) |
Disability Class by Sex by Age in Westlake Corner
Disability Class: Hearing Difficulty
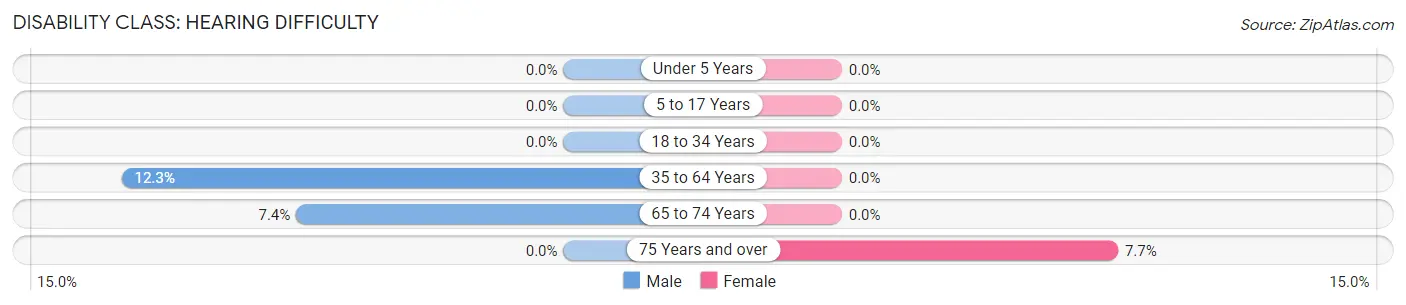
| Age Bracket | Male | Female |
| Under 5 Years | 0 (0.0%) | 0 (0.0%) |
| 5 to 17 Years | 0 (0.0%) | 0 (0.0%) |
| 18 to 34 Years | 0 (0.0%) | 0 (0.0%) |
| 35 to 64 Years | 30 (12.3%) | 0 (0.0%) |
| 65 to 74 Years | 9 (7.4%) | 0 (0.0%) |
| 75 Years and over | 0 (0.0%) | 10 (7.7%) |
Disability Class: Vision Difficulty
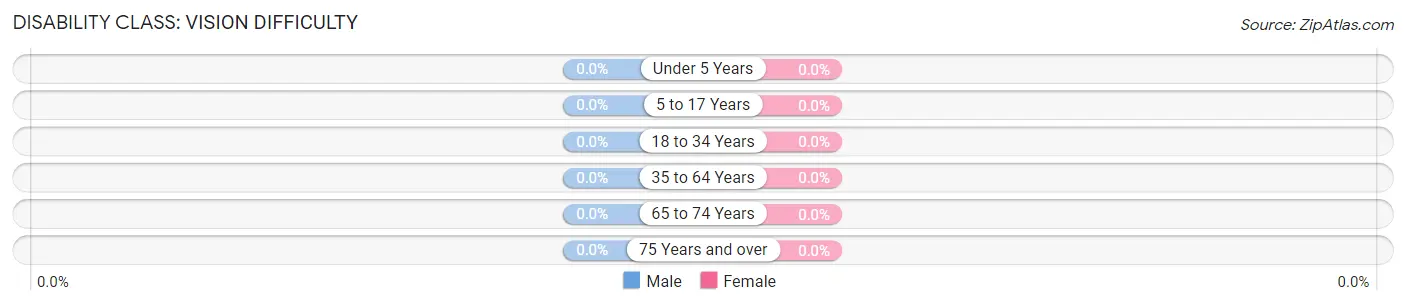
| Age Bracket | Male | Female |
| Under 5 Years | 0 (0.0%) | 0 (0.0%) |
| 5 to 17 Years | 0 (0.0%) | 0 (0.0%) |
| 18 to 34 Years | 0 (0.0%) | 0 (0.0%) |
| 35 to 64 Years | 0 (0.0%) | 0 (0.0%) |
| 65 to 74 Years | 0 (0.0%) | 0 (0.0%) |
| 75 Years and over | 0 (0.0%) | 0 (0.0%) |
Disability Class: Cognitive Difficulty
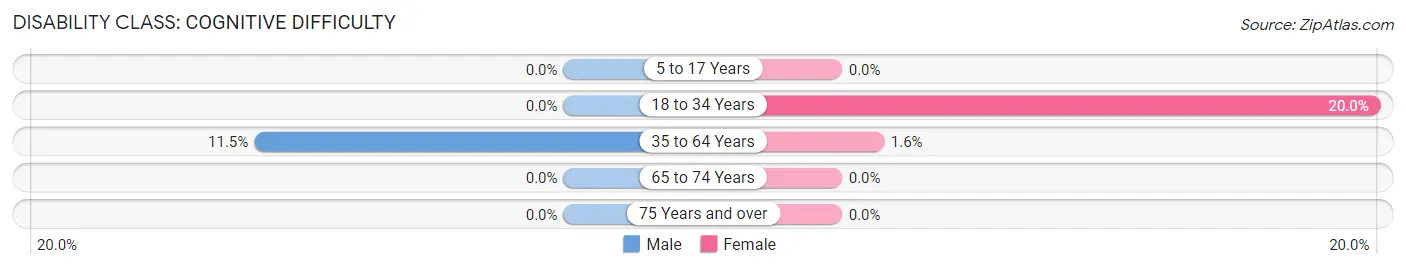
| Age Bracket | Male | Female |
| 5 to 17 Years | 0 (0.0%) | 0 (0.0%) |
| 18 to 34 Years | 0 (0.0%) | 20 (20.0%) |
| 35 to 64 Years | 28 (11.5%) | 9 (1.6%) |
| 65 to 74 Years | 0 (0.0%) | 0 (0.0%) |
| 75 Years and over | 0 (0.0%) | 0 (0.0%) |
Disability Class: Ambulatory Difficulty
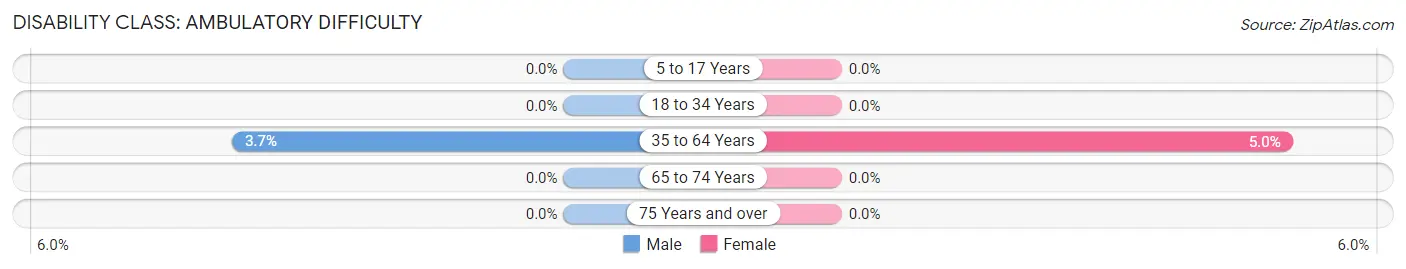
| Age Bracket | Male | Female |
| 5 to 17 Years | 0 (0.0%) | 0 (0.0%) |
| 18 to 34 Years | 0 (0.0%) | 0 (0.0%) |
| 35 to 64 Years | 9 (3.7%) | 29 (5.0%) |
| 65 to 74 Years | 0 (0.0%) | 0 (0.0%) |
| 75 Years and over | 0 (0.0%) | 0 (0.0%) |
Disability Class: Self-Care Difficulty
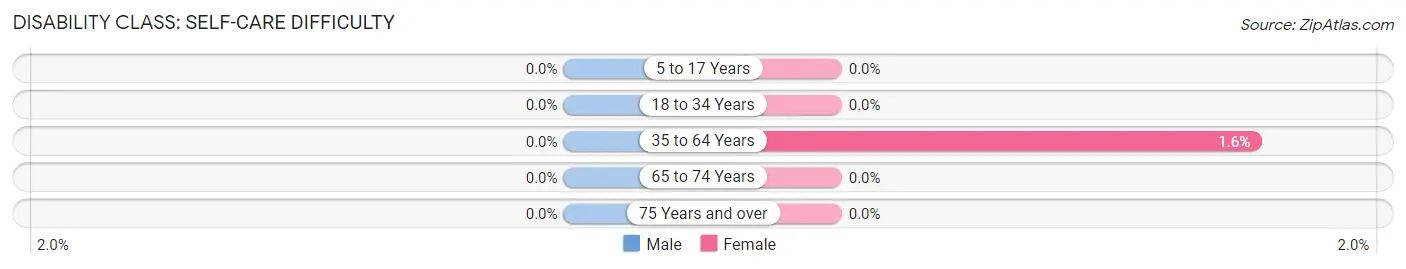
| Age Bracket | Male | Female |
| 5 to 17 Years | 0 (0.0%) | 0 (0.0%) |
| 18 to 34 Years | 0 (0.0%) | 0 (0.0%) |
| 35 to 64 Years | 0 (0.0%) | 9 (1.6%) |
| 65 to 74 Years | 0 (0.0%) | 0 (0.0%) |
| 75 Years and over | 0 (0.0%) | 0 (0.0%) |
Technology Access in Westlake Corner
Computing Device Access in Westlake Corner
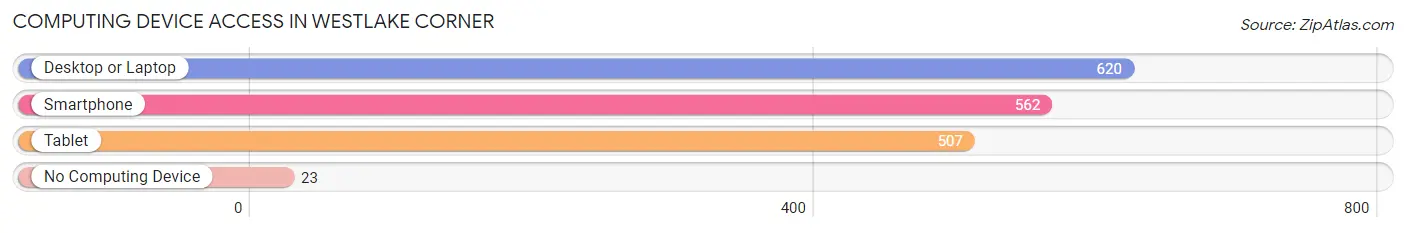
| Device Type | # Households | % Households |
| Desktop or Laptop | 620 | 87.0% |
| Smartphone | 562 | 78.8% |
| Tablet | 507 | 71.1% |
| No Computing Device | 23 | 3.2% |
| Total | 713 | 100.0% |
Internet Access in Westlake Corner
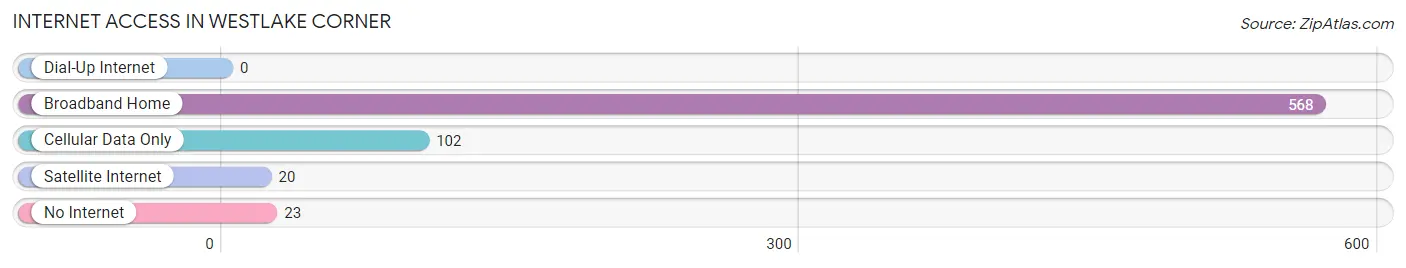
| Internet Type | # Households | % Households |
| Dial-Up Internet | 0 | 0.0% |
| Broadband Home | 568 | 79.7% |
| Cellular Data Only | 102 | 14.3% |
| Satellite Internet | 20 | 2.8% |
| No Internet | 23 | 3.2% |
| Total | 713 | 100.0% |
Westlake Corner Summary
Westlake Corner is a small unincorporated community located in Albemarle County, Virginia. It is situated at the intersection of U.S. Route 29 and State Route 643, approximately 8 miles north of Charlottesville. The community is home to a variety of businesses, including a gas station, convenience store, and a restaurant.
History
Westlake Corner was originally known as Westlake, and was established in the late 19th century. The community was named after the nearby Westlake Plantation, which was owned by the prominent Carter family. The plantation was destroyed during the Civil War, and the community was renamed Westlake Corner in the early 20th century.
Geography
Westlake Corner is located in the foothills of the Blue Ridge Mountains, and is situated at an elevation of 845 feet. The community is located in the Piedmont region of Virginia, and is characterized by rolling hills and lush forests. The nearby Rivanna River provides a scenic backdrop to the community.
Economy
Westlake Corner is primarily a residential community, and the majority of its residents are employed in the nearby cities of Charlottesville and Albemarle. The community is home to a variety of businesses, including a gas station, convenience store, and a restaurant.
Demographics
As of the 2010 census, Westlake Corner had a population of 1,845. The racial makeup of the community was 87.3% White, 8.2% African American, 0.7% Native American, 0.7% Asian, and 2.1% from other races. The median household income was $50,977, and the median age was 37.7 years.
Conclusion
Westlake Corner is a small unincorporated community located in Albemarle County, Virginia. It is situated at the intersection of U.S. Route 29 and State Route 643, approximately 8 miles north of Charlottesville. The community is home to a variety of businesses, including a gas station, convenience store, and a restaurant. Westlake Corner was originally known as Westlake, and was established in the late 19th century. The community is located in the Piedmont region of Virginia, and is characterized by rolling hills and lush forests. Westlake Corner is primarily a residential community, and the majority of its residents are employed in the nearby cities of Charlottesville and Albemarle. As of the 2010 census, Westlake Corner had a population of 1,845. The racial makeup of the community was 87.3% White, 8.2% African American, 0.7% Native American, 0.7% Asian, and 2.1% from other races. The median household income was $50,977, and the median age was 37.7 years.
Common Questions
What is Per Capita Income in Westlake Corner?
Per Capita income in Westlake Corner is $57,721.
What is the Median Family Income in Westlake Corner?
Median Family Income in Westlake Corner is $76,848.
What is the Median Household income in Westlake Corner?
Median Household Income in Westlake Corner is $69,297.
What is Income or Wage Gap in Westlake Corner?
Income or Wage Gap in Westlake Corner is 40.6%.
Women in Westlake Corner earn 59.4 cents for every dollar earned by a man.
What is Inequality or Gini Index in Westlake Corner?
Inequality or Gini Index in Westlake Corner is 0.40.
What is the Total Population of Westlake Corner?
Total Population of Westlake Corner is 1,815.
What is the Total Male Population of Westlake Corner?
Total Male Population of Westlake Corner is 708.
What is the Total Female Population of Westlake Corner?
Total Female Population of Westlake Corner is 1,107.
What is the Ratio of Males per 100 Females in Westlake Corner?
There are 63.96 Males per 100 Females in Westlake Corner.
What is the Ratio of Females per 100 Males in Westlake Corner?
There are 156.36 Females per 100 Males in Westlake Corner.
What is the Median Population Age in Westlake Corner?
Median Population Age in Westlake Corner is 59.9 Years.
What is the Average Family Size in Westlake Corner
Average Family Size in Westlake Corner is 3.0 People.
What is the Average Household Size in Westlake Corner
Average Household Size in Westlake Corner is 2.5 People.
How Large is the Labor Force in Westlake Corner?
There are 780 People in the Labor Forcein in Westlake Corner.
What is the Percentage of People in the Labor Force in Westlake Corner?
46.9% of People are in the Labor Force in Westlake Corner.