Wyndham, VA Map & Demographics
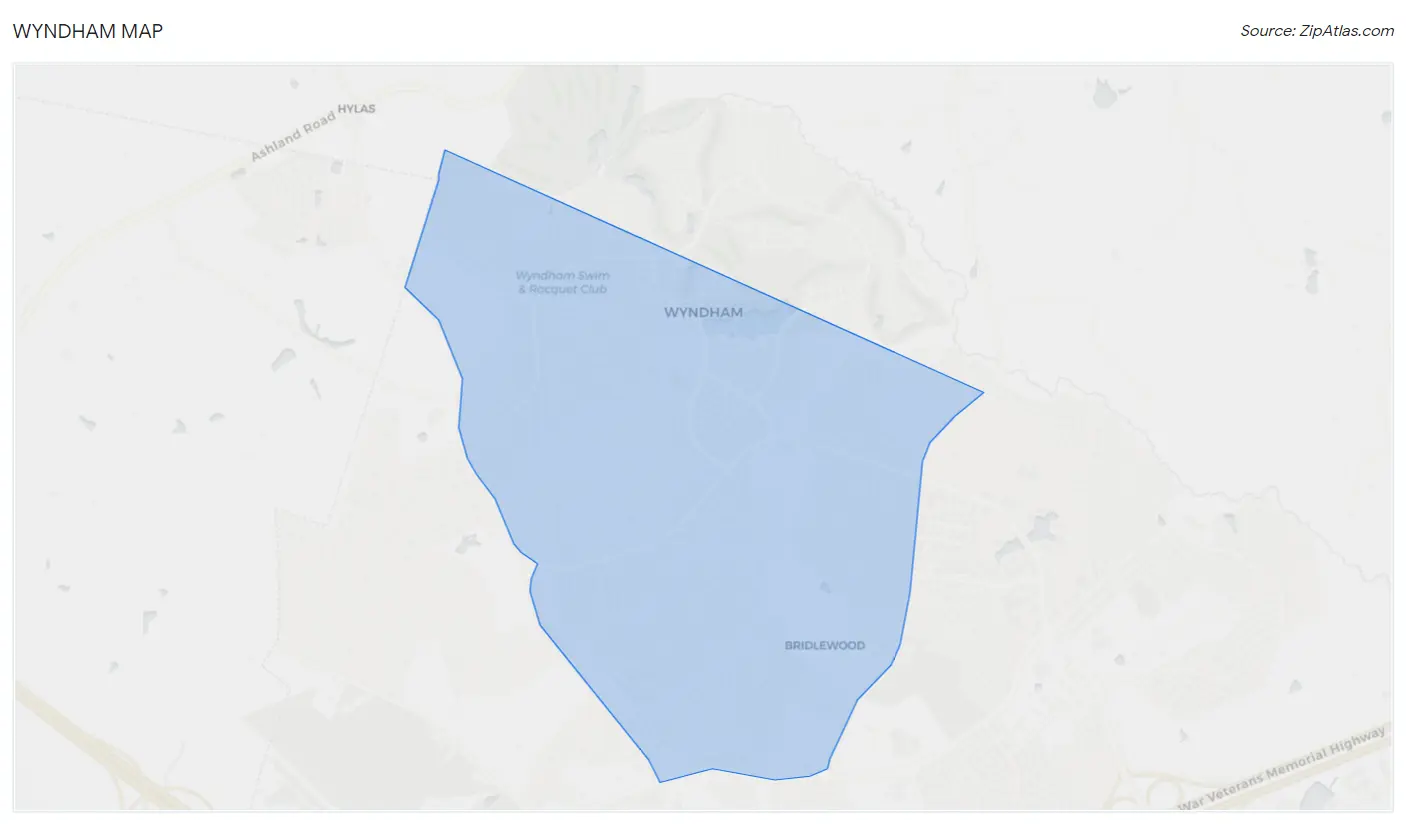
Wyndham Map
Wyndham Overview
$89,049
PER CAPITA INCOME
$250,001
AVG FAMILY INCOME
$225,038
AVG HOUSEHOLD INCOME
62.0%
WAGE / INCOME GAP [ % ]
38.0¢/ $1
WAGE / INCOME GAP [ $ ]
0.37
INEQUALITY / GINI INDEX
12,110
TOTAL POPULATION
5,961
MALE POPULATION
6,149
FEMALE POPULATION
96.94
MALES / 100 FEMALES
103.15
FEMALES / 100 MALES
38.9
MEDIAN AGE
3.4
AVG FAMILY SIZE
3.1
AVG HOUSEHOLD SIZE
6,556
LABOR FORCE [ PEOPLE ]
74.4%
PERCENT IN LABOR FORCE
3.1%
UNEMPLOYMENT RATE
Income in Wyndham
Income Overview in Wyndham
Per Capita Income in Wyndham is $89,049, while median incomes of families and households are $250,001 and $225,038 respectively.
| Characteristic | Number | Measure |
| Per Capita Income | 12,110 | $89,049 |
| Median Family Income | 3,362 | $250,001 |
| Mean Family Income | 3,362 | $296,361 |
| Median Household Income | 3,887 | $225,038 |
| Mean Household Income | 3,887 | $273,933 |
| Income Deficit | 3,362 | $0 |
| Wage / Income Gap (%) | 12,110 | 61.99% |
| Wage / Income Gap ($) | 12,110 | 38.01¢ per $1 |
| Gini / Inequality Index | 12,110 | 0.37 |
Earnings by Sex in Wyndham
Average Earnings in Wyndham are $100,147, $144,507 for men and $54,931 for women, a difference of 62.0%.
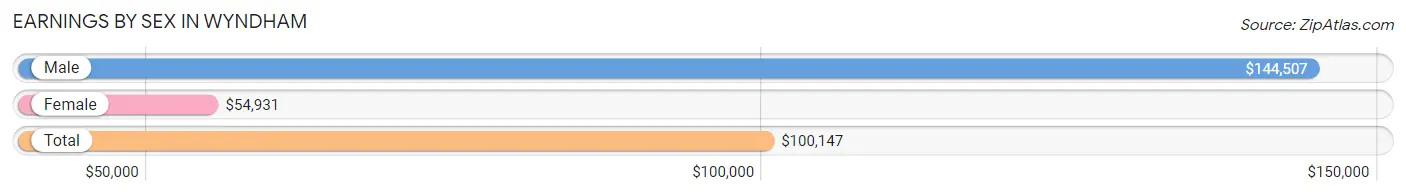
| Sex | Number | Average Earnings |
| Male | 3,826 (54.6%) | $144,507 |
| Female | 3,176 (45.4%) | $54,931 |
| Total | 7,002 (100.0%) | $100,147 |
Earnings by Sex by Income Bracket in Wyndham
The most common earnings brackets in Wyndham are $100,000+ for men (2,525 | 66.0%) and $100,000+ for women (977 | 30.8%).
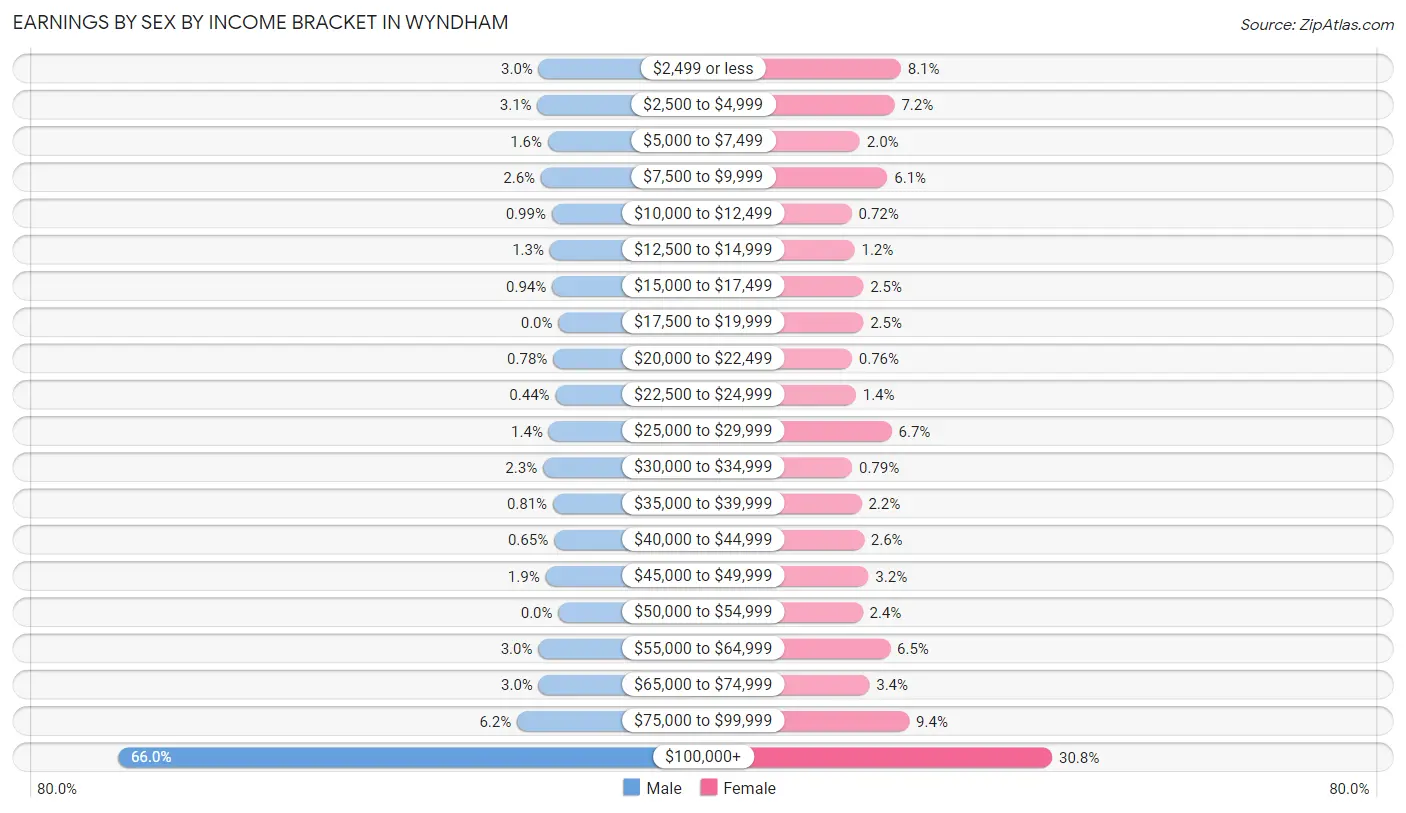
| Income | Male | Female |
| $2,499 or less | 113 (2.9%) | 257 (8.1%) |
| $2,500 to $4,999 | 120 (3.1%) | 227 (7.1%) |
| $5,000 to $7,499 | 60 (1.6%) | 62 (1.9%) |
| $7,500 to $9,999 | 100 (2.6%) | 193 (6.1%) |
| $10,000 to $12,499 | 38 (1.0%) | 23 (0.7%) |
| $12,500 to $14,999 | 49 (1.3%) | 37 (1.2%) |
| $15,000 to $17,499 | 36 (0.9%) | 78 (2.5%) |
| $17,500 to $19,999 | 0 (0.0%) | 78 (2.5%) |
| $20,000 to $22,499 | 30 (0.8%) | 24 (0.8%) |
| $22,500 to $24,999 | 17 (0.4%) | 43 (1.3%) |
| $25,000 to $29,999 | 55 (1.4%) | 213 (6.7%) |
| $30,000 to $34,999 | 88 (2.3%) | 25 (0.8%) |
| $35,000 to $39,999 | 31 (0.8%) | 70 (2.2%) |
| $40,000 to $44,999 | 25 (0.6%) | 81 (2.5%) |
| $45,000 to $49,999 | 74 (1.9%) | 103 (3.2%) |
| $50,000 to $54,999 | 0 (0.0%) | 75 (2.4%) |
| $55,000 to $64,999 | 115 (3.0%) | 206 (6.5%) |
| $65,000 to $74,999 | 113 (2.9%) | 107 (3.4%) |
| $75,000 to $99,999 | 237 (6.2%) | 297 (9.3%) |
| $100,000+ | 2,525 (66.0%) | 977 (30.8%) |
| Total | 3,826 (100.0%) | 3,176 (100.0%) |
Earnings by Sex by Educational Attainment in Wyndham
Average earnings in Wyndham are $168,491 for men and $63,792 for women, a difference of 62.1%. Men with an educational attainment of graduate degree enjoy the highest average annual earnings of $205,401, while those with high school diploma education earn the least with $48,313. Women with an educational attainment of bachelor's degree earn the most with the average annual earnings of $75,250, while those with high school diploma education have the smallest earnings of $36,563.
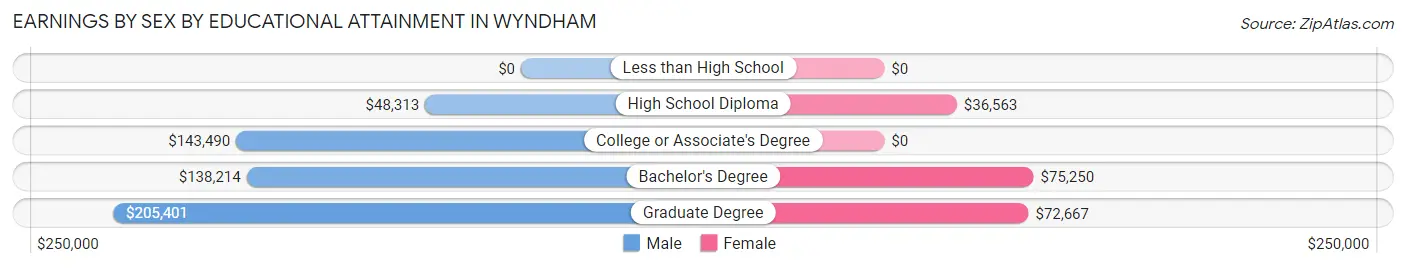
| Educational Attainment | Male Income | Female Income |
| Less than High School | - | - |
| High School Diploma | $48,313 | $36,563 |
| College or Associate's Degree | $143,490 | $0 |
| Bachelor's Degree | $138,214 | $75,250 |
| Graduate Degree | $205,401 | $72,667 |
| Total | $168,491 | $63,792 |
Family Income in Wyndham
Family Income Brackets in Wyndham
According to the Wyndham family income data, there are 2,095 families falling into the $200,000+ income range, which is the most common income bracket and makes up 62.3% of all families.
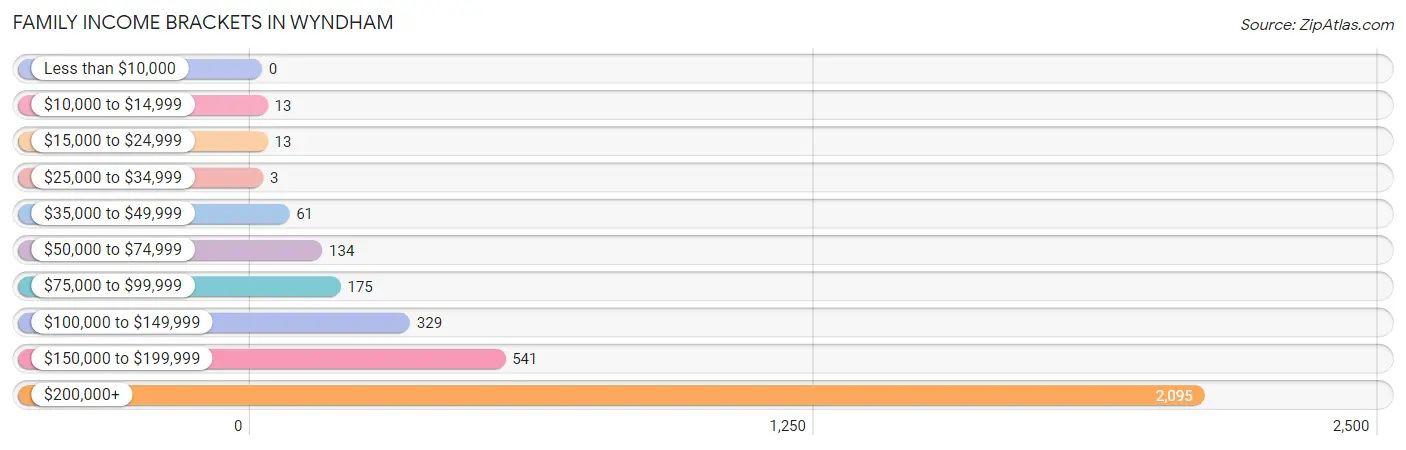
| Income Bracket | # Families | % Families |
| Less than $10,000 | 0 | 0.0% |
| $10,000 to $14,999 | 13 | 0.4% |
| $15,000 to $24,999 | 13 | 0.4% |
| $25,000 to $34,999 | 3 | 0.1% |
| $35,000 to $49,999 | 61 | 1.8% |
| $50,000 to $74,999 | 134 | 4.0% |
| $75,000 to $99,999 | 175 | 5.2% |
| $100,000 to $149,999 | 329 | 9.8% |
| $150,000 to $199,999 | 541 | 16.1% |
| $200,000+ | 2,095 | 62.3% |
Family Income by Famaliy Size in Wyndham
3-person families (854 | 25.4%) account for the highest median family income in Wyndham with $250,001 per family, while 2-person families (1,020 | 30.3%) have the highest median income of $98,620 per family member.
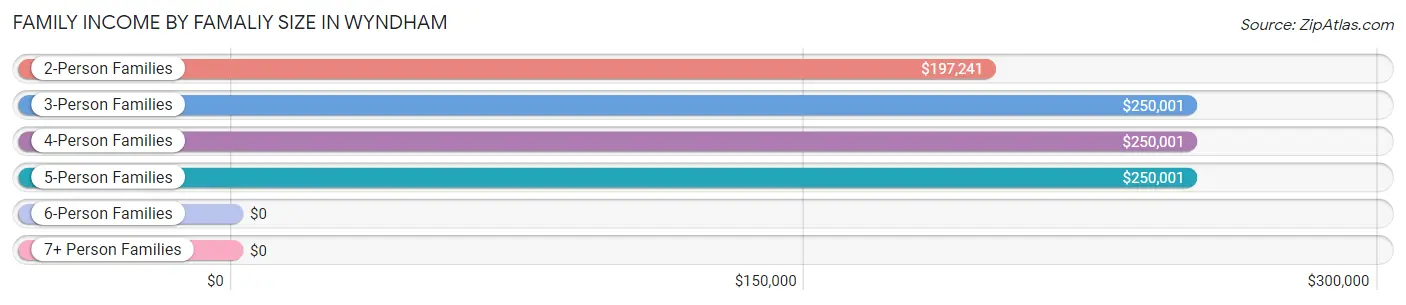
| Income Bracket | # Families | Median Income |
| 2-Person Families | 1,020 (30.3%) | $197,241 |
| 3-Person Families | 854 (25.4%) | $250,001 |
| 4-Person Families | 1,053 (31.3%) | $250,001 |
| 5-Person Families | 417 (12.4%) | $250,001 |
| 6-Person Families | 18 (0.5%) | $0 |
| 7+ Person Families | 0 (0.0%) | $0 |
| Total | 3,362 (100.0%) | $250,001 |
Family Income by Number of Earners in Wyndham
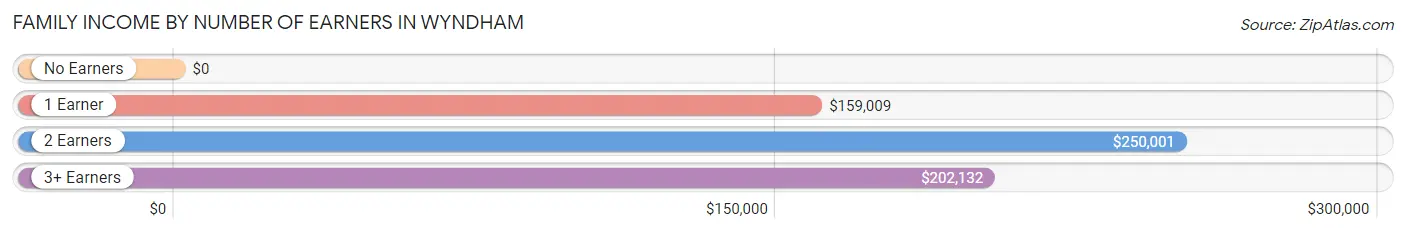
| Number of Earners | # Families | Median Income |
| No Earners | 127 (3.8%) | $0 |
| 1 Earner | 799 (23.8%) | $159,009 |
| 2 Earners | 1,977 (58.8%) | $250,001 |
| 3+ Earners | 459 (13.7%) | $202,132 |
| Total | 3,362 (100.0%) | $250,001 |
Household Income in Wyndham
Household Income Brackets in Wyndham
With 2,169 households falling in the category, the $200,000+ income range is the most frequent in Wyndham, accounting for 55.8% of all households. In contrast, only 4 households (0.1%) fall into the $25,000 to $34,999 income bracket, making it the least populous group.
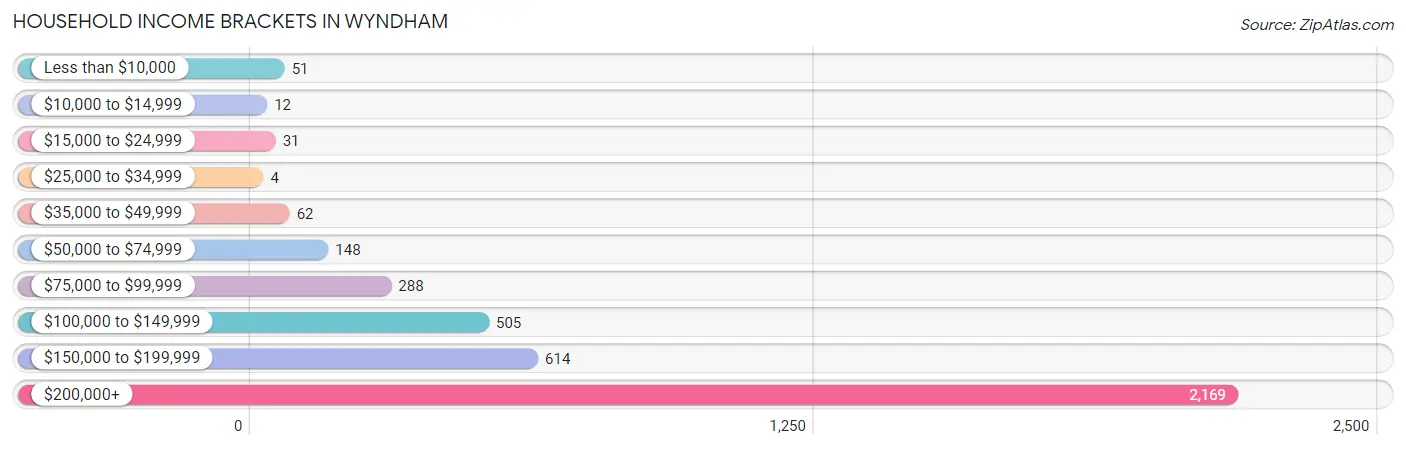
| Income Bracket | # Households | % Households |
| Less than $10,000 | 51 | 1.3% |
| $10,000 to $14,999 | 12 | 0.3% |
| $15,000 to $24,999 | 31 | 0.8% |
| $25,000 to $34,999 | 4 | 0.1% |
| $35,000 to $49,999 | 62 | 1.6% |
| $50,000 to $74,999 | 148 | 3.8% |
| $75,000 to $99,999 | 288 | 7.4% |
| $100,000 to $149,999 | 505 | 13.0% |
| $150,000 to $199,999 | 614 | 15.8% |
| $200,000+ | 2,169 | 55.8% |
Household Income by Householder Age in Wyndham
The median household income in Wyndham is $225,038, with the highest median household income of $250,001 found in the 45 to 64 years age bracket for the primary householder. A total of 1,988 households (51.1%) fall into this category. Meanwhile, the 15 to 24 years age bracket for the primary householder has the lowest median household income of $0, with 17 households (0.4%) in this group.
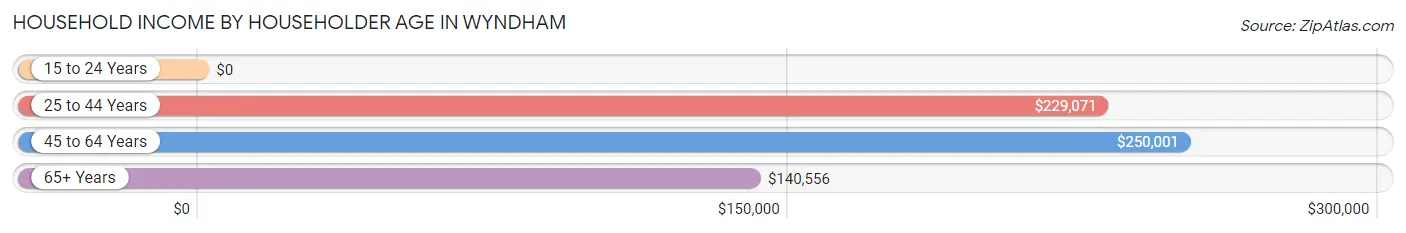
| Income Bracket | # Households | Median Income |
| 15 to 24 Years | 17 (0.4%) | $0 |
| 25 to 44 Years | 1,312 (33.8%) | $229,071 |
| 45 to 64 Years | 1,988 (51.1%) | $250,001 |
| 65+ Years | 570 (14.7%) | $140,556 |
| Total | 3,887 (100.0%) | $225,038 |
Poverty in Wyndham
Income Below Poverty by Sex and Age in Wyndham
With 0.5% poverty level for males and 2.1% for females among the residents of Wyndham, 18 to 24 year old males and 75 year old and over females are the most vulnerable to poverty, with 17 males (4.8%) and 31 females (13.6%) in their respective age groups living below the poverty level.
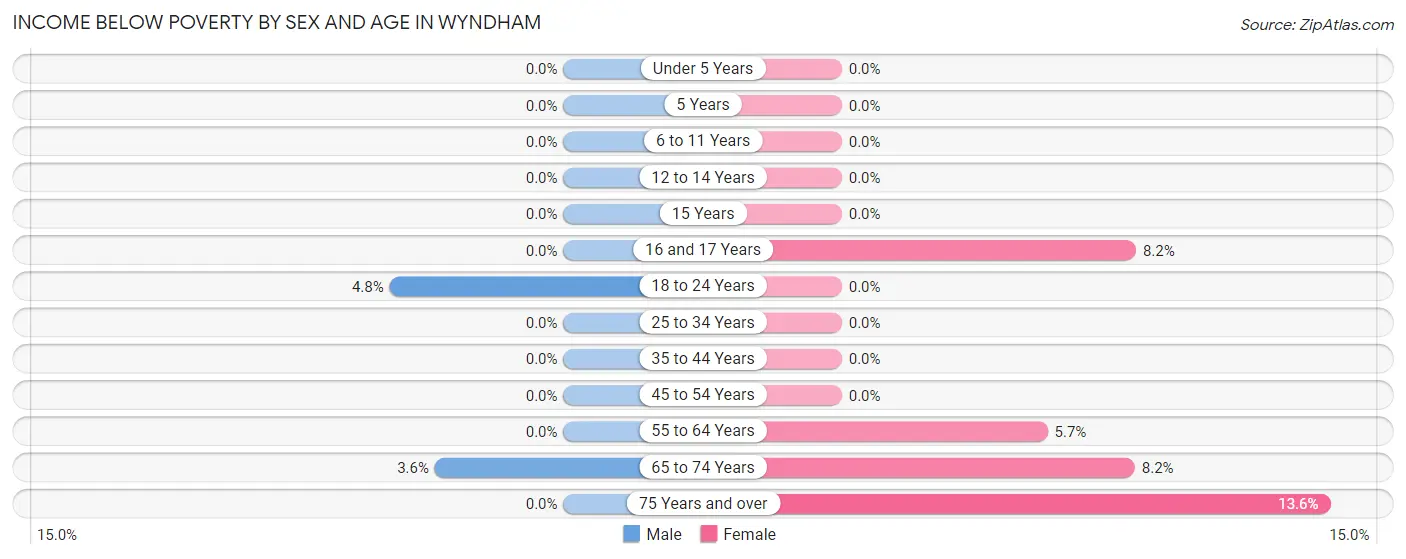
| Age Bracket | Male | Female |
| Under 5 Years | 0 (0.0%) | 0 (0.0%) |
| 5 Years | 0 (0.0%) | 0 (0.0%) |
| 6 to 11 Years | 0 (0.0%) | 0 (0.0%) |
| 12 to 14 Years | 0 (0.0%) | 0 (0.0%) |
| 15 Years | 0 (0.0%) | 0 (0.0%) |
| 16 and 17 Years | 0 (0.0%) | 24 (8.2%) |
| 18 to 24 Years | 17 (4.8%) | 0 (0.0%) |
| 25 to 34 Years | 0 (0.0%) | 0 (0.0%) |
| 35 to 44 Years | 0 (0.0%) | 0 (0.0%) |
| 45 to 54 Years | 0 (0.0%) | 0 (0.0%) |
| 55 to 64 Years | 0 (0.0%) | 48 (5.7%) |
| 65 to 74 Years | 12 (3.6%) | 23 (8.2%) |
| 75 Years and over | 0 (0.0%) | 31 (13.6%) |
| Total | 29 (0.5%) | 126 (2.1%) |
Income Above Poverty by Sex and Age in Wyndham
According to the poverty statistics in Wyndham, males aged under 5 years and females aged under 5 years are the age groups that are most secure financially, with 100.0% of males and 100.0% of females in these age groups living above the poverty line.
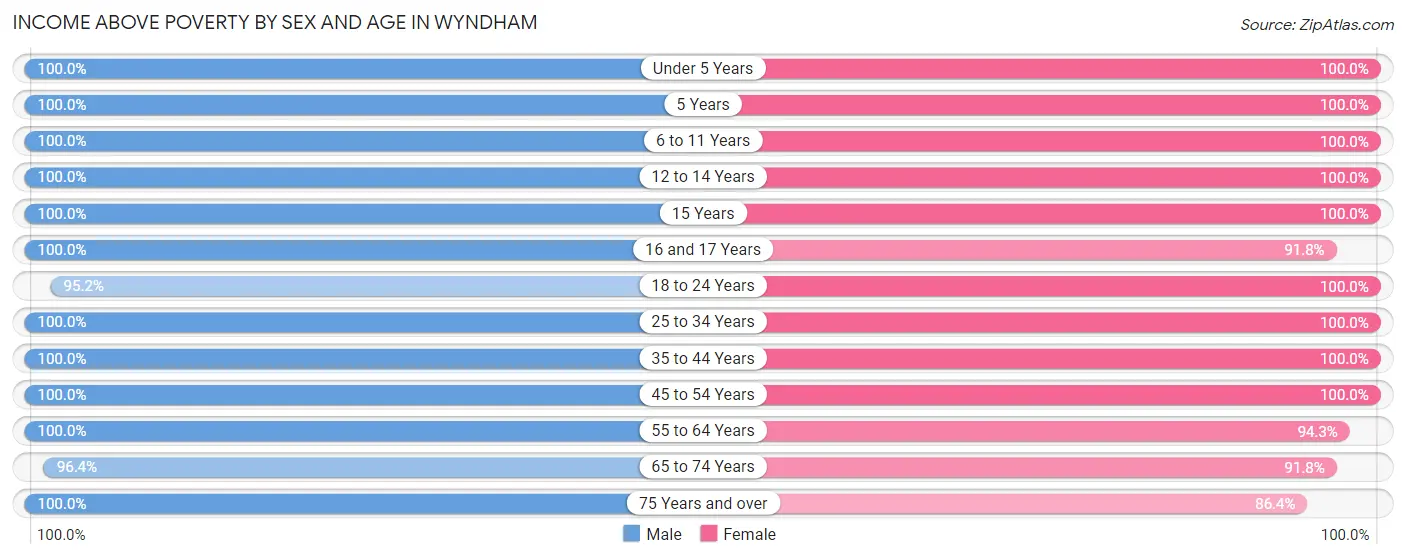
| Age Bracket | Male | Female |
| Under 5 Years | 376 (100.0%) | 317 (100.0%) |
| 5 Years | 16 (100.0%) | 44 (100.0%) |
| 6 to 11 Years | 991 (100.0%) | 561 (100.0%) |
| 12 to 14 Years | 98 (100.0%) | 603 (100.0%) |
| 15 Years | 79 (100.0%) | 213 (100.0%) |
| 16 and 17 Years | 295 (100.0%) | 269 (91.8%) |
| 18 to 24 Years | 334 (95.2%) | 289 (100.0%) |
| 25 to 34 Years | 331 (100.0%) | 346 (100.0%) |
| 35 to 44 Years | 1,171 (100.0%) | 1,120 (100.0%) |
| 45 to 54 Years | 1,157 (100.0%) | 1,016 (100.0%) |
| 55 to 64 Years | 621 (100.0%) | 789 (94.3%) |
| 65 to 74 Years | 323 (96.4%) | 259 (91.8%) |
| 75 Years and over | 140 (100.0%) | 197 (86.4%) |
| Total | 5,932 (99.5%) | 6,023 (98.0%) |
Income Below Poverty Among Married-Couple Families in Wyndham
The poverty statistics for married-couple families in Wyndham show that 0.4% or 12 of the total 3,082 families live below the poverty line. Families with no children have the highest poverty rate of 1.0%, comprising of 12 families. On the other hand, families with 1 or 2 children have the lowest poverty rate of 0.0%, which includes 0 families.
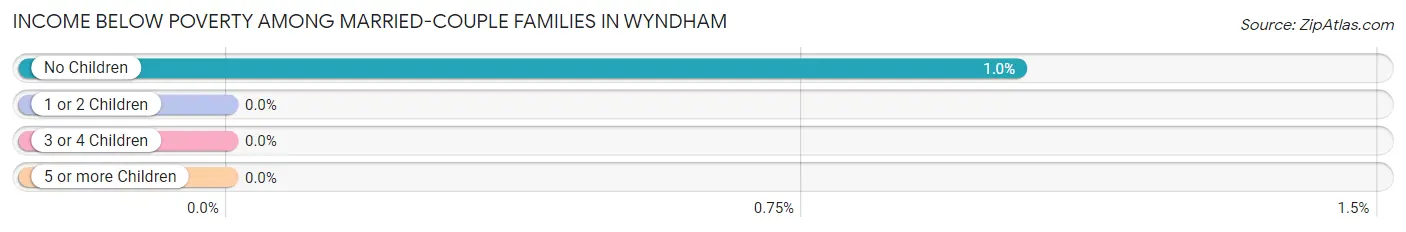
| Children | Above Poverty | Below Poverty |
| No Children | 1,152 (99.0%) | 12 (1.0%) |
| 1 or 2 Children | 1,584 (100.0%) | 0 (0.0%) |
| 3 or 4 Children | 334 (100.0%) | 0 (0.0%) |
| 5 or more Children | 0 (0.0%) | 0 (0.0%) |
| Total | 3,070 (99.6%) | 12 (0.4%) |
Income Below Poverty Among Single-Parent Households in Wyndham
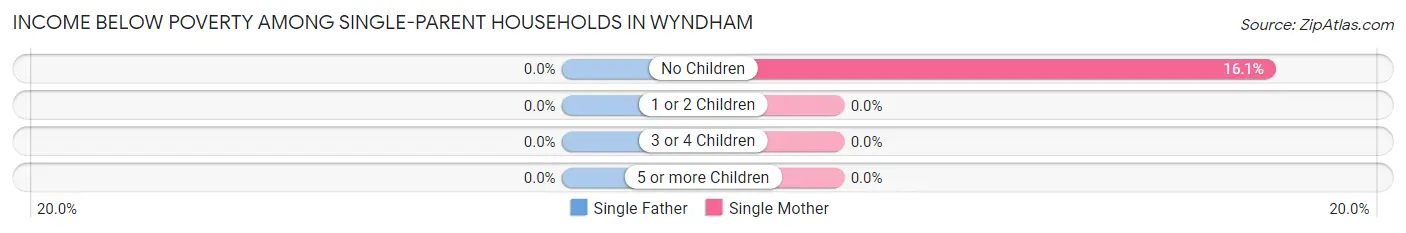
| Children | Single Father | Single Mother |
| No Children | 0 (0.0%) | 14 (16.1%) |
| 1 or 2 Children | 0 (0.0%) | 0 (0.0%) |
| 3 or 4 Children | 0 (0.0%) | 0 (0.0%) |
| 5 or more Children | 0 (0.0%) | 0 (0.0%) |
| Total | 0 (0.0%) | 14 (9.2%) |
Income Below Poverty Among Married-Couple vs Single-Parent Households in Wyndham
The poverty data for Wyndham shows that 12 of the married-couple family households (0.4%) and 14 of the single-parent households (5.0%) are living below the poverty level. Within the married-couple family households, those with no children have the highest poverty rate, with 12 households (1.0%) falling below the poverty line. Among the single-parent households, those with no children have the highest poverty rate, with 14 household (12.2%) living below poverty.
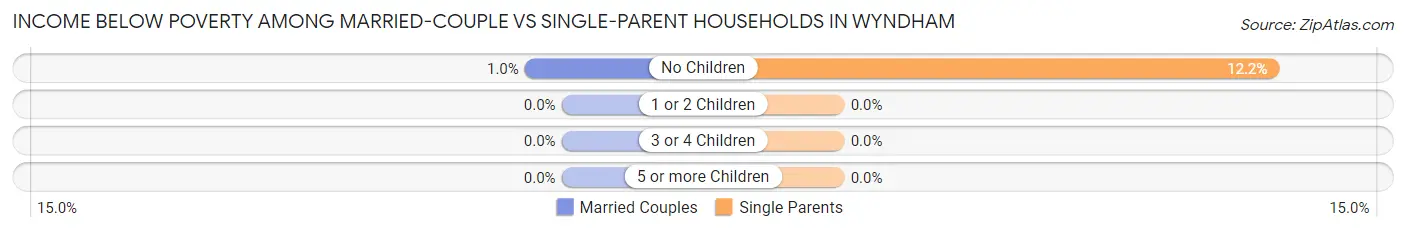
| Children | Married-Couple Families | Single-Parent Households |
| No Children | 12 (1.0%) | 14 (12.2%) |
| 1 or 2 Children | 0 (0.0%) | 0 (0.0%) |
| 3 or 4 Children | 0 (0.0%) | 0 (0.0%) |
| 5 or more Children | 0 (0.0%) | 0 (0.0%) |
| Total | 12 (0.4%) | 14 (5.0%) |
Race in Wyndham
The most populous races in Wyndham are White / Caucasian (7,137 | 58.9%), Asian (3,629 | 30.0%), and Two or more Races (889 | 7.3%).
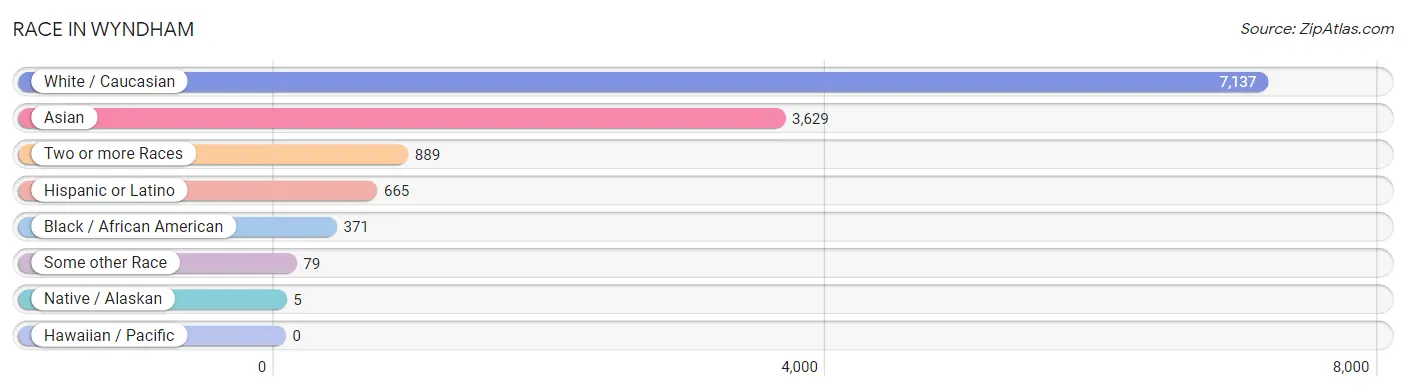
| Race | # Population | % Population |
| Asian | 3,629 | 30.0% |
| Black / African American | 371 | 3.1% |
| Hawaiian / Pacific | 0 | 0.0% |
| Hispanic or Latino | 665 | 5.5% |
| Native / Alaskan | 5 | 0.0% |
| White / Caucasian | 7,137 | 58.9% |
| Two or more Races | 889 | 7.3% |
| Some other Race | 79 | 0.6% |
| Total | 12,110 | 100.0% |
Ancestry in Wyndham
The most populous ancestries reported in Wyndham are Thai (2,774 | 22.9%), English (1,961 | 16.2%), German (1,581 | 13.1%), Irish (1,240 | 10.2%), and Italian (588 | 4.9%), together accounting for 67.3% of all Wyndham residents.
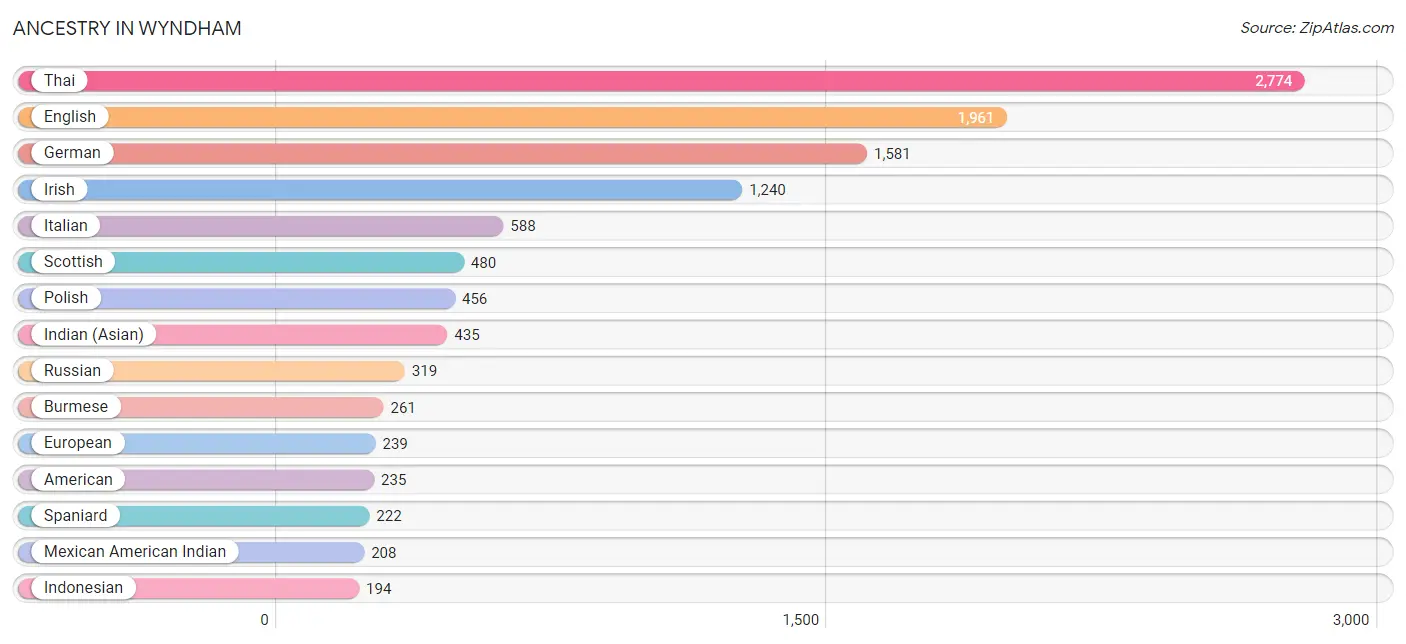
| Ancestry | # Population | % Population |
| Albanian | 12 | 0.1% |
| American | 235 | 1.9% |
| Arab | 140 | 1.2% |
| Argentinean | 43 | 0.4% |
| Austrian | 51 | 0.4% |
| Belgian | 28 | 0.2% |
| Brazilian | 31 | 0.3% |
| British | 169 | 1.4% |
| Burmese | 261 | 2.2% |
| Central American | 85 | 0.7% |
| Cherokee | 44 | 0.4% |
| Chickasaw | 5 | 0.0% |
| Czech | 78 | 0.6% |
| Danish | 15 | 0.1% |
| Dominican | 53 | 0.4% |
| Dutch | 100 | 0.8% |
| Eastern European | 51 | 0.4% |
| English | 1,961 | 16.2% |
| European | 239 | 2.0% |
| French | 126 | 1.0% |
| French Canadian | 128 | 1.1% |
| German | 1,581 | 13.1% |
| Greek | 34 | 0.3% |
| Honduran | 32 | 0.3% |
| Hungarian | 102 | 0.8% |
| Indian (Asian) | 435 | 3.6% |
| Indonesian | 194 | 1.6% |
| Iranian | 92 | 0.8% |
| Irish | 1,240 | 10.2% |
| Italian | 588 | 4.9% |
| Korean | 109 | 0.9% |
| Latvian | 34 | 0.3% |
| Lebanese | 49 | 0.4% |
| Lithuanian | 30 | 0.3% |
| Mexican | 74 | 0.6% |
| Mexican American Indian | 208 | 1.7% |
| Northern European | 15 | 0.1% |
| Norwegian | 67 | 0.5% |
| Panamanian | 53 | 0.4% |
| Peruvian | 15 | 0.1% |
| Polish | 456 | 3.8% |
| Portuguese | 37 | 0.3% |
| Russian | 319 | 2.6% |
| Scotch-Irish | 172 | 1.4% |
| Scottish | 480 | 4.0% |
| Slovak | 23 | 0.2% |
| South American | 58 | 0.5% |
| Spaniard | 222 | 1.8% |
| Spanish | 161 | 1.3% |
| Sri Lankan | 132 | 1.1% |
| Swedish | 69 | 0.6% |
| Syrian | 91 | 0.7% |
| Thai | 2,774 | 22.9% |
| Turkish | 79 | 0.6% |
| Ukrainian | 108 | 0.9% |
| Welsh | 39 | 0.3% | View All 56 Rows |
Immigrants in Wyndham
The most numerous immigrant groups reported in Wyndham came from Asia (2,428 | 20.1%), South Central Asia (1,678 | 13.9%), India (1,569 | 13.0%), Eastern Asia (400 | 3.3%), and South Eastern Asia (294 | 2.4%), together accounting for 52.6% of all Wyndham residents.
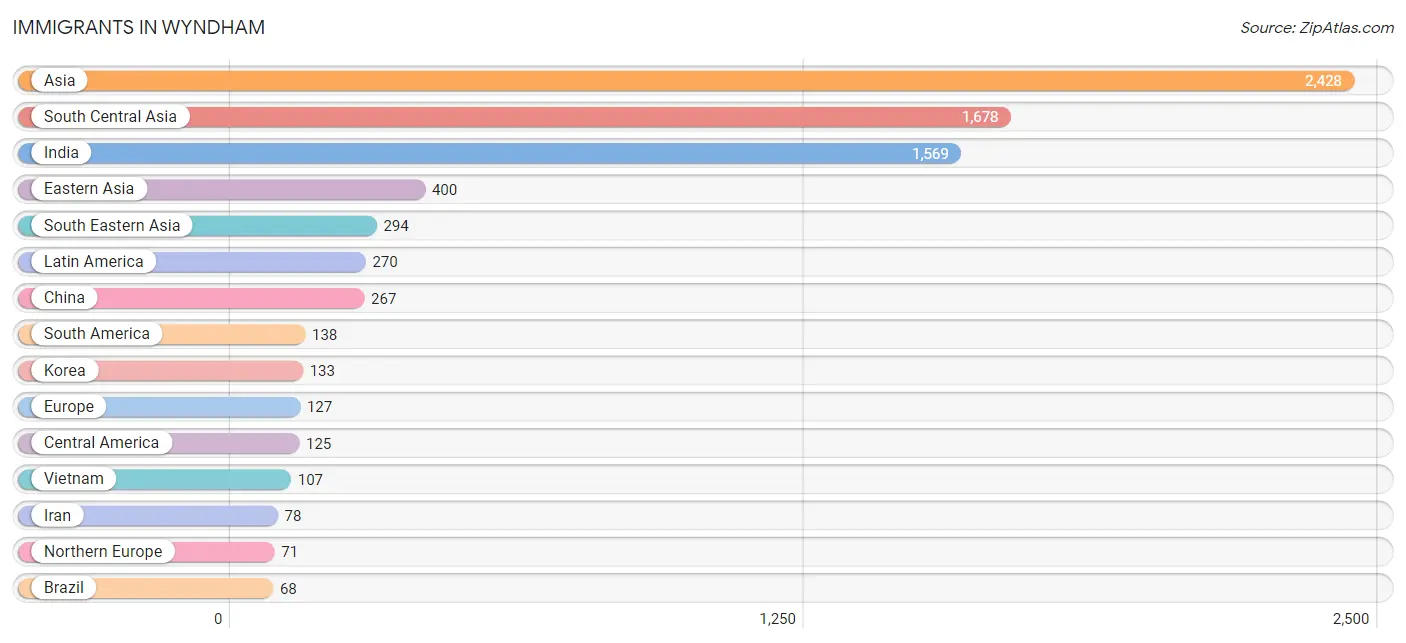
| Immigration Origin | # Population | % Population |
| Africa | 7 | 0.1% |
| Argentina | 55 | 0.4% |
| Asia | 2,428 | 20.1% |
| Bangladesh | 11 | 0.1% |
| Brazil | 68 | 0.6% |
| Caribbean | 7 | 0.1% |
| Central America | 125 | 1.0% |
| China | 267 | 2.2% |
| Eastern Africa | 7 | 0.1% |
| Eastern Asia | 400 | 3.3% |
| Eastern Europe | 56 | 0.5% |
| England | 18 | 0.2% |
| Europe | 127 | 1.1% |
| Fiji | 7 | 0.1% |
| Honduras | 32 | 0.3% |
| India | 1,569 | 13.0% |
| Iran | 78 | 0.6% |
| Kenya | 7 | 0.1% |
| Korea | 133 | 1.1% |
| Latin America | 270 | 2.2% |
| Latvia | 10 | 0.1% |
| Lebanon | 20 | 0.2% |
| Malaysia | 12 | 0.1% |
| Mexico | 64 | 0.5% |
| Nepal | 20 | 0.2% |
| Northern Europe | 71 | 0.6% |
| Oceania | 7 | 0.1% |
| Panama | 29 | 0.2% |
| Peru | 15 | 0.1% |
| Philippines | 14 | 0.1% |
| Poland | 8 | 0.1% |
| Scotland | 13 | 0.1% |
| South America | 138 | 1.1% |
| South Central Asia | 1,678 | 13.9% |
| South Eastern Asia | 294 | 2.4% |
| Taiwan | 14 | 0.1% |
| Trinidad and Tobago | 7 | 0.1% |
| Turkey | 36 | 0.3% |
| Ukraine | 38 | 0.3% |
| Vietnam | 107 | 0.9% |
| Western Asia | 56 | 0.5% | View All 41 Rows |
Sex and Age in Wyndham
Sex and Age in Wyndham
The most populous age groups in Wyndham are 40 to 44 Years (694 | 11.6%) for men and 10 to 14 Years (732 | 11.9%) for women.
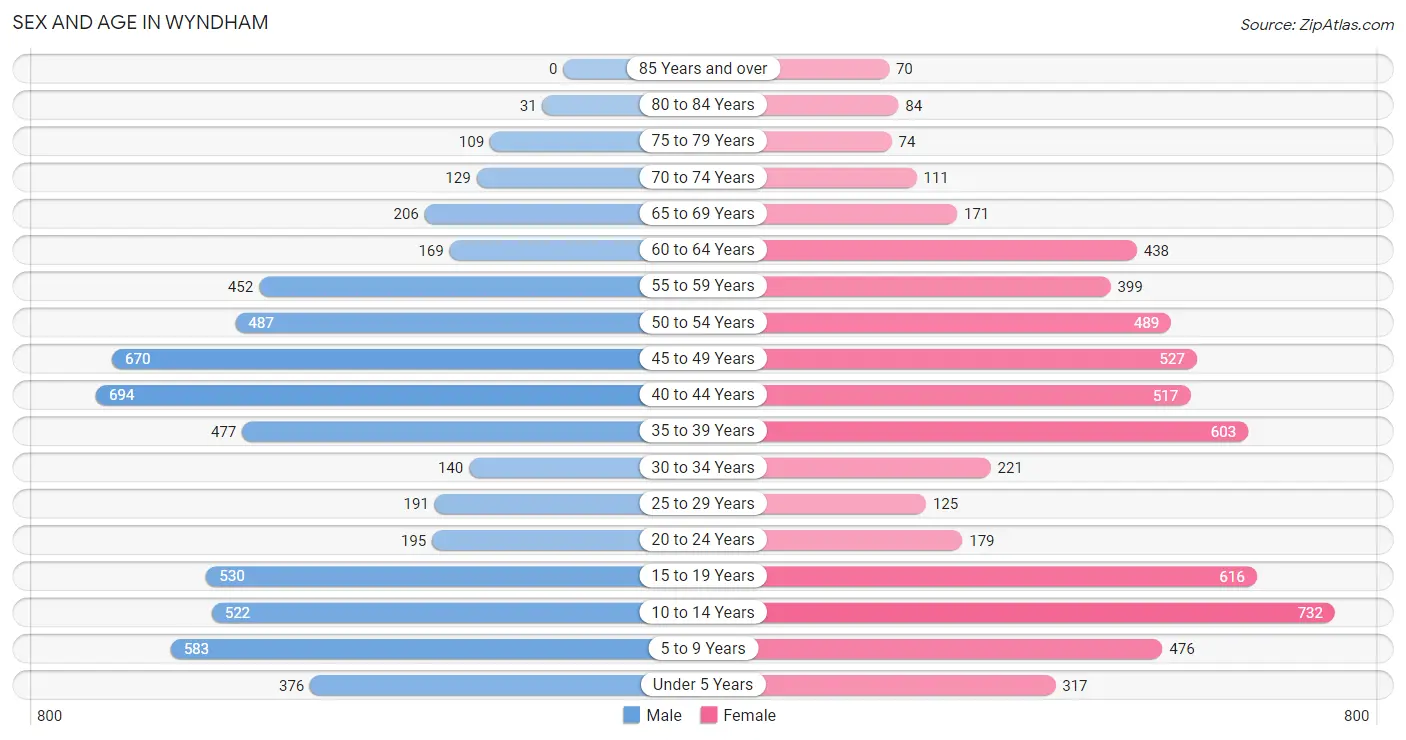
| Age Bracket | Male | Female |
| Under 5 Years | 376 (6.3%) | 317 (5.2%) |
| 5 to 9 Years | 583 (9.8%) | 476 (7.7%) |
| 10 to 14 Years | 522 (8.8%) | 732 (11.9%) |
| 15 to 19 Years | 530 (8.9%) | 616 (10.0%) |
| 20 to 24 Years | 195 (3.3%) | 179 (2.9%) |
| 25 to 29 Years | 191 (3.2%) | 125 (2.0%) |
| 30 to 34 Years | 140 (2.4%) | 221 (3.6%) |
| 35 to 39 Years | 477 (8.0%) | 603 (9.8%) |
| 40 to 44 Years | 694 (11.6%) | 517 (8.4%) |
| 45 to 49 Years | 670 (11.2%) | 527 (8.6%) |
| 50 to 54 Years | 487 (8.2%) | 489 (8.0%) |
| 55 to 59 Years | 452 (7.6%) | 399 (6.5%) |
| 60 to 64 Years | 169 (2.8%) | 438 (7.1%) |
| 65 to 69 Years | 206 (3.5%) | 171 (2.8%) |
| 70 to 74 Years | 129 (2.2%) | 111 (1.8%) |
| 75 to 79 Years | 109 (1.8%) | 74 (1.2%) |
| 80 to 84 Years | 31 (0.5%) | 84 (1.4%) |
| 85 Years and over | 0 (0.0%) | 70 (1.1%) |
| Total | 5,961 (100.0%) | 6,149 (100.0%) |
Families and Households in Wyndham
Median Family Size in Wyndham
The median family size in Wyndham is 3.39 persons per family, with married-couple families (3,082 | 91.7%) accounting for the largest median family size of 3.48 persons per family. On the other hand, single male/father families (128 | 3.8%) represent the smallest median family size with 2.23 persons per family.
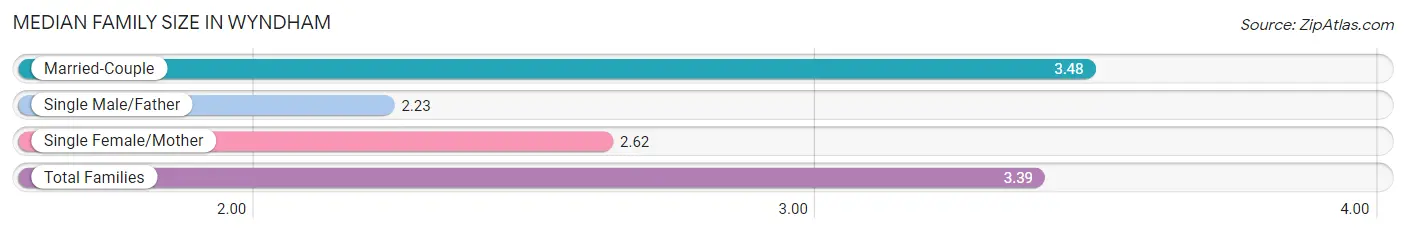
| Family Type | # Families | Family Size |
| Married-Couple | 3,082 (91.7%) | 3.48 |
| Single Male/Father | 128 (3.8%) | 2.23 |
| Single Female/Mother | 152 (4.5%) | 2.62 |
| Total Families | 3,362 (100.0%) | 3.39 |
Median Household Size in Wyndham
The median household size in Wyndham is 3.12 persons per household, with married-couple households (3,082 | 79.3%) accounting for the largest median household size of 3.49 persons per household. non-family households (525 | 13.5%) represent the smallest median household size with 1.17 persons per household.
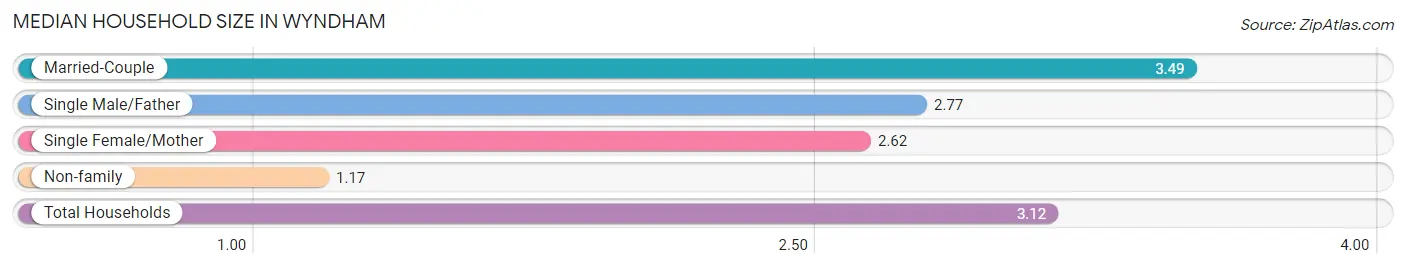
| Household Type | # Households | Household Size |
| Married-Couple | 3,082 (79.3%) | 3.49 |
| Single Male/Father | 128 (3.3%) | 2.77 |
| Single Female/Mother | 152 (3.9%) | 2.62 |
| Non-family | 525 (13.5%) | 1.17 |
| Total Households | 3,887 (100.0%) | 3.12 |
Household Size by Marriage Status in Wyndham
Out of a total of 3,887 households in Wyndham, 3,362 (86.5%) are family households, while 525 (13.5%) are nonfamily households. The most numerous type of family households are 4-person households, comprising 1,067, and the most common type of nonfamily households are 1-person households, comprising 442.
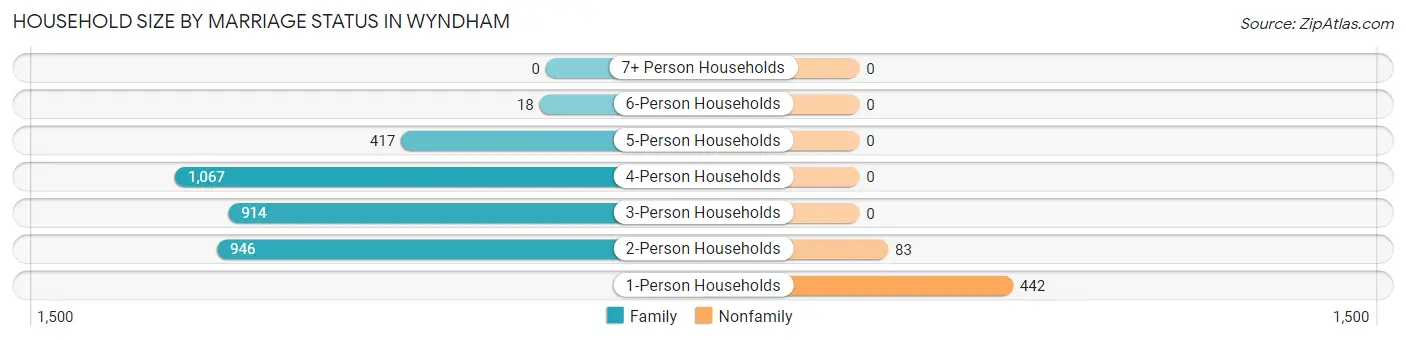
| Household Size | Family Households | Nonfamily Households |
| 1-Person Households | - | 442 (11.4%) |
| 2-Person Households | 946 (24.3%) | 83 (2.1%) |
| 3-Person Households | 914 (23.5%) | 0 (0.0%) |
| 4-Person Households | 1,067 (27.5%) | 0 (0.0%) |
| 5-Person Households | 417 (10.7%) | 0 (0.0%) |
| 6-Person Households | 18 (0.5%) | 0 (0.0%) |
| 7+ Person Households | 0 (0.0%) | 0 (0.0%) |
| Total | 3,362 (86.5%) | 525 (13.5%) |
Female Fertility in Wyndham
Fertility by Age in Wyndham
Average fertility rate in Wyndham is 21.0 births per 1,000 women. Women in the age bracket of 20 to 34 years have the highest fertility rate with 107.0 births per 1,000 women. Women in the age bracket of 20 to 34 years acount for 88.9% of all women with births.
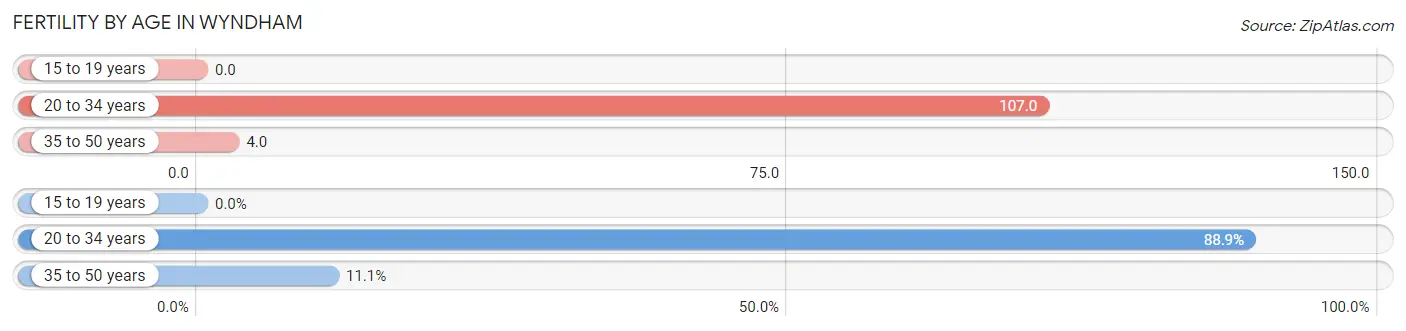
| Age Bracket | Women with Births | Births / 1,000 Women |
| 15 to 19 years | 0 (0.0%) | 0.0 |
| 20 to 34 years | 56 (88.9%) | 107.0 |
| 35 to 50 years | 7 (11.1%) | 4.0 |
| Total | 63 (100.0%) | 21.0 |
Fertility by Age by Marriage Status in Wyndham
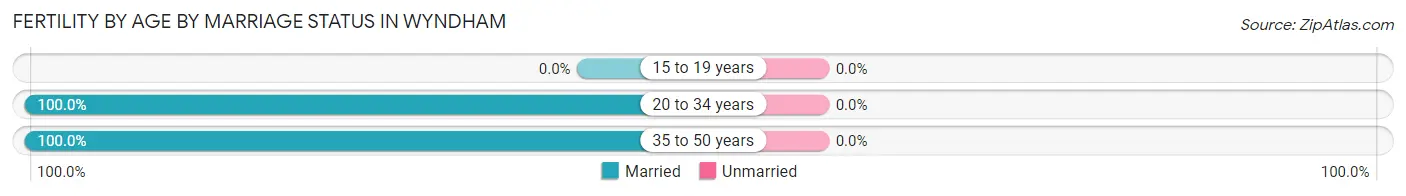
| Age Bracket | Married | Unmarried |
| 15 to 19 years | 0 (0.0%) | 0 (0.0%) |
| 20 to 34 years | 56 (100.0%) | 0 (0.0%) |
| 35 to 50 years | 7 (100.0%) | 0 (0.0%) |
| Total | 63 (100.0%) | 0 (0.0%) |
Fertility by Education in Wyndham
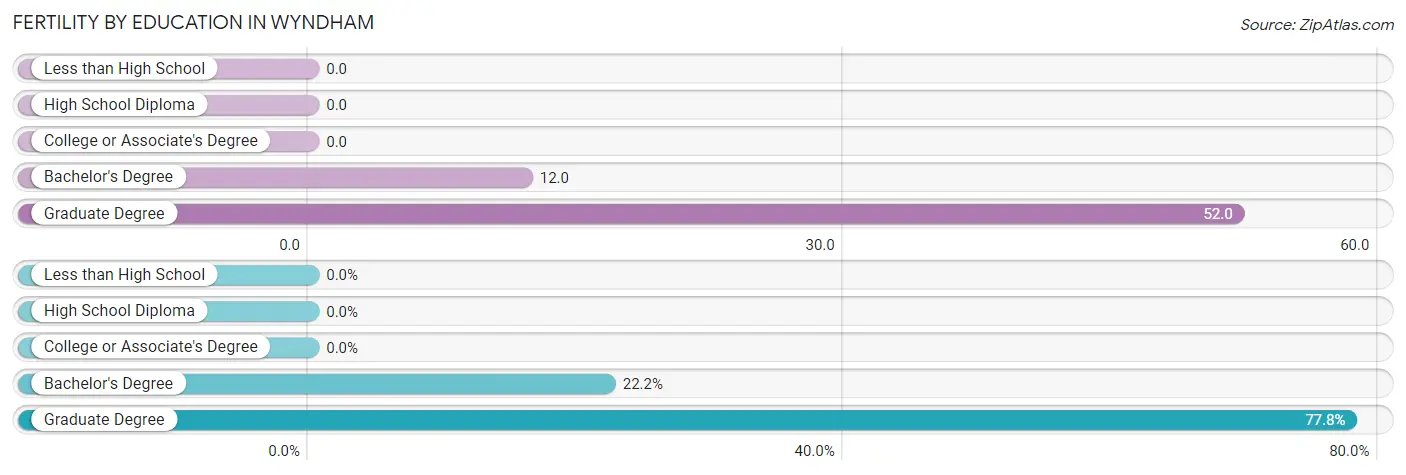
| Educational Attainment | Women with Births | Births / 1,000 Women |
| Less than High School | 0 (0.0%) | 0.0 |
| High School Diploma | 0 (0.0%) | 0.0 |
| College or Associate's Degree | 0 (0.0%) | 0.0 |
| Bachelor's Degree | 14 (22.2%) | 12.0 |
| Graduate Degree | 49 (77.8%) | 52.0 |
| Total | 63 (100.0%) | 21.0 |
Fertility by Education by Marriage Status in Wyndham
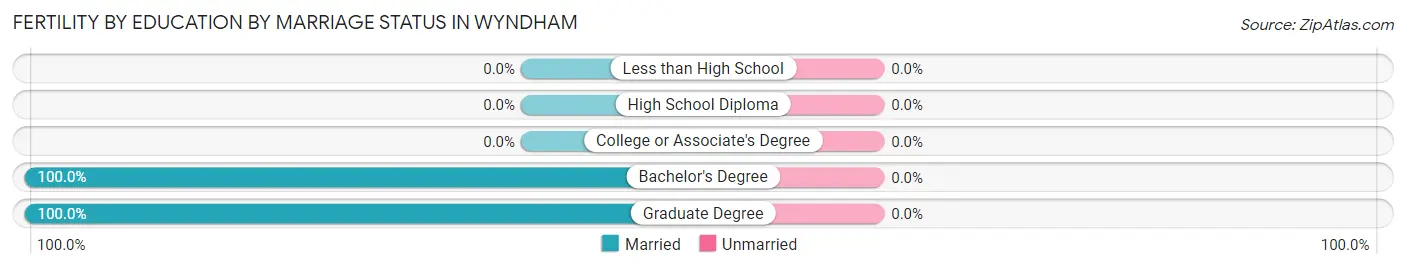
| Educational Attainment | Married | Unmarried |
| Less than High School | 0 (0.0%) | 0 (0.0%) |
| High School Diploma | 0 (0.0%) | 0 (0.0%) |
| College or Associate's Degree | 0 (0.0%) | 0 (0.0%) |
| Bachelor's Degree | 14 (100.0%) | 0 (0.0%) |
| Graduate Degree | 49 (100.0%) | 0 (0.0%) |
| Total | 63 (100.0%) | 0 (0.0%) |
Employment Characteristics in Wyndham
Employment by Class of Employer in Wyndham
Among the 6,298 employed individuals in Wyndham, private company employees (3,999 | 63.5%), self-employed (incorporated) (536 | 8.5%), and state government employees (494 | 7.8%) make up the most common classes of employment.
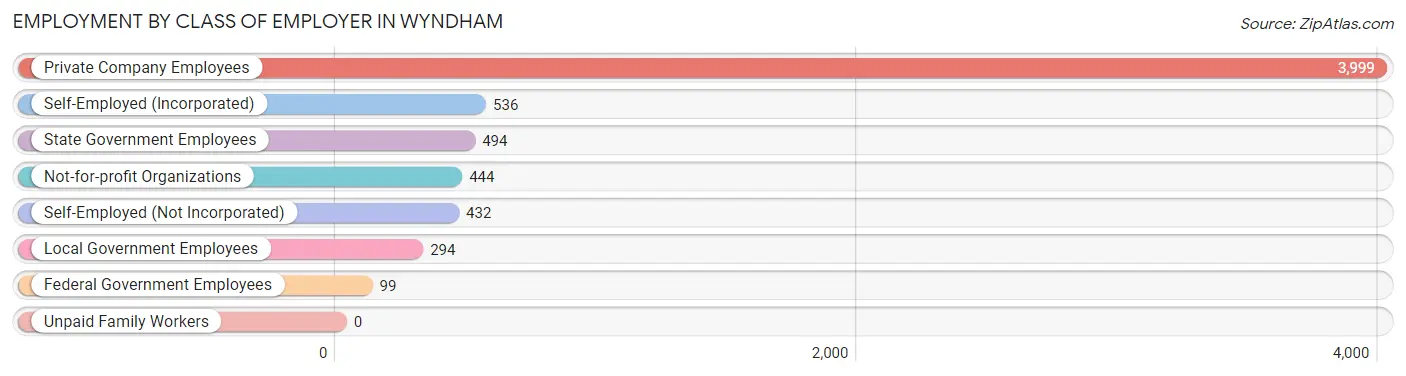
| Employer Class | # Employees | % Employees |
| Private Company Employees | 3,999 | 63.5% |
| Self-Employed (Incorporated) | 536 | 8.5% |
| Self-Employed (Not Incorporated) | 432 | 6.9% |
| Not-for-profit Organizations | 444 | 7.0% |
| Local Government Employees | 294 | 4.7% |
| State Government Employees | 494 | 7.8% |
| Federal Government Employees | 99 | 1.6% |
| Unpaid Family Workers | 0 | 0.0% |
| Total | 6,298 | 100.0% |
Employment Status by Age in Wyndham
According to the labor force statistics for Wyndham, out of the total population over 16 years of age (8,812), 74.4% or 6,556 individuals are in the labor force, with 3.1% or 203 of them unemployed. The age group with the highest labor force participation rate is 35 to 44 years, with 90.9% or 2,083 individuals in the labor force. Within the labor force, the 20 to 24 years age range has the highest percentage of unemployed individuals, with 13.3% or 33 of them being unemployed.
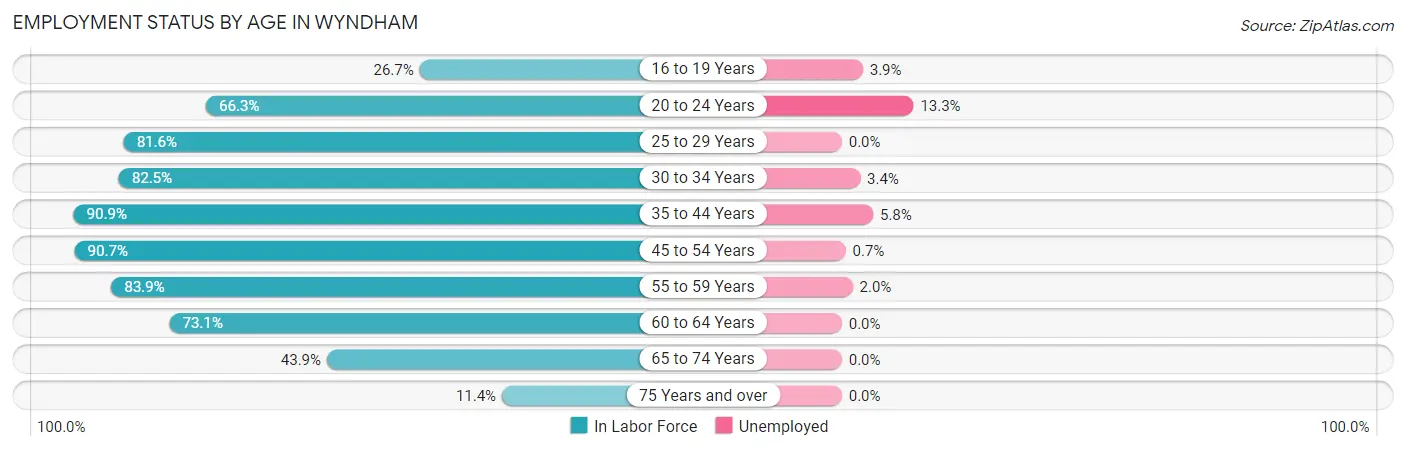
| Age Bracket | In Labor Force | Unemployed |
| 16 to 19 Years | 228 (26.7%) | 9 (3.9%) |
| 20 to 24 Years | 248 (66.3%) | 33 (13.3%) |
| 25 to 29 Years | 258 (81.6%) | 0 (0.0%) |
| 30 to 34 Years | 298 (82.5%) | 10 (3.4%) |
| 35 to 44 Years | 2,083 (90.9%) | 121 (5.8%) |
| 45 to 54 Years | 1,971 (90.7%) | 14 (0.7%) |
| 55 to 59 Years | 714 (83.9%) | 14 (2.0%) |
| 60 to 64 Years | 444 (73.1%) | 0 (0.0%) |
| 65 to 74 Years | 271 (43.9%) | 0 (0.0%) |
| 75 Years and over | 42 (11.4%) | 0 (0.0%) |
| Total | 6,556 (74.4%) | 203 (3.1%) |
Employment Status by Educational Attainment in Wyndham
According to labor force statistics for Wyndham, 87.4% of individuals (5,768) out of the total population between 25 and 64 years of age (6,599) are in the labor force, with 2.7% or 156 of them being unemployed. The group with the highest labor force participation rate are those with the educational attainment of bachelor's degree or higher, with 90.2% or 5,228 individuals in the labor force. Within the labor force, individuals with bachelor's degree or higher education have the highest percentage of unemployment, with 3.0% or 157 of them being unemployed.
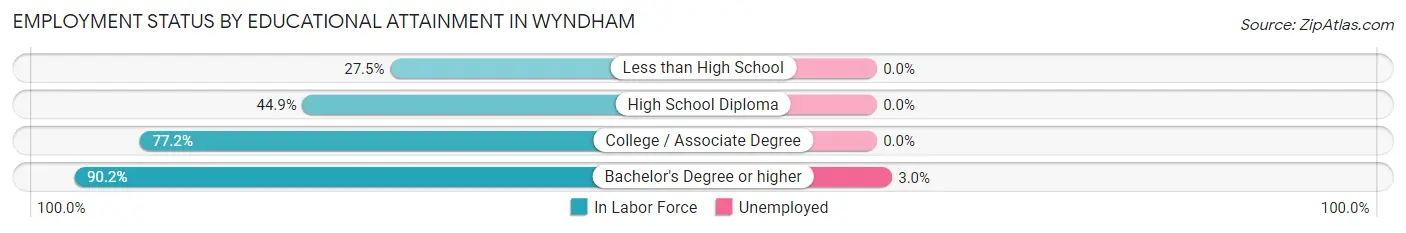
| Educational Attainment | In Labor Force | Unemployed |
| Less than High School | 14 (27.5%) | 0 (0.0%) |
| High School Diploma | 80 (44.9%) | 0 (0.0%) |
| College / Associate Degree | 443 (77.2%) | 0 (0.0%) |
| Bachelor's Degree or higher | 5,228 (90.2%) | 174 (3.0%) |
| Total | 5,768 (87.4%) | 178 (2.7%) |
Employment Occupations by Sex in Wyndham
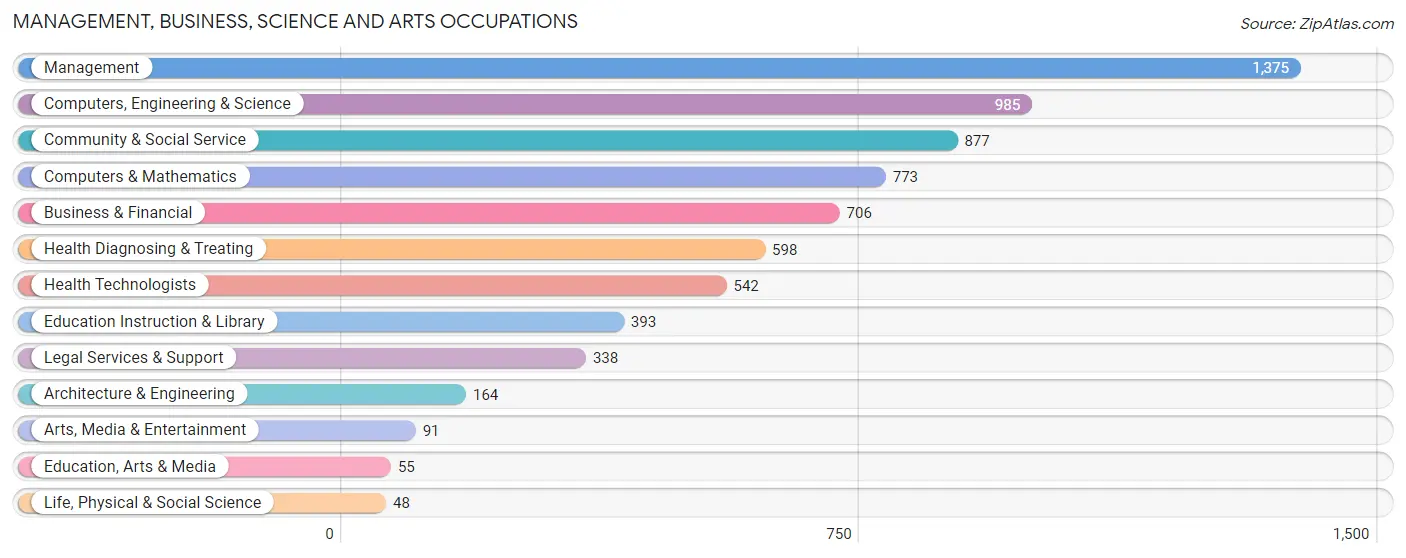
Management, Business, Science and Arts Occupations
The most common Management, Business, Science and Arts occupations in Wyndham are Management (1,375 | 21.6%), Computers, Engineering & Science (985 | 15.5%), Community & Social Service (877 | 13.8%), Computers & Mathematics (773 | 12.2%), and Business & Financial (706 | 11.1%).
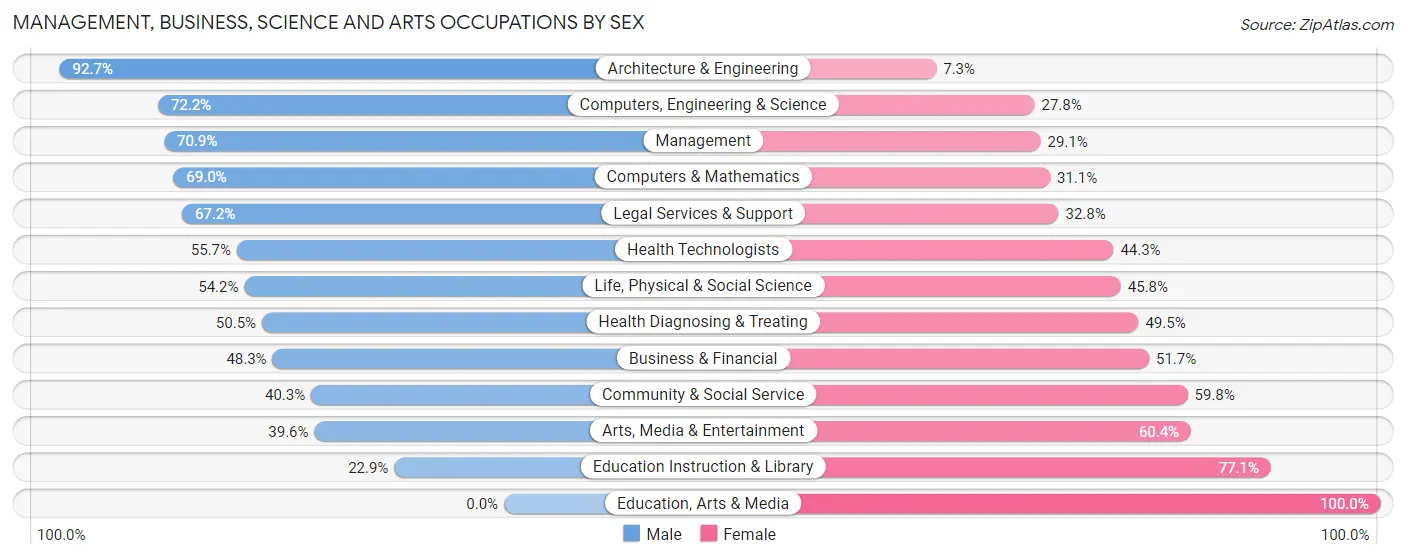
Management, Business, Science and Arts Occupations by Sex
Within the Management, Business, Science and Arts occupations in Wyndham, the most male-oriented occupations are Architecture & Engineering (92.7%), Computers, Engineering & Science (72.2%), and Management (70.9%), while the most female-oriented occupations are Education, Arts & Media (100.0%), Education Instruction & Library (77.1%), and Arts, Media & Entertainment (60.4%).
| Occupation | Male | Female |
| Management | 975 (70.9%) | 400 (29.1%) |
| Business & Financial | 341 (48.3%) | 365 (51.7%) |
| Computers, Engineering & Science | 711 (72.2%) | 274 (27.8%) |
| Computers & Mathematics | 533 (69.0%) | 240 (31.0%) |
| Architecture & Engineering | 152 (92.7%) | 12 (7.3%) |
| Life, Physical & Social Science | 26 (54.2%) | 22 (45.8%) |
| Community & Social Service | 353 (40.3%) | 524 (59.8%) |
| Education, Arts & Media | 0 (0.0%) | 55 (100.0%) |
| Legal Services & Support | 227 (67.2%) | 111 (32.8%) |
| Education Instruction & Library | 90 (22.9%) | 303 (77.1%) |
| Arts, Media & Entertainment | 36 (39.6%) | 55 (60.4%) |
| Health Diagnosing & Treating | 302 (50.5%) | 296 (49.5%) |
| Health Technologists | 302 (55.7%) | 240 (44.3%) |
| Total (Category) | 2,682 (59.1%) | 1,859 (40.9%) |
| Total (Overall) | 3,595 (56.6%) | 2,761 (43.4%) |
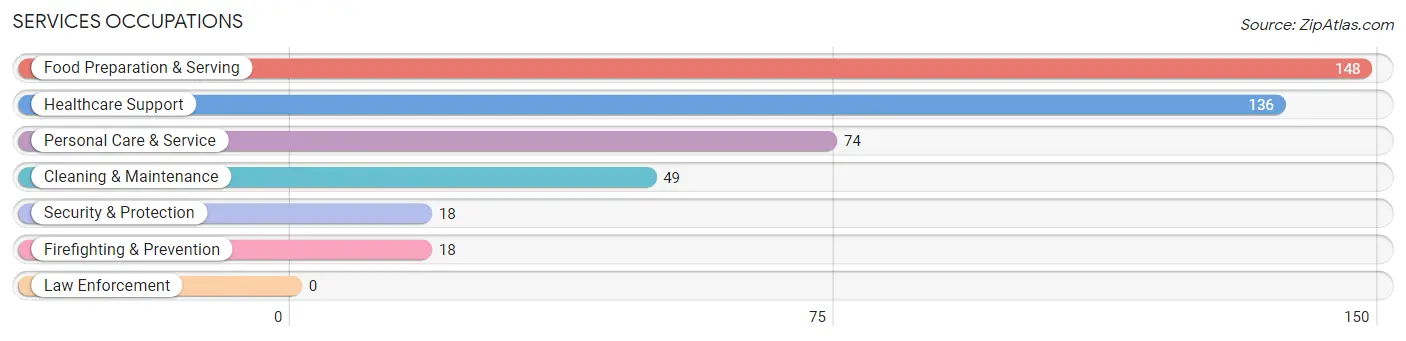
Services Occupations
The most common Services occupations in Wyndham are Food Preparation & Serving (148 | 2.3%), Healthcare Support (136 | 2.1%), Personal Care & Service (74 | 1.2%), Cleaning & Maintenance (49 | 0.8%), and Security & Protection (18 | 0.3%).
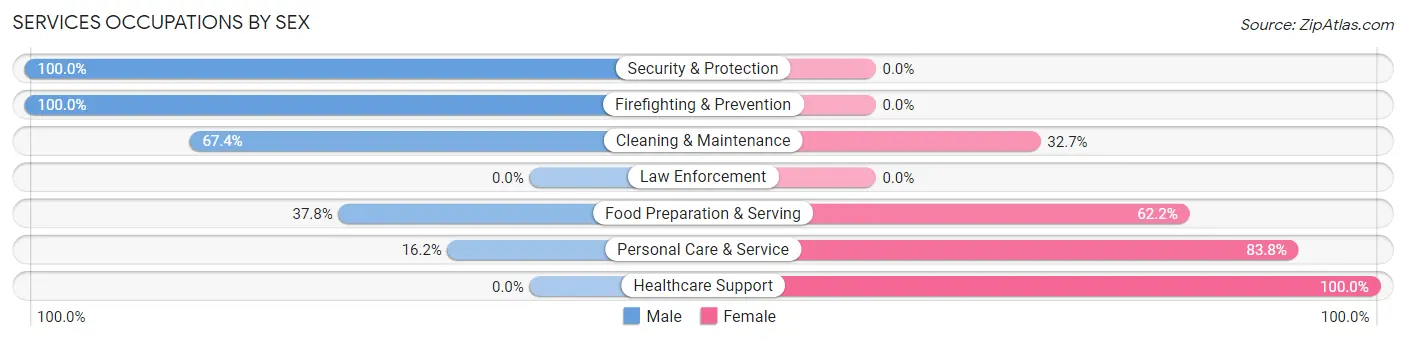
Services Occupations by Sex
Within the Services occupations in Wyndham, the most male-oriented occupations are Security & Protection (100.0%), Firefighting & Prevention (100.0%), and Cleaning & Maintenance (67.3%), while the most female-oriented occupations are Healthcare Support (100.0%), Personal Care & Service (83.8%), and Food Preparation & Serving (62.2%).
| Occupation | Male | Female |
| Healthcare Support | 0 (0.0%) | 136 (100.0%) |
| Security & Protection | 18 (100.0%) | 0 (0.0%) |
| Firefighting & Prevention | 18 (100.0%) | 0 (0.0%) |
| Law Enforcement | 0 (0.0%) | 0 (0.0%) |
| Food Preparation & Serving | 56 (37.8%) | 92 (62.2%) |
| Cleaning & Maintenance | 33 (67.3%) | 16 (32.7%) |
| Personal Care & Service | 12 (16.2%) | 62 (83.8%) |
| Total (Category) | 119 (28.0%) | 306 (72.0%) |
| Total (Overall) | 3,595 (56.6%) | 2,761 (43.4%) |
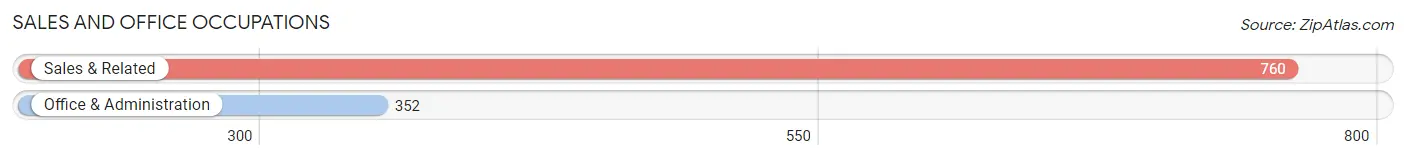
Sales and Office Occupations
The most common Sales and Office occupations in Wyndham are Sales & Related (760 | 12.0%), and Office & Administration (352 | 5.5%).
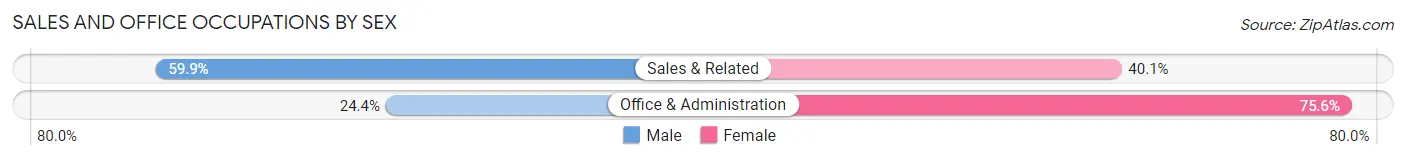
Sales and Office Occupations by Sex
| Occupation | Male | Female |
| Sales & Related | 455 (59.9%) | 305 (40.1%) |
| Office & Administration | 86 (24.4%) | 266 (75.6%) |
| Total (Category) | 541 (48.6%) | 571 (51.3%) |
| Total (Overall) | 3,595 (56.6%) | 2,761 (43.4%) |
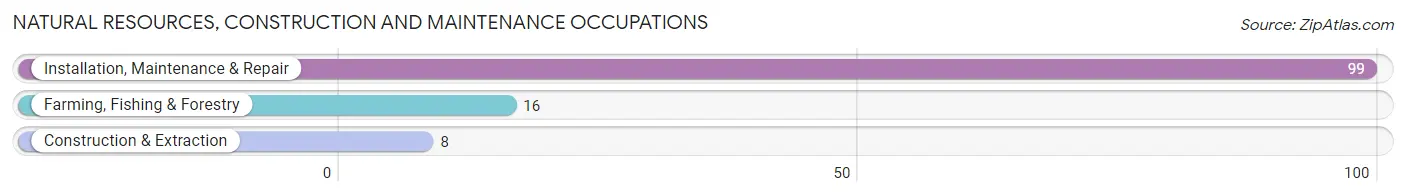
Natural Resources, Construction and Maintenance Occupations
The most common Natural Resources, Construction and Maintenance occupations in Wyndham are Installation, Maintenance & Repair (99 | 1.6%), Farming, Fishing & Forestry (16 | 0.3%), and Construction & Extraction (8 | 0.1%).
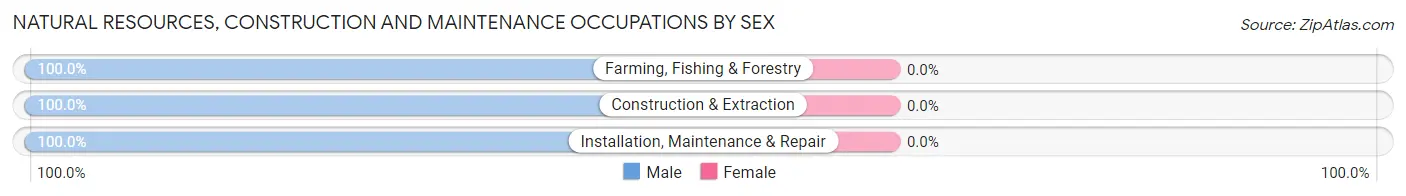
Natural Resources, Construction and Maintenance Occupations by Sex
| Occupation | Male | Female |
| Farming, Fishing & Forestry | 16 (100.0%) | 0 (0.0%) |
| Construction & Extraction | 8 (100.0%) | 0 (0.0%) |
| Installation, Maintenance & Repair | 99 (100.0%) | 0 (0.0%) |
| Total (Category) | 123 (100.0%) | 0 (0.0%) |
| Total (Overall) | 3,595 (56.6%) | 2,761 (43.4%) |
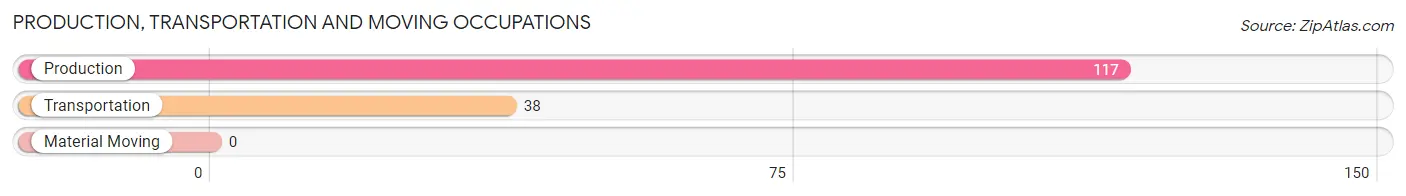
Production, Transportation and Moving Occupations
The most common Production, Transportation and Moving occupations in Wyndham are Production (117 | 1.8%), and Transportation (38 | 0.6%).
Production, Transportation and Moving Occupations by Sex
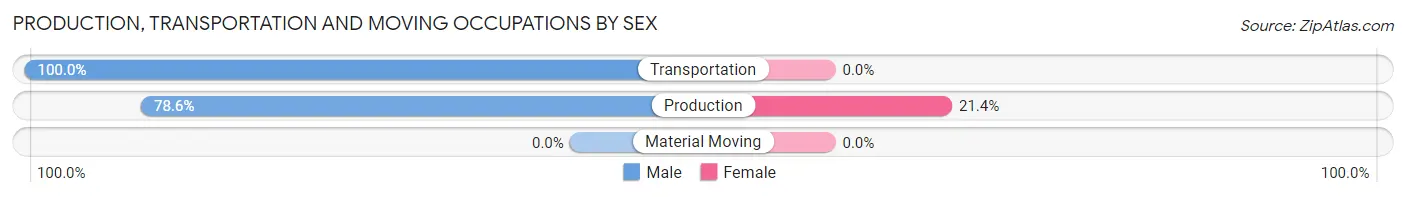
| Occupation | Male | Female |
| Production | 92 (78.6%) | 25 (21.4%) |
| Transportation | 38 (100.0%) | 0 (0.0%) |
| Material Moving | 0 (0.0%) | 0 (0.0%) |
| Total (Category) | 130 (83.9%) | 25 (16.1%) |
| Total (Overall) | 3,595 (56.6%) | 2,761 (43.4%) |
Employment Industries by Sex in Wyndham
Employment Industries in Wyndham
The major employment industries in Wyndham include Professional & Scientific (1,103 | 17.3%), Finance & Insurance (1,034 | 16.3%), Health Care & Social Assistance (886 | 13.9%), Educational Services (586 | 9.2%), and Retail Trade (494 | 7.8%).
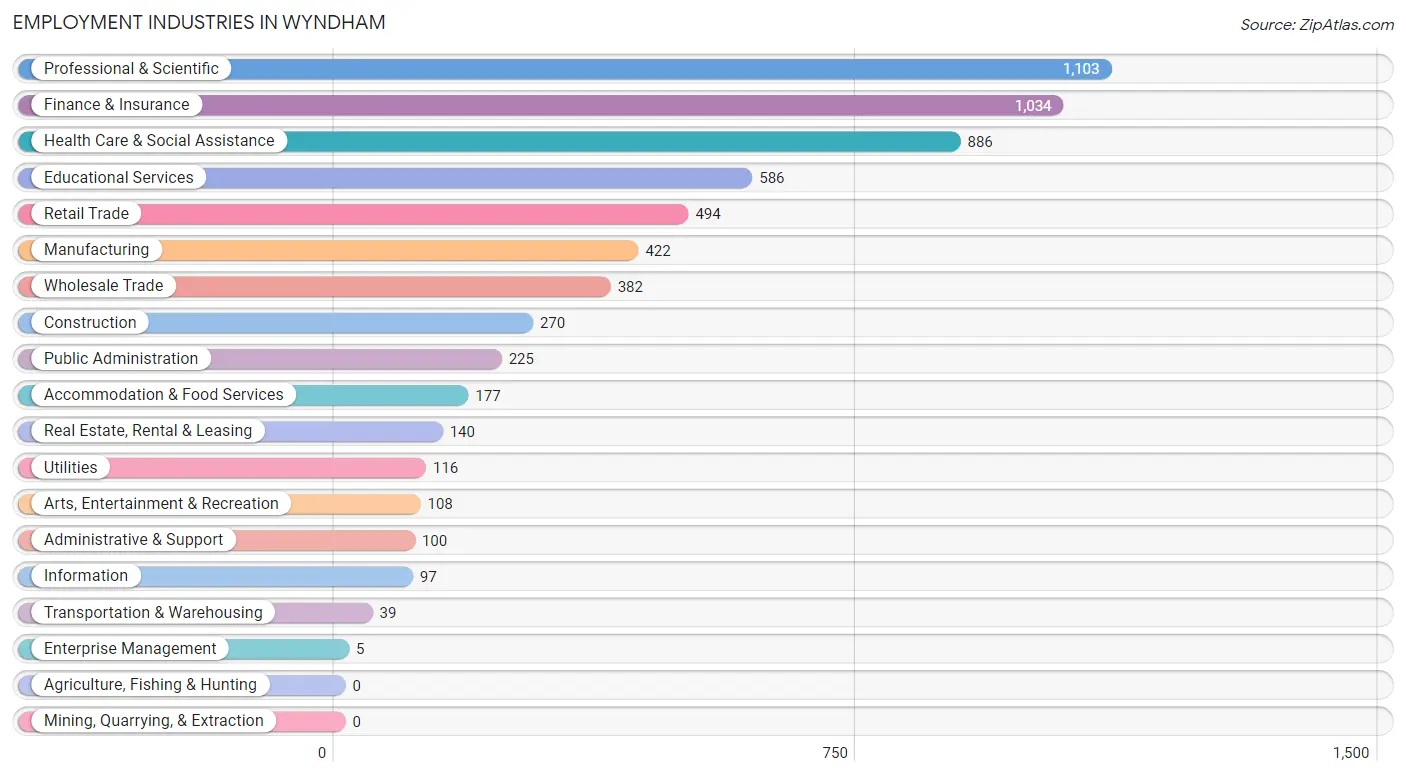
Employment Industries by Sex in Wyndham
The Wyndham industries that see more men than women are Transportation & Warehousing (100.0%), Wholesale Trade (77.7%), and Construction (75.9%), whereas the industries that tend to have a higher number of women are Enterprise Management (100.0%), Real Estate, Rental & Leasing (66.4%), and Educational Services (63.3%).
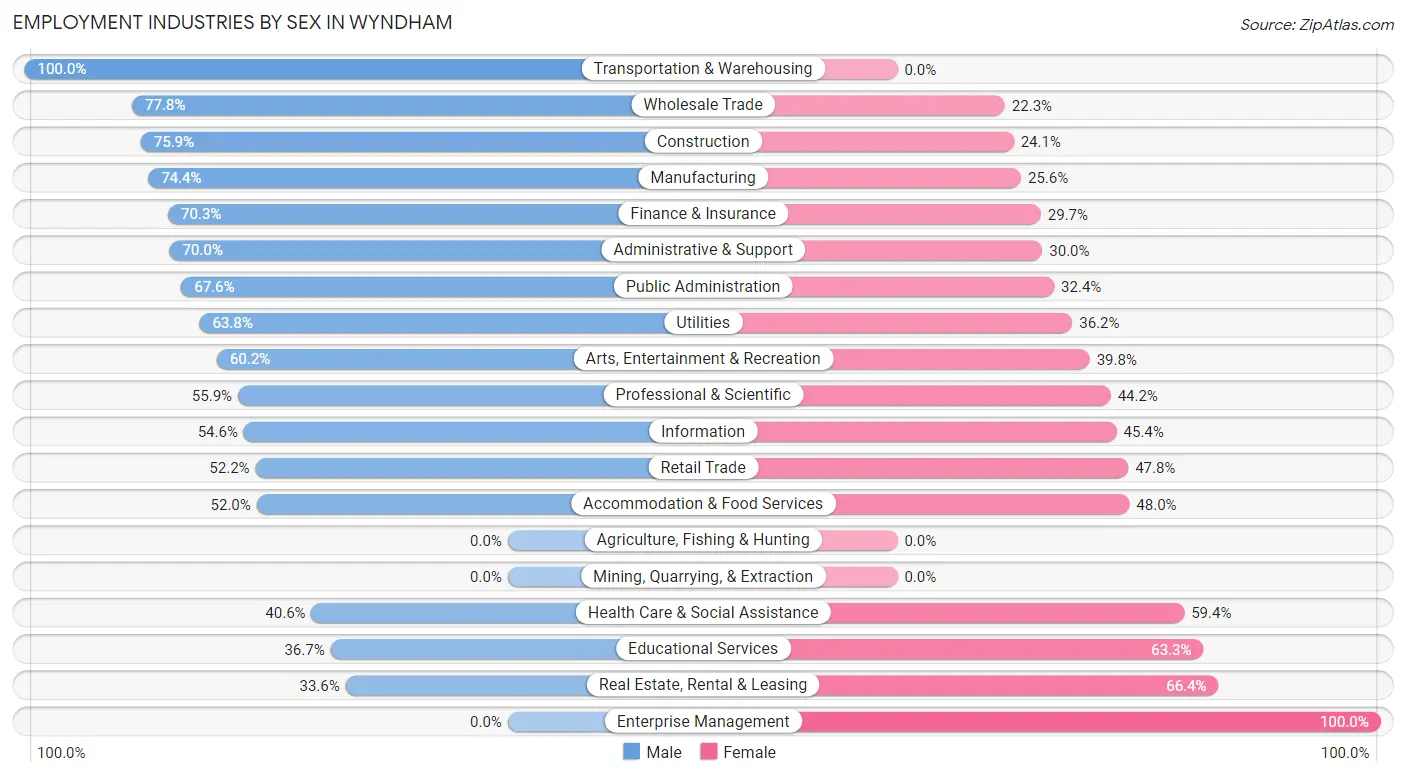
| Industry | Male | Female |
| Agriculture, Fishing & Hunting | 0 (0.0%) | 0 (0.0%) |
| Mining, Quarrying, & Extraction | 0 (0.0%) | 0 (0.0%) |
| Construction | 205 (75.9%) | 65 (24.1%) |
| Manufacturing | 314 (74.4%) | 108 (25.6%) |
| Wholesale Trade | 297 (77.7%) | 85 (22.3%) |
| Retail Trade | 258 (52.2%) | 236 (47.8%) |
| Transportation & Warehousing | 39 (100.0%) | 0 (0.0%) |
| Utilities | 74 (63.8%) | 42 (36.2%) |
| Information | 53 (54.6%) | 44 (45.4%) |
| Finance & Insurance | 727 (70.3%) | 307 (29.7%) |
| Real Estate, Rental & Leasing | 47 (33.6%) | 93 (66.4%) |
| Professional & Scientific | 616 (55.8%) | 487 (44.2%) |
| Enterprise Management | 0 (0.0%) | 5 (100.0%) |
| Administrative & Support | 70 (70.0%) | 30 (30.0%) |
| Educational Services | 215 (36.7%) | 371 (63.3%) |
| Health Care & Social Assistance | 360 (40.6%) | 526 (59.4%) |
| Arts, Entertainment & Recreation | 65 (60.2%) | 43 (39.8%) |
| Accommodation & Food Services | 92 (52.0%) | 85 (48.0%) |
| Public Administration | 152 (67.6%) | 73 (32.4%) |
| Total | 3,595 (56.6%) | 2,761 (43.4%) |
Education in Wyndham
School Enrollment in Wyndham
The most common levels of schooling among the 3,864 students in Wyndham are high school (1,132 | 29.3%), middle school (1,038 | 26.9%), and elementary school (939 | 24.3%).
| School Level | # Students | % Students |
| Nursery / Preschool | 155 | 4.0% |
| Kindergarten | 170 | 4.4% |
| Elementary School | 939 | 24.3% |
| Middle School | 1,038 | 26.9% |
| High School | 1,132 | 29.3% |
| College / Undergraduate | 355 | 9.2% |
| Graduate / Professional | 75 | 1.9% |
| Total | 3,864 | 100.0% |
School Enrollment by Age by Funding Source in Wyndham
Out of a total of 3,864 students who are enrolled in schools in Wyndham, 425 (11.0%) attend a private institution, while the remaining 3,439 (89.0%) are enrolled in public schools. The age group of 3 to 4 year olds has the highest likelihood of being enrolled in private schools, with 77 (55.4% in the age bracket) enrolled. Conversely, the age group of 5 to 9 year old has the lowest likelihood of being enrolled in a private school, with 1,023 (96.6% in the age bracket) attending a public institution.
| Age Bracket | Public School | Private School |
| 3 to 4 Year Olds | 62 (44.6%) | 77 (55.4%) |
| 5 to 9 Year Old | 1,023 (96.6%) | 36 (3.4%) |
| 10 to 14 Year Olds | 1,196 (95.8%) | 53 (4.2%) |
| 15 to 17 Year Olds | 775 (88.1%) | 105 (11.9%) |
| 18 to 19 Year Olds | 197 (78.2%) | 55 (21.8%) |
| 20 to 24 Year Olds | 129 (62.6%) | 77 (37.4%) |
| 25 to 34 Year Olds | 44 (73.3%) | 16 (26.7%) |
| 35 Years and over | 12 (63.2%) | 7 (36.8%) |
| Total | 3,439 (89.0%) | 425 (11.0%) |
Educational Attainment by Field of Study in Wyndham
Business (1,385 | 20.7%), engineering (1,024 | 15.3%), computers & mathematics (750 | 11.2%), science & technology (650 | 9.7%), and bio, nature & agricultural (646 | 9.7%) are the most common fields of study among 6,686 individuals in Wyndham who have obtained a bachelor's degree or higher.
| Field of Study | # Graduates | % Graduates |
| Computers & Mathematics | 750 | 11.2% |
| Bio, Nature & Agricultural | 646 | 9.7% |
| Physical & Health Sciences | 175 | 2.6% |
| Psychology | 210 | 3.1% |
| Social Sciences | 573 | 8.6% |
| Engineering | 1,024 | 15.3% |
| Multidisciplinary Studies | 24 | 0.4% |
| Science & Technology | 650 | 9.7% |
| Business | 1,385 | 20.7% |
| Education | 331 | 5.0% |
| Literature & Languages | 215 | 3.2% |
| Liberal Arts & History | 167 | 2.5% |
| Visual & Performing Arts | 63 | 0.9% |
| Communications | 118 | 1.8% |
| Arts & Humanities | 355 | 5.3% |
| Total | 6,686 | 100.0% |
Transportation & Commute in Wyndham
Vehicle Availability by Sex in Wyndham
The most prevalent vehicle ownership categories in Wyndham are males with 2 vehicles (1,604, accounting for 44.6%) and females with 2 vehicles (1,326, making up 59.3%).
| Vehicles Available | Male | Female |
| No Vehicle | 173 (4.8%) | 106 (3.9%) |
| 1 Vehicle | 218 (6.1%) | 195 (7.2%) |
| 2 Vehicles | 1,604 (44.6%) | 1,326 (49.1%) |
| 3 Vehicles | 940 (26.2%) | 642 (23.7%) |
| 4 Vehicles | 339 (9.4%) | 277 (10.2%) |
| 5 or more Vehicles | 321 (8.9%) | 157 (5.8%) |
| Total | 3,595 (100.0%) | 2,703 (100.0%) |
Commute Time in Wyndham
The most frequently occuring commute durations in Wyndham are 20 to 24 minutes (798 commuters, 18.3%), 15 to 19 minutes (764 commuters, 17.6%), and 30 to 34 minutes (746 commuters, 17.2%).
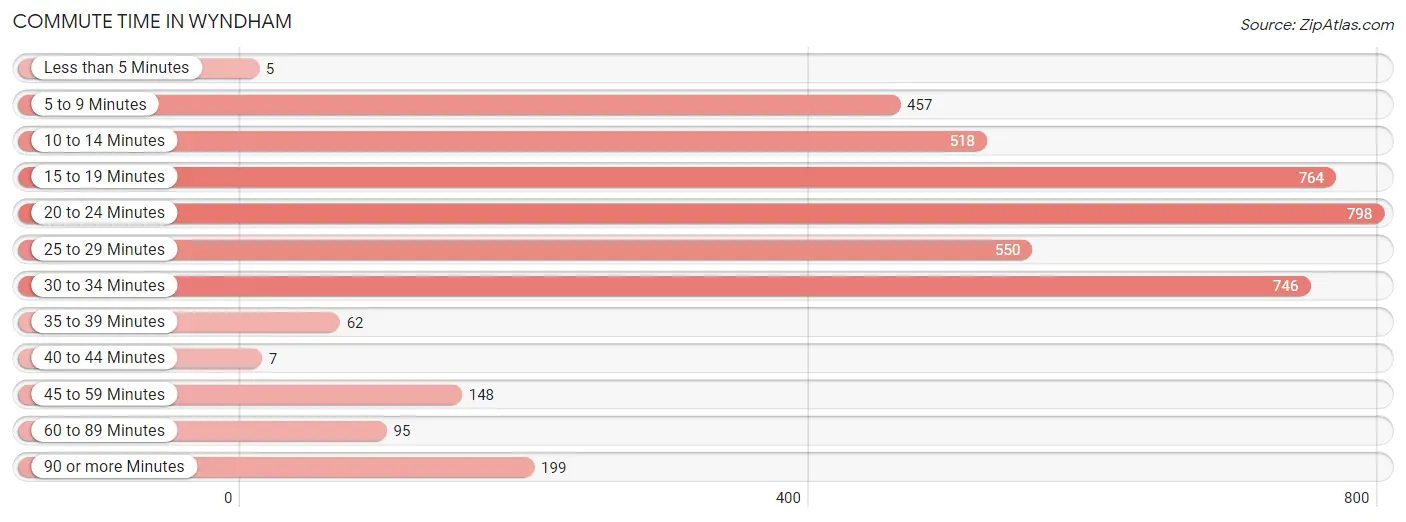
| Commute Time | # Commuters | % Commuters |
| Less than 5 Minutes | 5 | 0.1% |
| 5 to 9 Minutes | 457 | 10.5% |
| 10 to 14 Minutes | 518 | 11.9% |
| 15 to 19 Minutes | 764 | 17.6% |
| 20 to 24 Minutes | 798 | 18.3% |
| 25 to 29 Minutes | 550 | 12.7% |
| 30 to 34 Minutes | 746 | 17.2% |
| 35 to 39 Minutes | 62 | 1.4% |
| 40 to 44 Minutes | 7 | 0.2% |
| 45 to 59 Minutes | 148 | 3.4% |
| 60 to 89 Minutes | 95 | 2.2% |
| 90 or more Minutes | 199 | 4.6% |
Commute Time by Sex in Wyndham
The most common commute times in Wyndham are 30 to 34 minutes (509 commuters, 22.0%) for males and 15 to 19 minutes (467 commuters, 22.9%) for females.
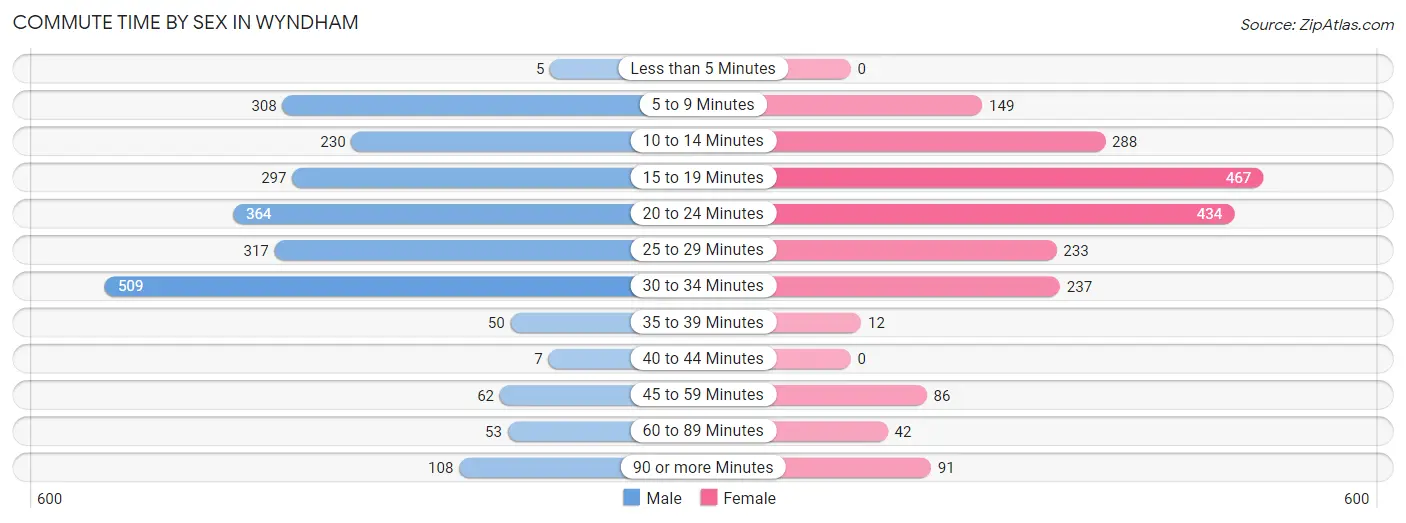
| Commute Time | Male | Female |
| Less than 5 Minutes | 5 (0.2%) | 0 (0.0%) |
| 5 to 9 Minutes | 308 (13.3%) | 149 (7.3%) |
| 10 to 14 Minutes | 230 (10.0%) | 288 (14.1%) |
| 15 to 19 Minutes | 297 (12.9%) | 467 (22.9%) |
| 20 to 24 Minutes | 364 (15.8%) | 434 (21.3%) |
| 25 to 29 Minutes | 317 (13.7%) | 233 (11.4%) |
| 30 to 34 Minutes | 509 (22.0%) | 237 (11.6%) |
| 35 to 39 Minutes | 50 (2.2%) | 12 (0.6%) |
| 40 to 44 Minutes | 7 (0.3%) | 0 (0.0%) |
| 45 to 59 Minutes | 62 (2.7%) | 86 (4.2%) |
| 60 to 89 Minutes | 53 (2.3%) | 42 (2.1%) |
| 90 or more Minutes | 108 (4.7%) | 91 (4.5%) |
Time of Departure to Work by Sex in Wyndham
The most frequent times of departure to work in Wyndham are 8:00 AM to 8:29 AM (541, 23.4%) for males and 8:00 AM to 8:29 AM (537, 26.3%) for females.
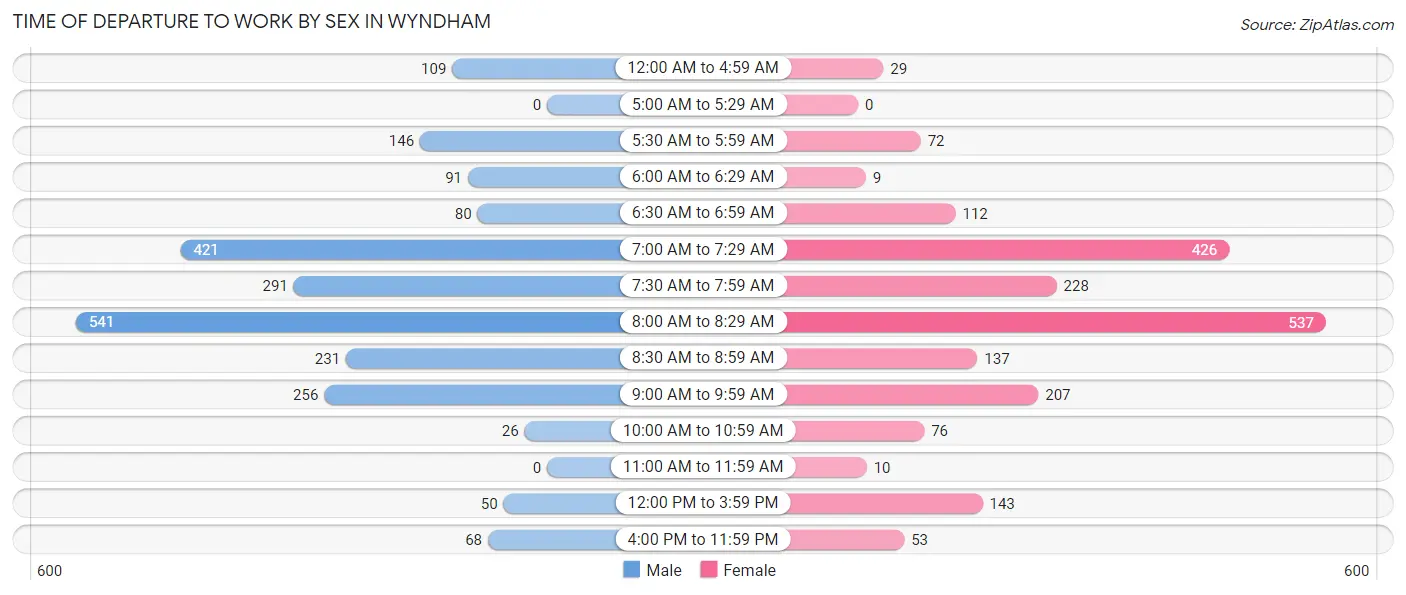
| Time of Departure | Male | Female |
| 12:00 AM to 4:59 AM | 109 (4.7%) | 29 (1.4%) |
| 5:00 AM to 5:29 AM | 0 (0.0%) | 0 (0.0%) |
| 5:30 AM to 5:59 AM | 146 (6.3%) | 72 (3.5%) |
| 6:00 AM to 6:29 AM | 91 (3.9%) | 9 (0.4%) |
| 6:30 AM to 6:59 AM | 80 (3.5%) | 112 (5.5%) |
| 7:00 AM to 7:29 AM | 421 (18.2%) | 426 (20.9%) |
| 7:30 AM to 7:59 AM | 291 (12.6%) | 228 (11.2%) |
| 8:00 AM to 8:29 AM | 541 (23.4%) | 537 (26.3%) |
| 8:30 AM to 8:59 AM | 231 (10.0%) | 137 (6.7%) |
| 9:00 AM to 9:59 AM | 256 (11.1%) | 207 (10.2%) |
| 10:00 AM to 10:59 AM | 26 (1.1%) | 76 (3.7%) |
| 11:00 AM to 11:59 AM | 0 (0.0%) | 10 (0.5%) |
| 12:00 PM to 3:59 PM | 50 (2.2%) | 143 (7.0%) |
| 4:00 PM to 11:59 PM | 68 (2.9%) | 53 (2.6%) |
| Total | 2,310 (100.0%) | 2,039 (100.0%) |
Housing Occupancy in Wyndham
Occupancy by Ownership in Wyndham
Of the total 3,887 dwellings in Wyndham, owner-occupied units account for 3,523 (90.6%), while renter-occupied units make up 364 (9.4%).
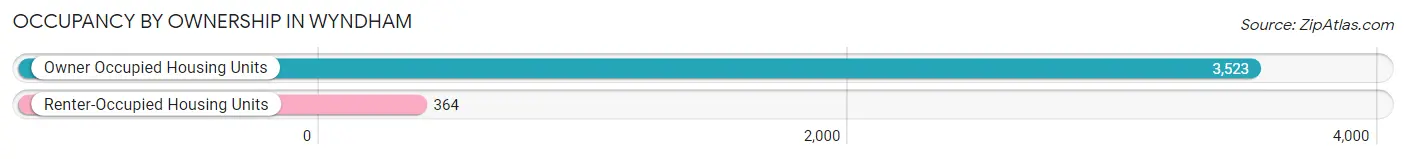
| Occupancy | # Housing Units | % Housing Units |
| Owner Occupied Housing Units | 3,523 | 90.6% |
| Renter-Occupied Housing Units | 364 | 9.4% |
| Total Occupied Housing Units | 3,887 | 100.0% |
Occupancy by Household Size in Wyndham
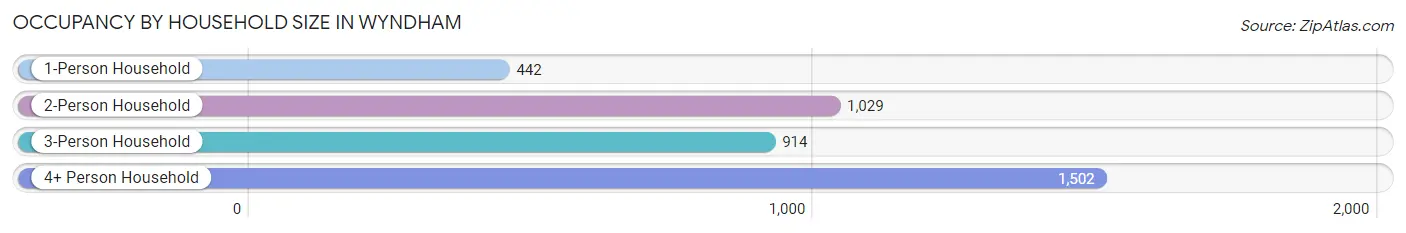
| Household Size | # Housing Units | % Housing Units |
| 1-Person Household | 442 | 11.4% |
| 2-Person Household | 1,029 | 26.5% |
| 3-Person Household | 914 | 23.5% |
| 4+ Person Household | 1,502 | 38.6% |
| Total Housing Units | 3,887 | 100.0% |
Occupancy by Ownership by Household Size in Wyndham
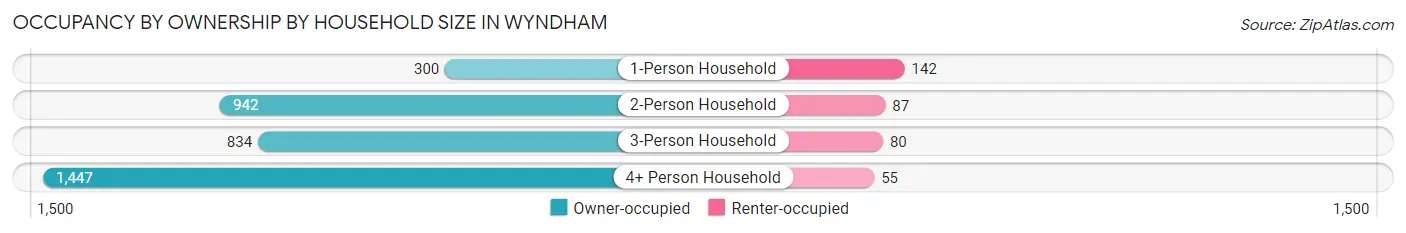
| Household Size | Owner-occupied | Renter-occupied |
| 1-Person Household | 300 (67.9%) | 142 (32.1%) |
| 2-Person Household | 942 (91.5%) | 87 (8.5%) |
| 3-Person Household | 834 (91.2%) | 80 (8.7%) |
| 4+ Person Household | 1,447 (96.3%) | 55 (3.7%) |
| Total Housing Units | 3,523 (90.6%) | 364 (9.4%) |
Occupancy by Educational Attainment in Wyndham
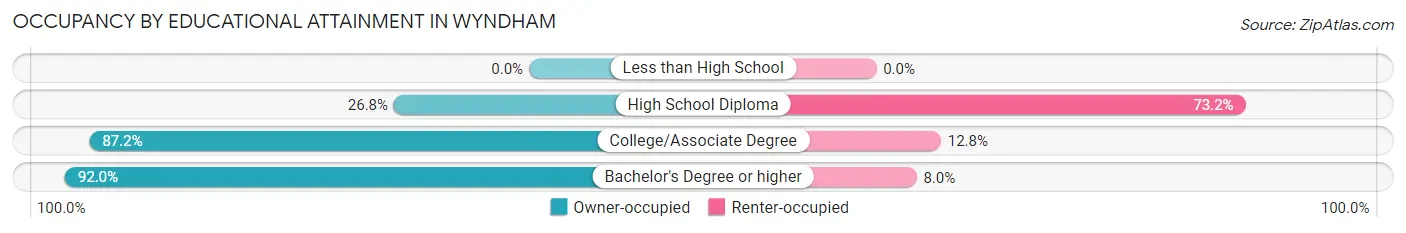
| Household Size | Owner-occupied | Renter-occupied |
| Less than High School | 0 (0.0%) | 0 (0.0%) |
| High School Diploma | 15 (26.8%) | 41 (73.2%) |
| College/Associate Degree | 306 (87.2%) | 45 (12.8%) |
| Bachelor's Degree or higher | 3,202 (92.0%) | 278 (8.0%) |
Occupancy by Age of Householder in Wyndham
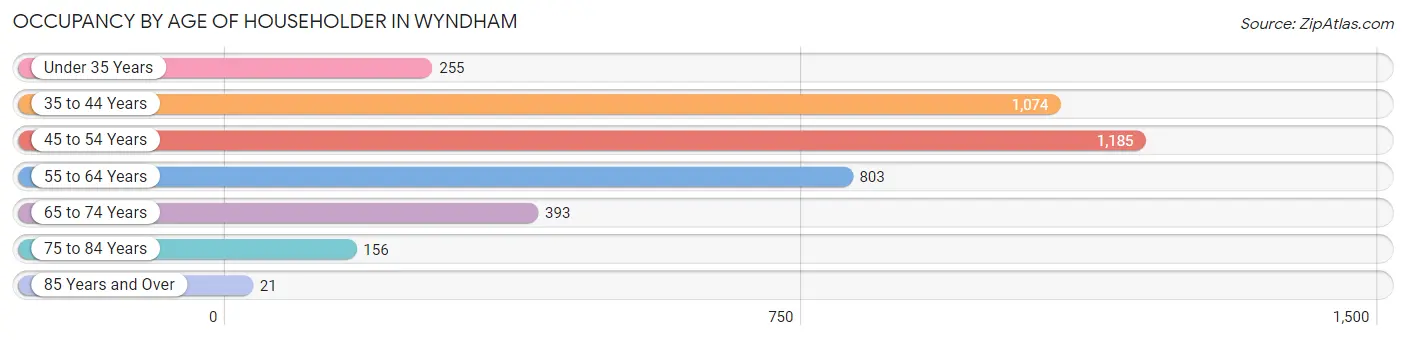
| Age Bracket | # Households | % Households |
| Under 35 Years | 255 | 6.6% |
| 35 to 44 Years | 1,074 | 27.6% |
| 45 to 54 Years | 1,185 | 30.5% |
| 55 to 64 Years | 803 | 20.7% |
| 65 to 74 Years | 393 | 10.1% |
| 75 to 84 Years | 156 | 4.0% |
| 85 Years and Over | 21 | 0.5% |
| Total | 3,887 | 100.0% |
Housing Finances in Wyndham
Median Income by Occupancy in Wyndham
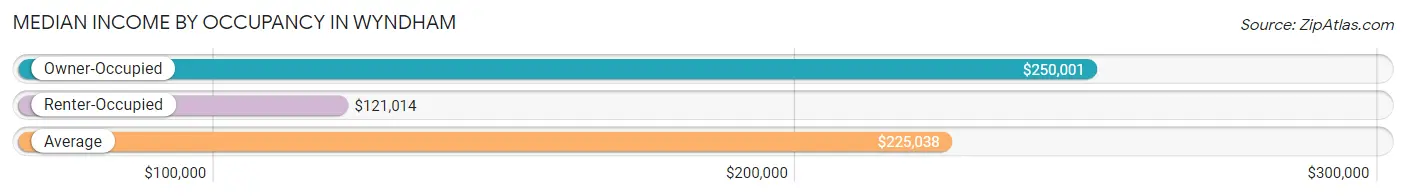
| Occupancy Type | # Households | Median Income |
| Owner-Occupied | 3,523 (90.6%) | $250,001 |
| Renter-Occupied | 364 (9.4%) | $121,014 |
| Average | 3,887 (100.0%) | $225,038 |
Occupancy by Householder Income Bracket in Wyndham
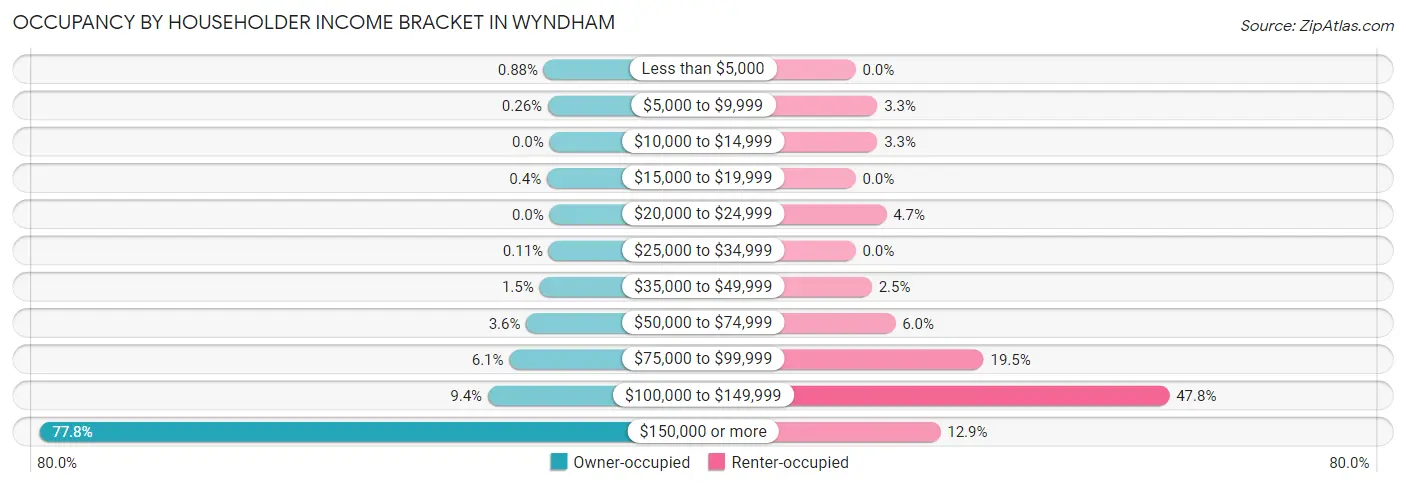
| Income Bracket | Owner-occupied | Renter-occupied |
| Less than $5,000 | 31 (0.9%) | 0 (0.0%) |
| $5,000 to $9,999 | 9 (0.3%) | 12 (3.3%) |
| $10,000 to $14,999 | 0 (0.0%) | 12 (3.3%) |
| $15,000 to $19,999 | 14 (0.4%) | 0 (0.0%) |
| $20,000 to $24,999 | 0 (0.0%) | 17 (4.7%) |
| $25,000 to $34,999 | 4 (0.1%) | 0 (0.0%) |
| $35,000 to $49,999 | 54 (1.5%) | 9 (2.5%) |
| $50,000 to $74,999 | 125 (3.5%) | 22 (6.0%) |
| $75,000 to $99,999 | 216 (6.1%) | 71 (19.5%) |
| $100,000 to $149,999 | 331 (9.4%) | 174 (47.8%) |
| $150,000 or more | 2,739 (77.7%) | 47 (12.9%) |
| Total | 3,523 (100.0%) | 364 (100.0%) |
Monthly Housing Cost Tiers in Wyndham
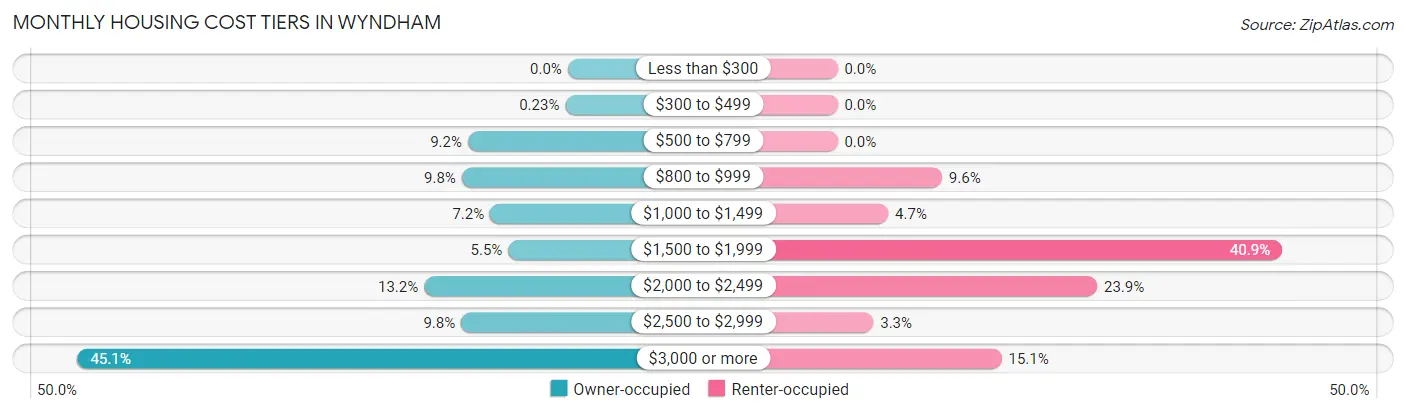
| Monthly Cost | Owner-occupied | Renter-occupied |
| Less than $300 | 0 (0.0%) | 0 (0.0%) |
| $300 to $499 | 8 (0.2%) | 0 (0.0%) |
| $500 to $799 | 324 (9.2%) | 0 (0.0%) |
| $800 to $999 | 344 (9.8%) | 35 (9.6%) |
| $1,000 to $1,499 | 252 (7.1%) | 17 (4.7%) |
| $1,500 to $1,999 | 193 (5.5%) | 149 (40.9%) |
| $2,000 to $2,499 | 466 (13.2%) | 87 (23.9%) |
| $2,500 to $2,999 | 346 (9.8%) | 12 (3.3%) |
| $3,000 or more | 1,590 (45.1%) | 55 (15.1%) |
| Total | 3,523 (100.0%) | 364 (100.0%) |
Physical Housing Characteristics in Wyndham
Housing Structures in Wyndham
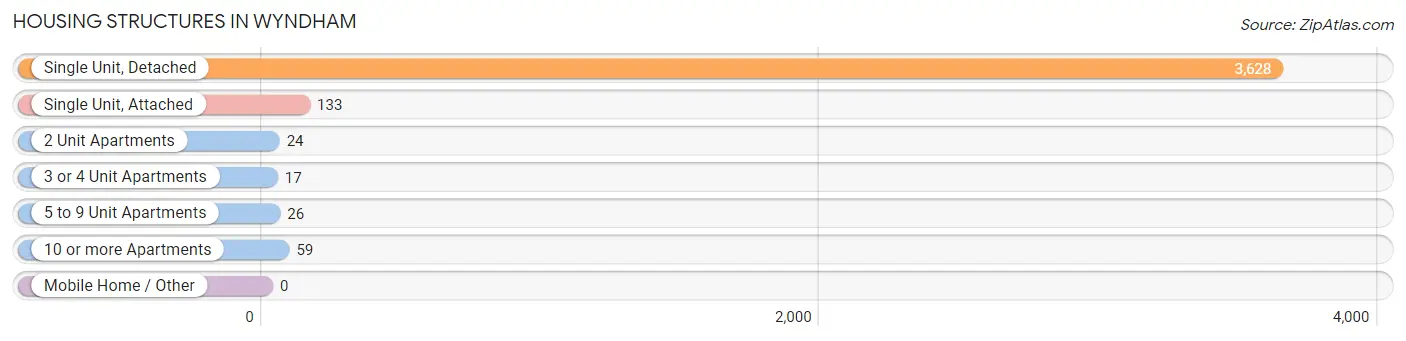
| Structure Type | # Housing Units | % Housing Units |
| Single Unit, Detached | 3,628 | 93.3% |
| Single Unit, Attached | 133 | 3.4% |
| 2 Unit Apartments | 24 | 0.6% |
| 3 or 4 Unit Apartments | 17 | 0.4% |
| 5 to 9 Unit Apartments | 26 | 0.7% |
| 10 or more Apartments | 59 | 1.5% |
| Mobile Home / Other | 0 | 0.0% |
| Total | 3,887 | 100.0% |
Housing Structures by Occupancy in Wyndham
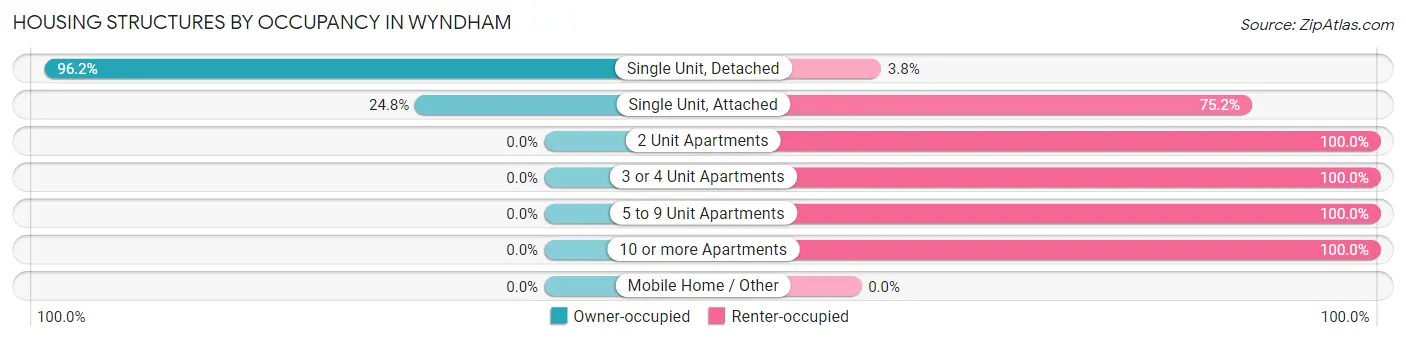
| Structure Type | Owner-occupied | Renter-occupied |
| Single Unit, Detached | 3,490 (96.2%) | 138 (3.8%) |
| Single Unit, Attached | 33 (24.8%) | 100 (75.2%) |
| 2 Unit Apartments | 0 (0.0%) | 24 (100.0%) |
| 3 or 4 Unit Apartments | 0 (0.0%) | 17 (100.0%) |
| 5 to 9 Unit Apartments | 0 (0.0%) | 26 (100.0%) |
| 10 or more Apartments | 0 (0.0%) | 59 (100.0%) |
| Mobile Home / Other | 0 (0.0%) | 0 (0.0%) |
| Total | 3,523 (90.6%) | 364 (9.4%) |
Housing Structures by Number of Rooms in Wyndham
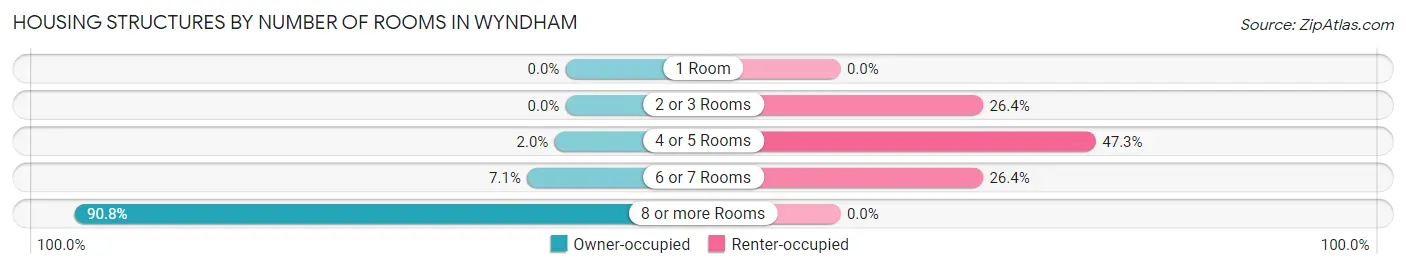
| Number of Rooms | Owner-occupied | Renter-occupied |
| 1 Room | 0 (0.0%) | 0 (0.0%) |
| 2 or 3 Rooms | 0 (0.0%) | 96 (26.4%) |
| 4 or 5 Rooms | 72 (2.0%) | 172 (47.2%) |
| 6 or 7 Rooms | 251 (7.1%) | 96 (26.4%) |
| 8 or more Rooms | 3,200 (90.8%) | 0 (0.0%) |
| Total | 3,523 (100.0%) | 364 (100.0%) |
Housing Structure by Heating Type in Wyndham
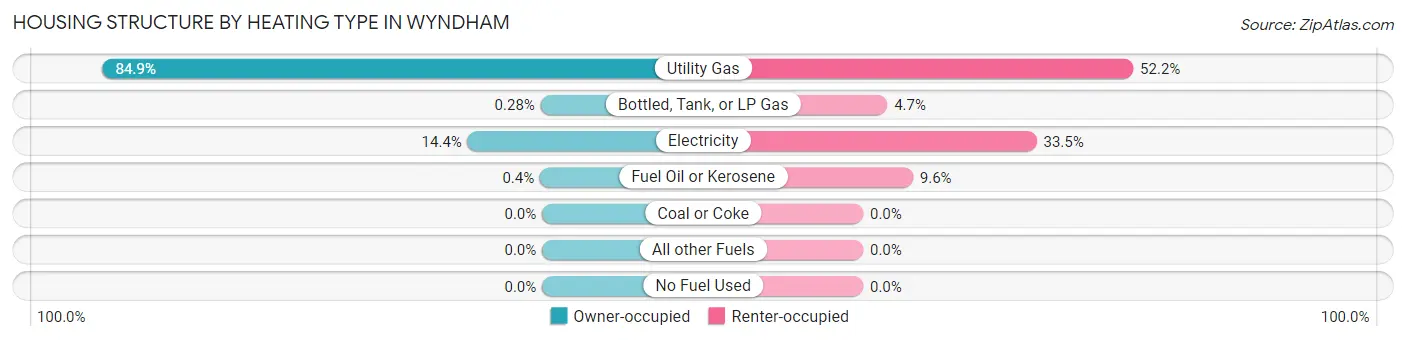
| Heating Type | Owner-occupied | Renter-occupied |
| Utility Gas | 2,992 (84.9%) | 190 (52.2%) |
| Bottled, Tank, or LP Gas | 10 (0.3%) | 17 (4.7%) |
| Electricity | 507 (14.4%) | 122 (33.5%) |
| Fuel Oil or Kerosene | 14 (0.4%) | 35 (9.6%) |
| Coal or Coke | 0 (0.0%) | 0 (0.0%) |
| All other Fuels | 0 (0.0%) | 0 (0.0%) |
| No Fuel Used | 0 (0.0%) | 0 (0.0%) |
| Total | 3,523 (100.0%) | 364 (100.0%) |
Household Vehicle Usage in Wyndham
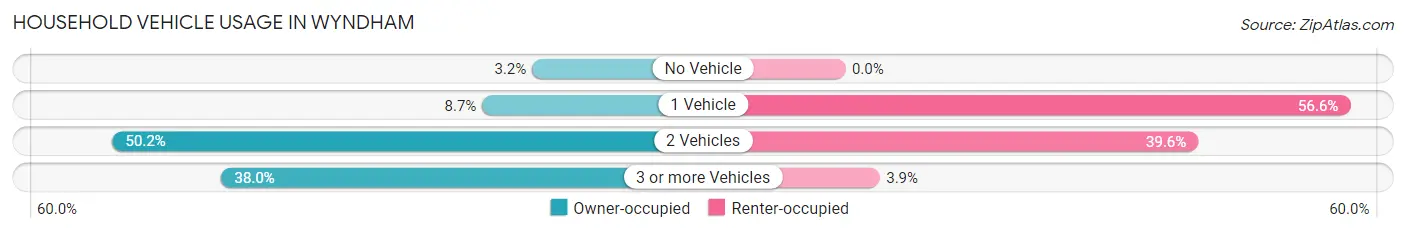
| Vehicles per Household | Owner-occupied | Renter-occupied |
| No Vehicle | 111 (3.2%) | 0 (0.0%) |
| 1 Vehicle | 308 (8.7%) | 206 (56.6%) |
| 2 Vehicles | 1,767 (50.2%) | 144 (39.6%) |
| 3 or more Vehicles | 1,337 (38.0%) | 14 (3.8%) |
| Total | 3,523 (100.0%) | 364 (100.0%) |
Real Estate & Mortgages in Wyndham
Real Estate and Mortgage Overview in Wyndham
| Characteristic | Without Mortgage | With Mortgage |
| Housing Units | 817 | 2,706 |
| Median Property Value | $651,100 | $673,000 |
| Median Household Income | $214,107 | $2,188 |
| Monthly Housing Costs | $902 | $1,590 |
| Real Estate Taxes | $4,773 | $7 |
Property Value by Mortgage Status in Wyndham
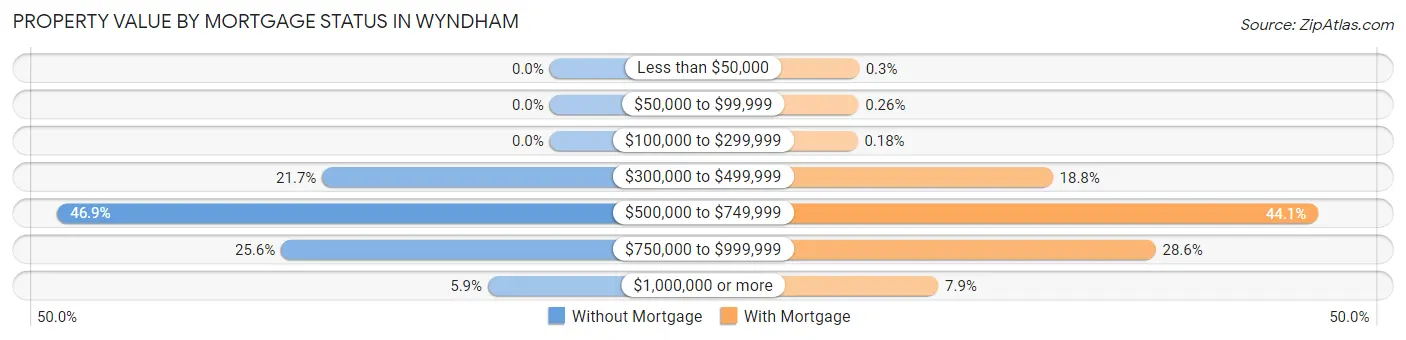
| Property Value | Without Mortgage | With Mortgage |
| Less than $50,000 | 0 (0.0%) | 8 (0.3%) |
| $50,000 to $99,999 | 0 (0.0%) | 7 (0.3%) |
| $100,000 to $299,999 | 0 (0.0%) | 5 (0.2%) |
| $300,000 to $499,999 | 177 (21.7%) | 508 (18.8%) |
| $500,000 to $749,999 | 383 (46.9%) | 1,192 (44.1%) |
| $750,000 to $999,999 | 209 (25.6%) | 773 (28.6%) |
| $1,000,000 or more | 48 (5.9%) | 213 (7.9%) |
| Total | 817 (100.0%) | 2,706 (100.0%) |
Household Income by Mortgage Status in Wyndham
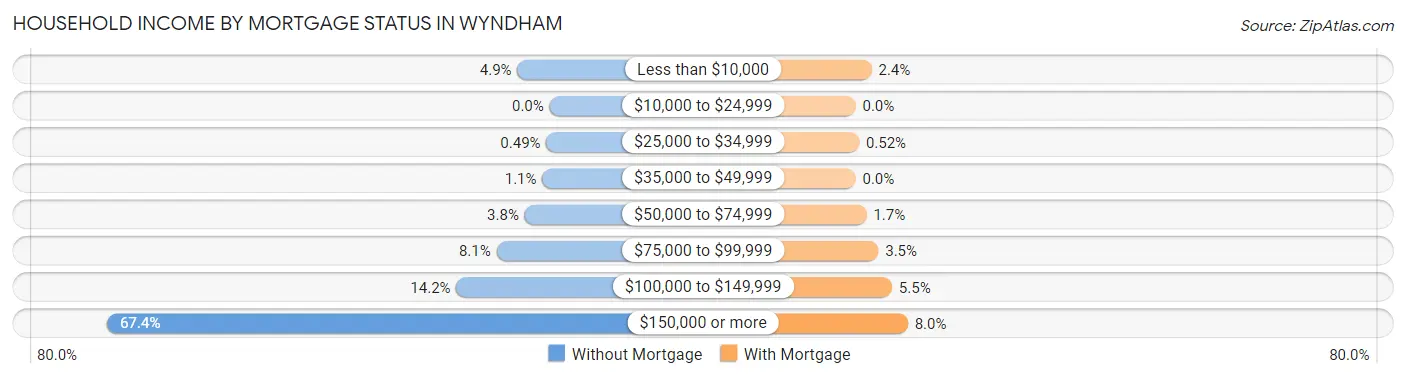
| Household Income | Without Mortgage | With Mortgage |
| Less than $10,000 | 40 (4.9%) | 66 (2.4%) |
| $10,000 to $24,999 | 0 (0.0%) | 0 (0.0%) |
| $25,000 to $34,999 | 4 (0.5%) | 14 (0.5%) |
| $35,000 to $49,999 | 9 (1.1%) | 0 (0.0%) |
| $50,000 to $74,999 | 31 (3.8%) | 45 (1.7%) |
| $75,000 to $99,999 | 66 (8.1%) | 94 (3.5%) |
| $100,000 to $149,999 | 116 (14.2%) | 150 (5.5%) |
| $150,000 or more | 551 (67.4%) | 215 (8.0%) |
| Total | 817 (100.0%) | 2,706 (100.0%) |
Property Value to Household Income Ratio in Wyndham
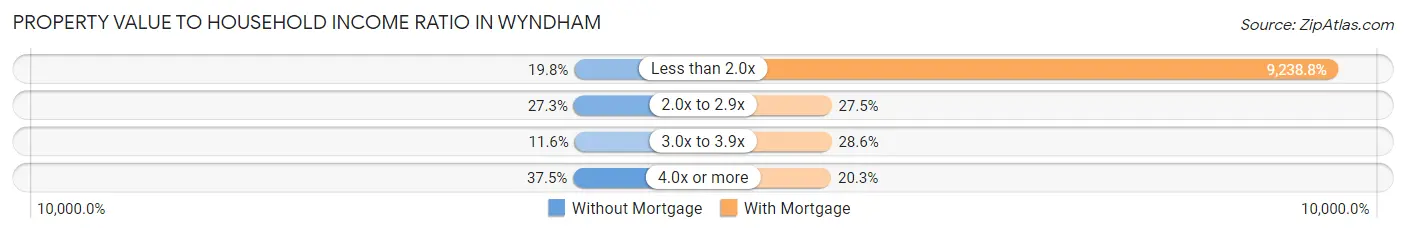
| Value-to-Income Ratio | Without Mortgage | With Mortgage |
| Less than 2.0x | 162 (19.8%) | 250,001 (9,238.8%) |
| 2.0x to 2.9x | 223 (27.3%) | 745 (27.5%) |
| 3.0x to 3.9x | 95 (11.6%) | 774 (28.6%) |
| 4.0x or more | 306 (37.4%) | 548 (20.3%) |
| Total | 817 (100.0%) | 2,706 (100.0%) |
Real Estate Taxes by Mortgage Status in Wyndham
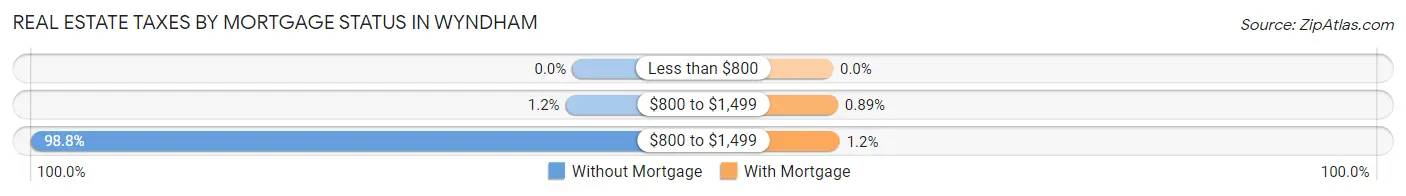
| Property Taxes | Without Mortgage | With Mortgage |
| Less than $800 | 0 (0.0%) | 0 (0.0%) |
| $800 to $1,499 | 10 (1.2%) | 24 (0.9%) |
| $800 to $1,499 | 807 (98.8%) | 33 (1.2%) |
| Total | 817 (100.0%) | 2,706 (100.0%) |
Health & Disability in Wyndham
Health Insurance Coverage by Age in Wyndham
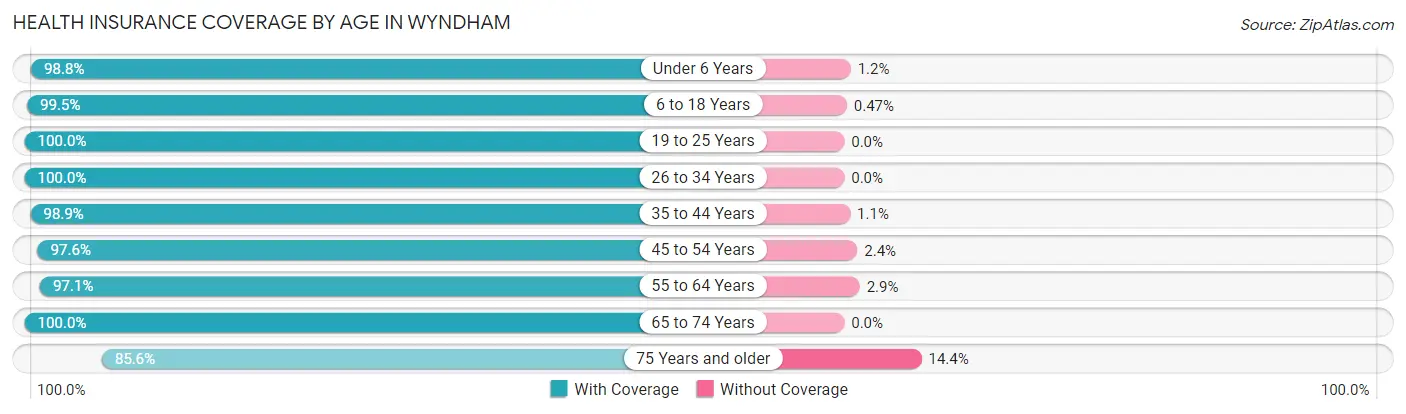
| Age Bracket | With Coverage | Without Coverage |
| Under 6 Years | 744 (98.8%) | 9 (1.2%) |
| 6 to 18 Years | 3,354 (99.5%) | 16 (0.5%) |
| 19 to 25 Years | 481 (100.0%) | 0 (0.0%) |
| 26 to 34 Years | 599 (100.0%) | 0 (0.0%) |
| 35 to 44 Years | 2,266 (98.9%) | 25 (1.1%) |
| 45 to 54 Years | 2,120 (97.6%) | 53 (2.4%) |
| 55 to 64 Years | 1,416 (97.1%) | 42 (2.9%) |
| 65 to 74 Years | 617 (100.0%) | 0 (0.0%) |
| 75 Years and older | 315 (85.6%) | 53 (14.4%) |
| Total | 11,912 (98.4%) | 198 (1.6%) |
Health Insurance Coverage by Citizenship Status in Wyndham
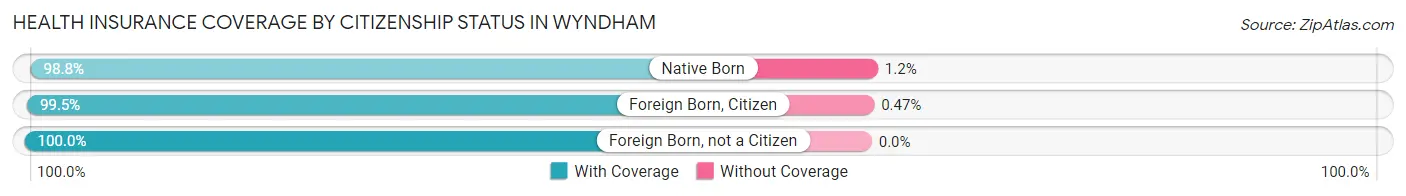
| Citizenship Status | With Coverage | Without Coverage |
| Native Born | 744 (98.8%) | 9 (1.2%) |
| Foreign Born, Citizen | 3,354 (99.5%) | 16 (0.5%) |
| Foreign Born, not a Citizen | 481 (100.0%) | 0 (0.0%) |
Health Insurance Coverage by Household Income in Wyndham
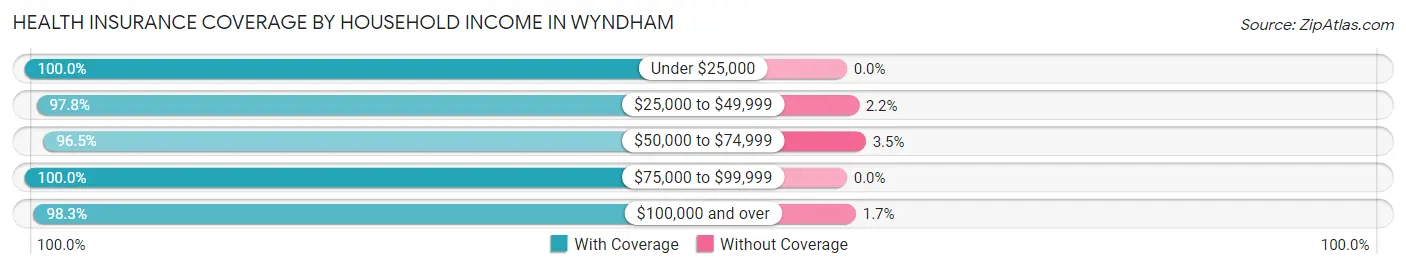
| Household Income | With Coverage | Without Coverage |
| Under $25,000 | 123 (100.0%) | 0 (0.0%) |
| $25,000 to $49,999 | 175 (97.8%) | 4 (2.2%) |
| $50,000 to $74,999 | 327 (96.5%) | 12 (3.5%) |
| $75,000 to $99,999 | 718 (100.0%) | 0 (0.0%) |
| $100,000 and over | 10,569 (98.3%) | 182 (1.7%) |
Public vs Private Health Insurance Coverage by Age in Wyndham
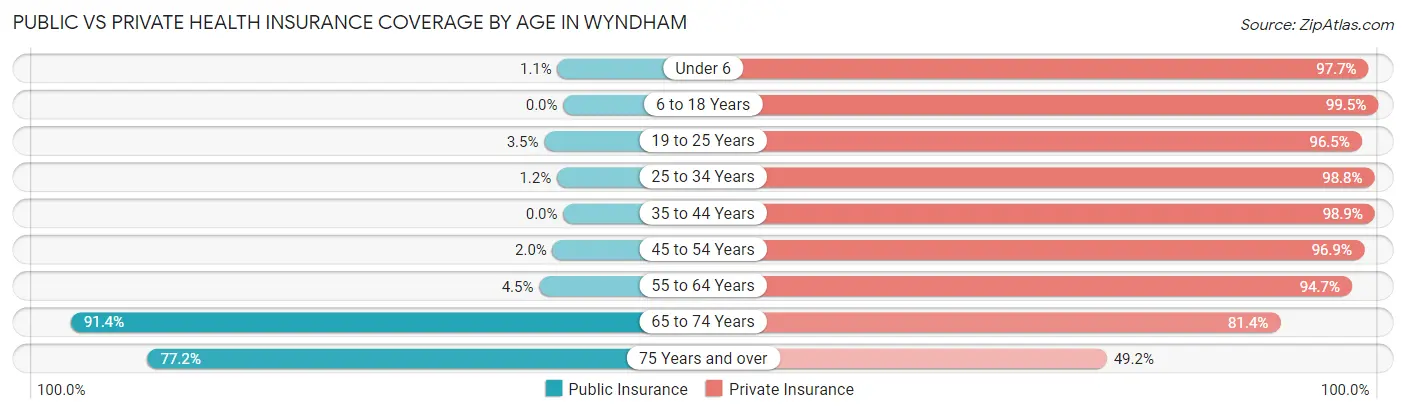
| Age Bracket | Public Insurance | Private Insurance |
| Under 6 | 8 (1.1%) | 736 (97.7%) |
| 6 to 18 Years | 0 (0.0%) | 3,354 (99.5%) |
| 19 to 25 Years | 17 (3.5%) | 464 (96.5%) |
| 25 to 34 Years | 7 (1.2%) | 592 (98.8%) |
| 35 to 44 Years | 0 (0.0%) | 2,266 (98.9%) |
| 45 to 54 Years | 43 (2.0%) | 2,105 (96.9%) |
| 55 to 64 Years | 65 (4.5%) | 1,380 (94.7%) |
| 65 to 74 Years | 564 (91.4%) | 502 (81.4%) |
| 75 Years and over | 284 (77.2%) | 181 (49.2%) |
| Total | 988 (8.2%) | 11,580 (95.6%) |
Disability Status by Sex by Age in Wyndham
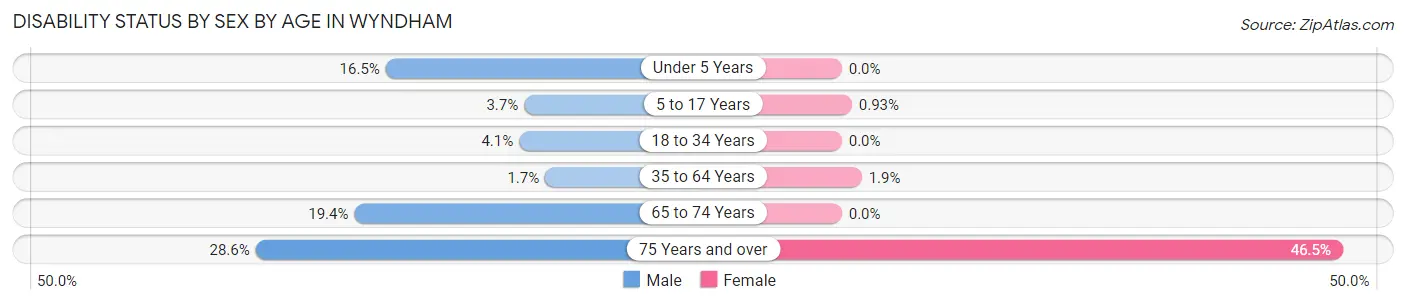
| Age Bracket | Male | Female |
| Under 5 Years | 62 (16.5%) | 0 (0.0%) |
| 5 to 17 Years | 54 (3.6%) | 16 (0.9%) |
| 18 to 34 Years | 28 (4.1%) | 0 (0.0%) |
| 35 to 64 Years | 50 (1.7%) | 55 (1.8%) |
| 65 to 74 Years | 65 (19.4%) | 0 (0.0%) |
| 75 Years and over | 40 (28.6%) | 106 (46.5%) |
Disability Class by Sex by Age in Wyndham
Disability Class: Hearing Difficulty
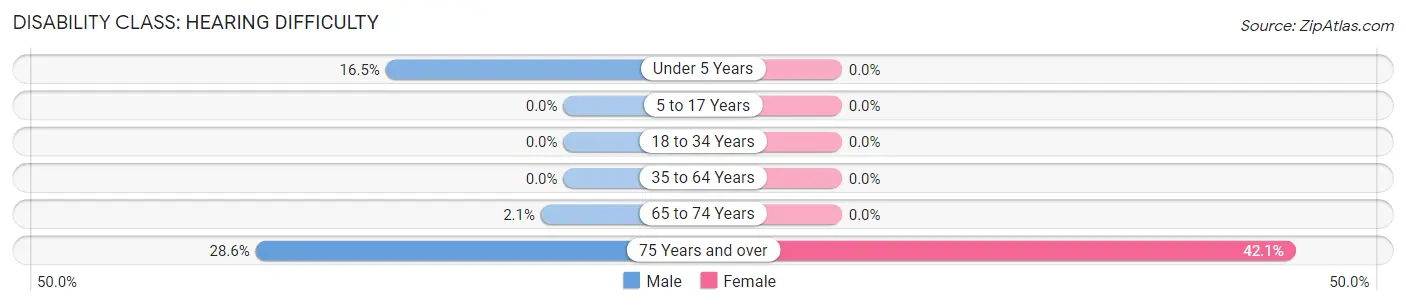
| Age Bracket | Male | Female |
| Under 5 Years | 62 (16.5%) | 0 (0.0%) |
| 5 to 17 Years | 0 (0.0%) | 0 (0.0%) |
| 18 to 34 Years | 0 (0.0%) | 0 (0.0%) |
| 35 to 64 Years | 0 (0.0%) | 0 (0.0%) |
| 65 to 74 Years | 7 (2.1%) | 0 (0.0%) |
| 75 Years and over | 40 (28.6%) | 96 (42.1%) |
Disability Class: Vision Difficulty
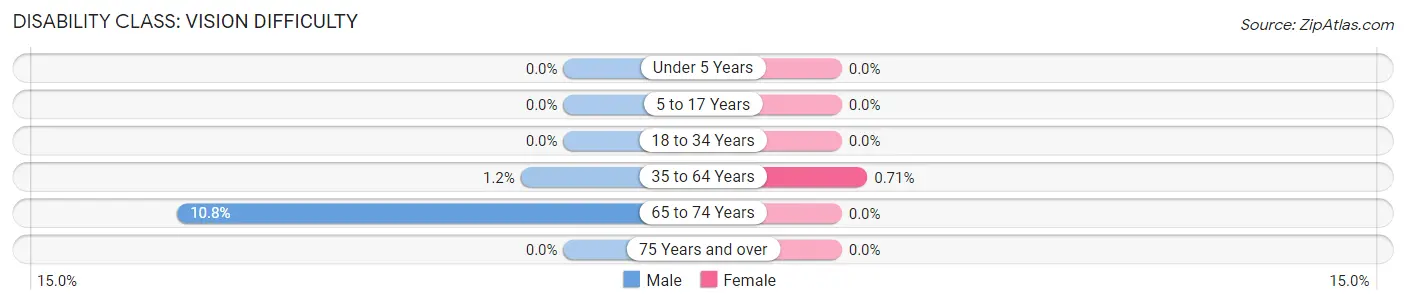
| Age Bracket | Male | Female |
| Under 5 Years | 0 (0.0%) | 0 (0.0%) |
| 5 to 17 Years | 0 (0.0%) | 0 (0.0%) |
| 18 to 34 Years | 0 (0.0%) | 0 (0.0%) |
| 35 to 64 Years | 35 (1.2%) | 21 (0.7%) |
| 65 to 74 Years | 36 (10.7%) | 0 (0.0%) |
| 75 Years and over | 0 (0.0%) | 0 (0.0%) |
Disability Class: Cognitive Difficulty
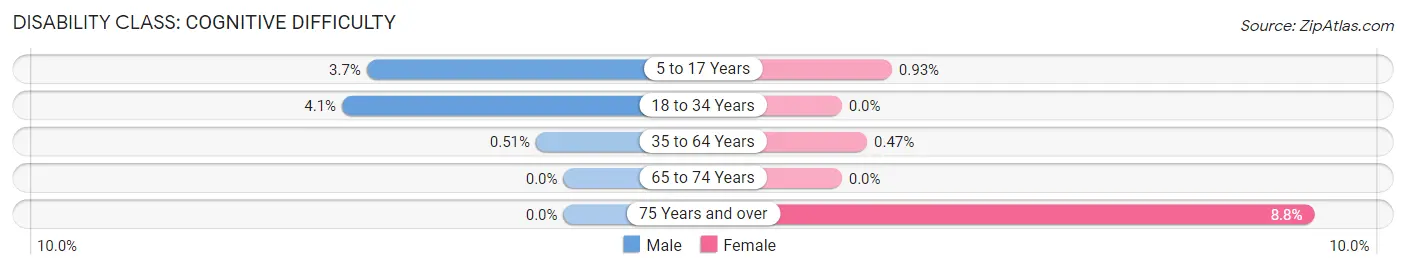
| Age Bracket | Male | Female |
| 5 to 17 Years | 54 (3.6%) | 16 (0.9%) |
| 18 to 34 Years | 28 (4.1%) | 0 (0.0%) |
| 35 to 64 Years | 15 (0.5%) | 14 (0.5%) |
| 65 to 74 Years | 0 (0.0%) | 0 (0.0%) |
| 75 Years and over | 0 (0.0%) | 20 (8.8%) |
Disability Class: Ambulatory Difficulty
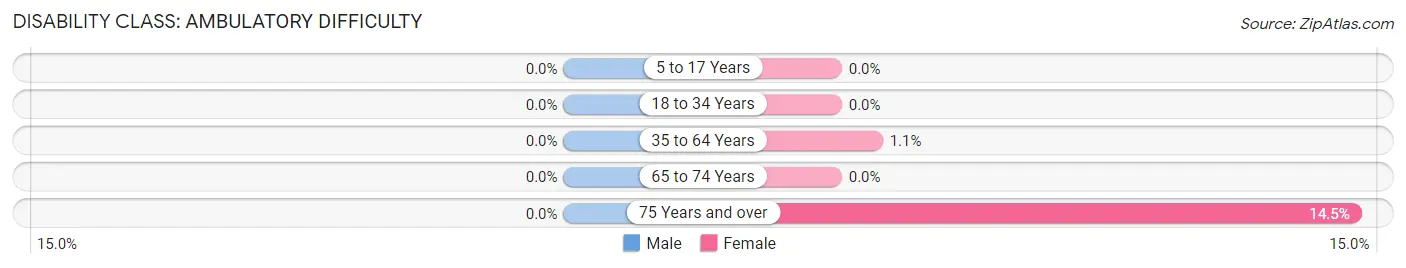
| Age Bracket | Male | Female |
| 5 to 17 Years | 0 (0.0%) | 0 (0.0%) |
| 18 to 34 Years | 0 (0.0%) | 0 (0.0%) |
| 35 to 64 Years | 0 (0.0%) | 34 (1.1%) |
| 65 to 74 Years | 0 (0.0%) | 0 (0.0%) |
| 75 Years and over | 0 (0.0%) | 33 (14.5%) |
Disability Class: Self-Care Difficulty
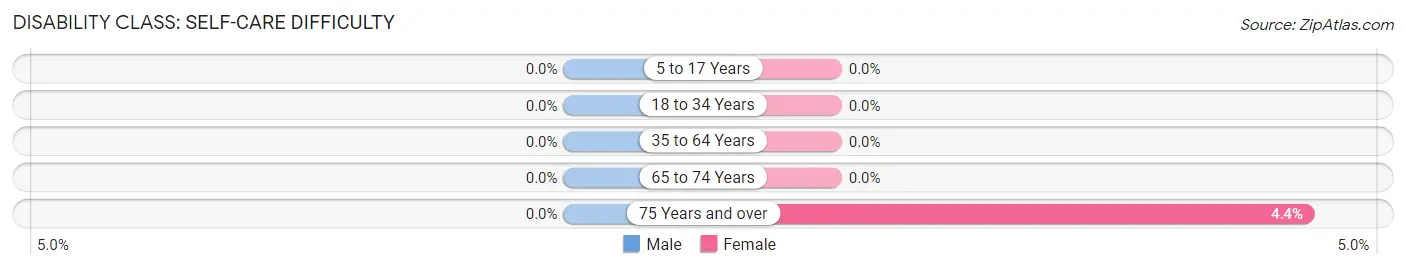
| Age Bracket | Male | Female |
| 5 to 17 Years | 0 (0.0%) | 0 (0.0%) |
| 18 to 34 Years | 0 (0.0%) | 0 (0.0%) |
| 35 to 64 Years | 0 (0.0%) | 0 (0.0%) |
| 65 to 74 Years | 0 (0.0%) | 0 (0.0%) |
| 75 Years and over | 0 (0.0%) | 10 (4.4%) |
Technology Access in Wyndham
Computing Device Access in Wyndham
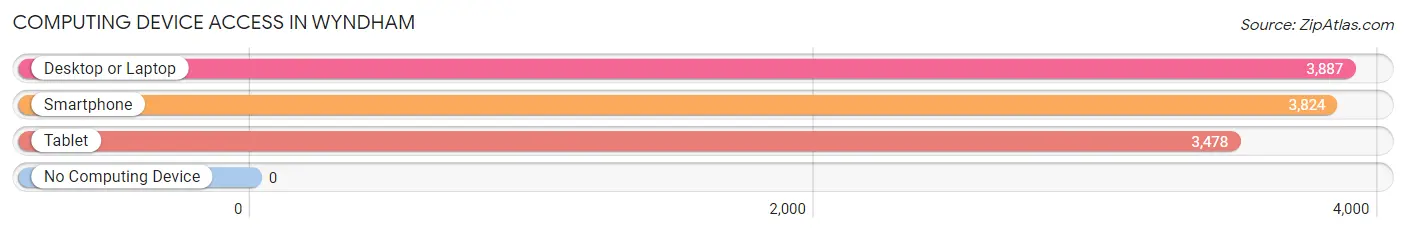
| Device Type | # Households | % Households |
| Desktop or Laptop | 3,887 | 100.0% |
| Smartphone | 3,824 | 98.4% |
| Tablet | 3,478 | 89.5% |
| No Computing Device | 0 | 0.0% |
| Total | 3,887 | 100.0% |
Internet Access in Wyndham
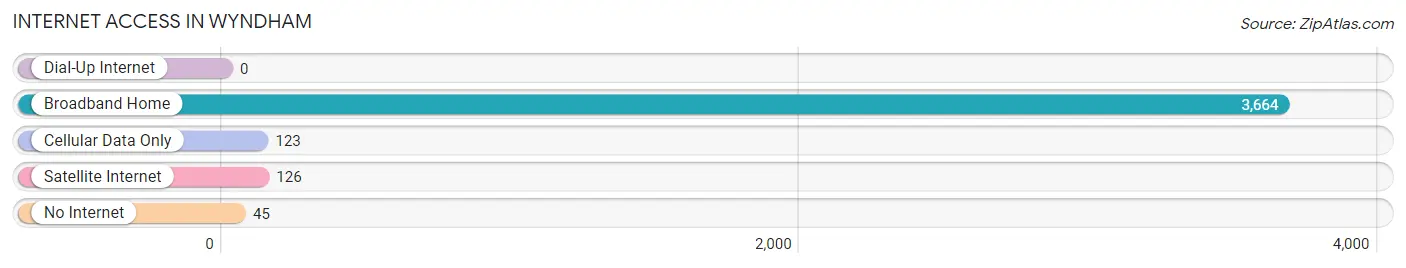
| Internet Type | # Households | % Households |
| Dial-Up Internet | 0 | 0.0% |
| Broadband Home | 3,664 | 94.3% |
| Cellular Data Only | 123 | 3.2% |
| Satellite Internet | 126 | 3.2% |
| No Internet | 45 | 1.2% |
| Total | 3,887 | 100.0% |
Wyndham Summary
Wyndham, Virginia is a small town located in the Shenandoah Valley of Virginia. It is situated in the foothills of the Blue Ridge Mountains and is part of the Winchester, Virginia metropolitan area. Wyndham is a rural community with a population of just over 1,000 people.
History
Wyndham was first settled in the late 1700s by a group of German immigrants. The town was originally known as “Wyndham’s Crossroads” and was named after the Wyndham family who owned the land. The town was officially incorporated in 1891.
During the Civil War, Wyndham was a strategic location for both the Union and Confederate armies. The town was the site of several skirmishes and battles, including the Battle of Cedar Creek in October 1864.
Geography
Wyndham is located in the Shenandoah Valley of Virginia, in the foothills of the Blue Ridge Mountains. The town is situated at an elevation of 1,000 feet and is surrounded by rolling hills and farmland. The town is located approximately 30 miles west of Washington, D.C. and is part of the Winchester, Virginia metropolitan area.
Economy
Wyndham’s economy is largely based on agriculture and tourism. The town is home to several farms, including a dairy farm, a beef farm, and a vegetable farm. The town also has several wineries and vineyards, as well as a number of bed and breakfasts.
Tourism is a major part of the town’s economy. Wyndham is home to several historic sites, including the Cedar Creek Battlefield, the Wyndham Museum, and the Wyndham Historic District. The town also hosts a number of festivals and events throughout the year, including the Wyndham Wine Festival and the Wyndham Music Festival.
Demographics
As of the 2010 census, Wyndham had a population of 1,072 people. The racial makeup of the town was 95.3% White, 1.2% African American, 0.3% Native American, 0.7% Asian, 0.1% Pacific Islander, and 2.4% from other races. The median household income was $45,000 and the median family income was $50,000. The per capita income was $20,000.
Wyndham is a small, rural town with a rich history and a vibrant economy. The town is home to a diverse population and offers a variety of attractions and activities for visitors and residents alike.
Common Questions
What is Per Capita Income in Wyndham?
Per Capita income in Wyndham is $89,049.
What is the Median Family Income in Wyndham?
Median Family Income in Wyndham is $250,001.
What is the Median Household income in Wyndham?
Median Household Income in Wyndham is $225,038.
What is Income or Wage Gap in Wyndham?
Income or Wage Gap in Wyndham is 62.0%.
Women in Wyndham earn 38.0 cents for every dollar earned by a man.
What is Inequality or Gini Index in Wyndham?
Inequality or Gini Index in Wyndham is 0.37.
What is the Total Population of Wyndham?
Total Population of Wyndham is 12,110.
What is the Total Male Population of Wyndham?
Total Male Population of Wyndham is 5,961.
What is the Total Female Population of Wyndham?
Total Female Population of Wyndham is 6,149.
What is the Ratio of Males per 100 Females in Wyndham?
There are 96.94 Males per 100 Females in Wyndham.
What is the Ratio of Females per 100 Males in Wyndham?
There are 103.15 Females per 100 Males in Wyndham.
What is the Median Population Age in Wyndham?
Median Population Age in Wyndham is 38.9 Years.
What is the Average Family Size in Wyndham
Average Family Size in Wyndham is 3.4 People.
What is the Average Household Size in Wyndham
Average Household Size in Wyndham is 3.1 People.
How Large is the Labor Force in Wyndham?
There are 6,556 People in the Labor Forcein in Wyndham.
What is the Percentage of People in the Labor Force in Wyndham?
74.4% of People are in the Labor Force in Wyndham.
What is the Unemployment Rate in Wyndham?
Unemployment Rate in Wyndham is 3.1%.