Middleburg, VA Map & Demographics
Middleburg Map
Middleburg Overview
$66,723
PER CAPITA INCOME
$136,250
AVG FAMILY INCOME
$114,500
AVG HOUSEHOLD INCOME
37.5%
WAGE / INCOME GAP [ % ]
62.5¢/ $1
WAGE / INCOME GAP [ $ ]
0.45
INEQUALITY / GINI INDEX
643
TOTAL POPULATION
271
MALE POPULATION
372
FEMALE POPULATION
72.85
MALES / 100 FEMALES
137.27
FEMALES / 100 MALES
54.5
MEDIAN AGE
2.5
AVG FAMILY SIZE
2.0
AVG HOUSEHOLD SIZE
331
LABOR FORCE [ PEOPLE ]
59.9%
PERCENT IN LABOR FORCE
6.9%
UNEMPLOYMENT RATE
Middleburg Zip Codes
Middleburg Area Codes
Income in Middleburg
Income Overview in Middleburg
Per Capita Income in Middleburg is $66,723, while median incomes of families and households are $136,250 and $114,500 respectively.
| Characteristic | Number | Measure |
| Per Capita Income | 643 | $66,723 |
| Median Family Income | 198 | $136,250 |
| Mean Family Income | 198 | $172,088 |
| Median Household Income | 320 | $114,500 |
| Mean Household Income | 320 | $134,879 |
| Income Deficit | 198 | $0 |
| Wage / Income Gap (%) | 643 | 37.50% |
| Wage / Income Gap ($) | 643 | 62.50¢ per $1 |
| Gini / Inequality Index | 643 | 0.45 |
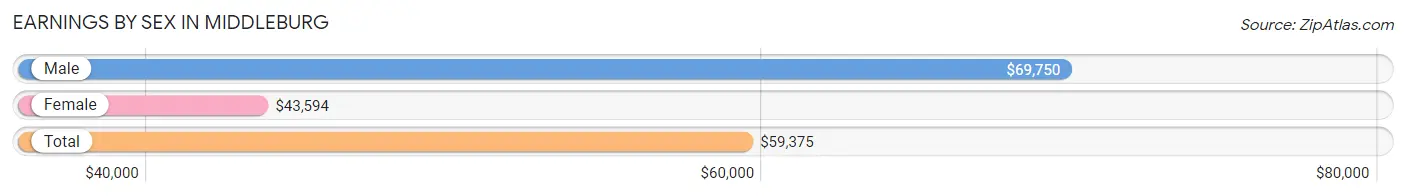
Earnings by Sex in Middleburg
Average Earnings in Middleburg are $59,375, $69,750 for men and $43,594 for women, a difference of 37.5%.
| Sex | Number | Average Earnings |
| Male | 160 (45.6%) | $69,750 |
| Female | 191 (54.4%) | $43,594 |
| Total | 351 (100.0%) | $59,375 |
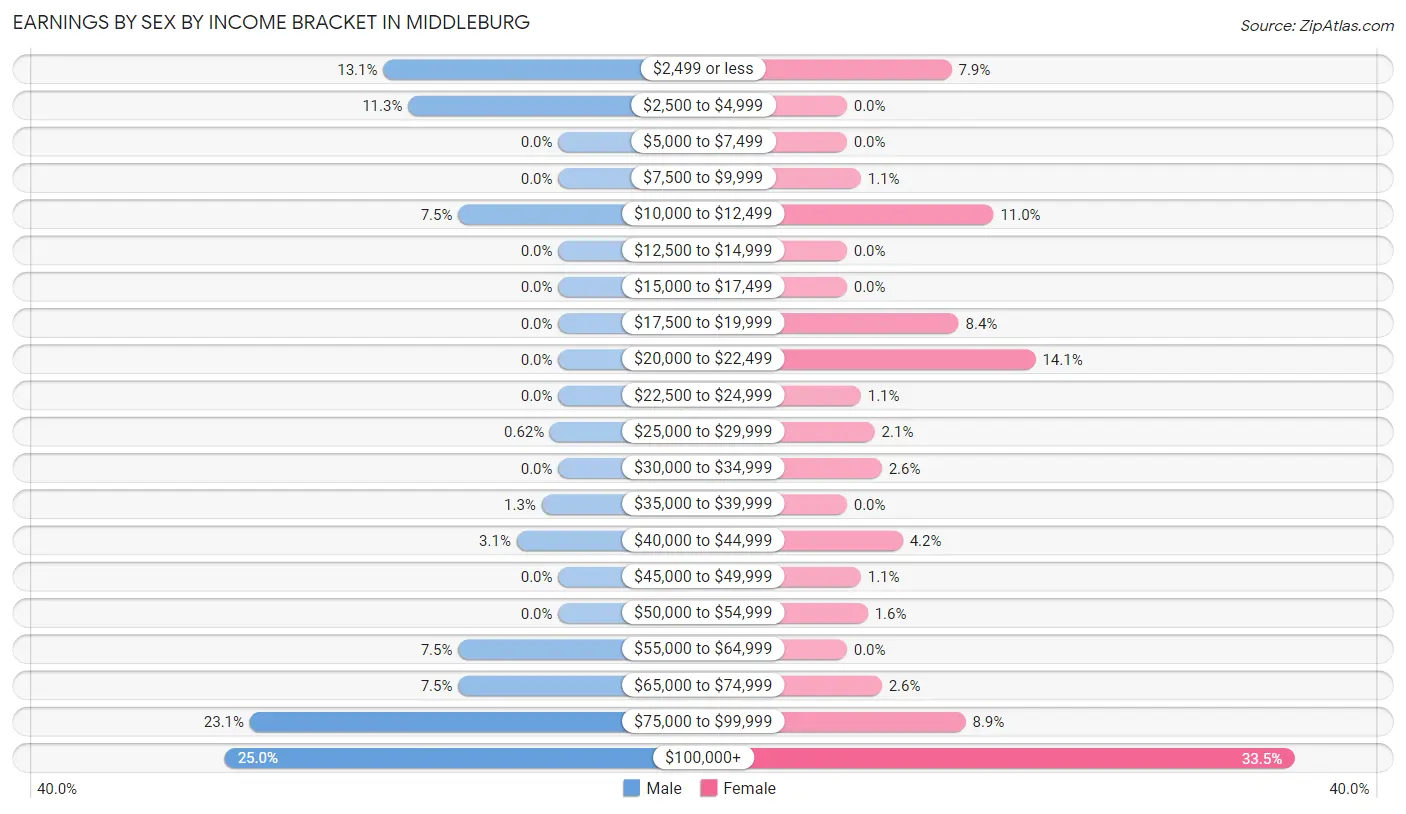
Earnings by Sex by Income Bracket in Middleburg
The most common earnings brackets in Middleburg are $100,000+ for men (40 | 25.0%) and $100,000+ for women (64 | 33.5%).
| Income | Male | Female |
| $2,499 or less | 21 (13.1%) | 15 (7.9%) |
| $2,500 to $4,999 | 18 (11.3%) | 0 (0.0%) |
| $5,000 to $7,499 | 0 (0.0%) | 0 (0.0%) |
| $7,500 to $9,999 | 0 (0.0%) | 2 (1.1%) |
| $10,000 to $12,499 | 12 (7.5%) | 21 (11.0%) |
| $12,500 to $14,999 | 0 (0.0%) | 0 (0.0%) |
| $15,000 to $17,499 | 0 (0.0%) | 0 (0.0%) |
| $17,500 to $19,999 | 0 (0.0%) | 16 (8.4%) |
| $20,000 to $22,499 | 0 (0.0%) | 27 (14.1%) |
| $22,500 to $24,999 | 0 (0.0%) | 2 (1.1%) |
| $25,000 to $29,999 | 1 (0.6%) | 4 (2.1%) |
| $30,000 to $34,999 | 0 (0.0%) | 5 (2.6%) |
| $35,000 to $39,999 | 2 (1.3%) | 0 (0.0%) |
| $40,000 to $44,999 | 5 (3.1%) | 8 (4.2%) |
| $45,000 to $49,999 | 0 (0.0%) | 2 (1.1%) |
| $50,000 to $54,999 | 0 (0.0%) | 3 (1.6%) |
| $55,000 to $64,999 | 12 (7.5%) | 0 (0.0%) |
| $65,000 to $74,999 | 12 (7.5%) | 5 (2.6%) |
| $75,000 to $99,999 | 37 (23.1%) | 17 (8.9%) |
| $100,000+ | 40 (25.0%) | 64 (33.5%) |
| Total | 160 (100.0%) | 191 (100.0%) |
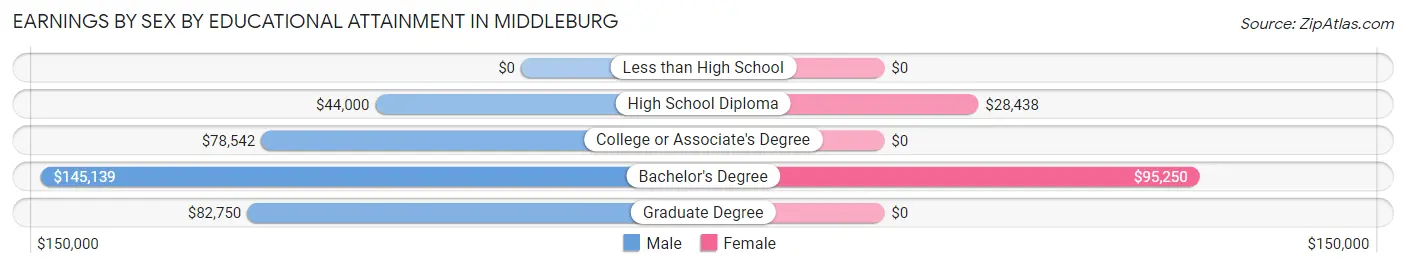
Earnings by Sex by Educational Attainment in Middleburg
Average earnings in Middleburg are $82,344 for men and $77,250 for women, a difference of 6.2%. Men with an educational attainment of bachelor's degree enjoy the highest average annual earnings of $145,139, while those with high school diploma education earn the least with $44,000. Women with an educational attainment of bachelor's degree earn the most with the average annual earnings of $95,250, while those with high school diploma education have the smallest earnings of $28,438.
| Educational Attainment | Male Income | Female Income |
| Less than High School | - | - |
| High School Diploma | $44,000 | $28,438 |
| College or Associate's Degree | $78,542 | $0 |
| Bachelor's Degree | $145,139 | $95,250 |
| Graduate Degree | $82,750 | $0 |
| Total | $82,344 | $77,250 |
Family Income in Middleburg
Family Income Brackets in Middleburg
According to the Middleburg family income data, there are 67 families falling into the $200,000+ income range, which is the most common income bracket and makes up 33.8% of all families.
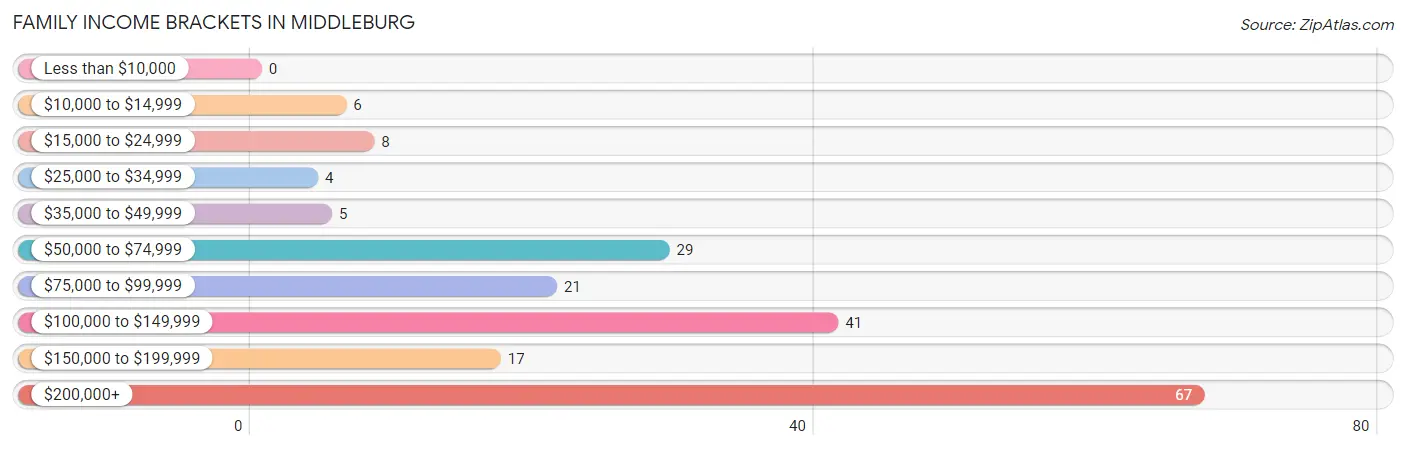
| Income Bracket | # Families | % Families |
| Less than $10,000 | 0 | 0.0% |
| $10,000 to $14,999 | 6 | 3.0% |
| $15,000 to $24,999 | 8 | 4.0% |
| $25,000 to $34,999 | 4 | 2.0% |
| $35,000 to $49,999 | 5 | 2.5% |
| $50,000 to $74,999 | 29 | 14.6% |
| $75,000 to $99,999 | 21 | 10.6% |
| $100,000 to $149,999 | 41 | 20.7% |
| $150,000 to $199,999 | 17 | 8.6% |
| $200,000+ | 67 | 33.8% |
Family Income by Famaliy Size in Middleburg
3-person families (30 | 15.1%) account for the highest median family income in Middleburg with $250,001 per family, while 3-person families (30 | 15.1%) have the highest median income of $83,334 per family member.
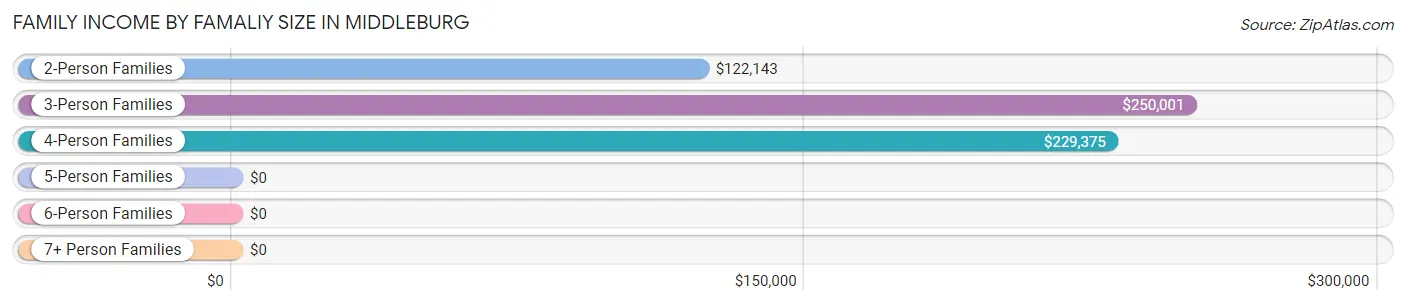
| Income Bracket | # Families | Median Income |
| 2-Person Families | 146 (73.7%) | $122,143 |
| 3-Person Families | 30 (15.1%) | $250,001 |
| 4-Person Families | 13 (6.6%) | $229,375 |
| 5-Person Families | 9 (4.5%) | $0 |
| 6-Person Families | 0 (0.0%) | $0 |
| 7+ Person Families | 0 (0.0%) | $0 |
| Total | 198 (100.0%) | $136,250 |
Family Income by Number of Earners in Middleburg
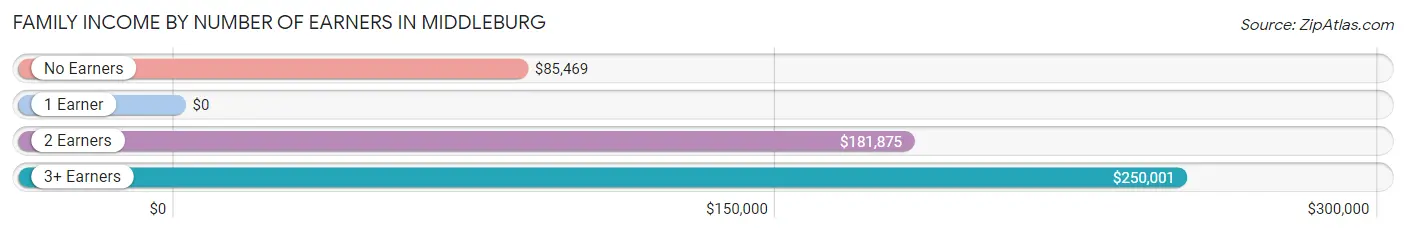
| Number of Earners | # Families | Median Income |
| No Earners | 55 (27.8%) | $85,469 |
| 1 Earner | 60 (30.3%) | $0 |
| 2 Earners | 62 (31.3%) | $181,875 |
| 3+ Earners | 21 (10.6%) | $250,001 |
| Total | 198 (100.0%) | $136,250 |
Household Income in Middleburg
Household Income Brackets in Middleburg
With 67 households falling in the category, the $200,000+ income range is the most frequent in Middleburg, accounting for 20.9% of all households. In contrast, only 8 households (2.5%) fall into the less than $10,000 income bracket, making it the least populous group.
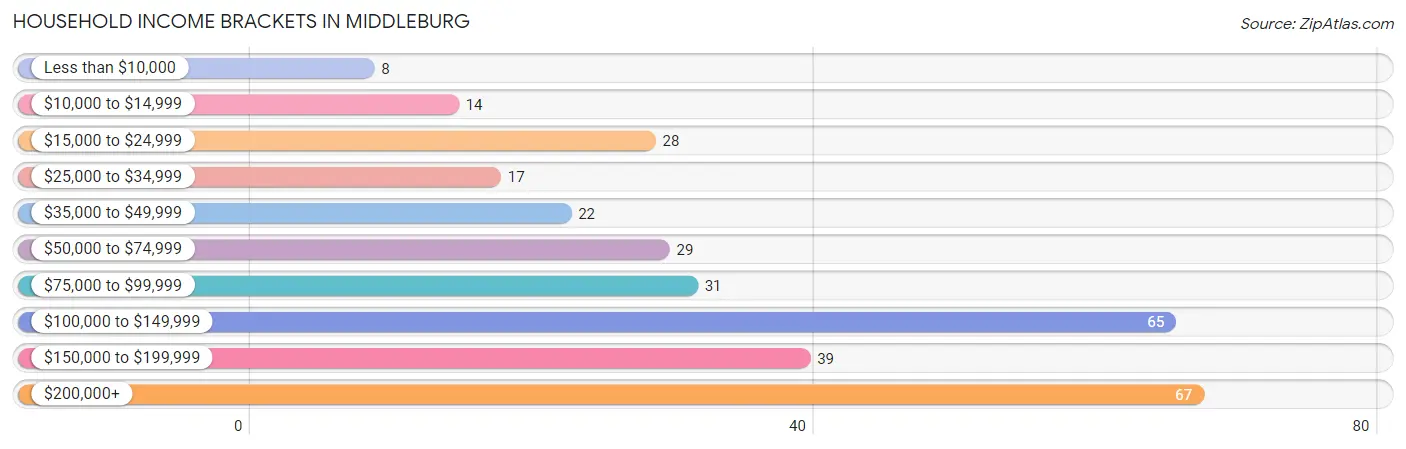
| Income Bracket | # Households | % Households |
| Less than $10,000 | 8 | 2.5% |
| $10,000 to $14,999 | 14 | 4.4% |
| $15,000 to $24,999 | 28 | 8.8% |
| $25,000 to $34,999 | 17 | 5.3% |
| $35,000 to $49,999 | 22 | 6.9% |
| $50,000 to $74,999 | 29 | 9.1% |
| $75,000 to $99,999 | 31 | 9.7% |
| $100,000 to $149,999 | 65 | 20.3% |
| $150,000 to $199,999 | 39 | 12.2% |
| $200,000+ | 67 | 20.9% |
Household Income by Householder Age in Middleburg
The median household income in Middleburg is $114,500, with the highest median household income of $178,750 found in the 45 to 64 years age bracket for the primary householder. A total of 106 households (33.1%) fall into this category. Meanwhile, the 15 to 24 years age bracket for the primary householder has the lowest median household income of $0, with 10 households (3.1%) in this group.
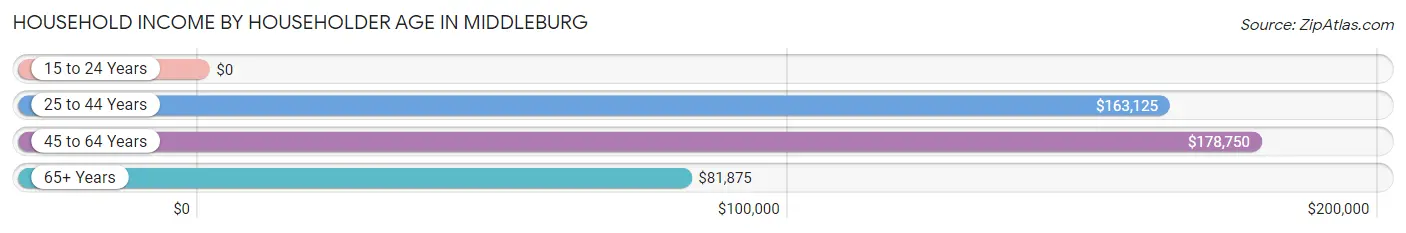
| Income Bracket | # Households | Median Income |
| 15 to 24 Years | 10 (3.1%) | $0 |
| 25 to 44 Years | 47 (14.7%) | $163,125 |
| 45 to 64 Years | 106 (33.1%) | $178,750 |
| 65+ Years | 157 (49.1%) | $81,875 |
| Total | 320 (100.0%) | $114,500 |
Poverty in Middleburg
Income Below Poverty by Sex and Age in Middleburg
With 9.6% poverty level for males and 6.7% for females among the residents of Middleburg, 18 to 24 year old males and 75 year old and over females are the most vulnerable to poverty, with 9 males (25.7%) and 14 females (18.4%) in their respective age groups living below the poverty level.
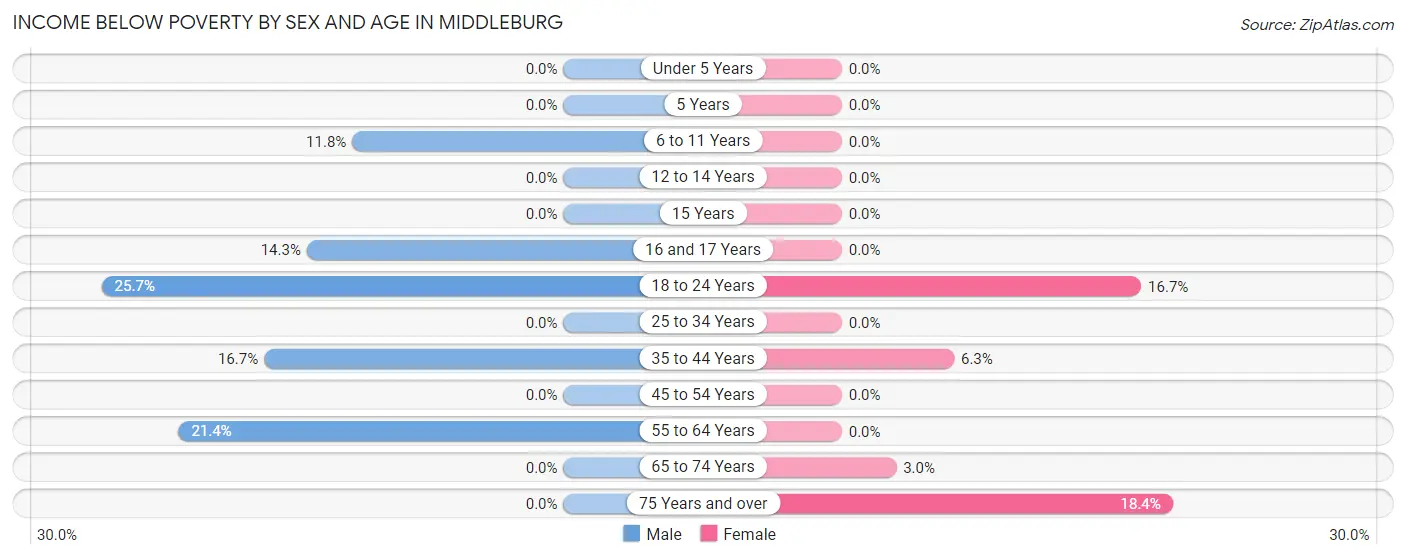
| Age Bracket | Male | Female |
| Under 5 Years | 0 (0.0%) | 0 (0.0%) |
| 5 Years | 0 (0.0%) | 0 (0.0%) |
| 6 to 11 Years | 4 (11.8%) | 0 (0.0%) |
| 12 to 14 Years | 0 (0.0%) | 0 (0.0%) |
| 15 Years | 0 (0.0%) | 0 (0.0%) |
| 16 and 17 Years | 1 (14.3%) | 0 (0.0%) |
| 18 to 24 Years | 9 (25.7%) | 7 (16.7%) |
| 25 to 34 Years | 0 (0.0%) | 0 (0.0%) |
| 35 to 44 Years | 3 (16.7%) | 2 (6.2%) |
| 45 to 54 Years | 0 (0.0%) | 0 (0.0%) |
| 55 to 64 Years | 9 (21.4%) | 0 (0.0%) |
| 65 to 74 Years | 0 (0.0%) | 2 (3.0%) |
| 75 Years and over | 0 (0.0%) | 14 (18.4%) |
| Total | 26 (9.6%) | 25 (6.7%) |
Income Above Poverty by Sex and Age in Middleburg
According to the poverty statistics in Middleburg, males aged under 5 years and females aged under 5 years are the age groups that are most secure financially, with 100.0% of males and 100.0% of females in these age groups living above the poverty line.
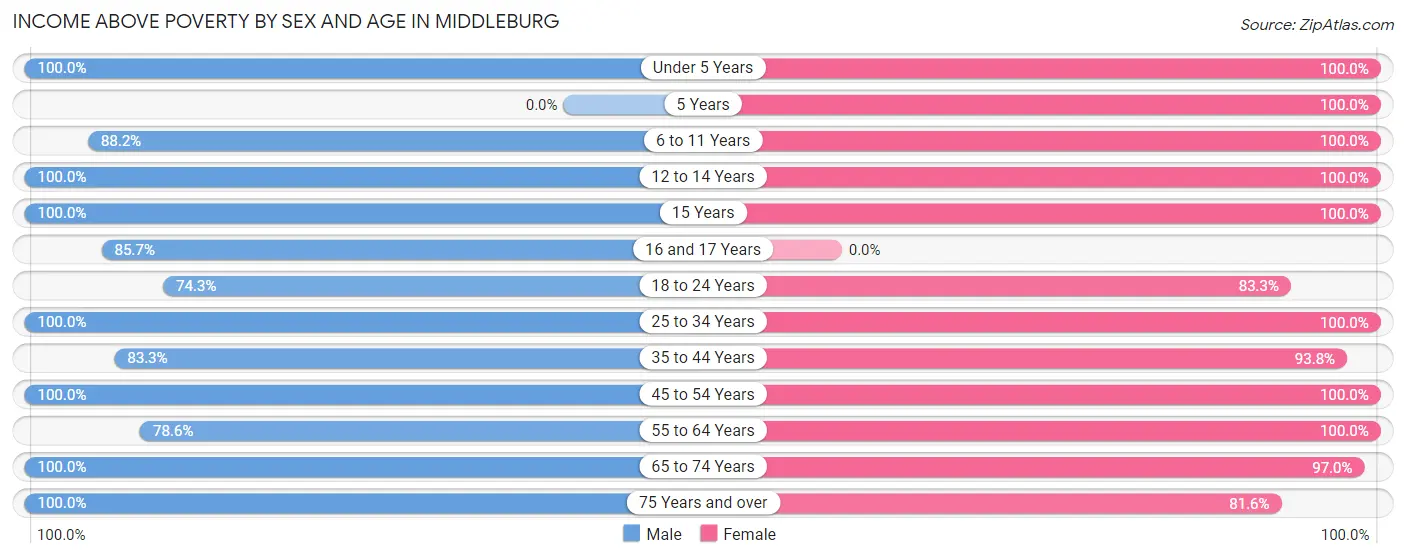
| Age Bracket | Male | Female |
| Under 5 Years | 16 (100.0%) | 1 (100.0%) |
| 5 Years | 0 (0.0%) | 2 (100.0%) |
| 6 to 11 Years | 30 (88.2%) | 20 (100.0%) |
| 12 to 14 Years | 3 (100.0%) | 6 (100.0%) |
| 15 Years | 1 (100.0%) | 7 (100.0%) |
| 16 and 17 Years | 6 (85.7%) | 0 (0.0%) |
| 18 to 24 Years | 26 (74.3%) | 35 (83.3%) |
| 25 to 34 Years | 13 (100.0%) | 14 (100.0%) |
| 35 to 44 Years | 15 (83.3%) | 30 (93.8%) |
| 45 to 54 Years | 28 (100.0%) | 50 (100.0%) |
| 55 to 64 Years | 33 (78.6%) | 56 (100.0%) |
| 65 to 74 Years | 31 (100.0%) | 64 (97.0%) |
| 75 Years and over | 43 (100.0%) | 62 (81.6%) |
| Total | 245 (90.4%) | 347 (93.3%) |
Income Below Poverty Among Married-Couple Families in Middleburg
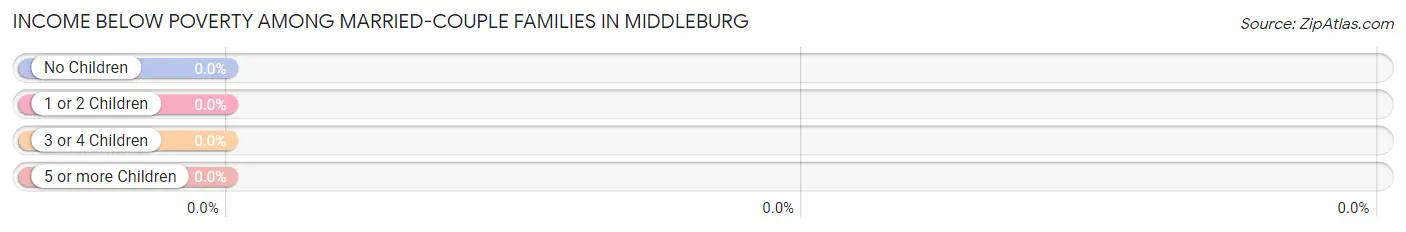
| Children | Above Poverty | Below Poverty |
| No Children | 112 (100.0%) | 0 (0.0%) |
| 1 or 2 Children | 16 (100.0%) | 0 (0.0%) |
| 3 or 4 Children | 0 (0.0%) | 0 (0.0%) |
| 5 or more Children | 0 (0.0%) | 0 (0.0%) |
| Total | 128 (100.0%) | 0 (0.0%) |
Income Below Poverty Among Single-Parent Households in Middleburg
According to the poverty data in Middleburg, 31.6% or 6 single-father households and 3.9% or 2 single-mother households are living below the poverty line. Among single-father households, those with no children have the highest poverty rate, with 6 households (100.0%) experiencing poverty. Likewise, among single-mother households, those with 1 or 2 children have the highest poverty rate, with 2 households (10.5%) falling below the poverty line.
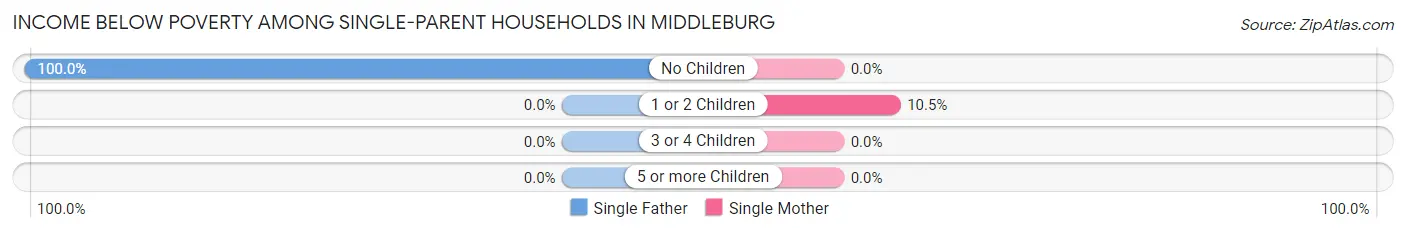
| Children | Single Father | Single Mother |
| No Children | 6 (100.0%) | 0 (0.0%) |
| 1 or 2 Children | 0 (0.0%) | 2 (10.5%) |
| 3 or 4 Children | 0 (0.0%) | 0 (0.0%) |
| 5 or more Children | 0 (0.0%) | 0 (0.0%) |
| Total | 6 (31.6%) | 2 (3.9%) |
Income Below Poverty Among Married-Couple vs Single-Parent Households in Middleburg
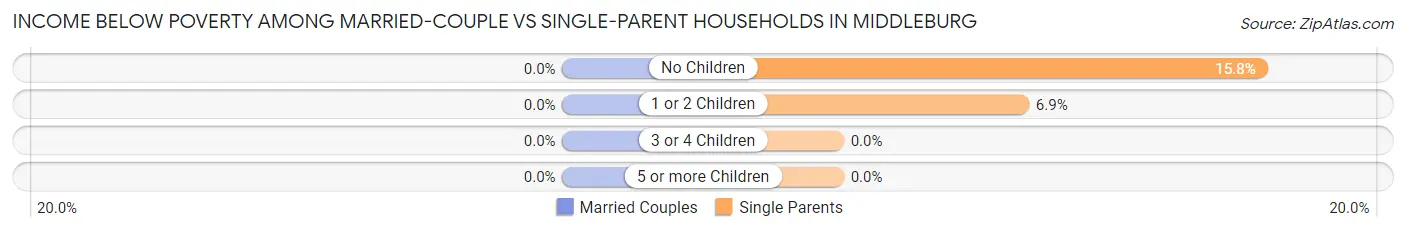
| Children | Married-Couple Families | Single-Parent Households |
| No Children | 0 (0.0%) | 6 (15.8%) |
| 1 or 2 Children | 0 (0.0%) | 2 (6.9%) |
| 3 or 4 Children | 0 (0.0%) | 0 (0.0%) |
| 5 or more Children | 0 (0.0%) | 0 (0.0%) |
| Total | 0 (0.0%) | 8 (11.4%) |
Race in Middleburg
The most populous races in Middleburg are White / Caucasian (465 | 72.3%), Black / African American (96 | 14.9%), and Two or more Races (78 | 12.1%).
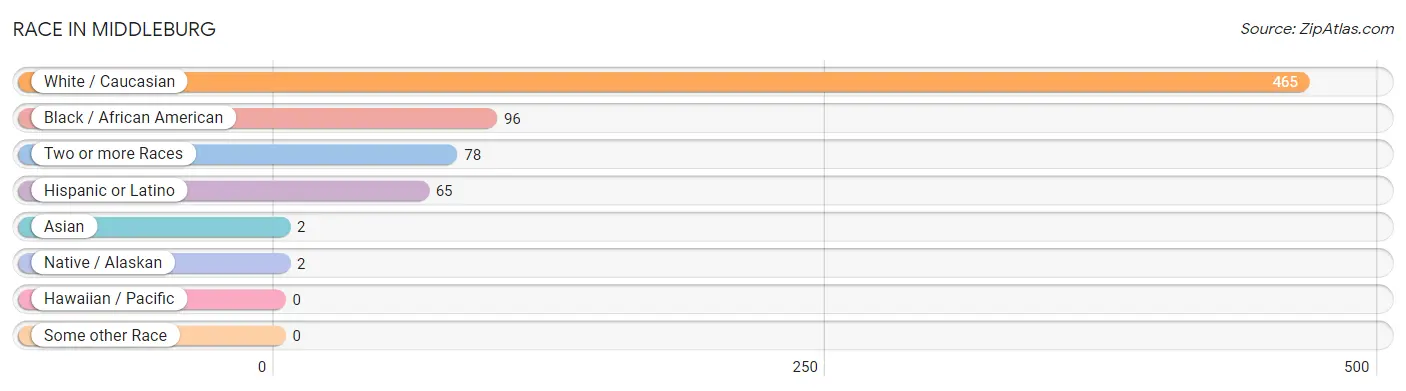
| Race | # Population | % Population |
| Asian | 2 | 0.3% |
| Black / African American | 96 | 14.9% |
| Hawaiian / Pacific | 0 | 0.0% |
| Hispanic or Latino | 65 | 10.1% |
| Native / Alaskan | 2 | 0.3% |
| White / Caucasian | 465 | 72.3% |
| Two or more Races | 78 | 12.1% |
| Some other Race | 0 | 0.0% |
| Total | 643 | 100.0% |
Ancestry in Middleburg
The most populous ancestries reported in Middleburg are English (94 | 14.6%), American (90 | 14.0%), Irish (89 | 13.8%), French (45 | 7.0%), and Italian (37 | 5.8%), together accounting for 55.2% of all Middleburg residents.
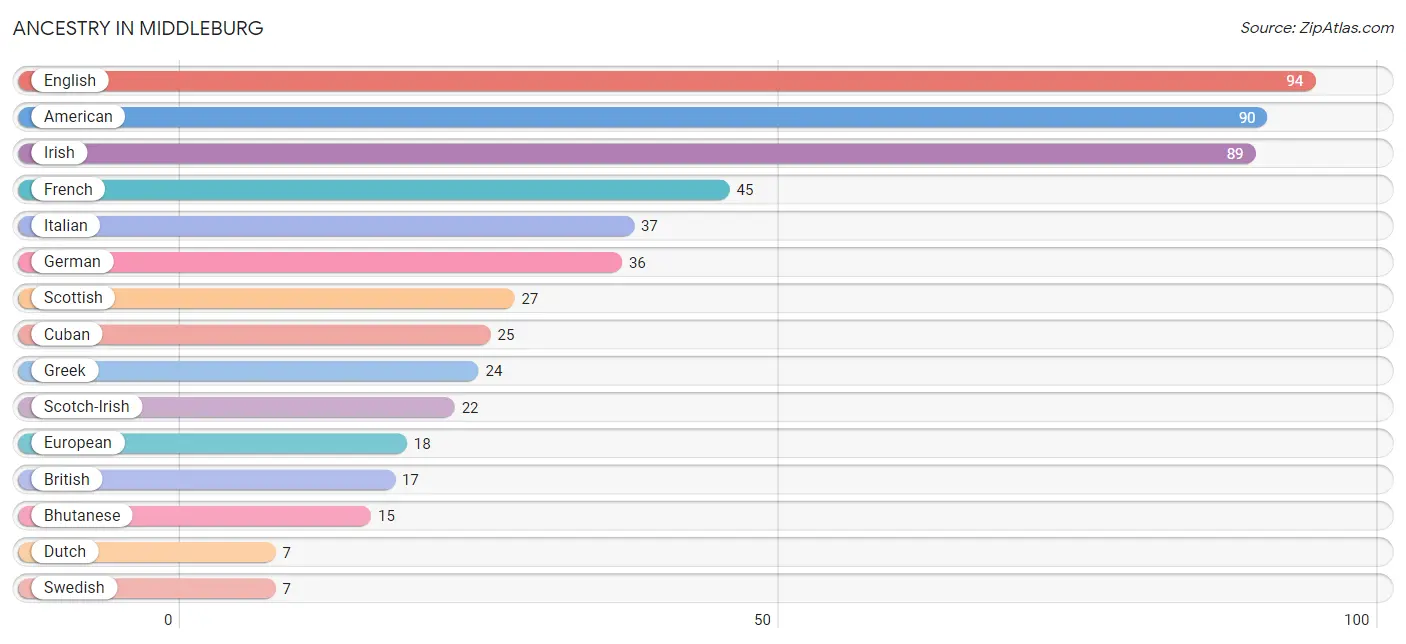
| Ancestry | # Population | % Population |
| American | 90 | 14.0% |
| Bhutanese | 15 | 2.3% |
| British | 17 | 2.6% |
| Central American | 1 | 0.2% |
| Cuban | 25 | 3.9% |
| Dutch | 7 | 1.1% |
| Eastern European | 6 | 0.9% |
| English | 94 | 14.6% |
| European | 18 | 2.8% |
| French | 45 | 7.0% |
| French Canadian | 2 | 0.3% |
| German | 36 | 5.6% |
| Greek | 24 | 3.7% |
| Honduran | 1 | 0.2% |
| Irish | 89 | 13.8% |
| Italian | 37 | 5.8% |
| Japanese | 4 | 0.6% |
| Lithuanian | 3 | 0.5% |
| Peruvian | 3 | 0.5% |
| Polish | 2 | 0.3% |
| Scandinavian | 3 | 0.5% |
| Scotch-Irish | 22 | 3.4% |
| Scottish | 27 | 4.2% |
| Slavic | 5 | 0.8% |
| Slovak | 1 | 0.2% |
| South American | 3 | 0.5% |
| Spanish | 6 | 0.9% |
| Swedish | 7 | 1.1% |
| Swiss | 2 | 0.3% | View All 29 Rows |
Immigrants in Middleburg
The most numerous immigrant groups reported in Middleburg came from Europe (16 | 2.5%), Western Europe (15 | 2.3%), France (8 | 1.2%), Germany (7 | 1.1%), and Latin America (4 | 0.6%), together accounting for 7.8% of all Middleburg residents.
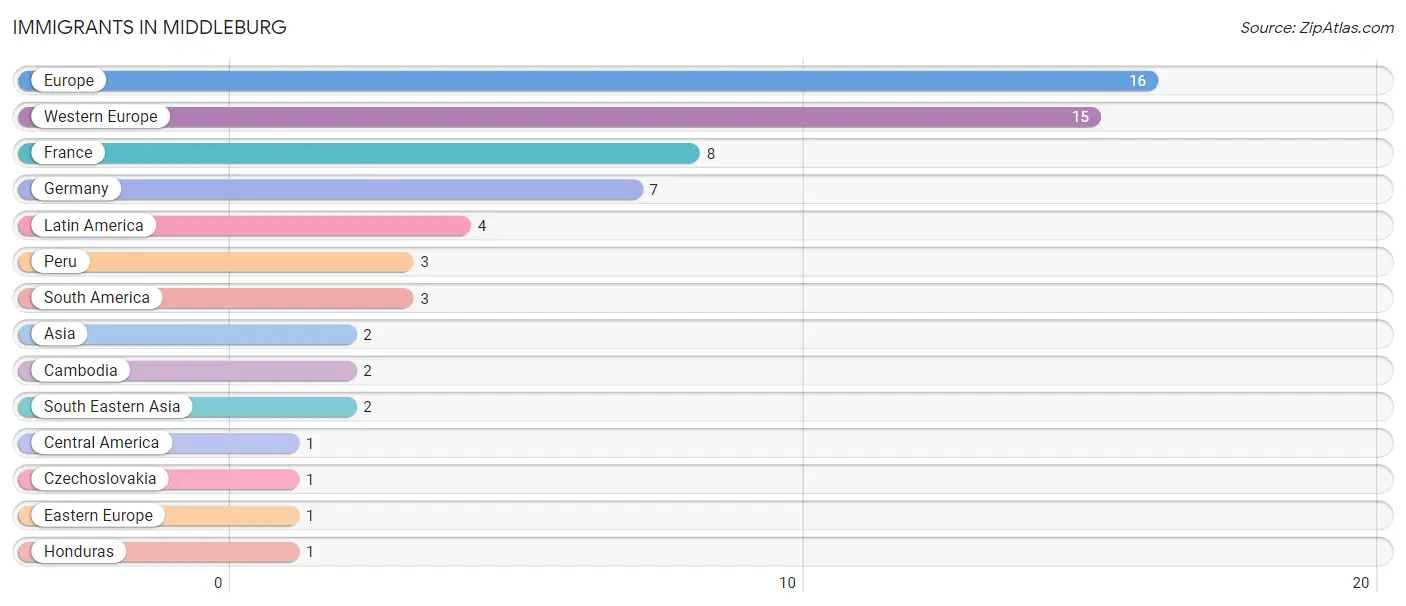
| Immigration Origin | # Population | % Population |
| Asia | 2 | 0.3% |
| Cambodia | 2 | 0.3% |
| Central America | 1 | 0.2% |
| Czechoslovakia | 1 | 0.2% |
| Eastern Europe | 1 | 0.2% |
| Europe | 16 | 2.5% |
| France | 8 | 1.2% |
| Germany | 7 | 1.1% |
| Honduras | 1 | 0.2% |
| Latin America | 4 | 0.6% |
| Peru | 3 | 0.5% |
| South America | 3 | 0.5% |
| South Eastern Asia | 2 | 0.3% |
| Western Europe | 15 | 2.3% | View All 14 Rows |
Sex and Age in Middleburg
Sex and Age in Middleburg
The most populous age groups in Middleburg are 15 to 19 Years (35 | 12.9%) for men and 70 to 74 Years (36 | 9.7%) for women.
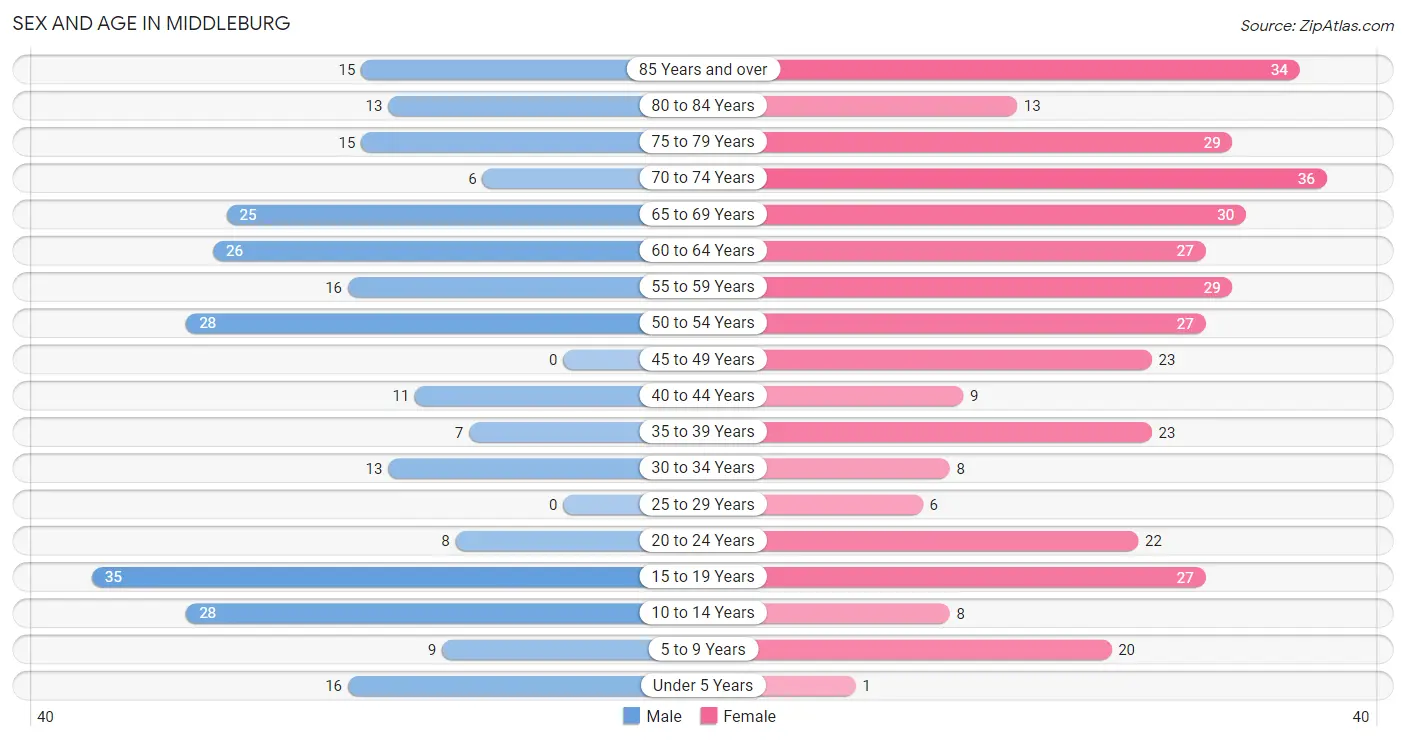
| Age Bracket | Male | Female |
| Under 5 Years | 16 (5.9%) | 1 (0.3%) |
| 5 to 9 Years | 9 (3.3%) | 20 (5.4%) |
| 10 to 14 Years | 28 (10.3%) | 8 (2.1%) |
| 15 to 19 Years | 35 (12.9%) | 27 (7.3%) |
| 20 to 24 Years | 8 (2.9%) | 22 (5.9%) |
| 25 to 29 Years | 0 (0.0%) | 6 (1.6%) |
| 30 to 34 Years | 13 (4.8%) | 8 (2.1%) |
| 35 to 39 Years | 7 (2.6%) | 23 (6.2%) |
| 40 to 44 Years | 11 (4.1%) | 9 (2.4%) |
| 45 to 49 Years | 0 (0.0%) | 23 (6.2%) |
| 50 to 54 Years | 28 (10.3%) | 27 (7.3%) |
| 55 to 59 Years | 16 (5.9%) | 29 (7.8%) |
| 60 to 64 Years | 26 (9.6%) | 27 (7.3%) |
| 65 to 69 Years | 25 (9.2%) | 30 (8.1%) |
| 70 to 74 Years | 6 (2.2%) | 36 (9.7%) |
| 75 to 79 Years | 15 (5.5%) | 29 (7.8%) |
| 80 to 84 Years | 13 (4.8%) | 13 (3.5%) |
| 85 Years and over | 15 (5.5%) | 34 (9.1%) |
| Total | 271 (100.0%) | 372 (100.0%) |
Families and Households in Middleburg
Median Family Size in Middleburg
The median family size in Middleburg is 2.51 persons per family, with single female/mother families (51 | 25.8%) accounting for the largest median family size of 2.88 persons per family. On the other hand, married-couple families (128 | 64.6%) represent the smallest median family size with 2.34 persons per family.
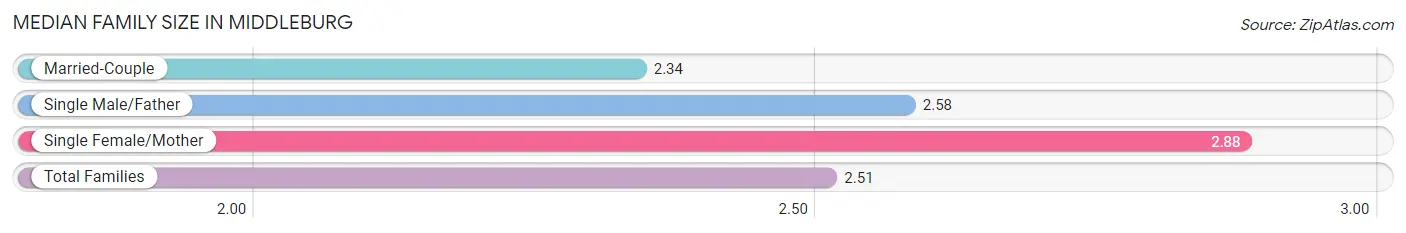
| Family Type | # Families | Family Size |
| Married-Couple | 128 (64.6%) | 2.34 |
| Single Male/Father | 19 (9.6%) | 2.58 |
| Single Female/Mother | 51 (25.8%) | 2.88 |
| Total Families | 198 (100.0%) | 2.51 |
Median Household Size in Middleburg
The median household size in Middleburg is 2.01 persons per household, with single male/father households (19 | 5.9%) accounting for the largest median household size of 3.11 persons per household. non-family households (122 | 38.1%) represent the smallest median household size with 1.05 persons per household.
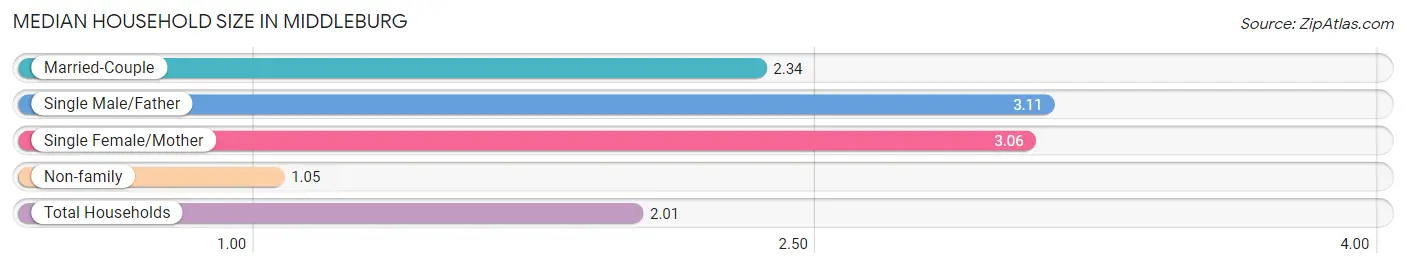
| Household Type | # Households | Household Size |
| Married-Couple | 128 (40.0%) | 2.34 |
| Single Male/Father | 19 (5.9%) | 3.11 |
| Single Female/Mother | 51 (15.9%) | 3.06 |
| Non-family | 122 (38.1%) | 1.05 |
| Total Households | 320 (100.0%) | 2.01 |
Household Size by Marriage Status in Middleburg
Out of a total of 320 households in Middleburg, 198 (61.9%) are family households, while 122 (38.1%) are nonfamily households. The most numerous type of family households are 2-person households, comprising 136, and the most common type of nonfamily households are 1-person households, comprising 118.
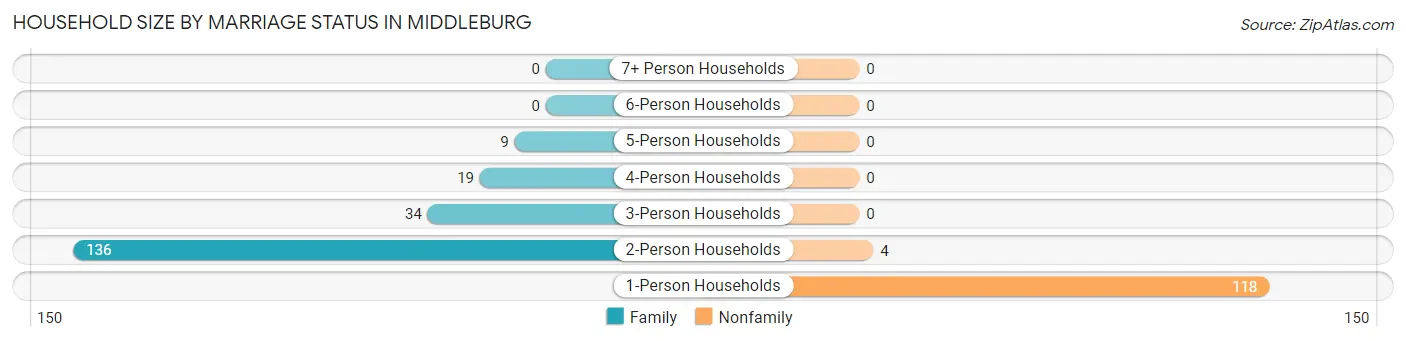
| Household Size | Family Households | Nonfamily Households |
| 1-Person Households | - | 118 (36.9%) |
| 2-Person Households | 136 (42.5%) | 4 (1.3%) |
| 3-Person Households | 34 (10.6%) | 0 (0.0%) |
| 4-Person Households | 19 (5.9%) | 0 (0.0%) |
| 5-Person Households | 9 (2.8%) | 0 (0.0%) |
| 6-Person Households | 0 (0.0%) | 0 (0.0%) |
| 7+ Person Households | 0 (0.0%) | 0 (0.0%) |
| Total | 198 (61.9%) | 122 (38.1%) |
Female Fertility in Middleburg
Fertility by Age in Middleburg
| Age Bracket | Women with Births | Births / 1,000 Women |
| 15 to 19 years | 0 (0.0%) | 0.0 |
| 20 to 34 years | 0 (0.0%) | 0.0 |
| 35 to 50 years | 0 (0.0%) | 0.0 |
| Total | 0 (0.0%) | 0.0 |
Fertility by Age by Marriage Status in Middleburg
| Age Bracket | Married | Unmarried |
| 15 to 19 years | 0 (0.0%) | 0 (0.0%) |
| 20 to 34 years | 0 (0.0%) | 0 (0.0%) |
| 35 to 50 years | 0 (0.0%) | 0 (0.0%) |
| Total | 0 (0.0%) | 0 (0.0%) |
Fertility by Education in Middleburg
| Educational Attainment | Women with Births | Births / 1,000 Women |
| Less than High School | 0 (0.0%) | 0.0 |
| High School Diploma | 0 (0.0%) | 0.0 |
| College or Associate's Degree | 0 (0.0%) | 0.0 |
| Bachelor's Degree | 0 (0.0%) | 0.0 |
| Graduate Degree | 0 (0.0%) | 0.0 |
| Total | 0 (0.0%) | 0.0 |
Fertility by Education by Marriage Status in Middleburg
| Educational Attainment | Married | Unmarried |
| Less than High School | 0 (0.0%) | 0 (0.0%) |
| High School Diploma | 0 (0.0%) | 0 (0.0%) |
| College or Associate's Degree | 0 (0.0%) | 0 (0.0%) |
| Bachelor's Degree | 0 (0.0%) | 0 (0.0%) |
| Graduate Degree | 0 (0.0%) | 0 (0.0%) |
| Total | 0 (0.0%) | 0 (0.0%) |
Employment Characteristics in Middleburg
Employment by Class of Employer in Middleburg
Among the 306 employed individuals in Middleburg, private company employees (207 | 67.6%), local government employees (30 | 9.8%), and not-for-profit organizations (27 | 8.8%) make up the most common classes of employment.
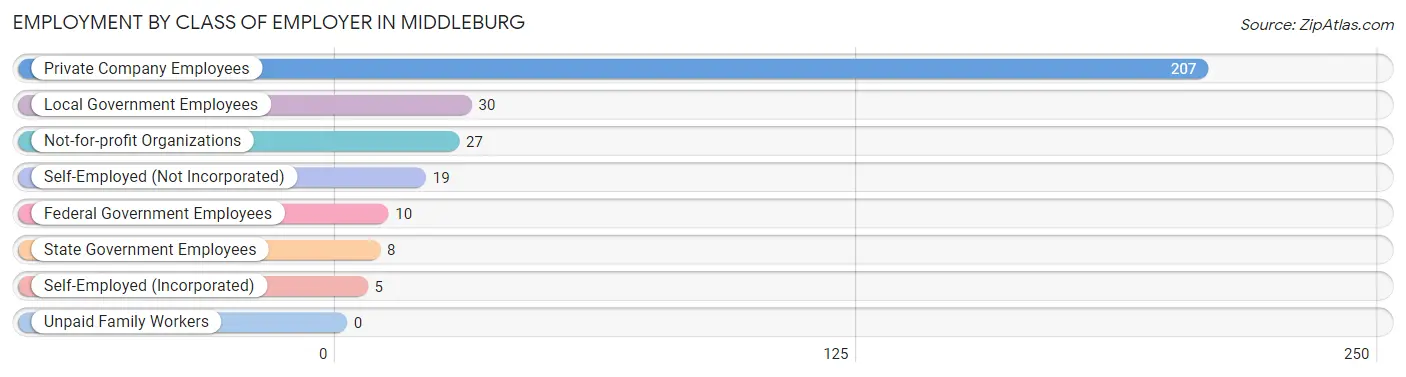
| Employer Class | # Employees | % Employees |
| Private Company Employees | 207 | 67.6% |
| Self-Employed (Incorporated) | 5 | 1.6% |
| Self-Employed (Not Incorporated) | 19 | 6.2% |
| Not-for-profit Organizations | 27 | 8.8% |
| Local Government Employees | 30 | 9.8% |
| State Government Employees | 8 | 2.6% |
| Federal Government Employees | 10 | 3.3% |
| Unpaid Family Workers | 0 | 0.0% |
| Total | 306 | 100.0% |
Employment Status by Age in Middleburg
According to the labor force statistics for Middleburg, out of the total population over 16 years of age (553), 59.9% or 331 individuals are in the labor force, with 6.9% or 23 of them unemployed. The age group with the highest labor force participation rate is 20 to 24 years, with 100.0% or 30 individuals in the labor force. Within the labor force, the 20 to 24 years age range has the highest percentage of unemployed individuals, with 40.0% or 12 of them being unemployed.
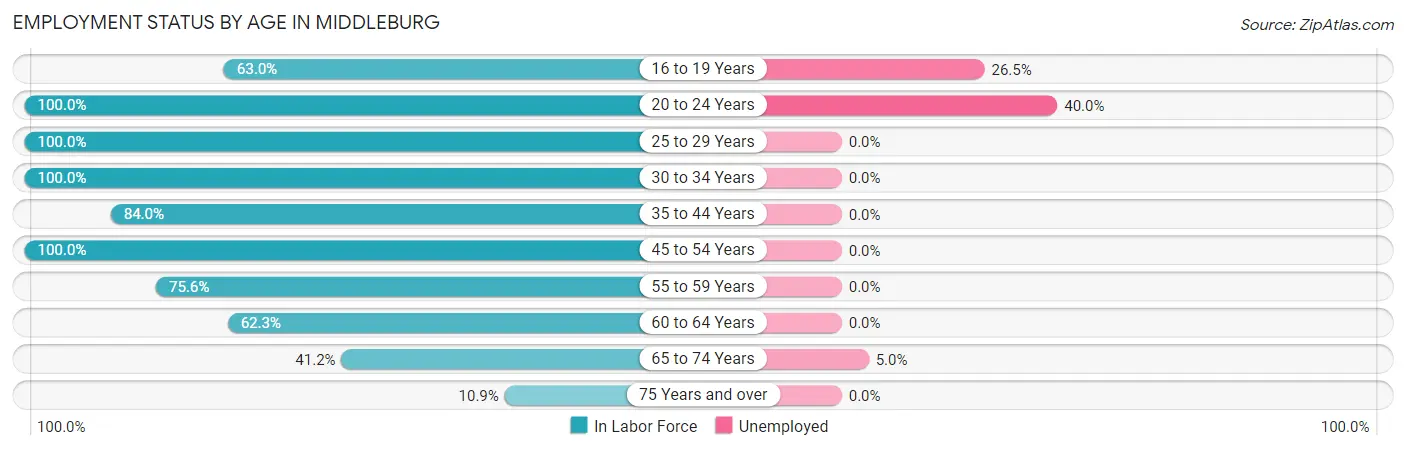
| Age Bracket | In Labor Force | Unemployed |
| 16 to 19 Years | 34 (63.0%) | 9 (26.5%) |
| 20 to 24 Years | 30 (100.0%) | 12 (40.0%) |
| 25 to 29 Years | 6 (100.0%) | 0 (0.0%) |
| 30 to 34 Years | 21 (100.0%) | 0 (0.0%) |
| 35 to 44 Years | 42 (84.0%) | 0 (0.0%) |
| 45 to 54 Years | 78 (100.0%) | 0 (0.0%) |
| 55 to 59 Years | 34 (75.6%) | 0 (0.0%) |
| 60 to 64 Years | 33 (62.3%) | 0 (0.0%) |
| 65 to 74 Years | 40 (41.2%) | 2 (5.0%) |
| 75 Years and over | 13 (10.9%) | 0 (0.0%) |
| Total | 331 (59.9%) | 23 (6.9%) |
Employment Status by Educational Attainment in Middleburg
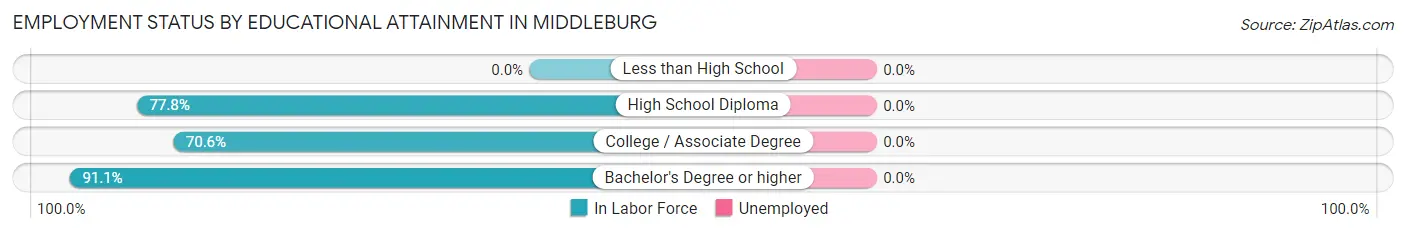
| Educational Attainment | In Labor Force | Unemployed |
| Less than High School | 0 (0.0%) | 0 (0.0%) |
| High School Diploma | 35 (77.8%) | 0 (0.0%) |
| College / Associate Degree | 36 (70.6%) | 0 (0.0%) |
| Bachelor's Degree or higher | 143 (91.1%) | 0 (0.0%) |
| Total | 214 (84.6%) | 0 (0.0%) |
Employment Occupations by Sex in Middleburg
Management, Business, Science and Arts Occupations
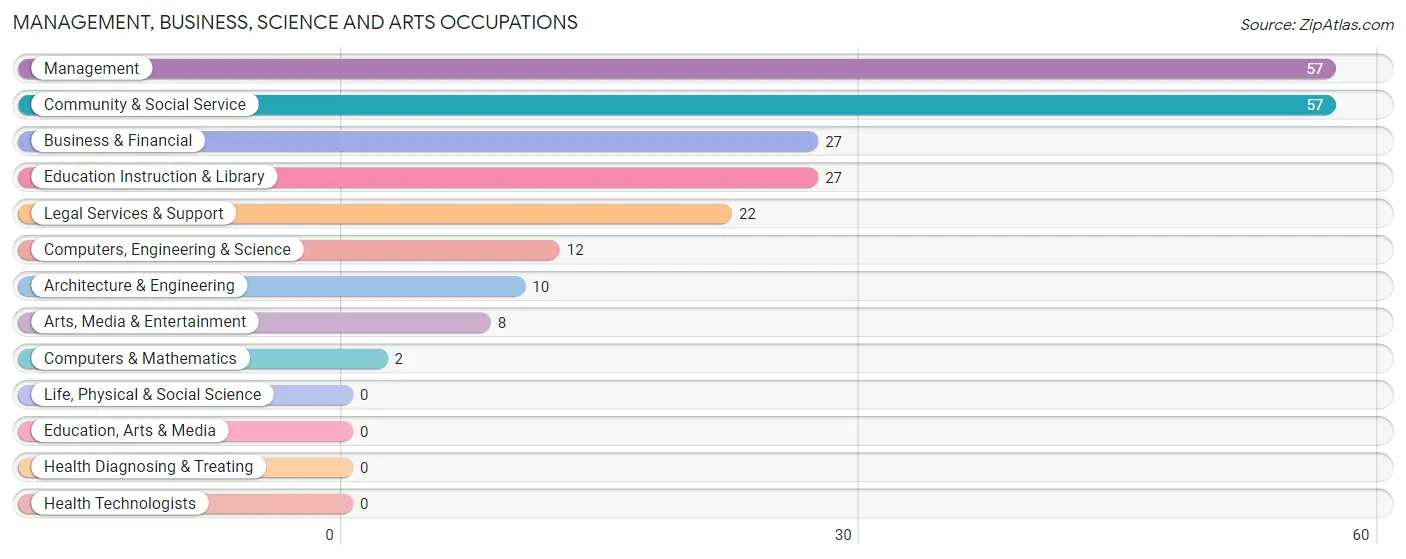
The most common Management, Business, Science and Arts occupations in Middleburg are Management (57 | 18.5%), Community & Social Service (57 | 18.5%), Business & Financial (27 | 8.8%), Education Instruction & Library (27 | 8.8%), and Legal Services & Support (22 | 7.1%).
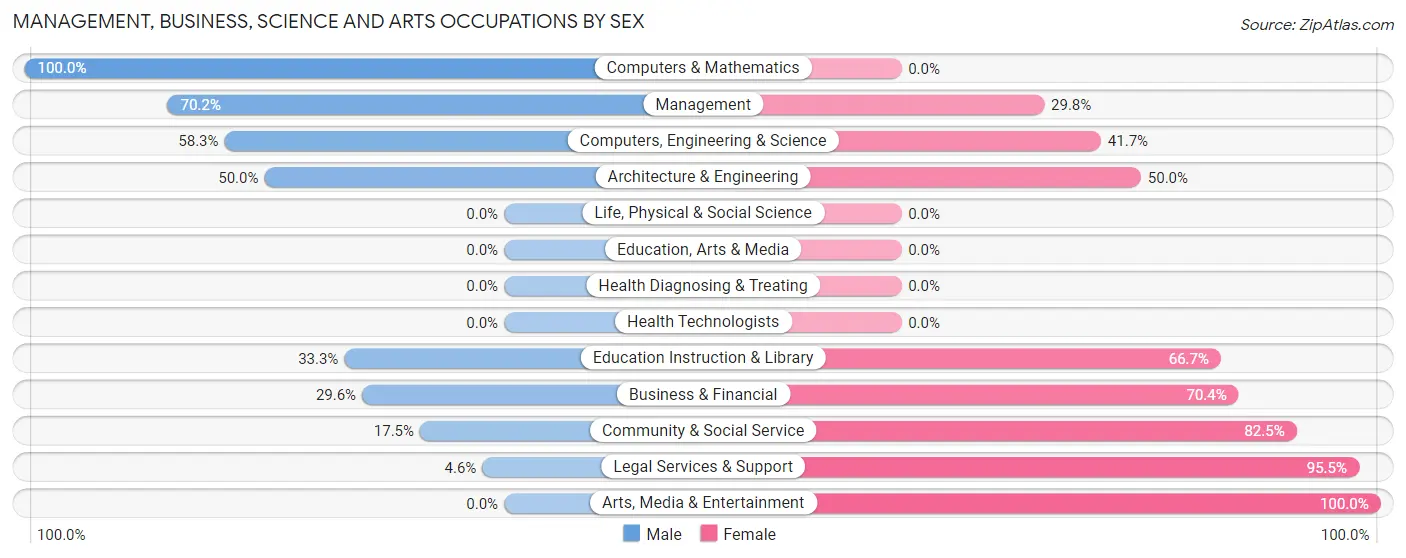
Management, Business, Science and Arts Occupations by Sex
Within the Management, Business, Science and Arts occupations in Middleburg, the most male-oriented occupations are Computers & Mathematics (100.0%), Management (70.2%), and Computers, Engineering & Science (58.3%), while the most female-oriented occupations are Arts, Media & Entertainment (100.0%), Legal Services & Support (95.5%), and Community & Social Service (82.5%).
| Occupation | Male | Female |
| Management | 40 (70.2%) | 17 (29.8%) |
| Business & Financial | 8 (29.6%) | 19 (70.4%) |
| Computers, Engineering & Science | 7 (58.3%) | 5 (41.7%) |
| Computers & Mathematics | 2 (100.0%) | 0 (0.0%) |
| Architecture & Engineering | 5 (50.0%) | 5 (50.0%) |
| Life, Physical & Social Science | 0 (0.0%) | 0 (0.0%) |
| Community & Social Service | 10 (17.5%) | 47 (82.5%) |
| Education, Arts & Media | 0 (0.0%) | 0 (0.0%) |
| Legal Services & Support | 1 (4.5%) | 21 (95.5%) |
| Education Instruction & Library | 9 (33.3%) | 18 (66.7%) |
| Arts, Media & Entertainment | 0 (0.0%) | 8 (100.0%) |
| Health Diagnosing & Treating | 0 (0.0%) | 0 (0.0%) |
| Health Technologists | 0 (0.0%) | 0 (0.0%) |
| Total (Category) | 65 (42.5%) | 88 (57.5%) |
| Total (Overall) | 144 (46.8%) | 164 (53.2%) |
Services Occupations
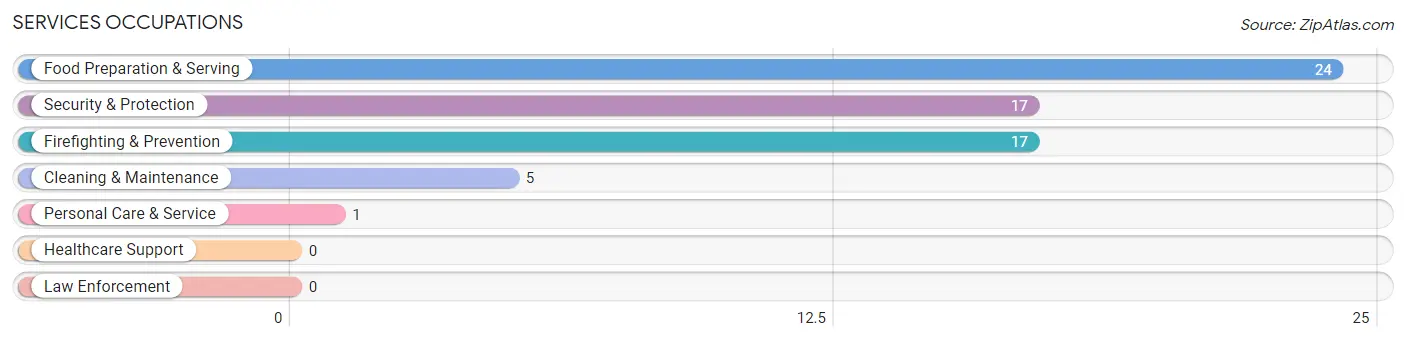
The most common Services occupations in Middleburg are Food Preparation & Serving (24 | 7.8%), Security & Protection (17 | 5.5%), Firefighting & Prevention (17 | 5.5%), Cleaning & Maintenance (5 | 1.6%), and Personal Care & Service (1 | 0.3%).
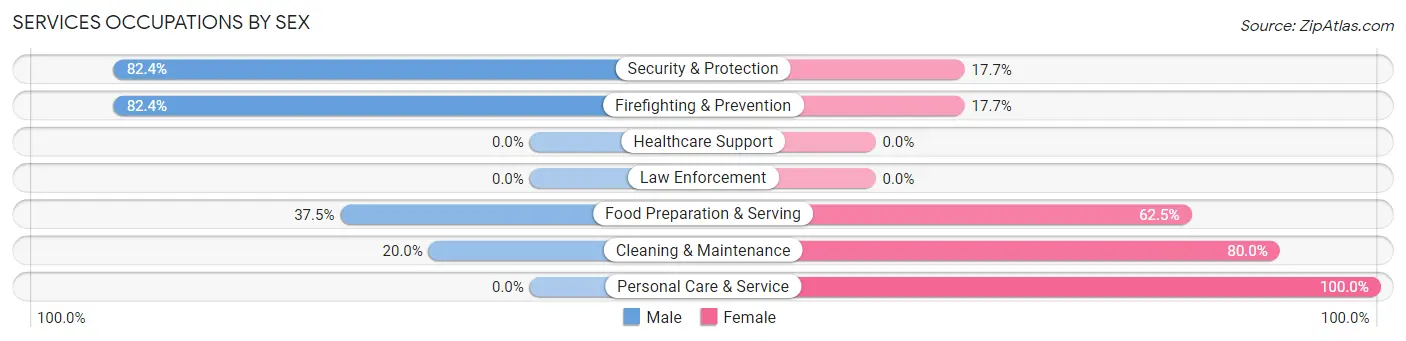
Services Occupations by Sex
Within the Services occupations in Middleburg, the most male-oriented occupations are Security & Protection (82.4%), Firefighting & Prevention (82.4%), and Food Preparation & Serving (37.5%), while the most female-oriented occupations are Personal Care & Service (100.0%), Cleaning & Maintenance (80.0%), and Food Preparation & Serving (62.5%).
| Occupation | Male | Female |
| Healthcare Support | 0 (0.0%) | 0 (0.0%) |
| Security & Protection | 14 (82.4%) | 3 (17.6%) |
| Firefighting & Prevention | 14 (82.4%) | 3 (17.6%) |
| Law Enforcement | 0 (0.0%) | 0 (0.0%) |
| Food Preparation & Serving | 9 (37.5%) | 15 (62.5%) |
| Cleaning & Maintenance | 1 (20.0%) | 4 (80.0%) |
| Personal Care & Service | 0 (0.0%) | 1 (100.0%) |
| Total (Category) | 24 (51.1%) | 23 (48.9%) |
| Total (Overall) | 144 (46.8%) | 164 (53.2%) |
Sales and Office Occupations
The most common Sales and Office occupations in Middleburg are Sales & Related (46 | 14.9%), and Office & Administration (30 | 9.7%).
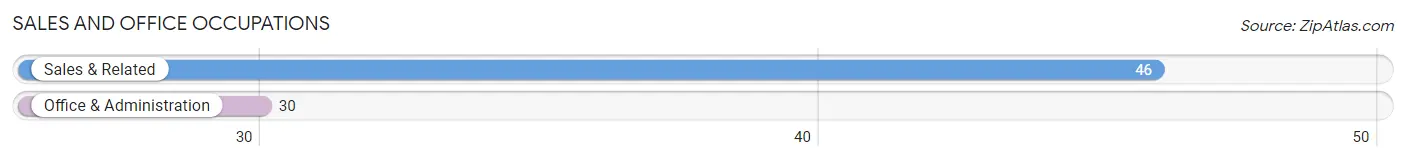
Sales and Office Occupations by Sex
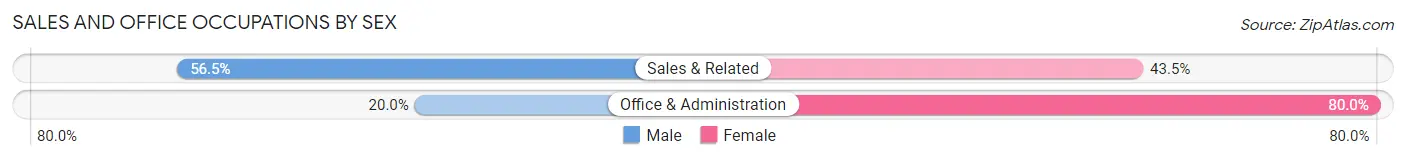
| Occupation | Male | Female |
| Sales & Related | 26 (56.5%) | 20 (43.5%) |
| Office & Administration | 6 (20.0%) | 24 (80.0%) |
| Total (Category) | 32 (42.1%) | 44 (57.9%) |
| Total (Overall) | 144 (46.8%) | 164 (53.2%) |
Natural Resources, Construction and Maintenance Occupations
The most common Natural Resources, Construction and Maintenance occupations in Middleburg are , and Construction & Extraction (15 | 4.9%).
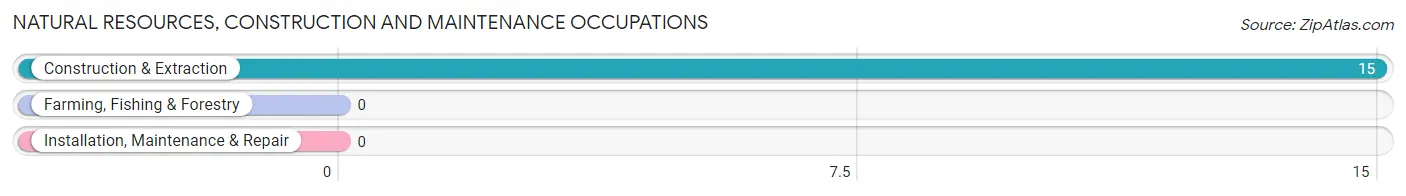
Natural Resources, Construction and Maintenance Occupations by Sex
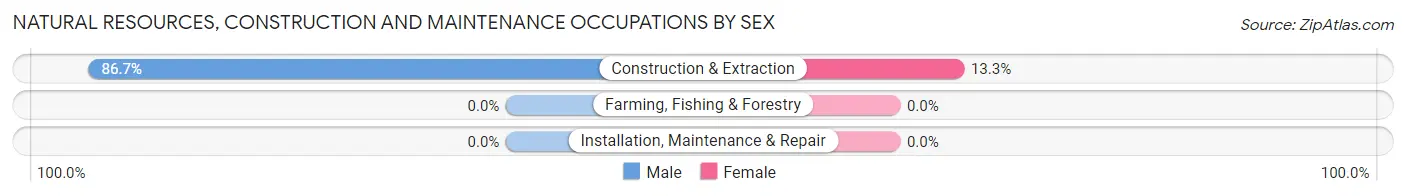
| Occupation | Male | Female |
| Farming, Fishing & Forestry | 0 (0.0%) | 0 (0.0%) |
| Construction & Extraction | 13 (86.7%) | 2 (13.3%) |
| Installation, Maintenance & Repair | 0 (0.0%) | 0 (0.0%) |
| Total (Category) | 13 (86.7%) | 2 (13.3%) |
| Total (Overall) | 144 (46.8%) | 164 (53.2%) |
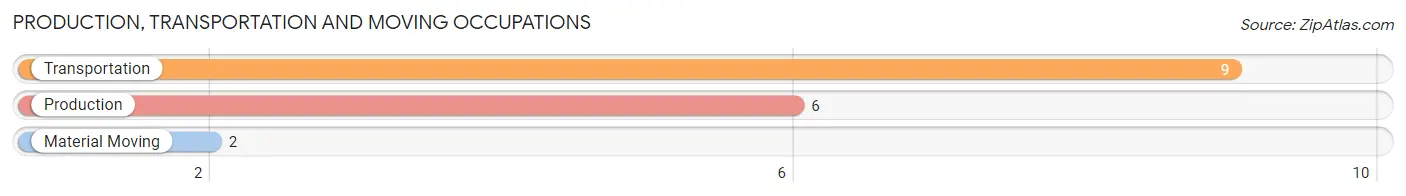
Production, Transportation and Moving Occupations
The most common Production, Transportation and Moving occupations in Middleburg are Transportation (9 | 2.9%), Production (6 | 1.9%), and Material Moving (2 | 0.6%).
Production, Transportation and Moving Occupations by Sex
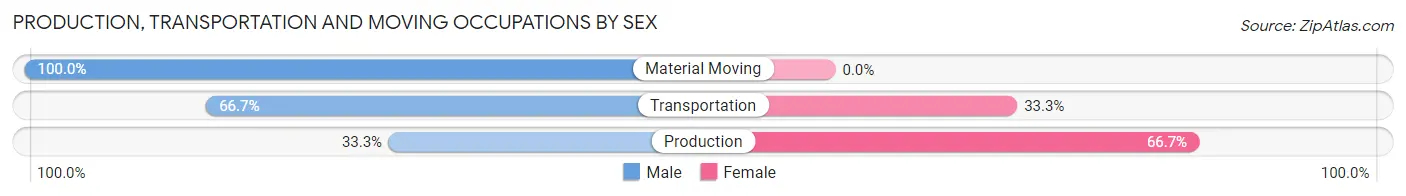
| Occupation | Male | Female |
| Production | 2 (33.3%) | 4 (66.7%) |
| Transportation | 6 (66.7%) | 3 (33.3%) |
| Material Moving | 2 (100.0%) | 0 (0.0%) |
| Total (Category) | 10 (58.8%) | 7 (41.2%) |
| Total (Overall) | 144 (46.8%) | 164 (53.2%) |
Employment Industries by Sex in Middleburg
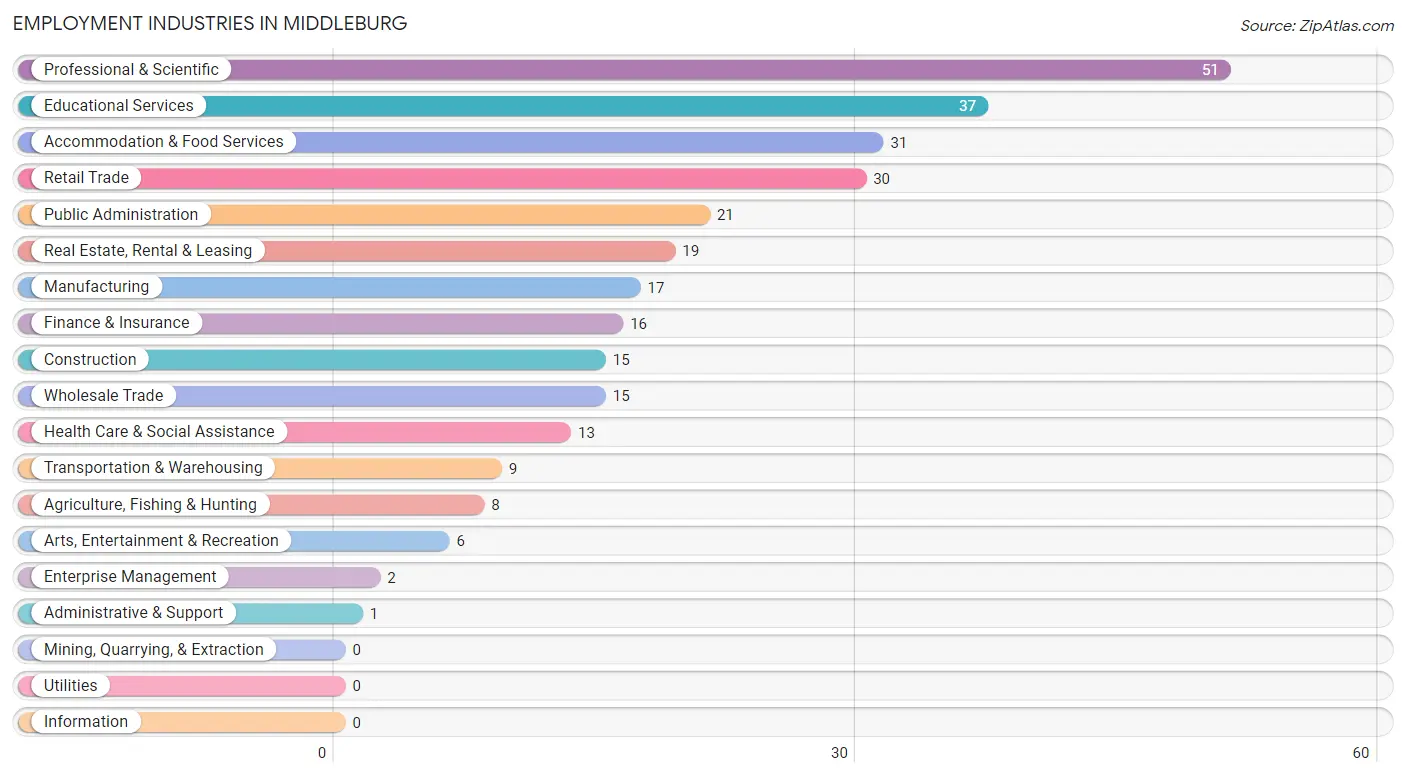
Employment Industries in Middleburg
The major employment industries in Middleburg include Professional & Scientific (51 | 16.6%), Educational Services (37 | 12.0%), Accommodation & Food Services (31 | 10.1%), Retail Trade (30 | 9.7%), and Public Administration (21 | 6.8%).
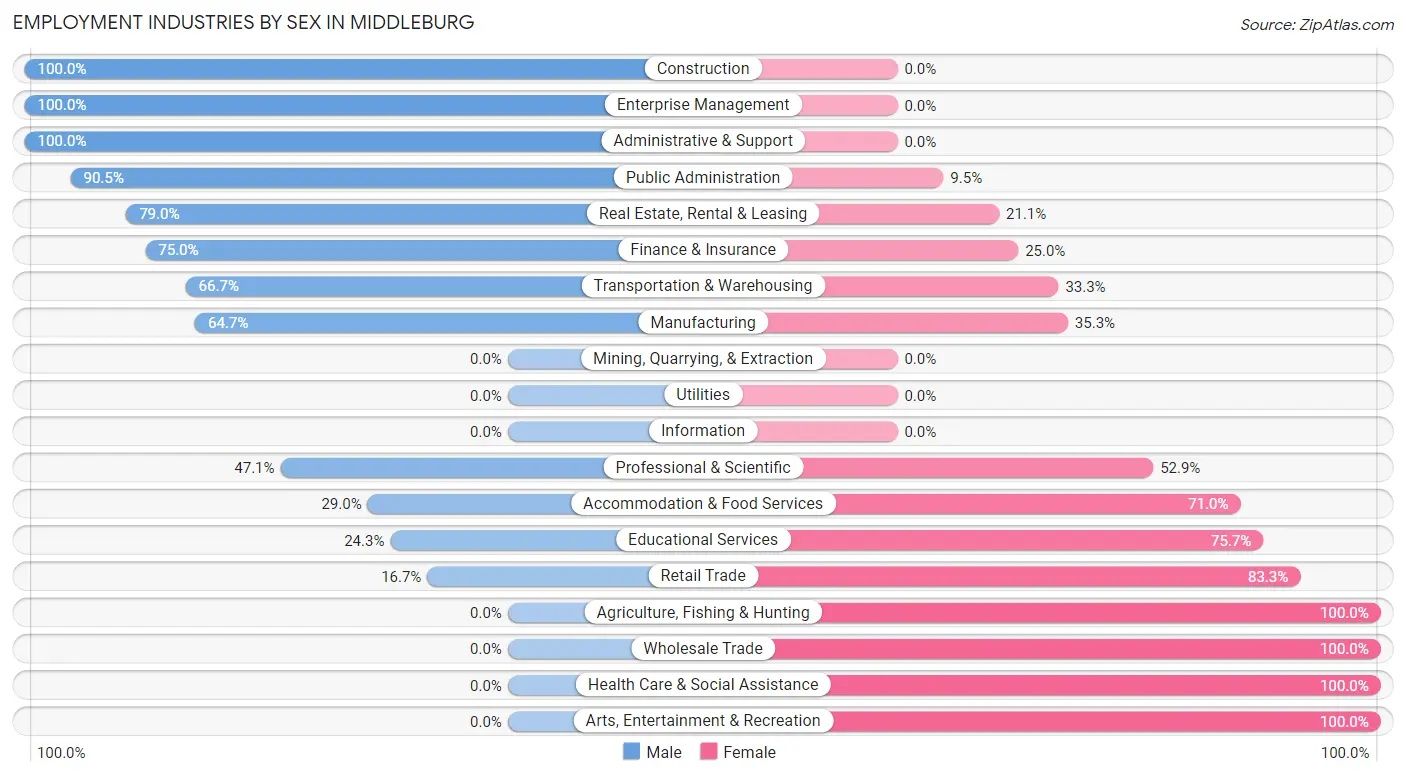
Employment Industries by Sex in Middleburg
The Middleburg industries that see more men than women are Construction (100.0%), Enterprise Management (100.0%), and Administrative & Support (100.0%), whereas the industries that tend to have a higher number of women are Agriculture, Fishing & Hunting (100.0%), Wholesale Trade (100.0%), and Health Care & Social Assistance (100.0%).
| Industry | Male | Female |
| Agriculture, Fishing & Hunting | 0 (0.0%) | 8 (100.0%) |
| Mining, Quarrying, & Extraction | 0 (0.0%) | 0 (0.0%) |
| Construction | 15 (100.0%) | 0 (0.0%) |
| Manufacturing | 11 (64.7%) | 6 (35.3%) |
| Wholesale Trade | 0 (0.0%) | 15 (100.0%) |
| Retail Trade | 5 (16.7%) | 25 (83.3%) |
| Transportation & Warehousing | 6 (66.7%) | 3 (33.3%) |
| Utilities | 0 (0.0%) | 0 (0.0%) |
| Information | 0 (0.0%) | 0 (0.0%) |
| Finance & Insurance | 12 (75.0%) | 4 (25.0%) |
| Real Estate, Rental & Leasing | 15 (78.9%) | 4 (21.0%) |
| Professional & Scientific | 24 (47.1%) | 27 (52.9%) |
| Enterprise Management | 2 (100.0%) | 0 (0.0%) |
| Administrative & Support | 1 (100.0%) | 0 (0.0%) |
| Educational Services | 9 (24.3%) | 28 (75.7%) |
| Health Care & Social Assistance | 0 (0.0%) | 13 (100.0%) |
| Arts, Entertainment & Recreation | 0 (0.0%) | 6 (100.0%) |
| Accommodation & Food Services | 9 (29.0%) | 22 (71.0%) |
| Public Administration | 19 (90.5%) | 2 (9.5%) |
| Total | 144 (46.8%) | 164 (53.2%) |
Education in Middleburg
School Enrollment in Middleburg
The most common levels of schooling among the 100 students in Middleburg are middle school (37 | 37.0%), kindergarten (20 | 20.0%), and high school (20 | 20.0%).
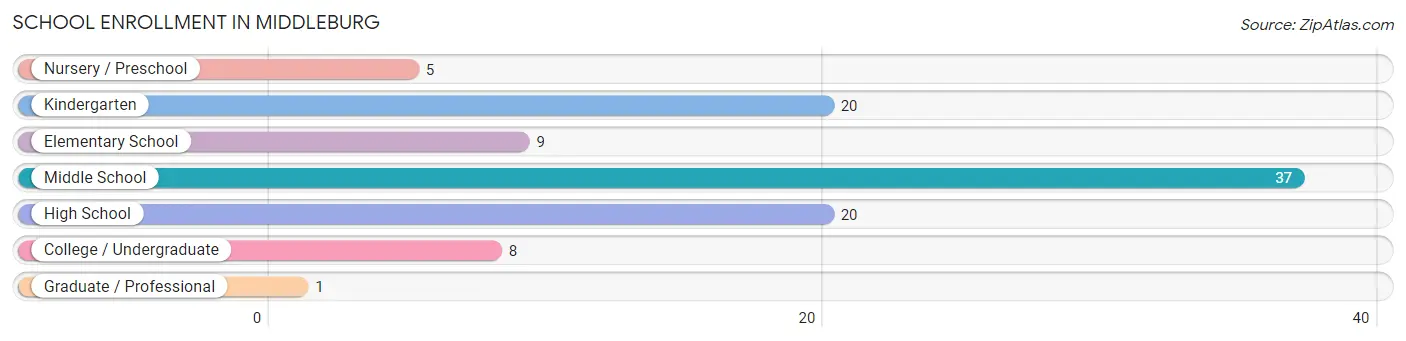
| School Level | # Students | % Students |
| Nursery / Preschool | 5 | 5.0% |
| Kindergarten | 20 | 20.0% |
| Elementary School | 9 | 9.0% |
| Middle School | 37 | 37.0% |
| High School | 20 | 20.0% |
| College / Undergraduate | 8 | 8.0% |
| Graduate / Professional | 1 | 1.0% |
| Total | 100 | 100.0% |
School Enrollment by Age by Funding Source in Middleburg
Out of a total of 100 students who are enrolled in schools in Middleburg, 58 (58.0%) attend a private institution, while the remaining 42 (42.0%) are enrolled in public schools. The age group of 5 to 9 year old has the highest likelihood of being enrolled in private schools, with 24 (82.8% in the age bracket) enrolled. Conversely, the age group of 18 to 19 year olds has the lowest likelihood of being enrolled in a private school, with 13 (100.0% in the age bracket) attending a public institution.
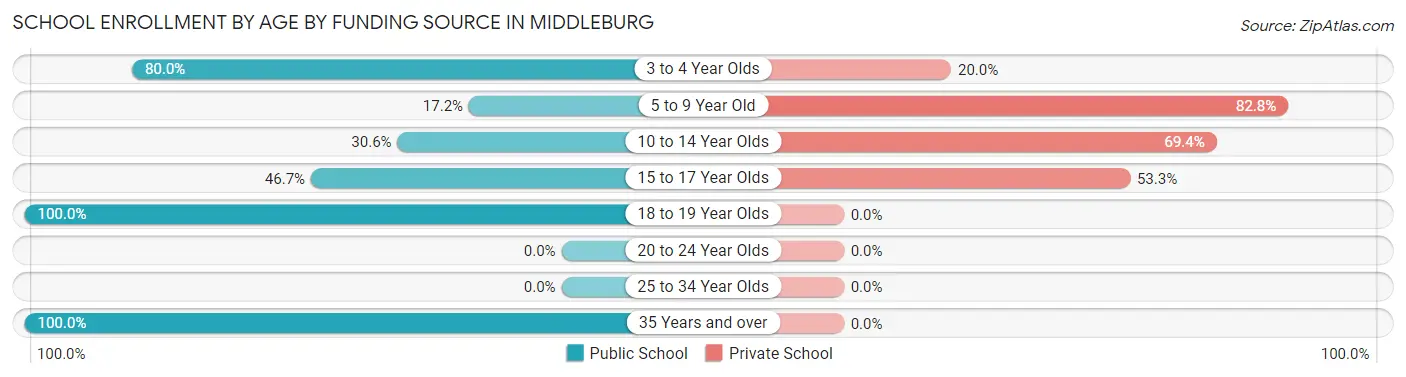
| Age Bracket | Public School | Private School |
| 3 to 4 Year Olds | 4 (80.0%) | 1 (20.0%) |
| 5 to 9 Year Old | 5 (17.2%) | 24 (82.8%) |
| 10 to 14 Year Olds | 11 (30.6%) | 25 (69.4%) |
| 15 to 17 Year Olds | 7 (46.7%) | 8 (53.3%) |
| 18 to 19 Year Olds | 13 (100.0%) | 0 (0.0%) |
| 20 to 24 Year Olds | 0 (0.0%) | 0 (0.0%) |
| 25 to 34 Year Olds | 0 (0.0%) | 0 (0.0%) |
| 35 Years and over | 2 (100.0%) | 0 (0.0%) |
| Total | 42 (42.0%) | 58 (58.0%) |
Educational Attainment by Field of Study in Middleburg
Liberal arts & history (49 | 16.5%), social sciences (46 | 15.5%), bio, nature & agricultural (36 | 12.1%), education (32 | 10.8%), and business (28 | 9.4%) are the most common fields of study among 297 individuals in Middleburg who have obtained a bachelor's degree or higher.
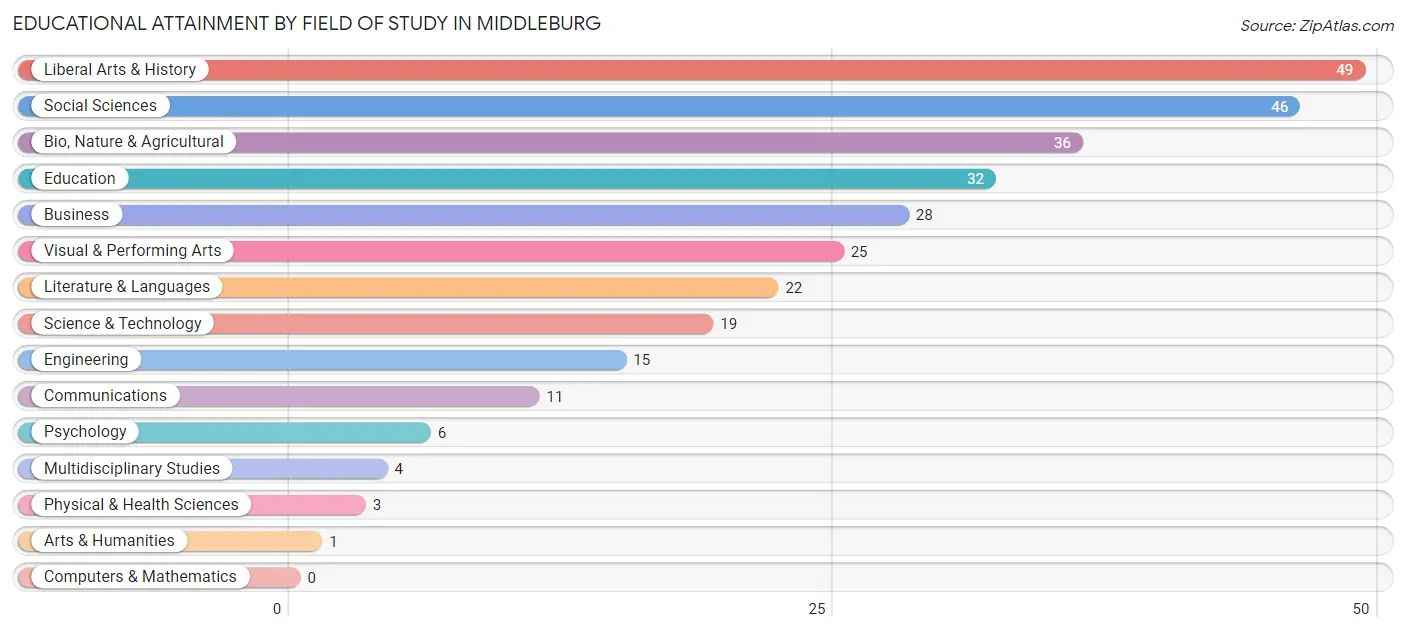
| Field of Study | # Graduates | % Graduates |
| Computers & Mathematics | 0 | 0.0% |
| Bio, Nature & Agricultural | 36 | 12.1% |
| Physical & Health Sciences | 3 | 1.0% |
| Psychology | 6 | 2.0% |
| Social Sciences | 46 | 15.5% |
| Engineering | 15 | 5.1% |
| Multidisciplinary Studies | 4 | 1.3% |
| Science & Technology | 19 | 6.4% |
| Business | 28 | 9.4% |
| Education | 32 | 10.8% |
| Literature & Languages | 22 | 7.4% |
| Liberal Arts & History | 49 | 16.5% |
| Visual & Performing Arts | 25 | 8.4% |
| Communications | 11 | 3.7% |
| Arts & Humanities | 1 | 0.3% |
| Total | 297 | 100.0% |
Transportation & Commute in Middleburg
Vehicle Availability by Sex in Middleburg
The most prevalent vehicle ownership categories in Middleburg are males with 2 vehicles (62, accounting for 43.1%) and females with 2 vehicles (66, making up 38.3%).
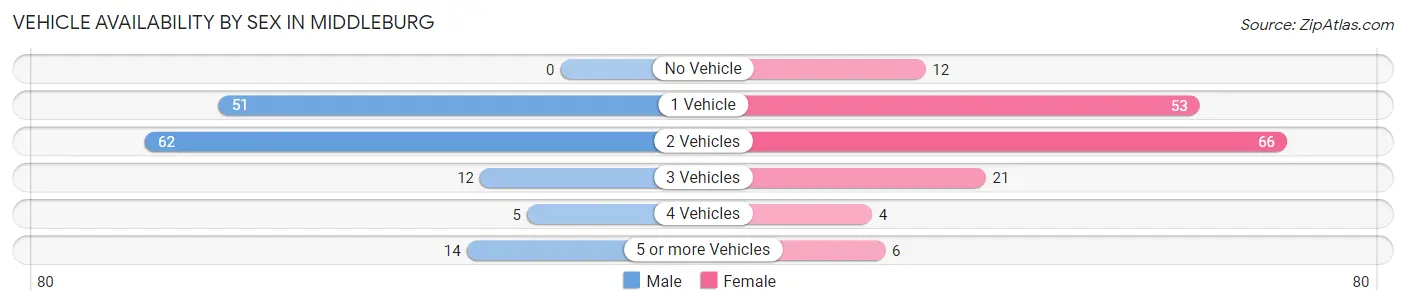
| Vehicles Available | Male | Female |
| No Vehicle | 0 (0.0%) | 12 (7.4%) |
| 1 Vehicle | 51 (35.4%) | 53 (32.7%) |
| 2 Vehicles | 62 (43.1%) | 66 (40.7%) |
| 3 Vehicles | 12 (8.3%) | 21 (13.0%) |
| 4 Vehicles | 5 (3.5%) | 4 (2.5%) |
| 5 or more Vehicles | 14 (9.7%) | 6 (3.7%) |
| Total | 144 (100.0%) | 162 (100.0%) |
Commute Time in Middleburg
The most frequently occuring commute durations in Middleburg are 5 to 9 minutes (40 commuters, 19.7%), less than 5 minutes (39 commuters, 19.2%), and 30 to 34 minutes (31 commuters, 15.3%).
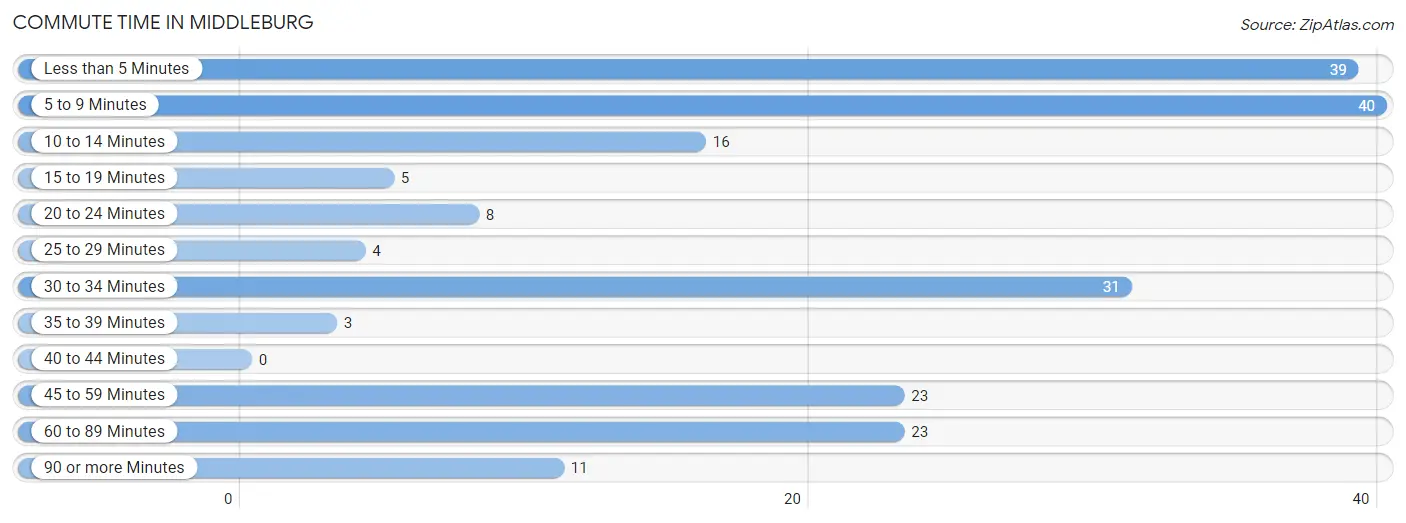
| Commute Time | # Commuters | % Commuters |
| Less than 5 Minutes | 39 | 19.2% |
| 5 to 9 Minutes | 40 | 19.7% |
| 10 to 14 Minutes | 16 | 7.9% |
| 15 to 19 Minutes | 5 | 2.5% |
| 20 to 24 Minutes | 8 | 3.9% |
| 25 to 29 Minutes | 4 | 2.0% |
| 30 to 34 Minutes | 31 | 15.3% |
| 35 to 39 Minutes | 3 | 1.5% |
| 40 to 44 Minutes | 0 | 0.0% |
| 45 to 59 Minutes | 23 | 11.3% |
| 60 to 89 Minutes | 23 | 11.3% |
| 90 or more Minutes | 11 | 5.4% |
Commute Time by Sex in Middleburg
The most common commute times in Middleburg are 45 to 59 minutes (20 commuters, 19.1%) for males and less than 5 minutes (25 commuters, 25.5%) for females.
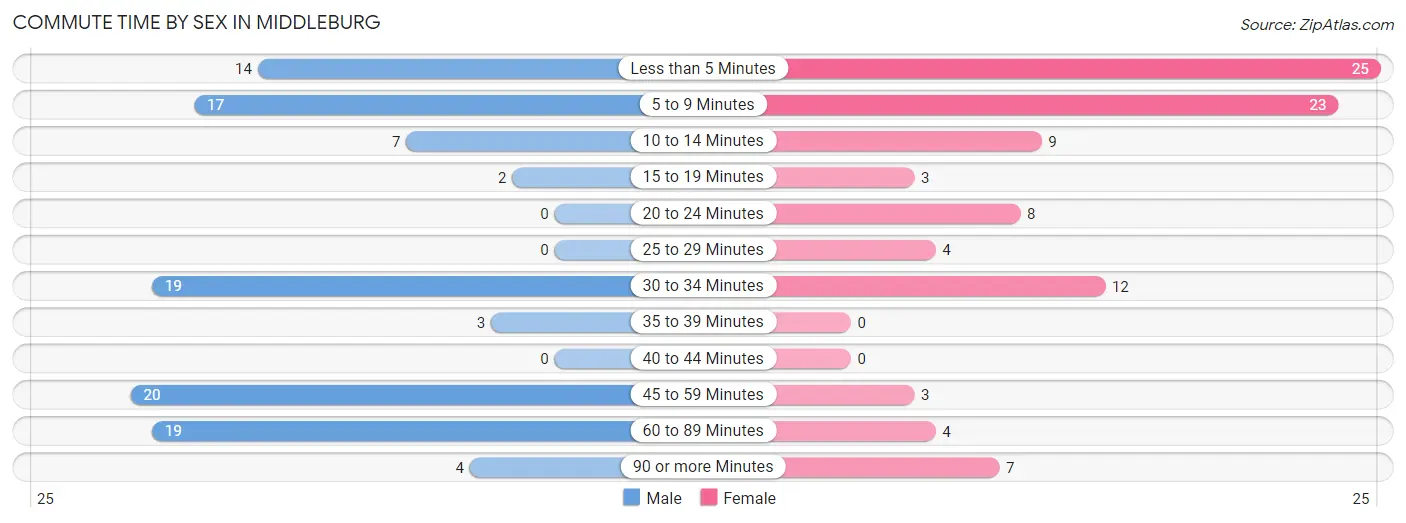
| Commute Time | Male | Female |
| Less than 5 Minutes | 14 (13.3%) | 25 (25.5%) |
| 5 to 9 Minutes | 17 (16.2%) | 23 (23.5%) |
| 10 to 14 Minutes | 7 (6.7%) | 9 (9.2%) |
| 15 to 19 Minutes | 2 (1.9%) | 3 (3.1%) |
| 20 to 24 Minutes | 0 (0.0%) | 8 (8.2%) |
| 25 to 29 Minutes | 0 (0.0%) | 4 (4.1%) |
| 30 to 34 Minutes | 19 (18.1%) | 12 (12.2%) |
| 35 to 39 Minutes | 3 (2.9%) | 0 (0.0%) |
| 40 to 44 Minutes | 0 (0.0%) | 0 (0.0%) |
| 45 to 59 Minutes | 20 (19.1%) | 3 (3.1%) |
| 60 to 89 Minutes | 19 (18.1%) | 4 (4.1%) |
| 90 or more Minutes | 4 (3.8%) | 7 (7.1%) |
Time of Departure to Work by Sex in Middleburg
The most frequent times of departure to work in Middleburg are 6:00 AM to 6:29 AM (31, 29.5%) for males and 7:00 AM to 7:29 AM (24, 24.5%) for females.
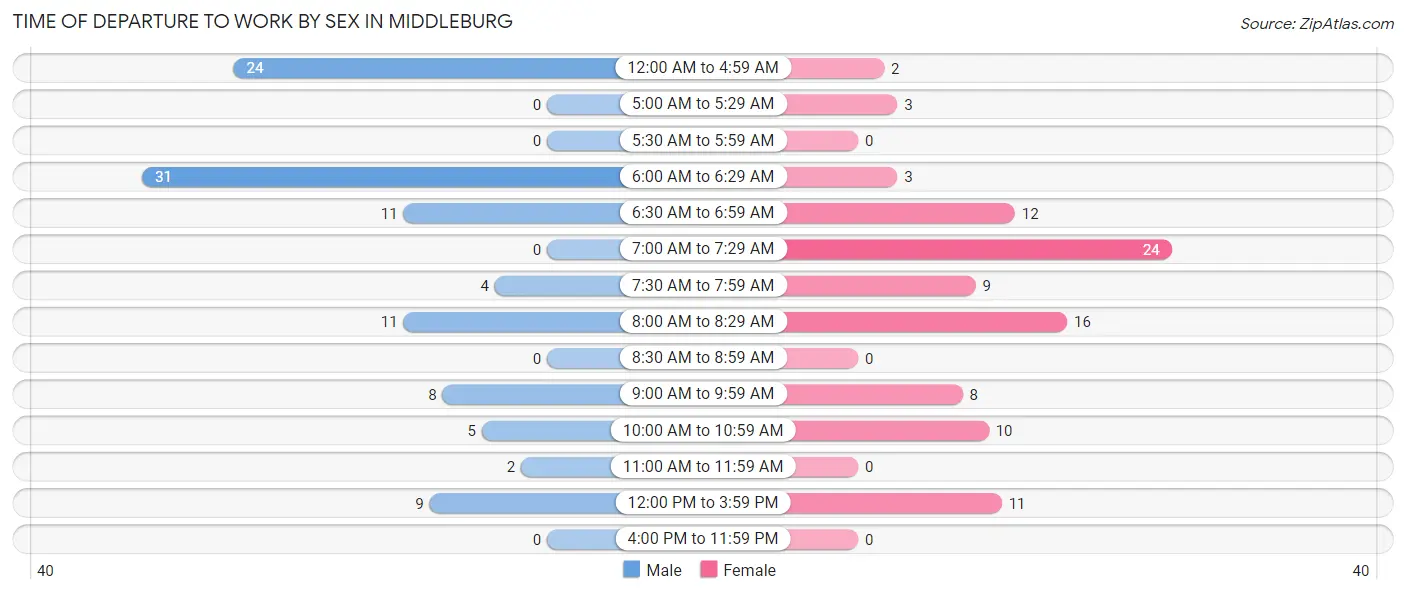
| Time of Departure | Male | Female |
| 12:00 AM to 4:59 AM | 24 (22.9%) | 2 (2.0%) |
| 5:00 AM to 5:29 AM | 0 (0.0%) | 3 (3.1%) |
| 5:30 AM to 5:59 AM | 0 (0.0%) | 0 (0.0%) |
| 6:00 AM to 6:29 AM | 31 (29.5%) | 3 (3.1%) |
| 6:30 AM to 6:59 AM | 11 (10.5%) | 12 (12.2%) |
| 7:00 AM to 7:29 AM | 0 (0.0%) | 24 (24.5%) |
| 7:30 AM to 7:59 AM | 4 (3.8%) | 9 (9.2%) |
| 8:00 AM to 8:29 AM | 11 (10.5%) | 16 (16.3%) |
| 8:30 AM to 8:59 AM | 0 (0.0%) | 0 (0.0%) |
| 9:00 AM to 9:59 AM | 8 (7.6%) | 8 (8.2%) |
| 10:00 AM to 10:59 AM | 5 (4.8%) | 10 (10.2%) |
| 11:00 AM to 11:59 AM | 2 (1.9%) | 0 (0.0%) |
| 12:00 PM to 3:59 PM | 9 (8.6%) | 11 (11.2%) |
| 4:00 PM to 11:59 PM | 0 (0.0%) | 0 (0.0%) |
| Total | 105 (100.0%) | 98 (100.0%) |
Housing Occupancy in Middleburg
Occupancy by Ownership in Middleburg
Of the total 320 dwellings in Middleburg, owner-occupied units account for 203 (63.4%), while renter-occupied units make up 117 (36.6%).
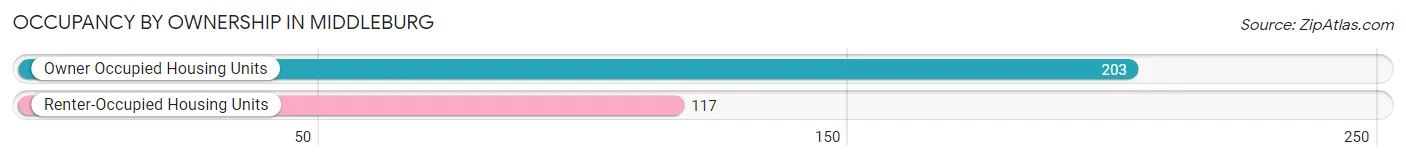
| Occupancy | # Housing Units | % Housing Units |
| Owner Occupied Housing Units | 203 | 63.4% |
| Renter-Occupied Housing Units | 117 | 36.6% |
| Total Occupied Housing Units | 320 | 100.0% |
Occupancy by Household Size in Middleburg
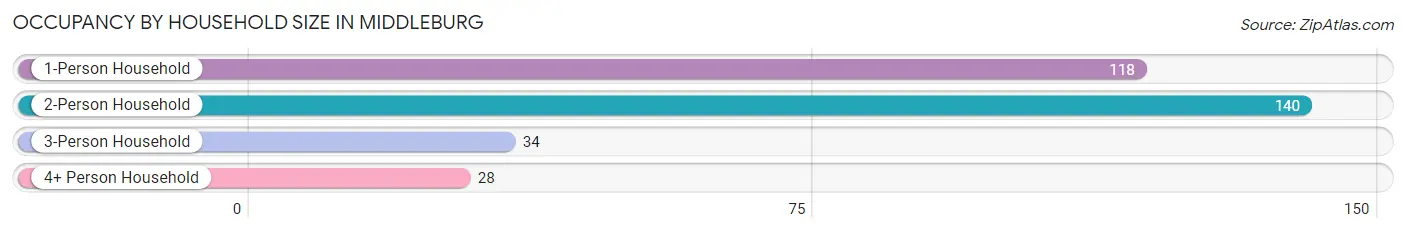
| Household Size | # Housing Units | % Housing Units |
| 1-Person Household | 118 | 36.9% |
| 2-Person Household | 140 | 43.8% |
| 3-Person Household | 34 | 10.6% |
| 4+ Person Household | 28 | 8.7% |
| Total Housing Units | 320 | 100.0% |
Occupancy by Ownership by Household Size in Middleburg
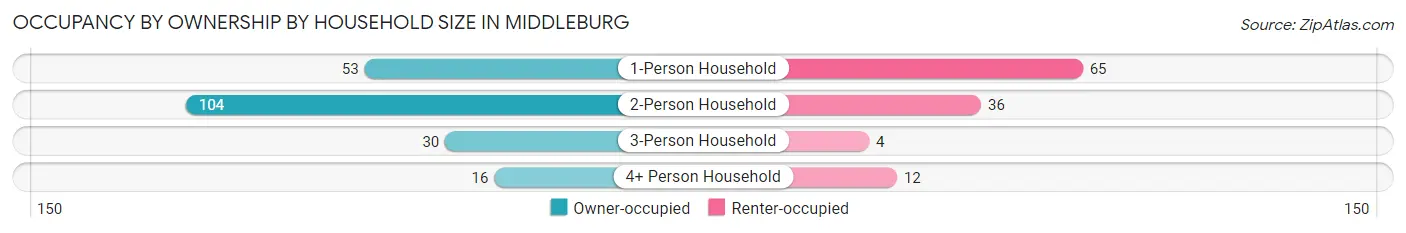
| Household Size | Owner-occupied | Renter-occupied |
| 1-Person Household | 53 (44.9%) | 65 (55.1%) |
| 2-Person Household | 104 (74.3%) | 36 (25.7%) |
| 3-Person Household | 30 (88.2%) | 4 (11.8%) |
| 4+ Person Household | 16 (57.1%) | 12 (42.9%) |
| Total Housing Units | 203 (63.4%) | 117 (36.6%) |
Occupancy by Educational Attainment in Middleburg
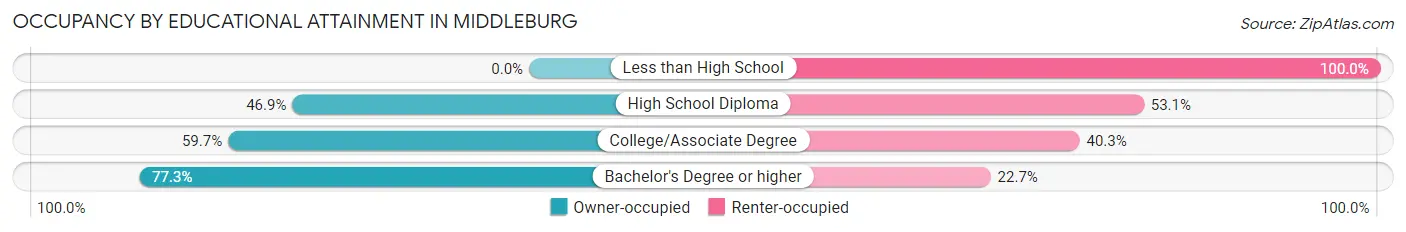
| Household Size | Owner-occupied | Renter-occupied |
| Less than High School | 0 (0.0%) | 24 (100.0%) |
| High School Diploma | 23 (46.9%) | 26 (53.1%) |
| College/Associate Degree | 37 (59.7%) | 25 (40.3%) |
| Bachelor's Degree or higher | 143 (77.3%) | 42 (22.7%) |
Occupancy by Age of Householder in Middleburg
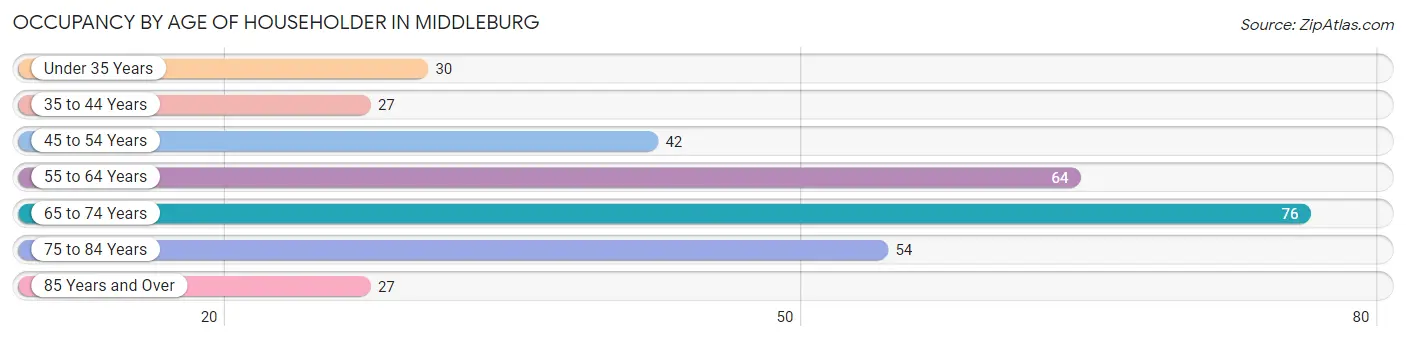
| Age Bracket | # Households | % Households |
| Under 35 Years | 30 | 9.4% |
| 35 to 44 Years | 27 | 8.4% |
| 45 to 54 Years | 42 | 13.1% |
| 55 to 64 Years | 64 | 20.0% |
| 65 to 74 Years | 76 | 23.7% |
| 75 to 84 Years | 54 | 16.9% |
| 85 Years and Over | 27 | 8.4% |
| Total | 320 | 100.0% |
Housing Finances in Middleburg
Median Income by Occupancy in Middleburg
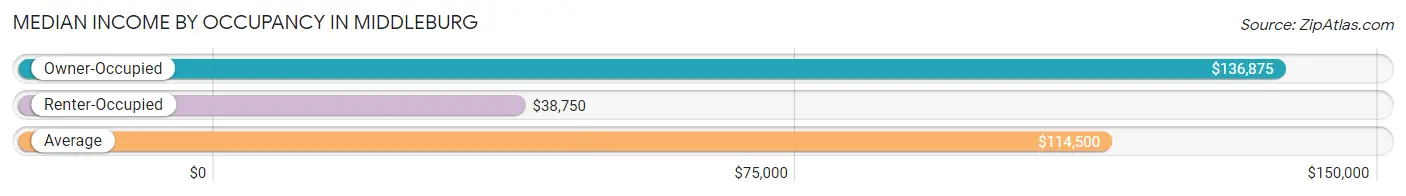
| Occupancy Type | # Households | Median Income |
| Owner-Occupied | 203 (63.4%) | $136,875 |
| Renter-Occupied | 117 (36.6%) | $38,750 |
| Average | 320 (100.0%) | $114,500 |
Occupancy by Householder Income Bracket in Middleburg
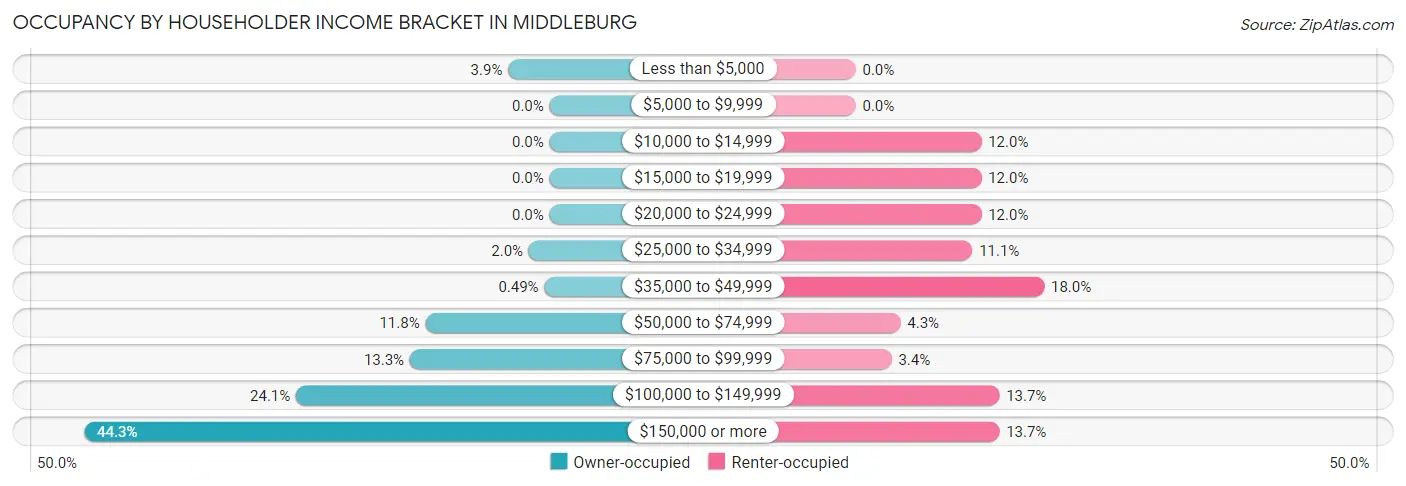
| Income Bracket | Owner-occupied | Renter-occupied |
| Less than $5,000 | 8 (3.9%) | 0 (0.0%) |
| $5,000 to $9,999 | 0 (0.0%) | 0 (0.0%) |
| $10,000 to $14,999 | 0 (0.0%) | 14 (12.0%) |
| $15,000 to $19,999 | 0 (0.0%) | 14 (12.0%) |
| $20,000 to $24,999 | 0 (0.0%) | 14 (12.0%) |
| $25,000 to $34,999 | 4 (2.0%) | 13 (11.1%) |
| $35,000 to $49,999 | 1 (0.5%) | 21 (17.9%) |
| $50,000 to $74,999 | 24 (11.8%) | 5 (4.3%) |
| $75,000 to $99,999 | 27 (13.3%) | 4 (3.4%) |
| $100,000 to $149,999 | 49 (24.1%) | 16 (13.7%) |
| $150,000 or more | 90 (44.3%) | 16 (13.7%) |
| Total | 203 (100.0%) | 117 (100.0%) |
Monthly Housing Cost Tiers in Middleburg
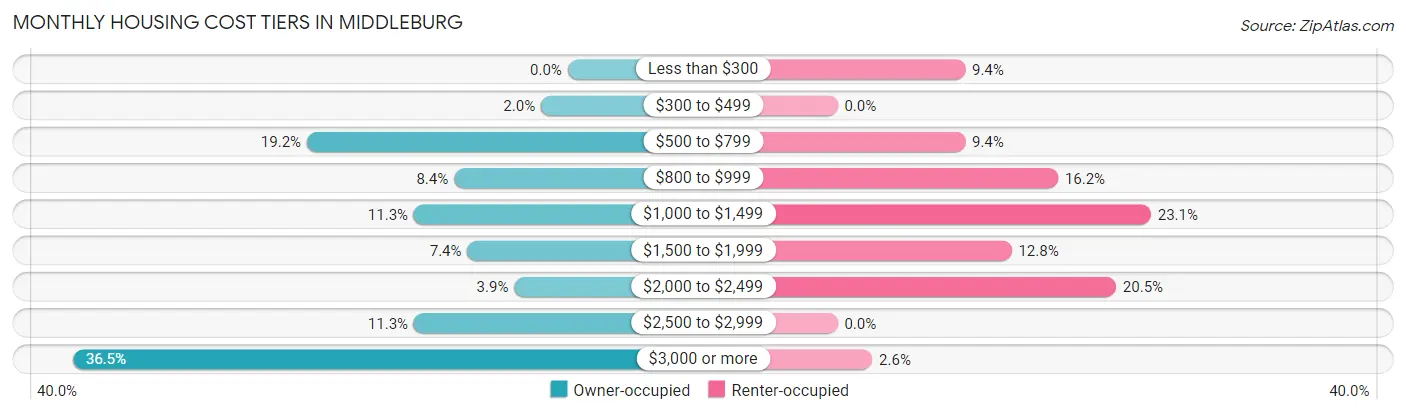
| Monthly Cost | Owner-occupied | Renter-occupied |
| Less than $300 | 0 (0.0%) | 11 (9.4%) |
| $300 to $499 | 4 (2.0%) | 0 (0.0%) |
| $500 to $799 | 39 (19.2%) | 11 (9.4%) |
| $800 to $999 | 17 (8.4%) | 19 (16.2%) |
| $1,000 to $1,499 | 23 (11.3%) | 27 (23.1%) |
| $1,500 to $1,999 | 15 (7.4%) | 15 (12.8%) |
| $2,000 to $2,499 | 8 (3.9%) | 24 (20.5%) |
| $2,500 to $2,999 | 23 (11.3%) | 0 (0.0%) |
| $3,000 or more | 74 (36.4%) | 3 (2.6%) |
| Total | 203 (100.0%) | 117 (100.0%) |
Physical Housing Characteristics in Middleburg
Housing Structures in Middleburg
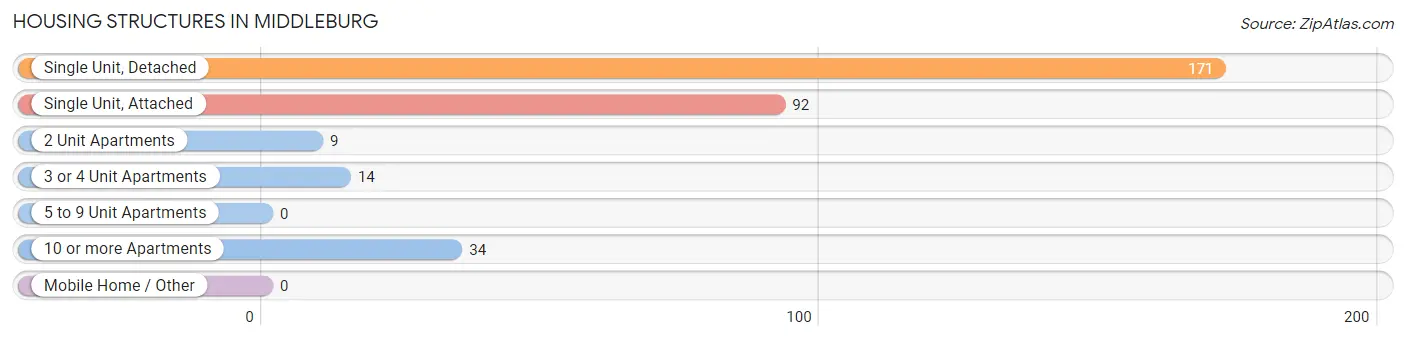
| Structure Type | # Housing Units | % Housing Units |
| Single Unit, Detached | 171 | 53.4% |
| Single Unit, Attached | 92 | 28.7% |
| 2 Unit Apartments | 9 | 2.8% |
| 3 or 4 Unit Apartments | 14 | 4.4% |
| 5 to 9 Unit Apartments | 0 | 0.0% |
| 10 or more Apartments | 34 | 10.6% |
| Mobile Home / Other | 0 | 0.0% |
| Total | 320 | 100.0% |
Housing Structures by Occupancy in Middleburg
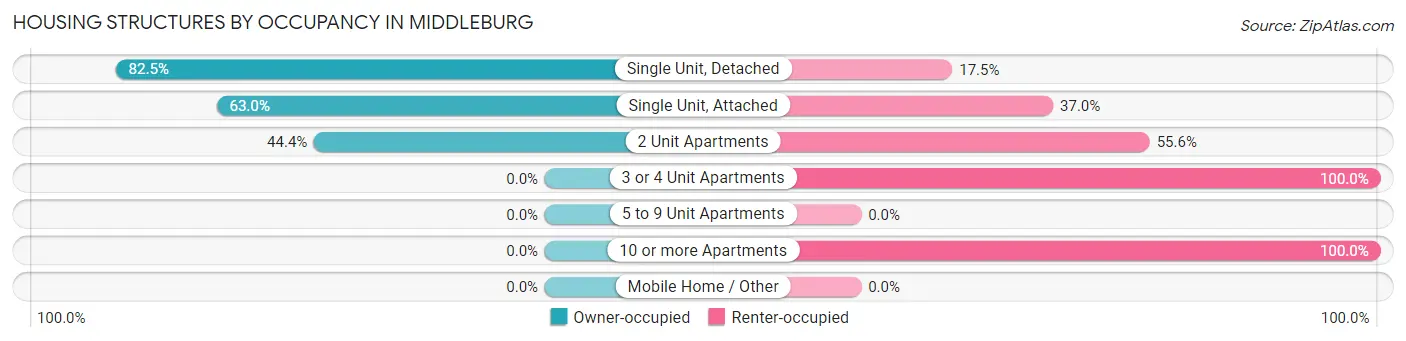
| Structure Type | Owner-occupied | Renter-occupied |
| Single Unit, Detached | 141 (82.5%) | 30 (17.5%) |
| Single Unit, Attached | 58 (63.0%) | 34 (37.0%) |
| 2 Unit Apartments | 4 (44.4%) | 5 (55.6%) |
| 3 or 4 Unit Apartments | 0 (0.0%) | 14 (100.0%) |
| 5 to 9 Unit Apartments | 0 (0.0%) | 0 (0.0%) |
| 10 or more Apartments | 0 (0.0%) | 34 (100.0%) |
| Mobile Home / Other | 0 (0.0%) | 0 (0.0%) |
| Total | 203 (63.4%) | 117 (36.6%) |
Housing Structures by Number of Rooms in Middleburg
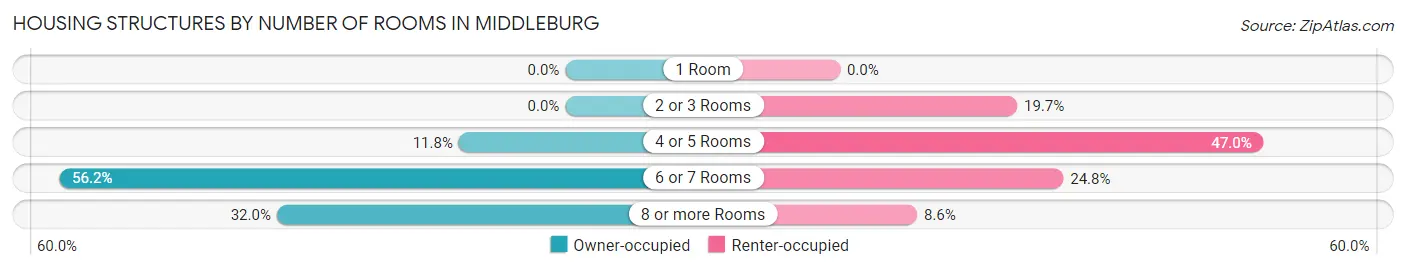
| Number of Rooms | Owner-occupied | Renter-occupied |
| 1 Room | 0 (0.0%) | 0 (0.0%) |
| 2 or 3 Rooms | 0 (0.0%) | 23 (19.7%) |
| 4 or 5 Rooms | 24 (11.8%) | 55 (47.0%) |
| 6 or 7 Rooms | 114 (56.2%) | 29 (24.8%) |
| 8 or more Rooms | 65 (32.0%) | 10 (8.6%) |
| Total | 203 (100.0%) | 117 (100.0%) |
Housing Structure by Heating Type in Middleburg
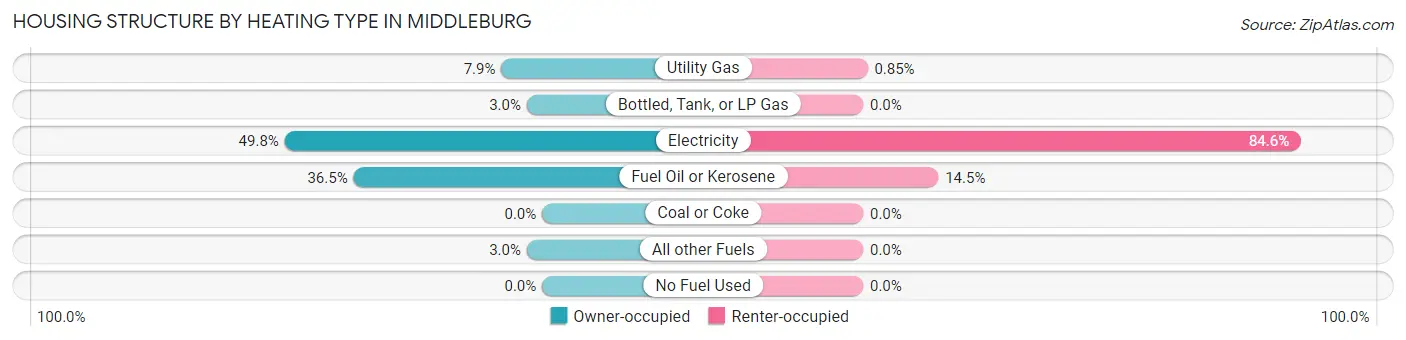
| Heating Type | Owner-occupied | Renter-occupied |
| Utility Gas | 16 (7.9%) | 1 (0.9%) |
| Bottled, Tank, or LP Gas | 6 (3.0%) | 0 (0.0%) |
| Electricity | 101 (49.7%) | 99 (84.6%) |
| Fuel Oil or Kerosene | 74 (36.4%) | 17 (14.5%) |
| Coal or Coke | 0 (0.0%) | 0 (0.0%) |
| All other Fuels | 6 (3.0%) | 0 (0.0%) |
| No Fuel Used | 0 (0.0%) | 0 (0.0%) |
| Total | 203 (100.0%) | 117 (100.0%) |
Household Vehicle Usage in Middleburg
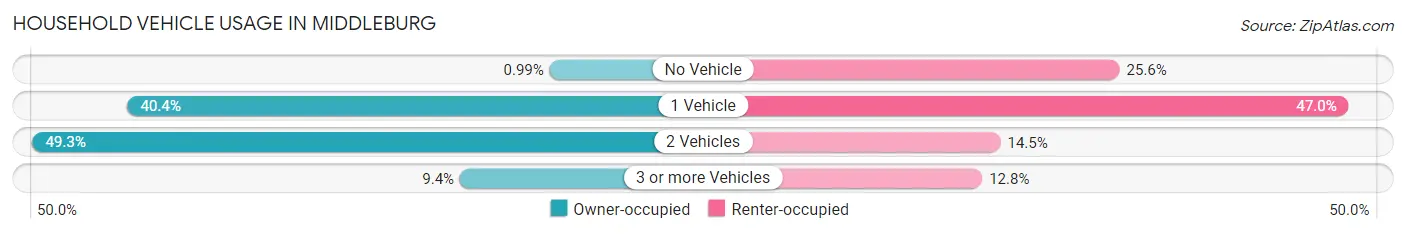
| Vehicles per Household | Owner-occupied | Renter-occupied |
| No Vehicle | 2 (1.0%) | 30 (25.6%) |
| 1 Vehicle | 82 (40.4%) | 55 (47.0%) |
| 2 Vehicles | 100 (49.3%) | 17 (14.5%) |
| 3 or more Vehicles | 19 (9.4%) | 15 (12.8%) |
| Total | 203 (100.0%) | 117 (100.0%) |
Real Estate & Mortgages in Middleburg
Real Estate and Mortgage Overview in Middleburg
| Characteristic | Without Mortgage | With Mortgage |
| Housing Units | 91 | 112 |
| Median Property Value | $673,600 | $655,400 |
| Median Household Income | $88,750 | $66 |
| Monthly Housing Costs | $823 | $74 |
| Real Estate Taxes | $6,549 | $0 |
Property Value by Mortgage Status in Middleburg
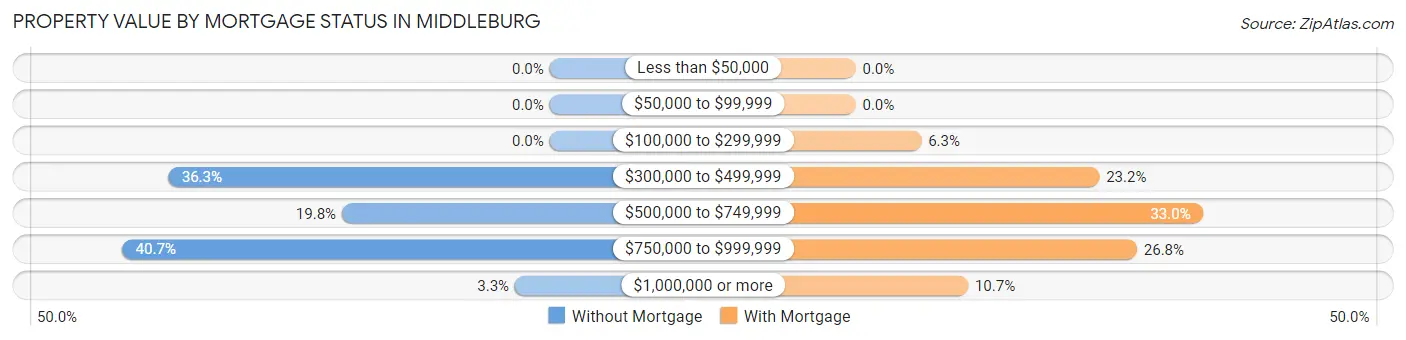
| Property Value | Without Mortgage | With Mortgage |
| Less than $50,000 | 0 (0.0%) | 0 (0.0%) |
| $50,000 to $99,999 | 0 (0.0%) | 0 (0.0%) |
| $100,000 to $299,999 | 0 (0.0%) | 7 (6.2%) |
| $300,000 to $499,999 | 33 (36.3%) | 26 (23.2%) |
| $500,000 to $749,999 | 18 (19.8%) | 37 (33.0%) |
| $750,000 to $999,999 | 37 (40.7%) | 30 (26.8%) |
| $1,000,000 or more | 3 (3.3%) | 12 (10.7%) |
| Total | 91 (100.0%) | 112 (100.0%) |
Household Income by Mortgage Status in Middleburg
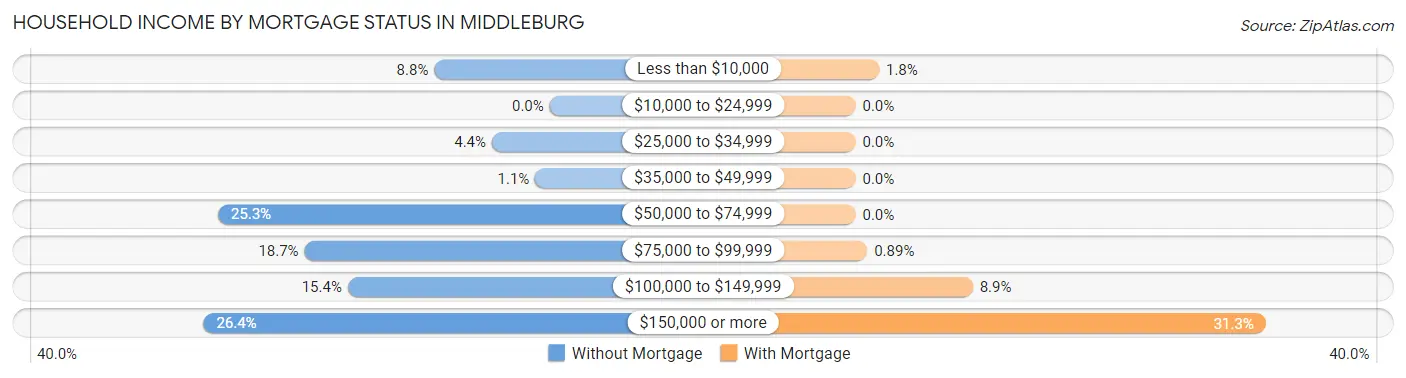
| Household Income | Without Mortgage | With Mortgage |
| Less than $10,000 | 8 (8.8%) | 2 (1.8%) |
| $10,000 to $24,999 | 0 (0.0%) | 0 (0.0%) |
| $25,000 to $34,999 | 4 (4.4%) | 0 (0.0%) |
| $35,000 to $49,999 | 1 (1.1%) | 0 (0.0%) |
| $50,000 to $74,999 | 23 (25.3%) | 0 (0.0%) |
| $75,000 to $99,999 | 17 (18.7%) | 1 (0.9%) |
| $100,000 to $149,999 | 14 (15.4%) | 10 (8.9%) |
| $150,000 or more | 24 (26.4%) | 35 (31.2%) |
| Total | 91 (100.0%) | 112 (100.0%) |
Property Value to Household Income Ratio in Middleburg
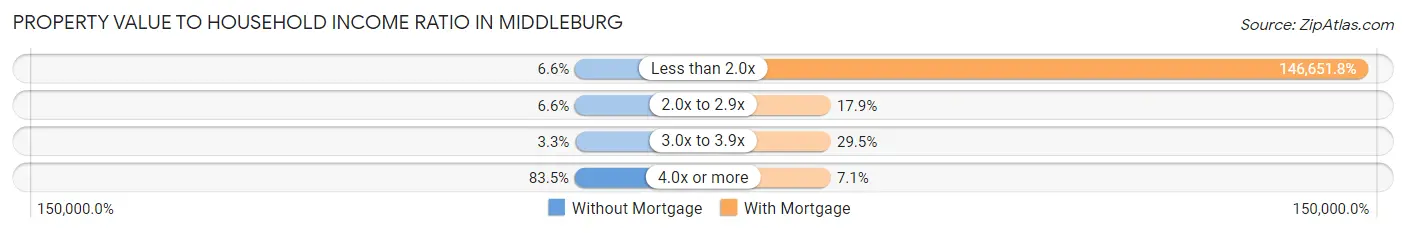
| Value-to-Income Ratio | Without Mortgage | With Mortgage |
| Less than 2.0x | 6 (6.6%) | 164,250 (146,651.8%) |
| 2.0x to 2.9x | 6 (6.6%) | 20 (17.9%) |
| 3.0x to 3.9x | 3 (3.3%) | 33 (29.5%) |
| 4.0x or more | 76 (83.5%) | 8 (7.1%) |
| Total | 91 (100.0%) | 112 (100.0%) |
Real Estate Taxes by Mortgage Status in Middleburg
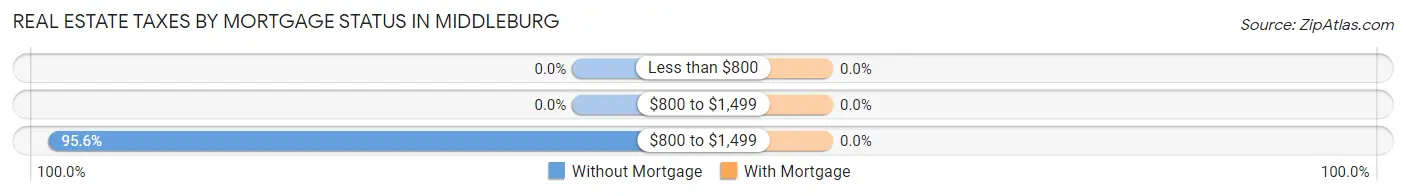
| Property Taxes | Without Mortgage | With Mortgage |
| Less than $800 | 0 (0.0%) | 0 (0.0%) |
| $800 to $1,499 | 0 (0.0%) | 0 (0.0%) |
| $800 to $1,499 | 87 (95.6%) | 0 (0.0%) |
| Total | 91 (100.0%) | 112 (100.0%) |
Health & Disability in Middleburg
Health Insurance Coverage by Age in Middleburg
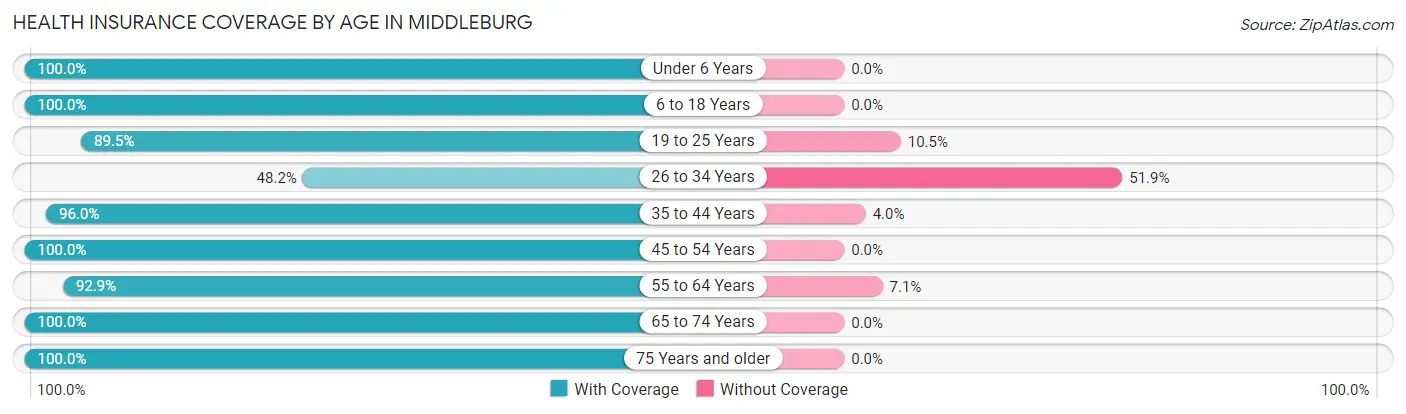
| Age Bracket | With Coverage | Without Coverage |
| Under 6 Years | 19 (100.0%) | 0 (0.0%) |
| 6 to 18 Years | 98 (100.0%) | 0 (0.0%) |
| 19 to 25 Years | 51 (89.5%) | 6 (10.5%) |
| 26 to 34 Years | 13 (48.1%) | 14 (51.8%) |
| 35 to 44 Years | 48 (96.0%) | 2 (4.0%) |
| 45 to 54 Years | 78 (100.0%) | 0 (0.0%) |
| 55 to 64 Years | 91 (92.9%) | 7 (7.1%) |
| 65 to 74 Years | 97 (100.0%) | 0 (0.0%) |
| 75 Years and older | 119 (100.0%) | 0 (0.0%) |
| Total | 614 (95.5%) | 29 (4.5%) |
Health Insurance Coverage by Citizenship Status in Middleburg
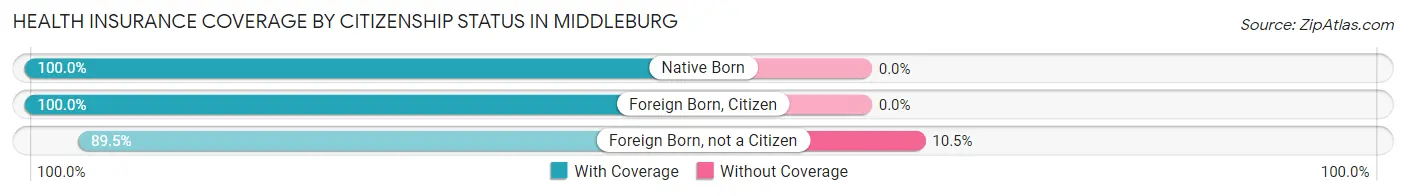
| Citizenship Status | With Coverage | Without Coverage |
| Native Born | 19 (100.0%) | 0 (0.0%) |
| Foreign Born, Citizen | 98 (100.0%) | 0 (0.0%) |
| Foreign Born, not a Citizen | 51 (89.5%) | 6 (10.5%) |
Health Insurance Coverage by Household Income in Middleburg
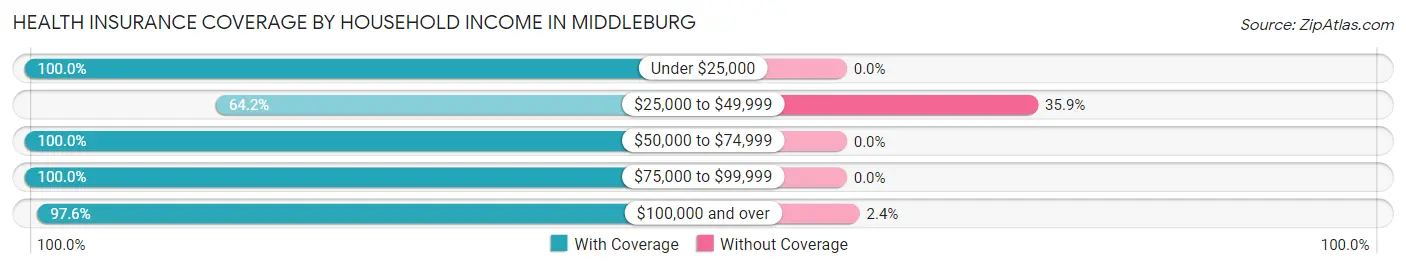
| Household Income | With Coverage | Without Coverage |
| Under $25,000 | 66 (100.0%) | 0 (0.0%) |
| $25,000 to $49,999 | 34 (64.1%) | 19 (35.8%) |
| $50,000 to $74,999 | 44 (100.0%) | 0 (0.0%) |
| $75,000 to $99,999 | 63 (100.0%) | 0 (0.0%) |
| $100,000 and over | 407 (97.6%) | 10 (2.4%) |
Public vs Private Health Insurance Coverage by Age in Middleburg
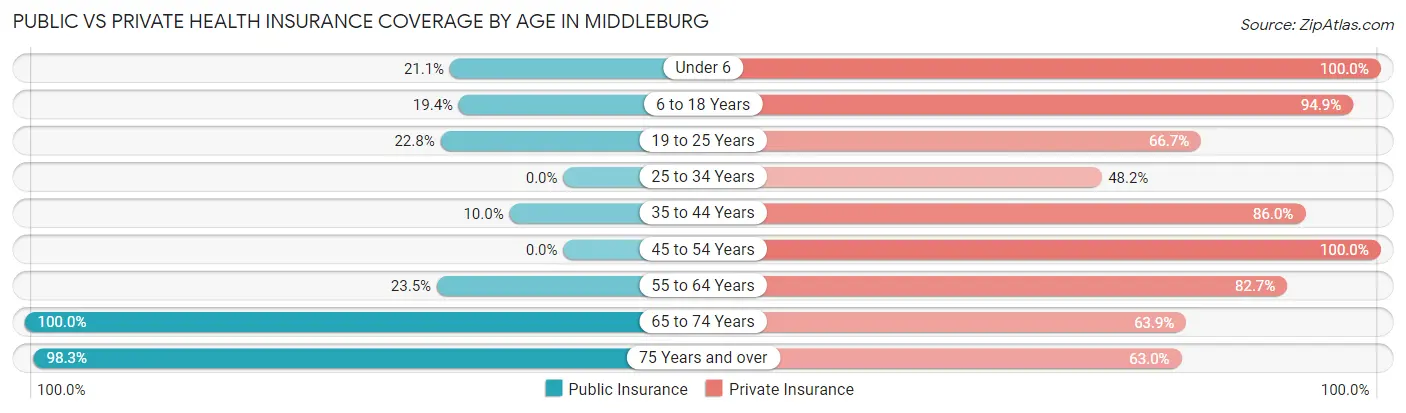
| Age Bracket | Public Insurance | Private Insurance |
| Under 6 | 4 (21.0%) | 19 (100.0%) |
| 6 to 18 Years | 19 (19.4%) | 93 (94.9%) |
| 19 to 25 Years | 13 (22.8%) | 38 (66.7%) |
| 25 to 34 Years | 0 (0.0%) | 13 (48.1%) |
| 35 to 44 Years | 5 (10.0%) | 43 (86.0%) |
| 45 to 54 Years | 0 (0.0%) | 78 (100.0%) |
| 55 to 64 Years | 23 (23.5%) | 81 (82.7%) |
| 65 to 74 Years | 97 (100.0%) | 62 (63.9%) |
| 75 Years and over | 117 (98.3%) | 75 (63.0%) |
| Total | 278 (43.2%) | 502 (78.1%) |
Disability Status by Sex by Age in Middleburg
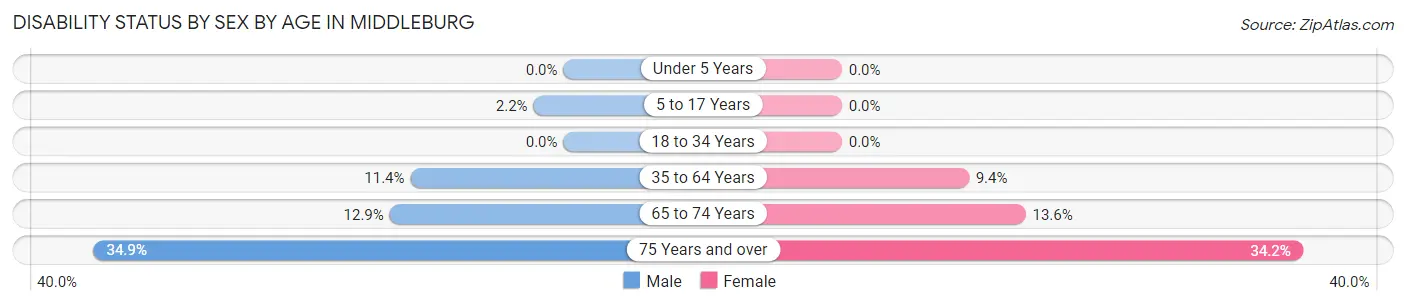
| Age Bracket | Male | Female |
| Under 5 Years | 0 (0.0%) | 0 (0.0%) |
| 5 to 17 Years | 1 (2.2%) | 0 (0.0%) |
| 18 to 34 Years | 0 (0.0%) | 0 (0.0%) |
| 35 to 64 Years | 10 (11.4%) | 13 (9.4%) |
| 65 to 74 Years | 4 (12.9%) | 9 (13.6%) |
| 75 Years and over | 15 (34.9%) | 26 (34.2%) |
Disability Class by Sex by Age in Middleburg
Disability Class: Hearing Difficulty
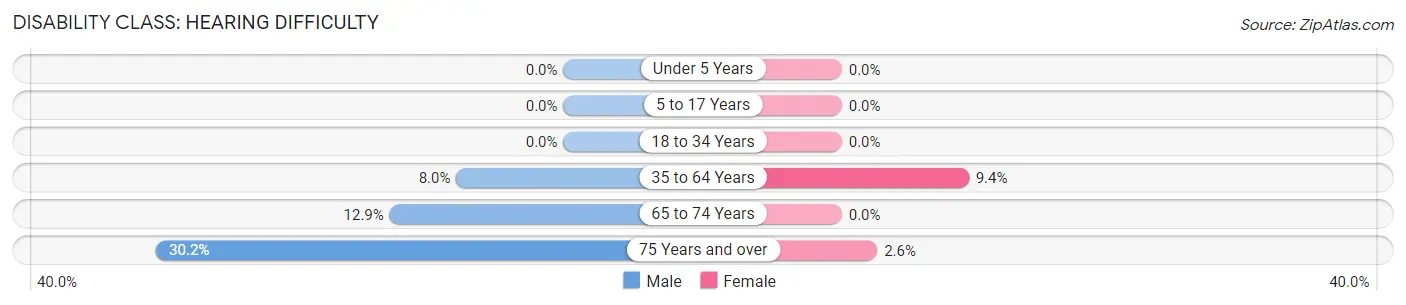
| Age Bracket | Male | Female |
| Under 5 Years | 0 (0.0%) | 0 (0.0%) |
| 5 to 17 Years | 0 (0.0%) | 0 (0.0%) |
| 18 to 34 Years | 0 (0.0%) | 0 (0.0%) |
| 35 to 64 Years | 7 (8.0%) | 13 (9.4%) |
| 65 to 74 Years | 4 (12.9%) | 0 (0.0%) |
| 75 Years and over | 13 (30.2%) | 2 (2.6%) |
Disability Class: Vision Difficulty
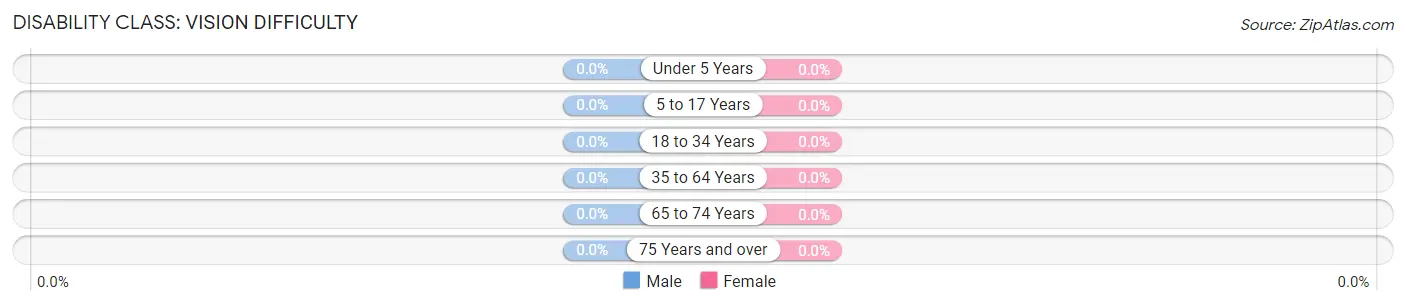
| Age Bracket | Male | Female |
| Under 5 Years | 0 (0.0%) | 0 (0.0%) |
| 5 to 17 Years | 0 (0.0%) | 0 (0.0%) |
| 18 to 34 Years | 0 (0.0%) | 0 (0.0%) |
| 35 to 64 Years | 0 (0.0%) | 0 (0.0%) |
| 65 to 74 Years | 0 (0.0%) | 0 (0.0%) |
| 75 Years and over | 0 (0.0%) | 0 (0.0%) |
Disability Class: Cognitive Difficulty
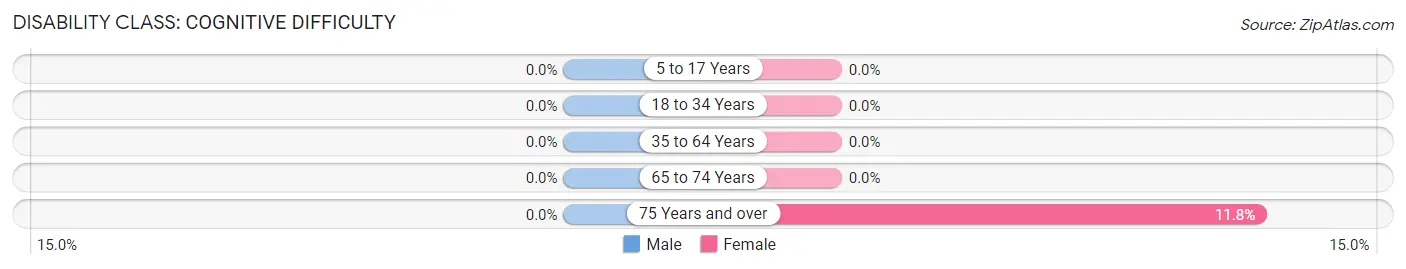
| Age Bracket | Male | Female |
| 5 to 17 Years | 0 (0.0%) | 0 (0.0%) |
| 18 to 34 Years | 0 (0.0%) | 0 (0.0%) |
| 35 to 64 Years | 0 (0.0%) | 0 (0.0%) |
| 65 to 74 Years | 0 (0.0%) | 0 (0.0%) |
| 75 Years and over | 0 (0.0%) | 9 (11.8%) |
Disability Class: Ambulatory Difficulty
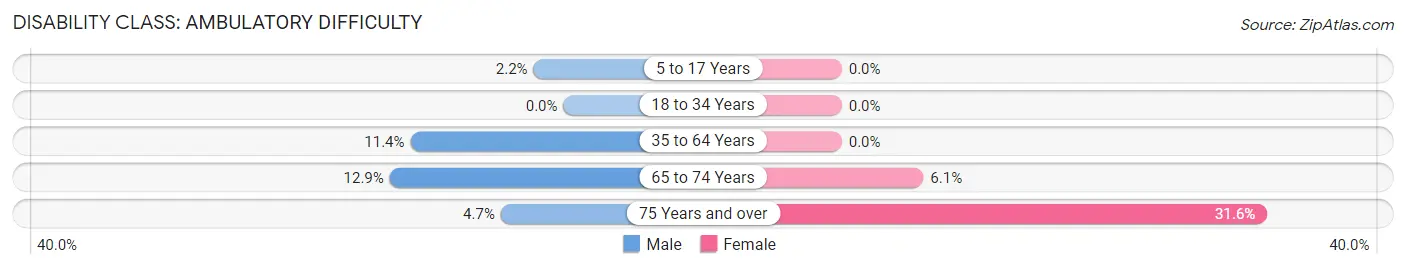
| Age Bracket | Male | Female |
| 5 to 17 Years | 1 (2.2%) | 0 (0.0%) |
| 18 to 34 Years | 0 (0.0%) | 0 (0.0%) |
| 35 to 64 Years | 10 (11.4%) | 0 (0.0%) |
| 65 to 74 Years | 4 (12.9%) | 4 (6.1%) |
| 75 Years and over | 2 (4.6%) | 24 (31.6%) |
Disability Class: Self-Care Difficulty
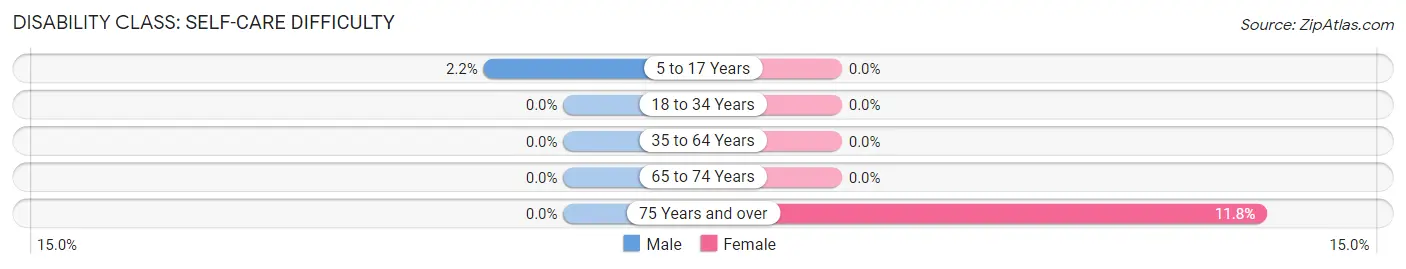
| Age Bracket | Male | Female |
| 5 to 17 Years | 1 (2.2%) | 0 (0.0%) |
| 18 to 34 Years | 0 (0.0%) | 0 (0.0%) |
| 35 to 64 Years | 0 (0.0%) | 0 (0.0%) |
| 65 to 74 Years | 0 (0.0%) | 0 (0.0%) |
| 75 Years and over | 0 (0.0%) | 9 (11.8%) |
Technology Access in Middleburg
Computing Device Access in Middleburg
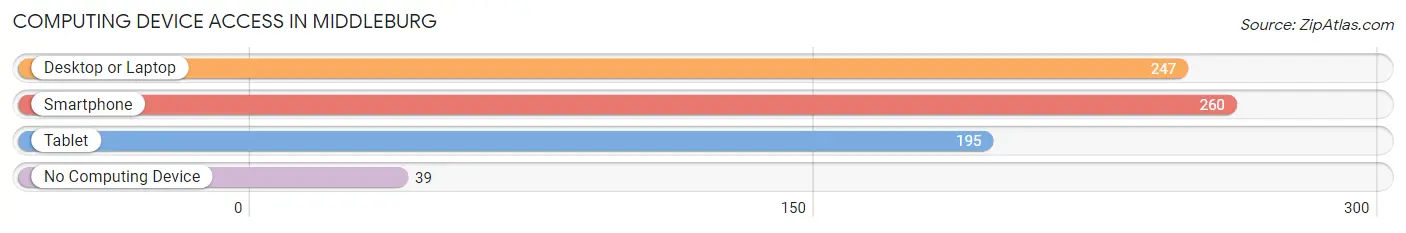
| Device Type | # Households | % Households |
| Desktop or Laptop | 247 | 77.2% |
| Smartphone | 260 | 81.2% |
| Tablet | 195 | 60.9% |
| No Computing Device | 39 | 12.2% |
| Total | 320 | 100.0% |
Internet Access in Middleburg
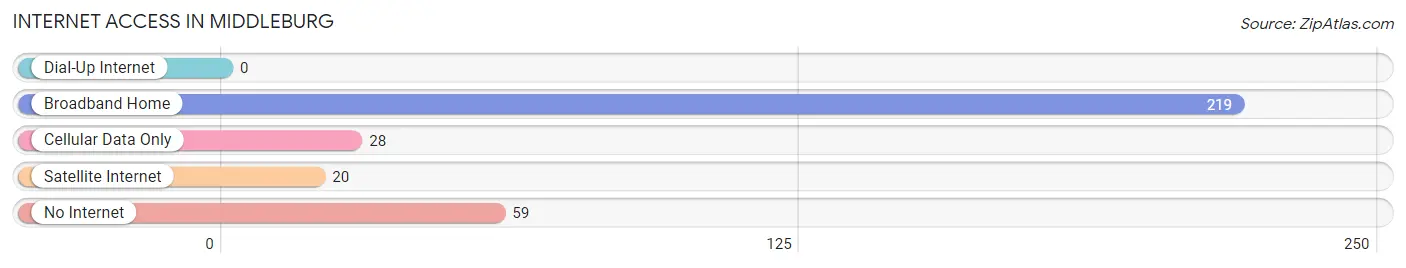
| Internet Type | # Households | % Households |
| Dial-Up Internet | 0 | 0.0% |
| Broadband Home | 219 | 68.4% |
| Cellular Data Only | 28 | 8.7% |
| Satellite Internet | 20 | 6.2% |
| No Internet | 59 | 18.4% |
| Total | 320 | 100.0% |
Middleburg Summary
Middleburg, Virginia is a small town located in the heart of Loudoun County, Virginia. It is situated in the foothills of the Blue Ridge Mountains, approximately 30 miles west of Washington, D.C. The town is known for its historic charm, equestrian culture, and picturesque landscape.
History
Middleburg was founded in 1787 by American Revolutionary War veteran and land speculator, Joseph Chinn. Chinn purchased the land from Lord Fairfax and named the town after his wife, Mary. The town was officially incorporated in 1836.
Middleburg quickly became a popular destination for wealthy planters and merchants from the Tidewater region. The town was known for its many taverns, inns, and stores. It was also a popular stop for stagecoaches traveling between Alexandria and Winchester.
During the Civil War, Middleburg was the site of several skirmishes between Union and Confederate forces. The town was also the site of the Battle of Middleburg, which took place on June 17, 1863. The battle resulted in a Confederate victory.
In the late 19th century, Middleburg became a popular destination for wealthy Washingtonians looking to escape the city. The town was known for its many luxurious estates and horse farms. It was also home to several prominent figures, including President James Monroe and General Robert E. Lee.
Geography
Middleburg is located in the Piedmont region of Virginia. The town is situated in the foothills of the Blue Ridge Mountains, approximately 30 miles west of Washington, D.C. The town is bordered by the towns of Aldie, Upperville, and The Plains.
The town is situated on the banks of the Goose Creek, a tributary of the Potomac River. The town is also home to several small lakes, including Lake Manassas and Lake Braddock.
The climate in Middleburg is temperate, with hot summers and cold winters. The average annual temperature is 54 degrees Fahrenheit. The average annual precipitation is 40 inches.
Economy
The economy of Middleburg is largely based on tourism and equestrian activities. The town is home to several horse farms and equestrian centers, which attract visitors from all over the world.
The town is also home to several wineries, breweries, and distilleries. These businesses attract visitors from all over the region.
The town is also home to several small businesses, including antique stores, art galleries, and restaurants.
Demographics
As of the 2010 census, the population of Middleburg was 637. The racial makeup of the town was 94.3% White, 2.2% African American, 0.2% Native American, 0.9% Asian, and 2.4% from other races.
The median household income in Middleburg was $90,000, and the median family income was $103,000. The per capita income was $45,000.
The town is home to several private schools, including Foxcroft School, a prestigious all-girls boarding school. The town is also home to several churches, including St. Stephen’s Episcopal Church and Middleburg United Methodist Church.
Common Questions
What is Per Capita Income in Middleburg?
Per Capita income in Middleburg is $66,723.
What is the Median Family Income in Middleburg?
Median Family Income in Middleburg is $136,250.
What is the Median Household income in Middleburg?
Median Household Income in Middleburg is $114,500.
What is Income or Wage Gap in Middleburg?
Income or Wage Gap in Middleburg is 37.5%.
Women in Middleburg earn 62.5 cents for every dollar earned by a man.
What is Inequality or Gini Index in Middleburg?
Inequality or Gini Index in Middleburg is 0.45.
What is the Total Population of Middleburg?
Total Population of Middleburg is 643.
What is the Total Male Population of Middleburg?
Total Male Population of Middleburg is 271.
What is the Total Female Population of Middleburg?
Total Female Population of Middleburg is 372.
What is the Ratio of Males per 100 Females in Middleburg?
There are 72.85 Males per 100 Females in Middleburg.
What is the Ratio of Females per 100 Males in Middleburg?
There are 137.27 Females per 100 Males in Middleburg.
What is the Median Population Age in Middleburg?
Median Population Age in Middleburg is 54.5 Years.
What is the Average Family Size in Middleburg
Average Family Size in Middleburg is 2.5 People.
What is the Average Household Size in Middleburg
Average Household Size in Middleburg is 2.0 People.
How Large is the Labor Force in Middleburg?
There are 331 People in the Labor Forcein in Middleburg.
What is the Percentage of People in the Labor Force in Middleburg?
59.9% of People are in the Labor Force in Middleburg.
What is the Unemployment Rate in Middleburg?
Unemployment Rate in Middleburg is 6.9%.