Nellysford, VA Map & Demographics
Nellysford Map
Nellysford Overview
$75,348
PER CAPITA INCOME
$139,375
AVG FAMILY INCOME
$126,250
AVG HOUSEHOLD INCOME
$10,520
FAMILY INCOME DEFICIT
0.47
INEQUALITY / GINI INDEX
1,396
TOTAL POPULATION
777
MALE POPULATION
619
FEMALE POPULATION
125.53
MALES / 100 FEMALES
79.67
FEMALES / 100 MALES
65.1
MEDIAN AGE
2.2
AVG FAMILY SIZE
1.9
AVG HOUSEHOLD SIZE
436
LABOR FORCE [ PEOPLE ]
33.7%
PERCENT IN LABOR FORCE
Nellysford Zip Codes
Nellysford Area Codes
Income in Nellysford
Income Overview in Nellysford
Per Capita Income in Nellysford is $75,348, while median incomes of families and households are $139,375 and $126,250 respectively.
| Characteristic | Number | Measure |
| Per Capita Income | 1,396 | $75,348 |
| Median Family Income | 555 | $139,375 |
| Mean Family Income | 555 | $161,986 |
| Median Household Income | 723 | $126,250 |
| Mean Household Income | 723 | $147,610 |
| Income Deficit | 555 | $10,520 |
| Wage / Income Gap (%) | 1,396 | 0.00% |
| Wage / Income Gap ($) | 1,396 | 100.00¢ per $1 |
| Gini / Inequality Index | 1,396 | 0.47 |
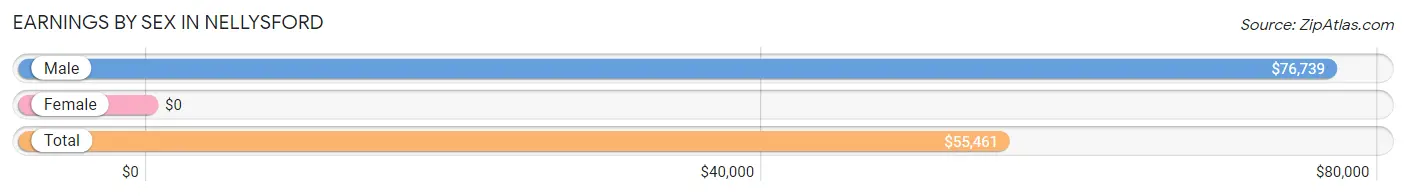
Earnings by Sex in Nellysford
| Sex | Number | Average Earnings |
| Male | 308 (60.8%) | $76,739 |
| Female | 199 (39.3%) | $0 |
| Total | 507 (100.0%) | $55,461 |
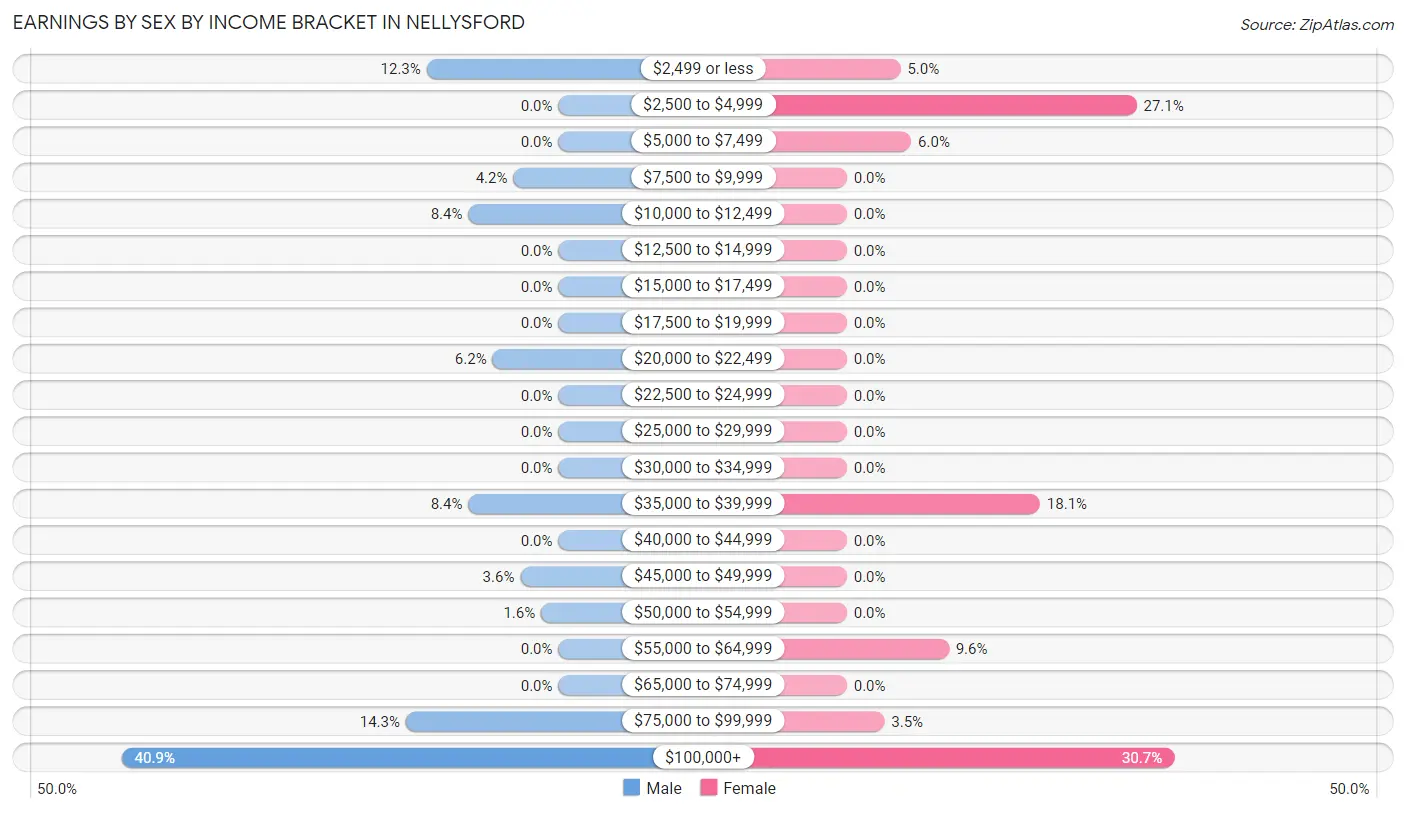
Earnings by Sex by Income Bracket in Nellysford
The most common earnings brackets in Nellysford are $100,000+ for men (126 | 40.9%) and $100,000+ for women (61 | 30.6%).
| Income | Male | Female |
| $2,499 or less | 38 (12.3%) | 10 (5.0%) |
| $2,500 to $4,999 | 0 (0.0%) | 54 (27.1%) |
| $5,000 to $7,499 | 0 (0.0%) | 12 (6.0%) |
| $7,500 to $9,999 | 13 (4.2%) | 0 (0.0%) |
| $10,000 to $12,499 | 26 (8.4%) | 0 (0.0%) |
| $12,500 to $14,999 | 0 (0.0%) | 0 (0.0%) |
| $15,000 to $17,499 | 0 (0.0%) | 0 (0.0%) |
| $17,500 to $19,999 | 0 (0.0%) | 0 (0.0%) |
| $20,000 to $22,499 | 19 (6.2%) | 0 (0.0%) |
| $22,500 to $24,999 | 0 (0.0%) | 0 (0.0%) |
| $25,000 to $29,999 | 0 (0.0%) | 0 (0.0%) |
| $30,000 to $34,999 | 0 (0.0%) | 0 (0.0%) |
| $35,000 to $39,999 | 26 (8.4%) | 36 (18.1%) |
| $40,000 to $44,999 | 0 (0.0%) | 0 (0.0%) |
| $45,000 to $49,999 | 11 (3.6%) | 0 (0.0%) |
| $50,000 to $54,999 | 5 (1.6%) | 0 (0.0%) |
| $55,000 to $64,999 | 0 (0.0%) | 19 (9.6%) |
| $65,000 to $74,999 | 0 (0.0%) | 0 (0.0%) |
| $75,000 to $99,999 | 44 (14.3%) | 7 (3.5%) |
| $100,000+ | 126 (40.9%) | 61 (30.6%) |
| Total | 308 (100.0%) | 199 (100.0%) |
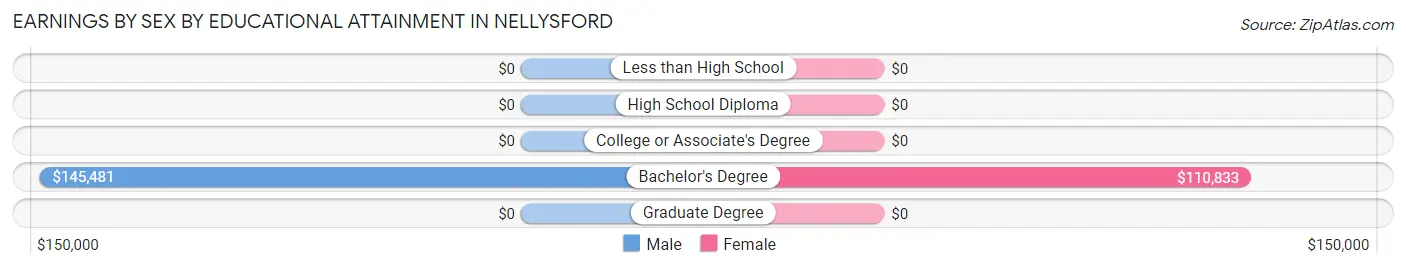
Earnings by Sex by Educational Attainment in Nellysford
| Educational Attainment | Male Income | Female Income |
| Less than High School | - | - |
| High School Diploma | - | - |
| College or Associate's Degree | - | - |
| Bachelor's Degree | $145,481 | $110,833 |
| Graduate Degree | - | - |
| Total | $77,446 | $0 |
Family Income in Nellysford
Family Income Brackets in Nellysford
According to the Nellysford family income data, there are 144 families falling into the $200,000+ income range, which is the most common income bracket and makes up 26.0% of all families.
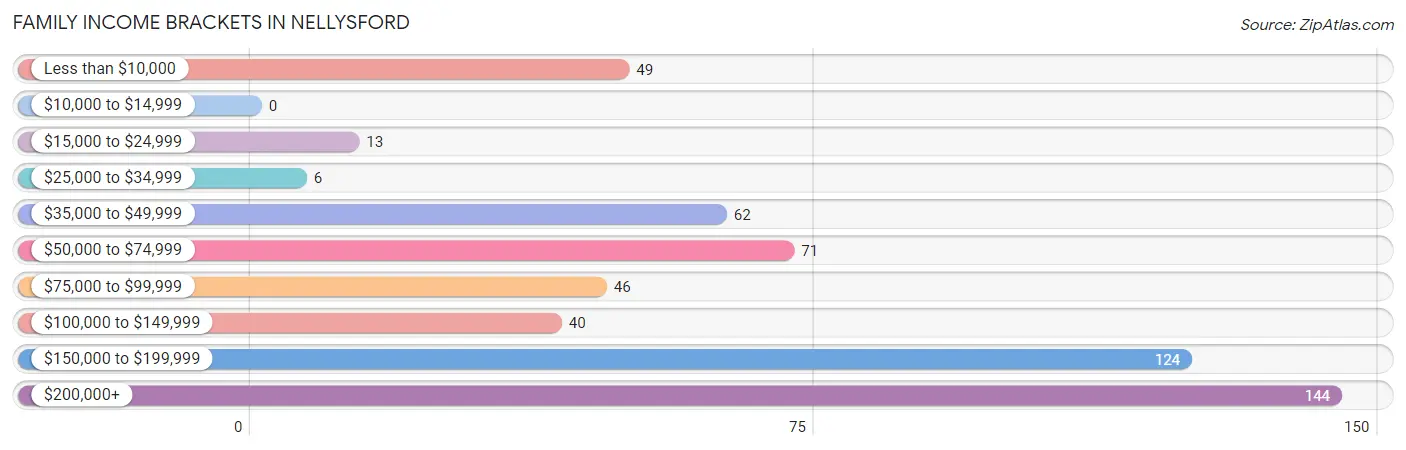
| Income Bracket | # Families | % Families |
| Less than $10,000 | 49 | 8.8% |
| $10,000 to $14,999 | 0 | 0.0% |
| $15,000 to $24,999 | 13 | 2.3% |
| $25,000 to $34,999 | 6 | 1.1% |
| $35,000 to $49,999 | 62 | 11.2% |
| $50,000 to $74,999 | 71 | 12.8% |
| $75,000 to $99,999 | 46 | 8.3% |
| $100,000 to $149,999 | 40 | 7.2% |
| $150,000 to $199,999 | 124 | 22.3% |
| $200,000+ | 144 | 25.9% |
Family Income by Famaliy Size in Nellysford
3-person families (76 | 13.7%) account for the highest median family income in Nellysford with $199,038 per family, while 3-person families (76 | 13.7%) have the highest median income of $66,346 per family member.
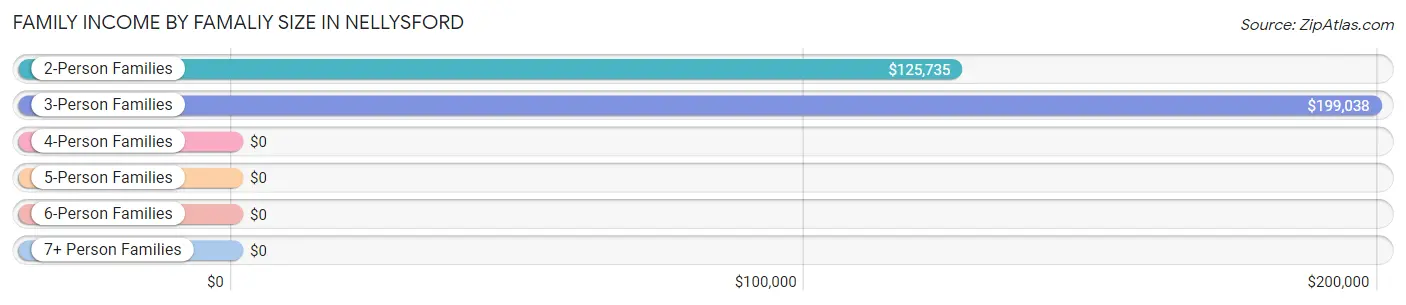
| Income Bracket | # Families | Median Income |
| 2-Person Families | 444 (80.0%) | $125,735 |
| 3-Person Families | 76 (13.7%) | $199,038 |
| 4-Person Families | 0 (0.0%) | $0 |
| 5-Person Families | 5 (0.9%) | $0 |
| 6-Person Families | 0 (0.0%) | $0 |
| 7+ Person Families | 30 (5.4%) | $0 |
| Total | 555 (100.0%) | $139,375 |
Family Income by Number of Earners in Nellysford
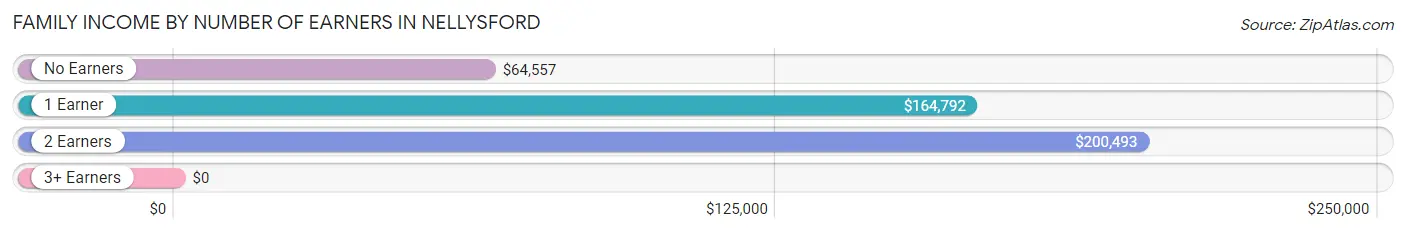
| Number of Earners | # Families | Median Income |
| No Earners | 251 (45.2%) | $64,557 |
| 1 Earner | 128 (23.1%) | $164,792 |
| 2 Earners | 171 (30.8%) | $200,493 |
| 3+ Earners | 5 (0.9%) | $0 |
| Total | 555 (100.0%) | $139,375 |
Household Income in Nellysford
Household Income Brackets in Nellysford
With 161 households falling in the category, the $150,000 to $199,999 income range is the most frequent in Nellysford, accounting for 22.3% of all households. In contrast, only 6 households (0.8%) fall into the $25,000 to $34,999 income bracket, making it the least populous group.
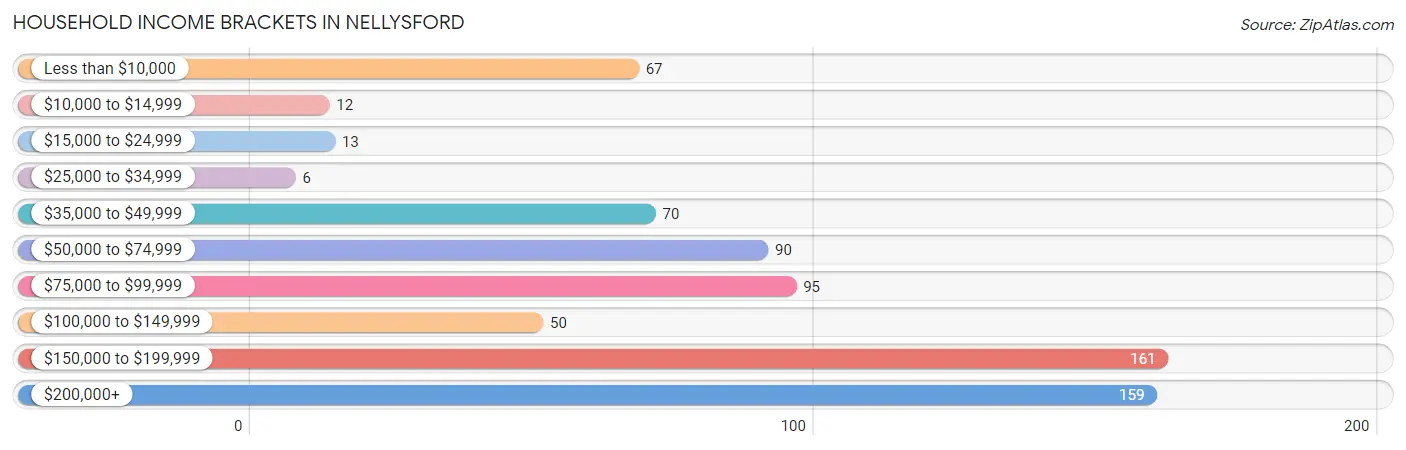
| Income Bracket | # Households | % Households |
| Less than $10,000 | 67 | 9.3% |
| $10,000 to $14,999 | 12 | 1.7% |
| $15,000 to $24,999 | 13 | 1.8% |
| $25,000 to $34,999 | 6 | 0.8% |
| $35,000 to $49,999 | 70 | 9.7% |
| $50,000 to $74,999 | 90 | 12.4% |
| $75,000 to $99,999 | 95 | 13.1% |
| $100,000 to $149,999 | 50 | 6.9% |
| $150,000 to $199,999 | 161 | 22.3% |
| $200,000+ | 159 | 22.0% |
Household Income by Householder Age in Nellysford
The median household income in Nellysford is $126,250, with the highest median household income of $163,229 found in the 45 to 64 years age bracket for the primary householder. A total of 275 households (38.0%) fall into this category. Meanwhile, the 15 to 24 years age bracket for the primary householder has the lowest median household income of $0, with 13 households (1.8%) in this group.
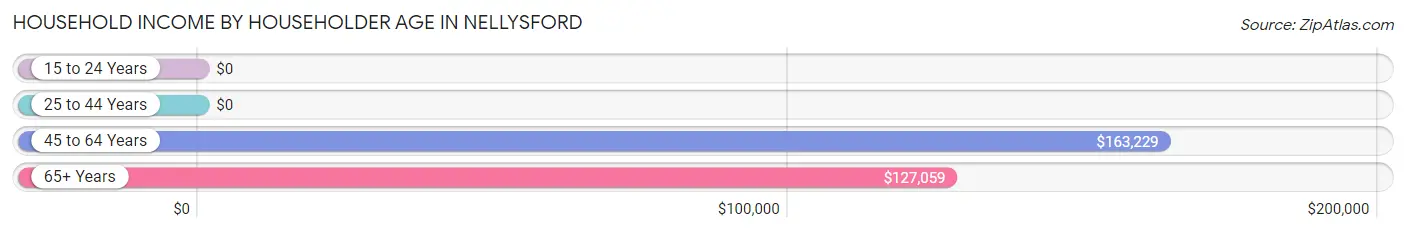
| Income Bracket | # Households | Median Income |
| 15 to 24 Years | 13 (1.8%) | $0 |
| 25 to 44 Years | 35 (4.8%) | $0 |
| 45 to 64 Years | 275 (38.0%) | $163,229 |
| 65+ Years | 400 (55.3%) | $127,059 |
| Total | 723 (100.0%) | $126,250 |
Poverty in Nellysford
Income Below Poverty by Sex and Age in Nellysford
With 20.8% poverty level for males and 17.8% for females among the residents of Nellysford, under 5 year old males and under 5 year old females are the most vulnerable to poverty, with 27 males (100.0%) and 14 females (100.0%) in their respective age groups living below the poverty level.
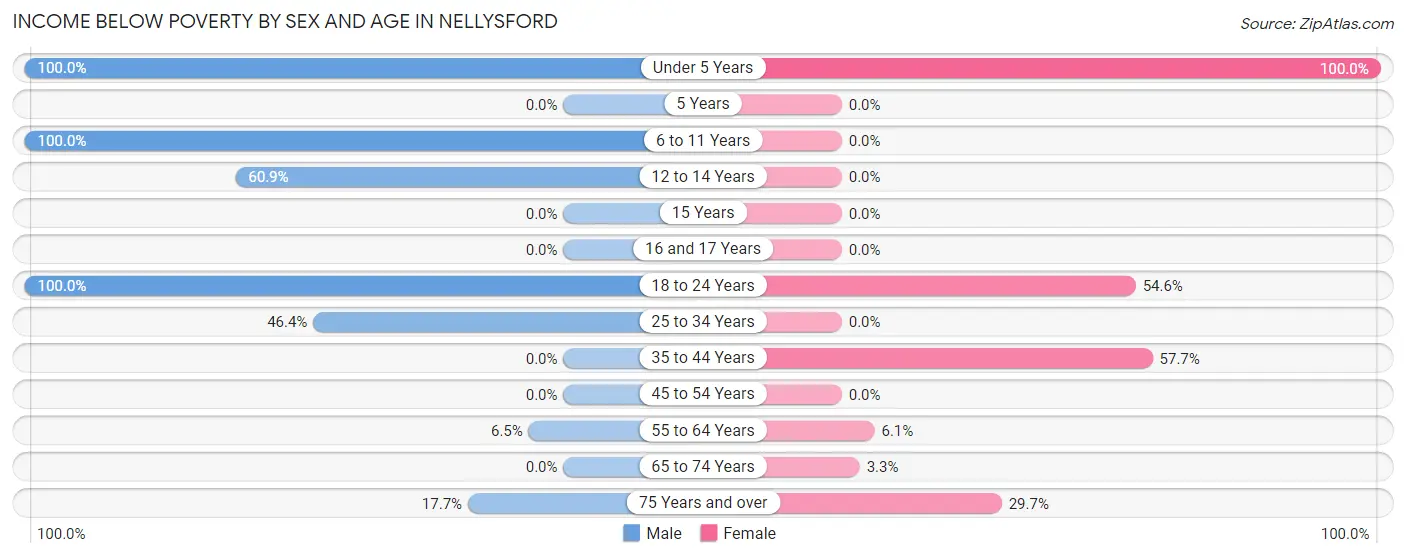
| Age Bracket | Male | Female |
| Under 5 Years | 27 (100.0%) | 14 (100.0%) |
| 5 Years | 0 (0.0%) | 0 (0.0%) |
| 6 to 11 Years | 28 (100.0%) | 0 (0.0%) |
| 12 to 14 Years | 14 (60.9%) | 0 (0.0%) |
| 15 Years | 0 (0.0%) | 0 (0.0%) |
| 16 and 17 Years | 0 (0.0%) | 0 (0.0%) |
| 18 to 24 Years | 13 (100.0%) | 12 (54.5%) |
| 25 to 34 Years | 26 (46.4%) | 0 (0.0%) |
| 35 to 44 Years | 0 (0.0%) | 30 (57.7%) |
| 45 to 54 Years | 0 (0.0%) | 0 (0.0%) |
| 55 to 64 Years | 12 (6.5%) | 9 (6.1%) |
| 65 to 74 Years | 0 (0.0%) | 7 (3.3%) |
| 75 Years and over | 42 (17.7%) | 38 (29.7%) |
| Total | 162 (20.8%) | 110 (17.8%) |
Income Above Poverty by Sex and Age in Nellysford
According to the poverty statistics in Nellysford, males aged 35 to 44 years and females aged 6 to 11 years are the age groups that are most secure financially, with 100.0% of males and 100.0% of females in these age groups living above the poverty line.
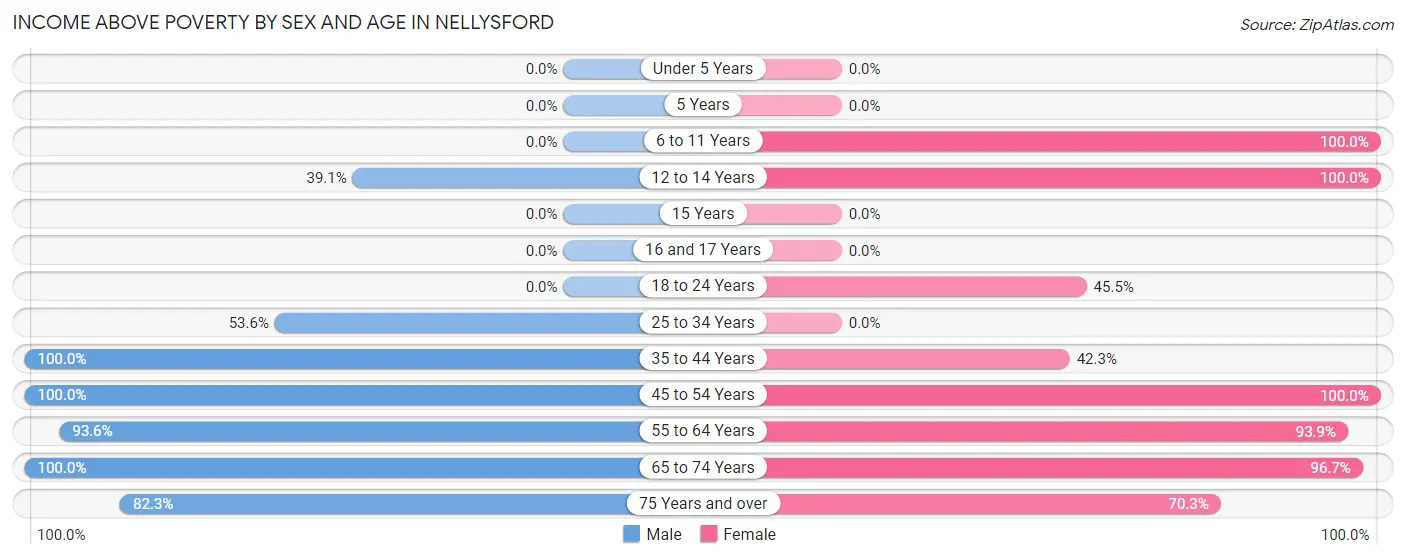
| Age Bracket | Male | Female |
| Under 5 Years | 0 (0.0%) | 0 (0.0%) |
| 5 Years | 0 (0.0%) | 0 (0.0%) |
| 6 to 11 Years | 0 (0.0%) | 5 (100.0%) |
| 12 to 14 Years | 9 (39.1%) | 5 (100.0%) |
| 15 Years | 0 (0.0%) | 0 (0.0%) |
| 16 and 17 Years | 0 (0.0%) | 0 (0.0%) |
| 18 to 24 Years | 0 (0.0%) | 10 (45.5%) |
| 25 to 34 Years | 30 (53.6%) | 0 (0.0%) |
| 35 to 44 Years | 5 (100.0%) | 22 (42.3%) |
| 45 to 54 Years | 76 (100.0%) | 35 (100.0%) |
| 55 to 64 Years | 174 (93.5%) | 139 (93.9%) |
| 65 to 74 Years | 126 (100.0%) | 203 (96.7%) |
| 75 Years and over | 195 (82.3%) | 90 (70.3%) |
| Total | 615 (79.1%) | 509 (82.2%) |
Income Below Poverty Among Married-Couple Families in Nellysford
The poverty statistics for married-couple families in Nellysford show that 17.0% or 92 of the total 542 families live below the poverty line. Families with 5 or more children have the highest poverty rate of 100.0%, comprising of 30 families. On the other hand, families with 1 or 2 children have the lowest poverty rate of 0.0%, which includes 0 families.
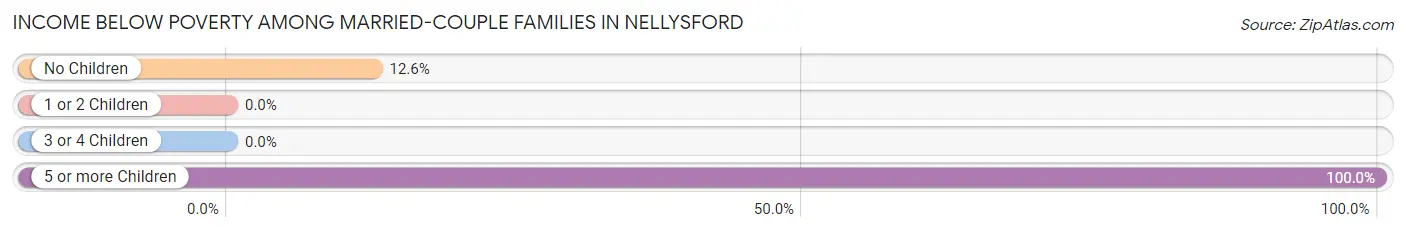
| Children | Above Poverty | Below Poverty |
| No Children | 431 (87.4%) | 62 (12.6%) |
| 1 or 2 Children | 19 (100.0%) | 0 (0.0%) |
| 3 or 4 Children | 0 (0.0%) | 0 (0.0%) |
| 5 or more Children | 0 (0.0%) | 30 (100.0%) |
| Total | 450 (83.0%) | 92 (17.0%) |
Income Below Poverty Among Single-Parent Households in Nellysford
| Children | Single Father | Single Mother |
| No Children | 0 (0.0%) | 0 (0.0%) |
| 1 or 2 Children | 0 (0.0%) | 0 (0.0%) |
| 3 or 4 Children | 0 (0.0%) | 0 (0.0%) |
| 5 or more Children | 0 (0.0%) | 0 (0.0%) |
| Total | 0 (0.0%) | 0 (0.0%) |
Income Below Poverty Among Married-Couple vs Single-Parent Households in Nellysford
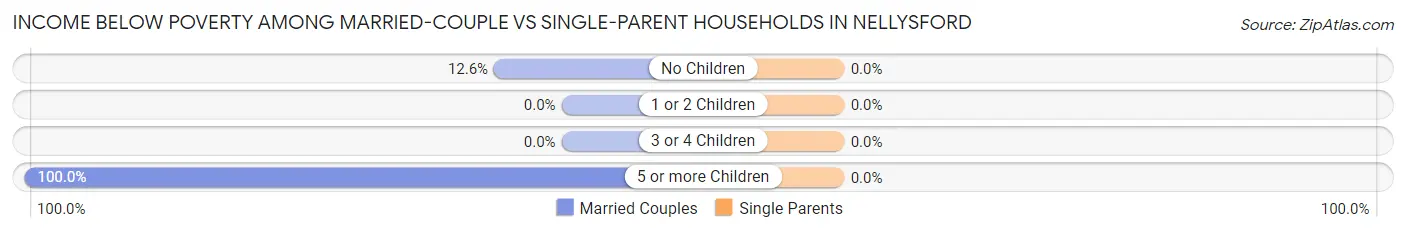
| Children | Married-Couple Families | Single-Parent Households |
| No Children | 62 (12.6%) | 0 (0.0%) |
| 1 or 2 Children | 0 (0.0%) | 0 (0.0%) |
| 3 or 4 Children | 0 (0.0%) | 0 (0.0%) |
| 5 or more Children | 30 (100.0%) | 0 (0.0%) |
| Total | 92 (17.0%) | 0 (0.0%) |
Race in Nellysford
The most populous races in Nellysford are White / Caucasian (1,227 | 87.9%), Two or more Races (169 | 12.1%), and Hispanic or Latino (109 | 7.8%).
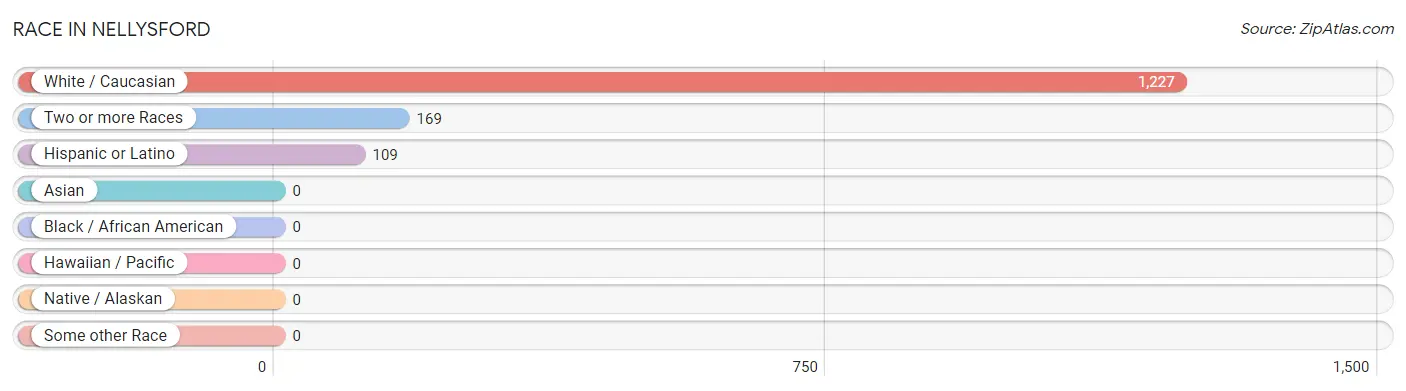
| Race | # Population | % Population |
| Asian | 0 | 0.0% |
| Black / African American | 0 | 0.0% |
| Hawaiian / Pacific | 0 | 0.0% |
| Hispanic or Latino | 109 | 7.8% |
| Native / Alaskan | 0 | 0.0% |
| White / Caucasian | 1,227 | 87.9% |
| Two or more Races | 169 | 12.1% |
| Some other Race | 0 | 0.0% |
| Total | 1,396 | 100.0% |
Ancestry in Nellysford
The most populous ancestries reported in Nellysford are Irish (333 | 23.8%), English (307 | 22.0%), German (275 | 19.7%), Burmese (129 | 9.2%), and Mexican (109 | 7.8%), together accounting for 82.6% of all Nellysford residents.
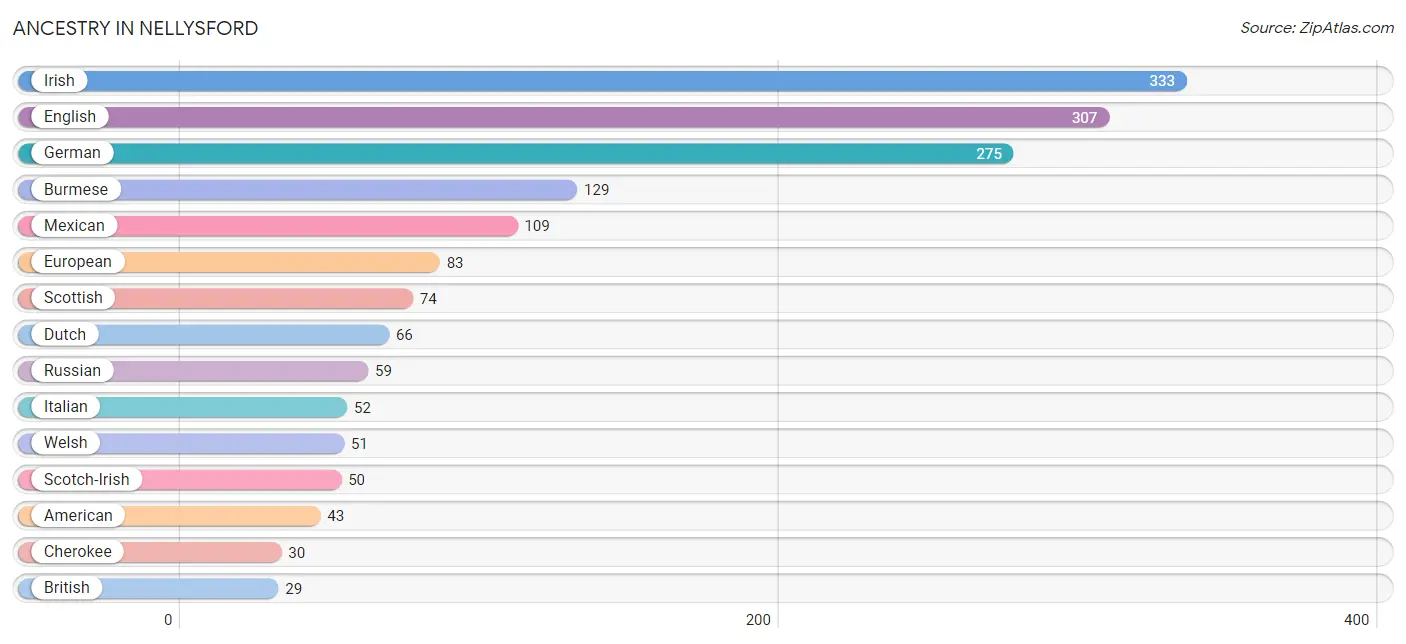
| Ancestry | # Population | % Population |
| American | 43 | 3.1% |
| British | 29 | 2.1% |
| Burmese | 129 | 9.2% |
| Canadian | 11 | 0.8% |
| Cherokee | 30 | 2.1% |
| Dutch | 66 | 4.7% |
| English | 307 | 22.0% |
| European | 83 | 5.9% |
| French | 17 | 1.2% |
| German | 275 | 19.7% |
| Hungarian | 27 | 1.9% |
| Irish | 333 | 23.8% |
| Italian | 52 | 3.7% |
| Mexican | 109 | 7.8% |
| Navajo | 26 | 1.9% |
| Polish | 13 | 0.9% |
| Russian | 59 | 4.2% |
| Scandinavian | 14 | 1.0% |
| Scotch-Irish | 50 | 3.6% |
| Scottish | 74 | 5.3% |
| Serbian | 11 | 0.8% |
| Slovak | 10 | 0.7% |
| Swedish | 10 | 0.7% |
| Swiss | 13 | 0.9% |
| Ukrainian | 10 | 0.7% |
| Welsh | 51 | 3.6% | View All 26 Rows |
Immigrants in Nellysford
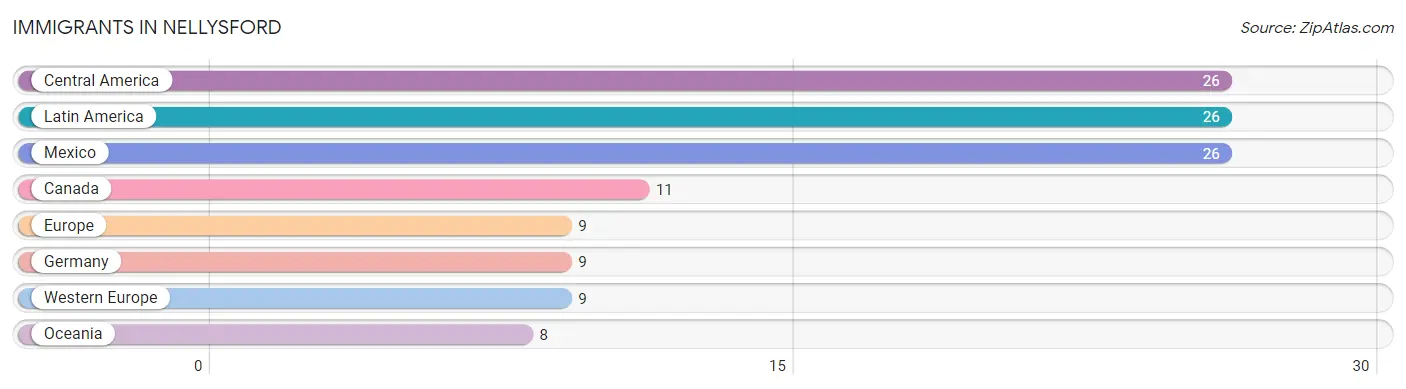
The most numerous immigrant groups reported in Nellysford came from Central America (26 | 1.9%), Latin America (26 | 1.9%), Mexico (26 | 1.9%), Canada (11 | 0.8%), and Europe (9 | 0.6%), together accounting for 7.0% of all Nellysford residents.
| Immigration Origin | # Population | % Population |
| Canada | 11 | 0.8% |
| Central America | 26 | 1.9% |
| Europe | 9 | 0.6% |
| Germany | 9 | 0.6% |
| Latin America | 26 | 1.9% |
| Mexico | 26 | 1.9% |
| Oceania | 8 | 0.6% |
| Western Europe | 9 | 0.6% | View All 8 Rows |
Sex and Age in Nellysford
Sex and Age in Nellysford
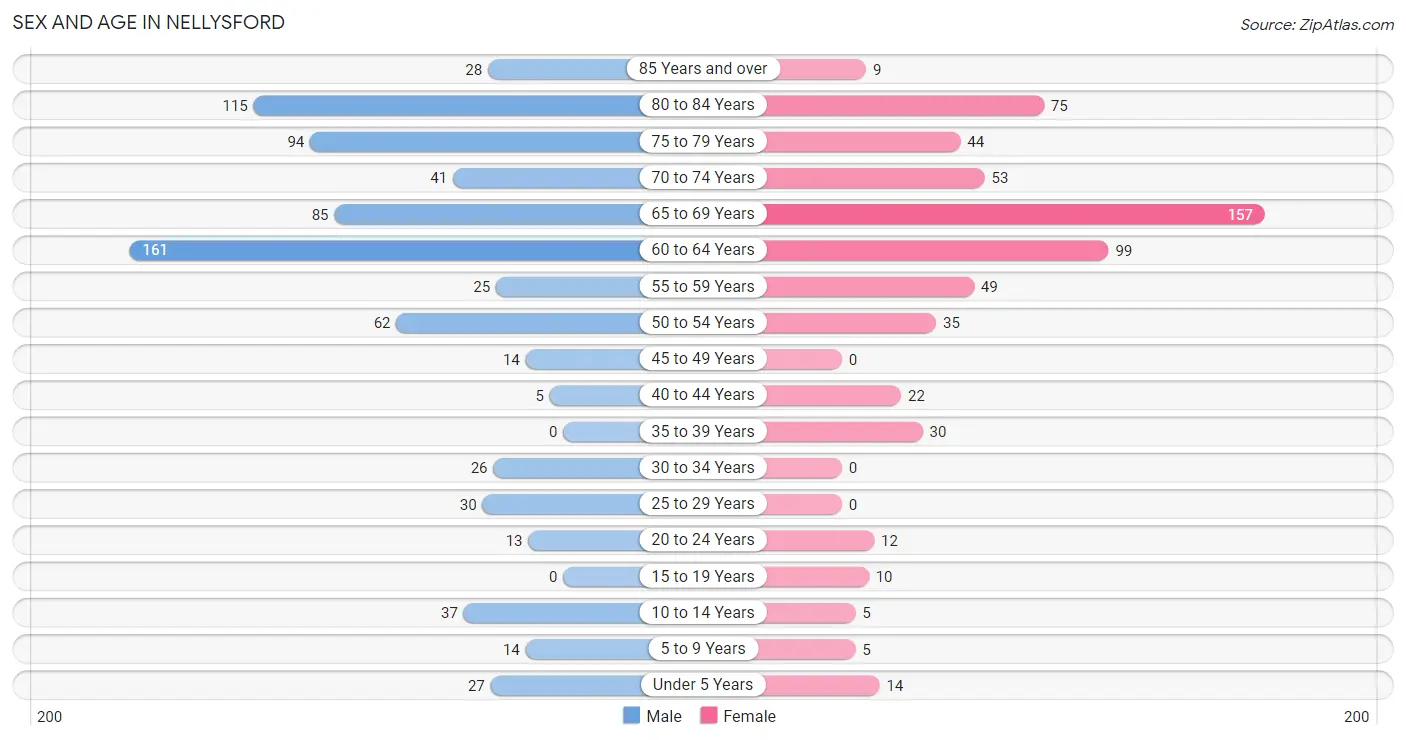
The most populous age groups in Nellysford are 60 to 64 Years (161 | 20.7%) for men and 65 to 69 Years (157 | 25.4%) for women.
| Age Bracket | Male | Female |
| Under 5 Years | 27 (3.5%) | 14 (2.3%) |
| 5 to 9 Years | 14 (1.8%) | 5 (0.8%) |
| 10 to 14 Years | 37 (4.8%) | 5 (0.8%) |
| 15 to 19 Years | 0 (0.0%) | 10 (1.6%) |
| 20 to 24 Years | 13 (1.7%) | 12 (1.9%) |
| 25 to 29 Years | 30 (3.9%) | 0 (0.0%) |
| 30 to 34 Years | 26 (3.4%) | 0 (0.0%) |
| 35 to 39 Years | 0 (0.0%) | 30 (4.9%) |
| 40 to 44 Years | 5 (0.6%) | 22 (3.5%) |
| 45 to 49 Years | 14 (1.8%) | 0 (0.0%) |
| 50 to 54 Years | 62 (8.0%) | 35 (5.7%) |
| 55 to 59 Years | 25 (3.2%) | 49 (7.9%) |
| 60 to 64 Years | 161 (20.7%) | 99 (16.0%) |
| 65 to 69 Years | 85 (10.9%) | 157 (25.4%) |
| 70 to 74 Years | 41 (5.3%) | 53 (8.6%) |
| 75 to 79 Years | 94 (12.1%) | 44 (7.1%) |
| 80 to 84 Years | 115 (14.8%) | 75 (12.1%) |
| 85 Years and over | 28 (3.6%) | 9 (1.5%) |
| Total | 777 (100.0%) | 619 (100.0%) |
Families and Households in Nellysford
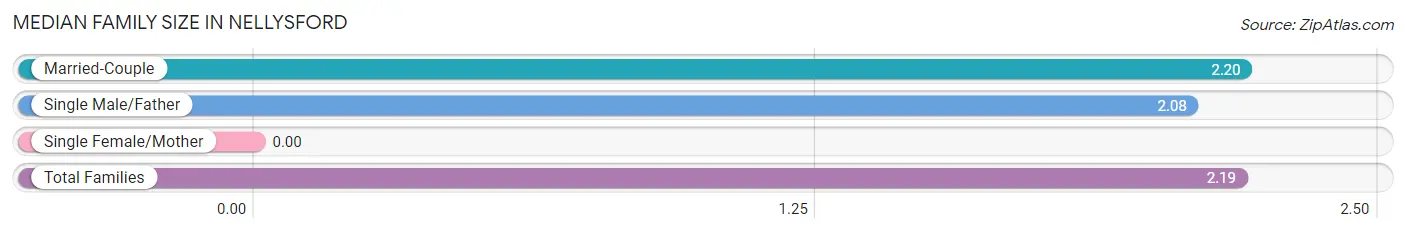
Median Family Size in Nellysford
| Family Type | # Families | Family Size |
| Married-Couple | 542 (97.7%) | 2.20 |
| Single Male/Father | 13 (2.3%) | 2.08 |
| Single Female/Mother | 0 (0.0%) | - |
| Total Families | 555 (100.0%) | 2.19 |
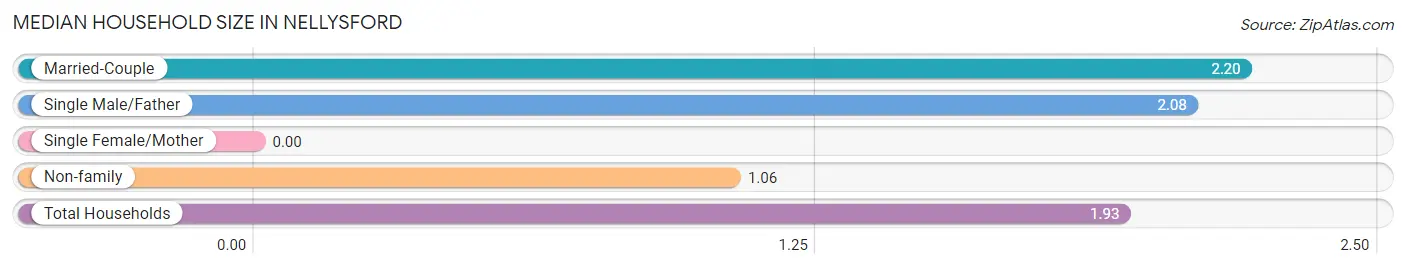
Median Household Size in Nellysford
| Household Type | # Households | Household Size |
| Married-Couple | 542 (75.0%) | 2.20 |
| Single Male/Father | 13 (1.8%) | 2.08 |
| Single Female/Mother | 0 (0.0%) | - |
| Non-family | 168 (23.2%) | 1.06 |
| Total Households | 723 (100.0%) | 1.93 |
Household Size by Marriage Status in Nellysford
Out of a total of 723 households in Nellysford, 555 (76.8%) are family households, while 168 (23.2%) are nonfamily households. The most numerous type of family households are 2-person households, comprising 444, and the most common type of nonfamily households are 1-person households, comprising 163.
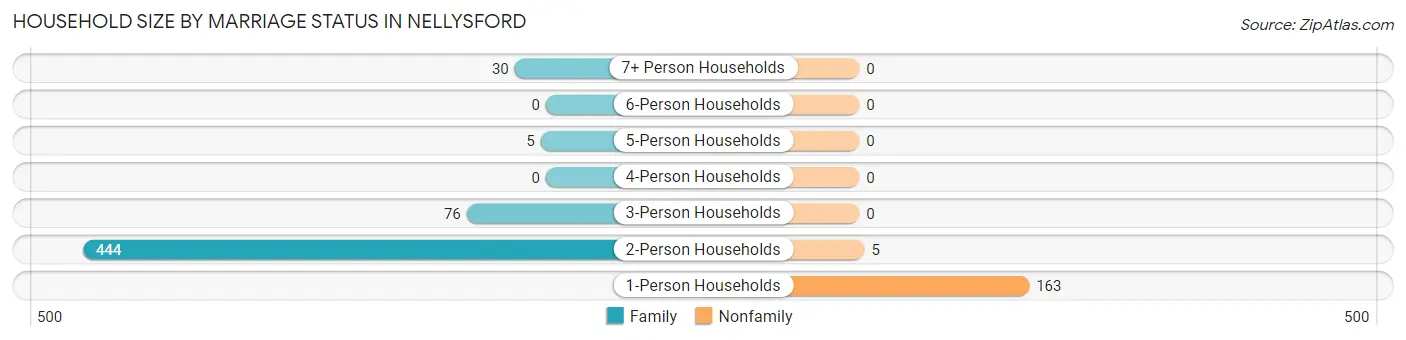
| Household Size | Family Households | Nonfamily Households |
| 1-Person Households | - | 163 (22.5%) |
| 2-Person Households | 444 (61.4%) | 5 (0.7%) |
| 3-Person Households | 76 (10.5%) | 0 (0.0%) |
| 4-Person Households | 0 (0.0%) | 0 (0.0%) |
| 5-Person Households | 5 (0.7%) | 0 (0.0%) |
| 6-Person Households | 0 (0.0%) | 0 (0.0%) |
| 7+ Person Households | 30 (4.2%) | 0 (0.0%) |
| Total | 555 (76.8%) | 168 (23.2%) |
Female Fertility in Nellysford
Fertility by Age in Nellysford
Average fertility rate in Nellysford is 361.0 births per 1,000 women. Women in the age bracket of 35 to 50 years have the highest fertility rate with 492.0 births per 1,000 women. Women in the age bracket of 35 to 50 years acount for 100.0% of all women with births.
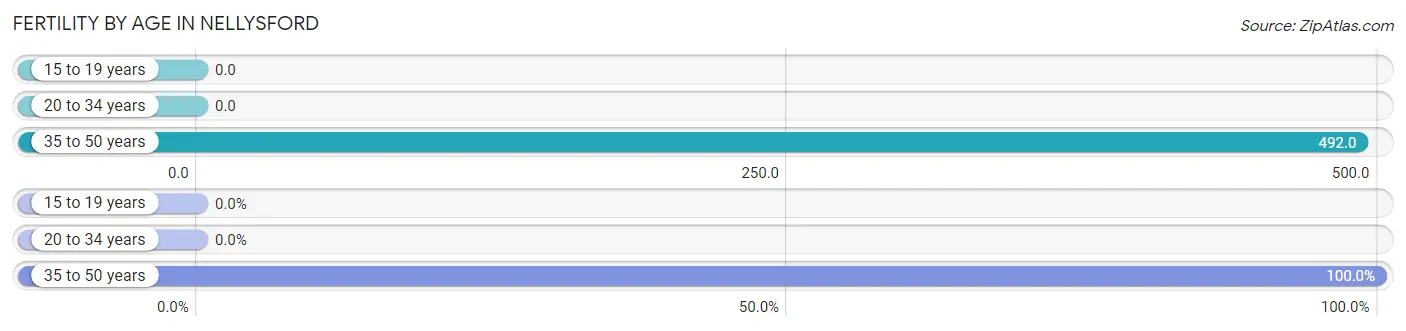
| Age Bracket | Women with Births | Births / 1,000 Women |
| 15 to 19 years | 0 (0.0%) | 0.0 |
| 20 to 34 years | 0 (0.0%) | 0.0 |
| 35 to 50 years | 30 (100.0%) | 492.0 |
| Total | 30 (100.0%) | 361.0 |
Fertility by Age by Marriage Status in Nellysford
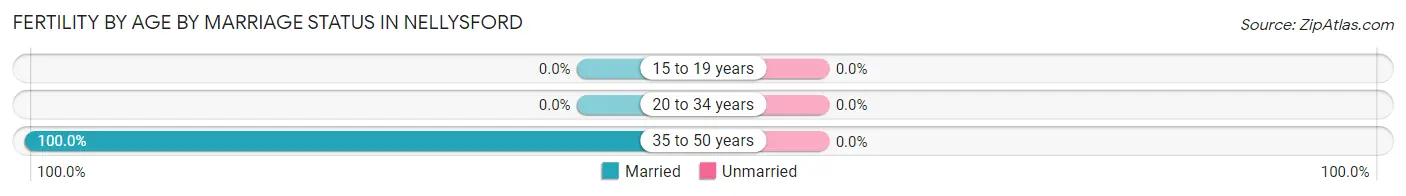
| Age Bracket | Married | Unmarried |
| 15 to 19 years | 0 (0.0%) | 0 (0.0%) |
| 20 to 34 years | 0 (0.0%) | 0 (0.0%) |
| 35 to 50 years | 30 (100.0%) | 0 (0.0%) |
| Total | 30 (100.0%) | 0 (0.0%) |
Fertility by Education in Nellysford
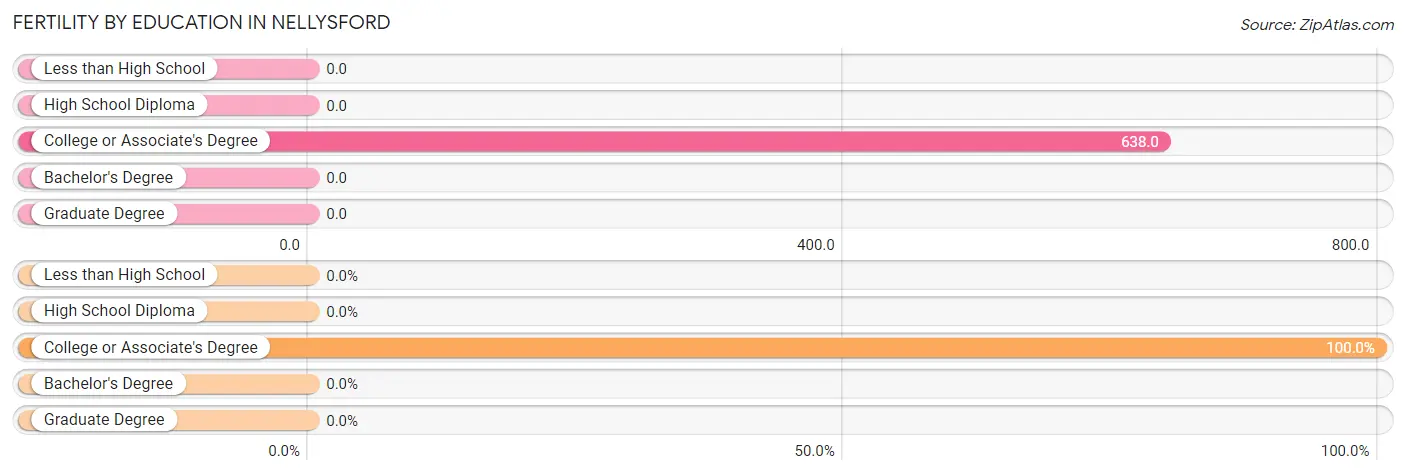
| Educational Attainment | Women with Births | Births / 1,000 Women |
| Less than High School | 0 (0.0%) | 0.0 |
| High School Diploma | 0 (0.0%) | 0.0 |
| College or Associate's Degree | 30 (100.0%) | 638.0 |
| Bachelor's Degree | 0 (0.0%) | 0.0 |
| Graduate Degree | 0 (0.0%) | 0.0 |
| Total | 30 (100.0%) | 361.0 |
Fertility by Education by Marriage Status in Nellysford
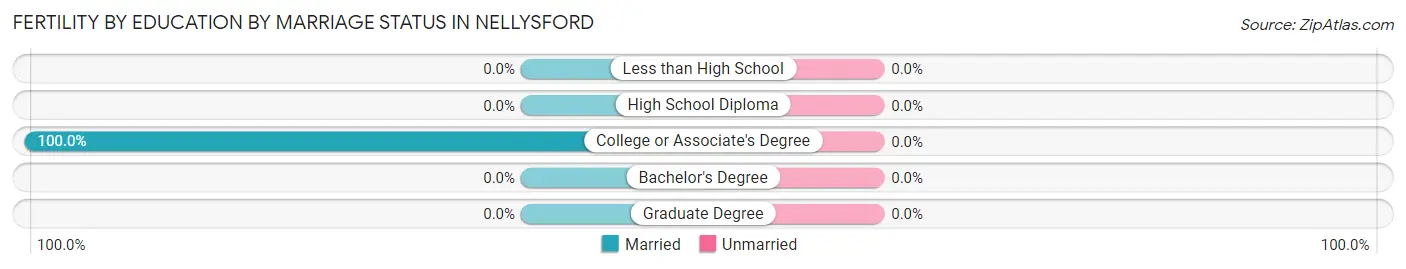
| Educational Attainment | Married | Unmarried |
| Less than High School | 0 (0.0%) | 0 (0.0%) |
| High School Diploma | 0 (0.0%) | 0 (0.0%) |
| College or Associate's Degree | 30 (100.0%) | 0 (0.0%) |
| Bachelor's Degree | 0 (0.0%) | 0 (0.0%) |
| Graduate Degree | 0 (0.0%) | 0 (0.0%) |
| Total | 30 (100.0%) | 0 (0.0%) |
Employment Characteristics in Nellysford
Employment by Class of Employer in Nellysford
Among the 322 employed individuals in Nellysford, private company employees (212 | 65.8%), self-employed (not incorporated) (48 | 14.9%), and self-employed (incorporated) (38 | 11.8%) make up the most common classes of employment.
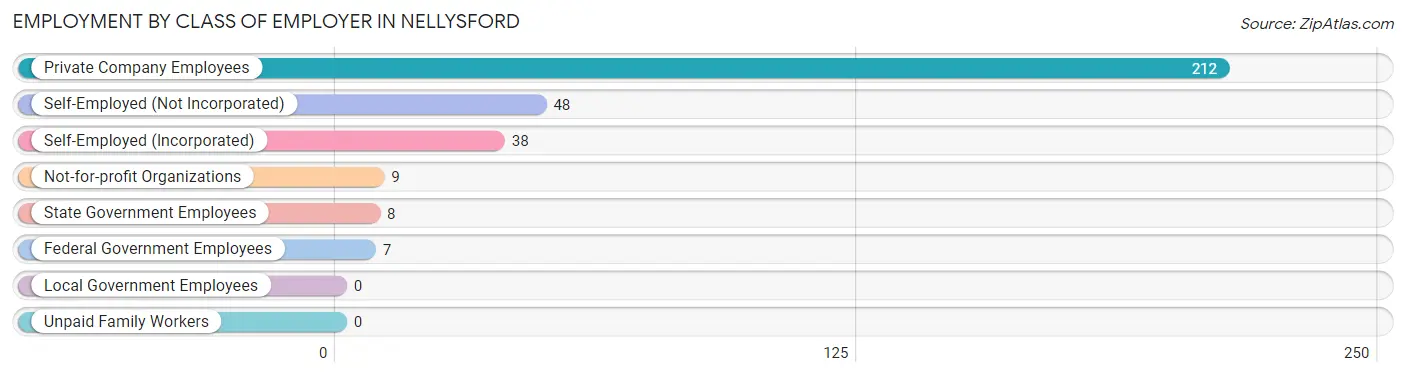
| Employer Class | # Employees | % Employees |
| Private Company Employees | 212 | 65.8% |
| Self-Employed (Incorporated) | 38 | 11.8% |
| Self-Employed (Not Incorporated) | 48 | 14.9% |
| Not-for-profit Organizations | 9 | 2.8% |
| Local Government Employees | 0 | 0.0% |
| State Government Employees | 8 | 2.5% |
| Federal Government Employees | 7 | 2.2% |
| Unpaid Family Workers | 0 | 0.0% |
| Total | 322 | 100.0% |
Employment Status by Age in Nellysford
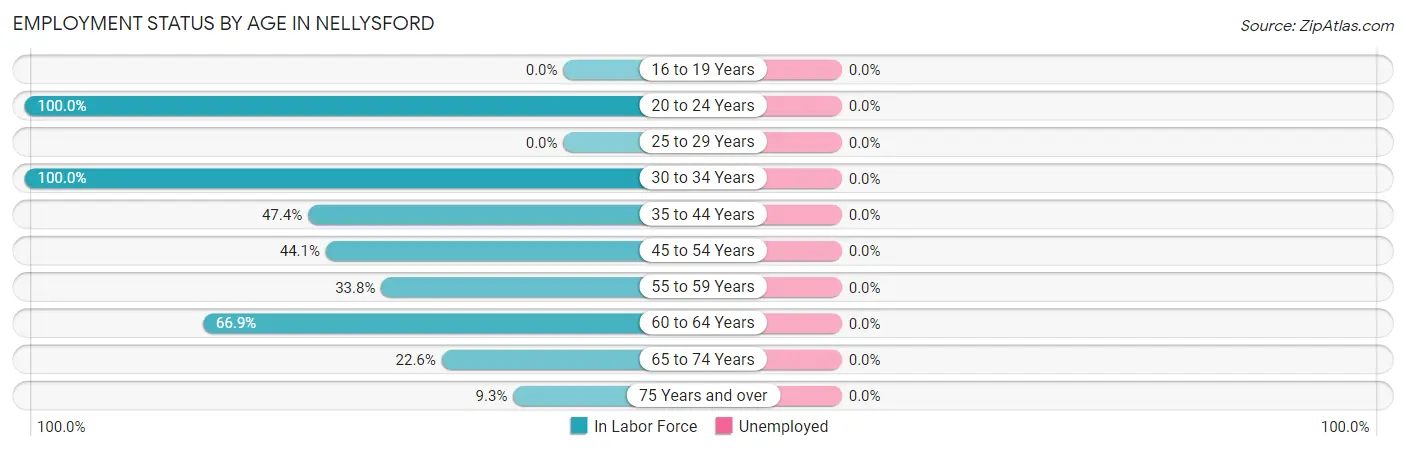
| Age Bracket | In Labor Force | Unemployed |
| 16 to 19 Years | 0 (0.0%) | 0 (0.0%) |
| 20 to 24 Years | 25 (100.0%) | 0 (0.0%) |
| 25 to 29 Years | 0 (0.0%) | 0 (0.0%) |
| 30 to 34 Years | 26 (100.0%) | 0 (0.0%) |
| 35 to 44 Years | 27 (47.4%) | 0 (0.0%) |
| 45 to 54 Years | 49 (44.1%) | 0 (0.0%) |
| 55 to 59 Years | 25 (33.8%) | 0 (0.0%) |
| 60 to 64 Years | 174 (66.9%) | 0 (0.0%) |
| 65 to 74 Years | 76 (22.6%) | 0 (0.0%) |
| 75 Years and over | 34 (9.3%) | 0 (0.0%) |
| Total | 436 (33.7%) | 0 (0.0%) |
Employment Status by Educational Attainment in Nellysford
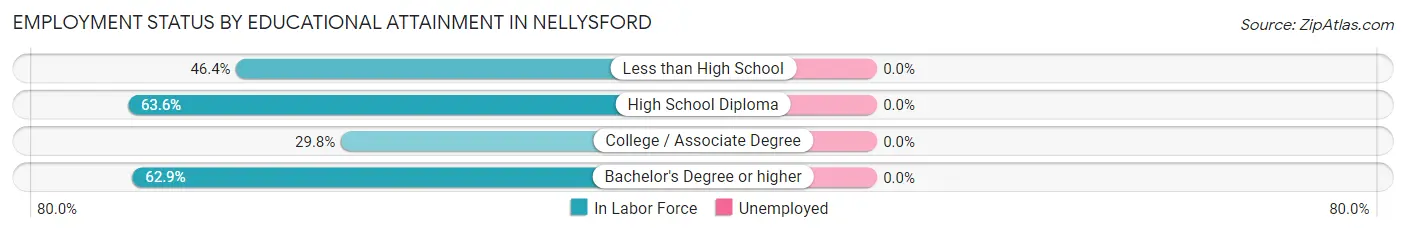
| Educational Attainment | In Labor Force | Unemployed |
| Less than High School | 26 (46.4%) | 0 (0.0%) |
| High School Diploma | 28 (63.6%) | 0 (0.0%) |
| College / Associate Degree | 37 (29.8%) | 0 (0.0%) |
| Bachelor's Degree or higher | 210 (62.9%) | 0 (0.0%) |
| Total | 301 (53.9%) | 0 (0.0%) |
Employment Occupations by Sex in Nellysford
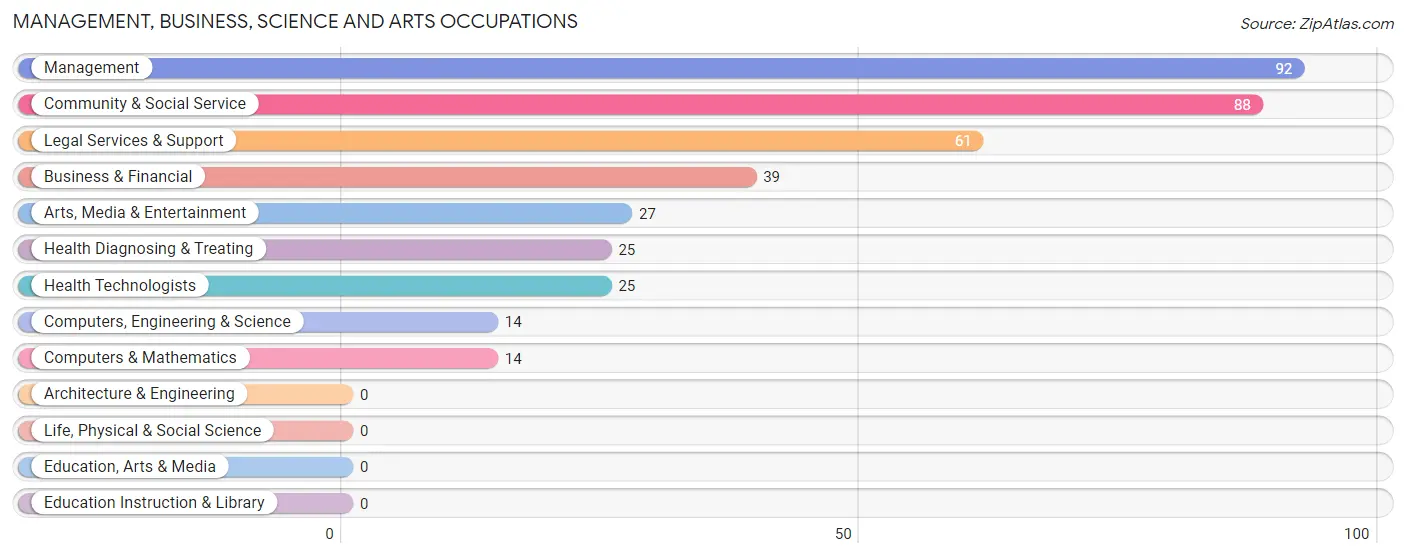
Management, Business, Science and Arts Occupations
The most common Management, Business, Science and Arts occupations in Nellysford are Management (92 | 21.1%), Community & Social Service (88 | 20.2%), Legal Services & Support (61 | 14.0%), Business & Financial (39 | 8.9%), and Arts, Media & Entertainment (27 | 6.2%).
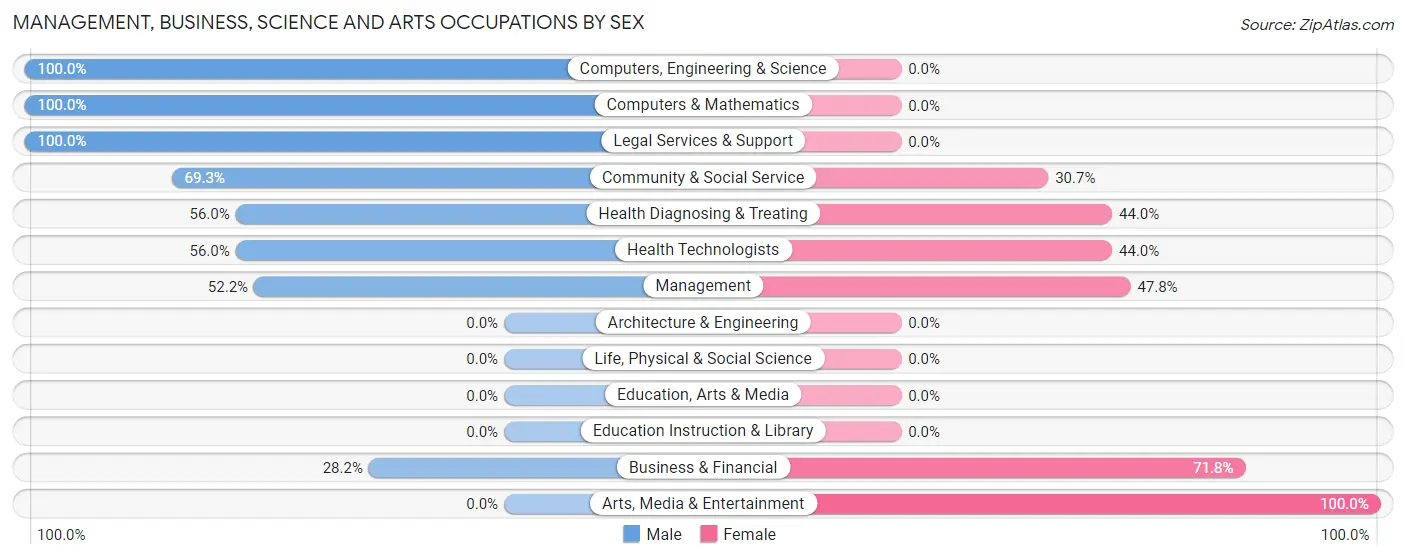
Management, Business, Science and Arts Occupations by Sex
Within the Management, Business, Science and Arts occupations in Nellysford, the most male-oriented occupations are Computers, Engineering & Science (100.0%), Computers & Mathematics (100.0%), and Legal Services & Support (100.0%), while the most female-oriented occupations are Arts, Media & Entertainment (100.0%), Business & Financial (71.8%), and Management (47.8%).
| Occupation | Male | Female |
| Management | 48 (52.2%) | 44 (47.8%) |
| Business & Financial | 11 (28.2%) | 28 (71.8%) |
| Computers, Engineering & Science | 14 (100.0%) | 0 (0.0%) |
| Computers & Mathematics | 14 (100.0%) | 0 (0.0%) |
| Architecture & Engineering | 0 (0.0%) | 0 (0.0%) |
| Life, Physical & Social Science | 0 (0.0%) | 0 (0.0%) |
| Community & Social Service | 61 (69.3%) | 27 (30.7%) |
| Education, Arts & Media | 0 (0.0%) | 0 (0.0%) |
| Legal Services & Support | 61 (100.0%) | 0 (0.0%) |
| Education Instruction & Library | 0 (0.0%) | 0 (0.0%) |
| Arts, Media & Entertainment | 0 (0.0%) | 27 (100.0%) |
| Health Diagnosing & Treating | 14 (56.0%) | 11 (44.0%) |
| Health Technologists | 14 (56.0%) | 11 (44.0%) |
| Total (Category) | 148 (57.4%) | 110 (42.6%) |
| Total (Overall) | 277 (63.5%) | 159 (36.5%) |
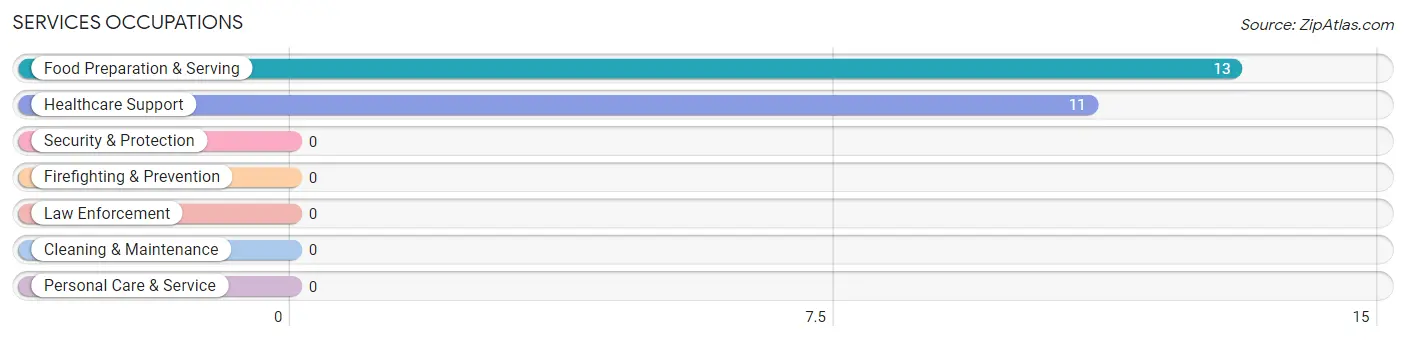
Services Occupations
The most common Services occupations in Nellysford are Food Preparation & Serving (13 | 3.0%), and Healthcare Support (11 | 2.5%).
Services Occupations by Sex
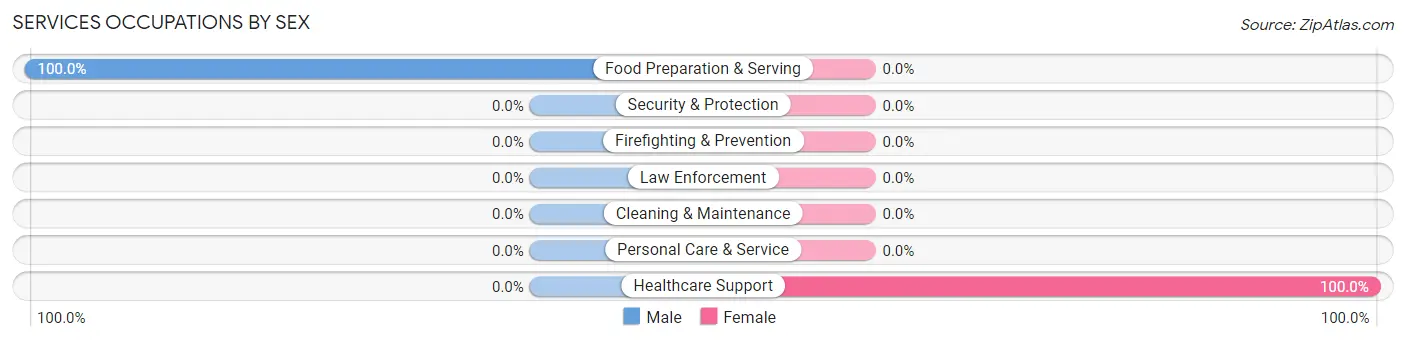
| Occupation | Male | Female |
| Healthcare Support | 0 (0.0%) | 11 (100.0%) |
| Security & Protection | 0 (0.0%) | 0 (0.0%) |
| Firefighting & Prevention | 0 (0.0%) | 0 (0.0%) |
| Law Enforcement | 0 (0.0%) | 0 (0.0%) |
| Food Preparation & Serving | 13 (100.0%) | 0 (0.0%) |
| Cleaning & Maintenance | 0 (0.0%) | 0 (0.0%) |
| Personal Care & Service | 0 (0.0%) | 0 (0.0%) |
| Total (Category) | 13 (54.2%) | 11 (45.8%) |
| Total (Overall) | 277 (63.5%) | 159 (36.5%) |
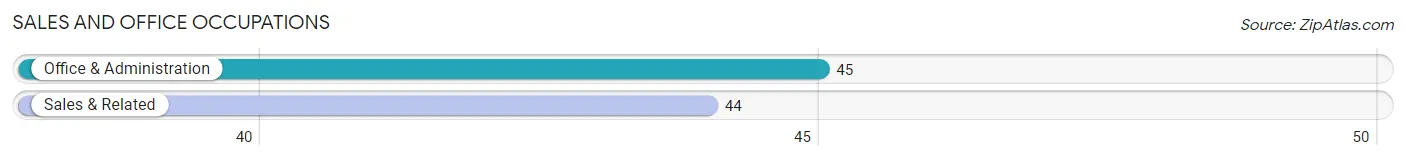
Sales and Office Occupations
The most common Sales and Office occupations in Nellysford are Office & Administration (45 | 10.3%), and Sales & Related (44 | 10.1%).
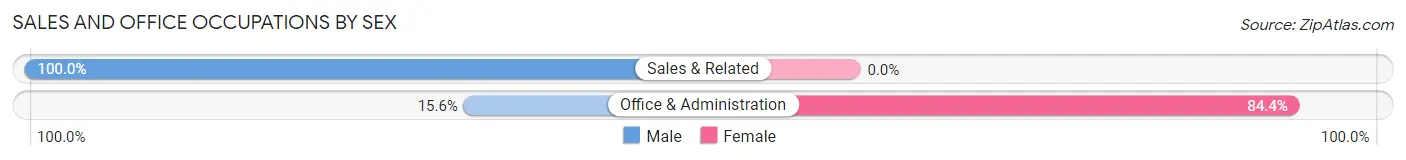
Sales and Office Occupations by Sex
| Occupation | Male | Female |
| Sales & Related | 44 (100.0%) | 0 (0.0%) |
| Office & Administration | 7 (15.6%) | 38 (84.4%) |
| Total (Category) | 51 (57.3%) | 38 (42.7%) |
| Total (Overall) | 277 (63.5%) | 159 (36.5%) |
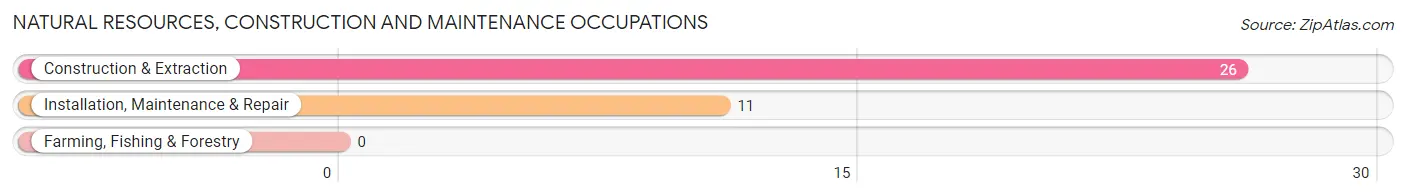
Natural Resources, Construction and Maintenance Occupations
The most common Natural Resources, Construction and Maintenance occupations in Nellysford are Construction & Extraction (26 | 6.0%), and Installation, Maintenance & Repair (11 | 2.5%).
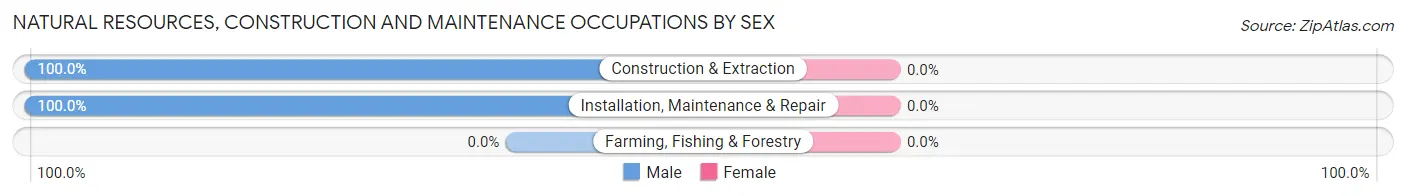
Natural Resources, Construction and Maintenance Occupations by Sex
| Occupation | Male | Female |
| Farming, Fishing & Forestry | 0 (0.0%) | 0 (0.0%) |
| Construction & Extraction | 26 (100.0%) | 0 (0.0%) |
| Installation, Maintenance & Repair | 11 (100.0%) | 0 (0.0%) |
| Total (Category) | 37 (100.0%) | 0 (0.0%) |
| Total (Overall) | 277 (63.5%) | 159 (36.5%) |
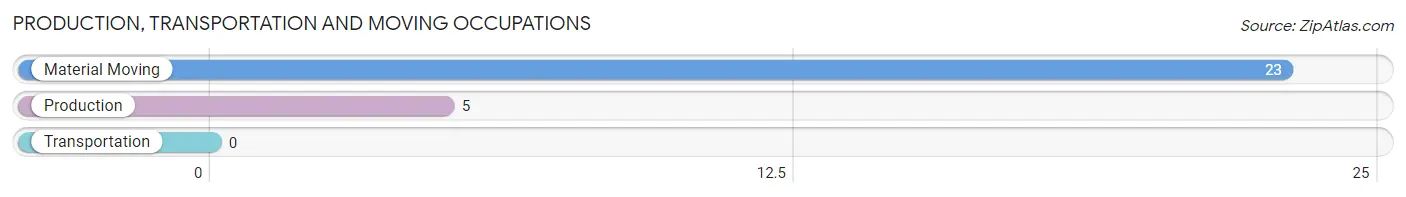
Production, Transportation and Moving Occupations
The most common Production, Transportation and Moving occupations in Nellysford are Material Moving (23 | 5.3%), and Production (5 | 1.1%).
Production, Transportation and Moving Occupations by Sex
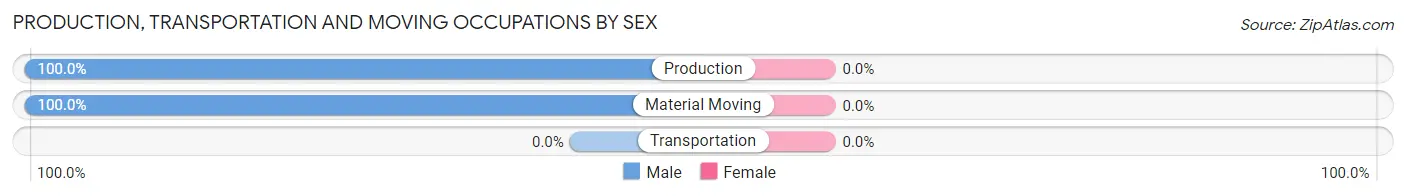
| Occupation | Male | Female |
| Production | 5 (100.0%) | 0 (0.0%) |
| Transportation | 0 (0.0%) | 0 (0.0%) |
| Material Moving | 23 (100.0%) | 0 (0.0%) |
| Total (Category) | 28 (100.0%) | 0 (0.0%) |
| Total (Overall) | 277 (63.5%) | 159 (36.5%) |
Employment Industries by Sex in Nellysford
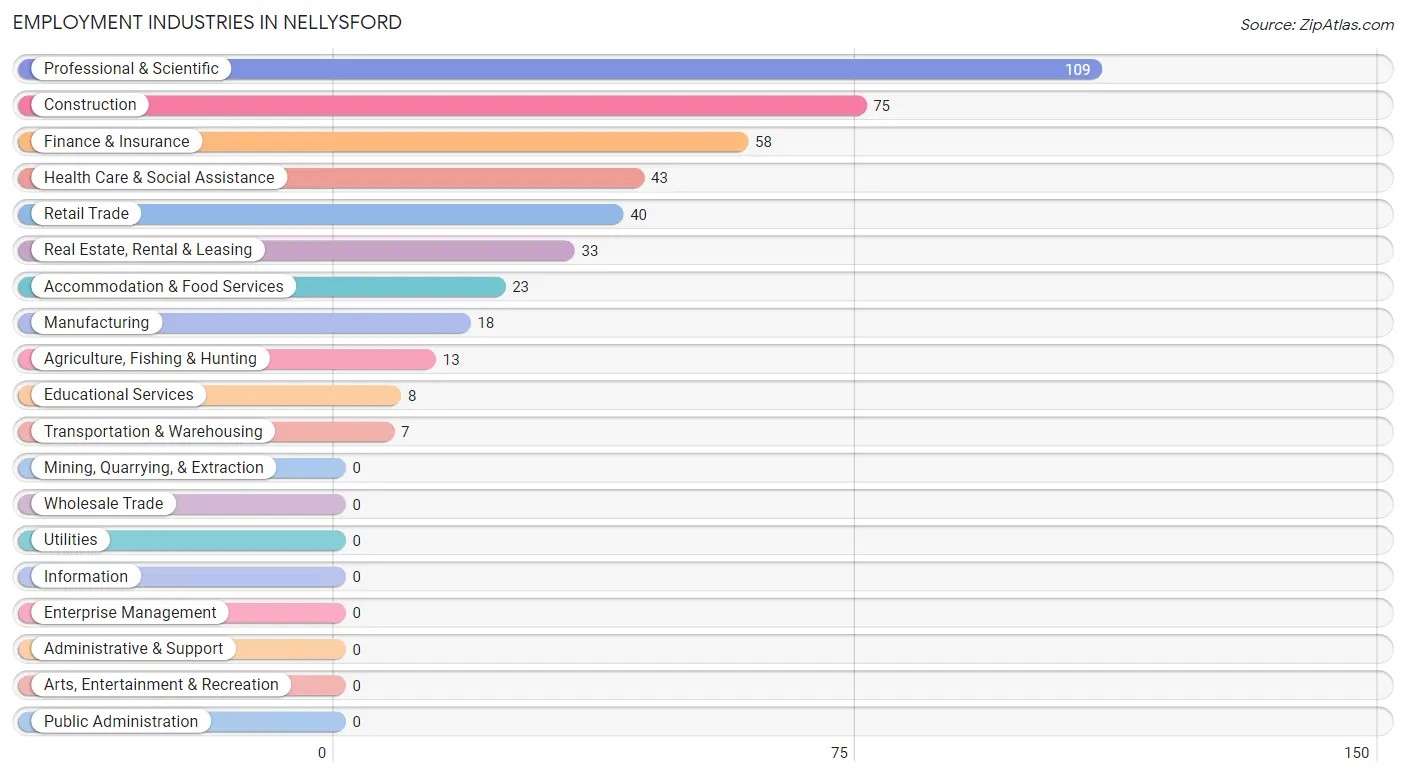
Employment Industries in Nellysford
The major employment industries in Nellysford include Professional & Scientific (109 | 25.0%), Construction (75 | 17.2%), Finance & Insurance (58 | 13.3%), Health Care & Social Assistance (43 | 9.9%), and Retail Trade (40 | 9.2%).
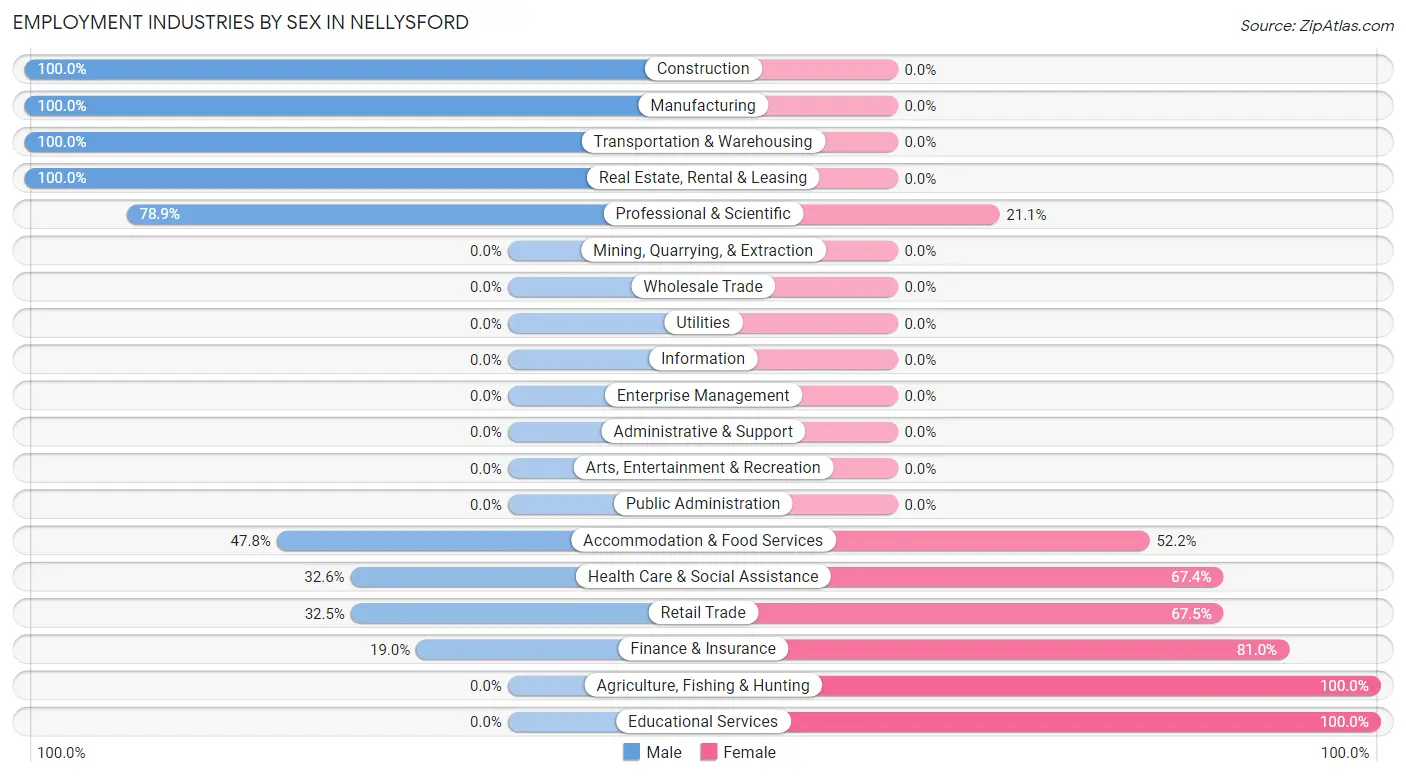
Employment Industries by Sex in Nellysford
The Nellysford industries that see more men than women are Construction (100.0%), Manufacturing (100.0%), and Transportation & Warehousing (100.0%), whereas the industries that tend to have a higher number of women are Agriculture, Fishing & Hunting (100.0%), Educational Services (100.0%), and Finance & Insurance (81.0%).
| Industry | Male | Female |
| Agriculture, Fishing & Hunting | 0 (0.0%) | 13 (100.0%) |
| Mining, Quarrying, & Extraction | 0 (0.0%) | 0 (0.0%) |
| Construction | 75 (100.0%) | 0 (0.0%) |
| Manufacturing | 18 (100.0%) | 0 (0.0%) |
| Wholesale Trade | 0 (0.0%) | 0 (0.0%) |
| Retail Trade | 13 (32.5%) | 27 (67.5%) |
| Transportation & Warehousing | 7 (100.0%) | 0 (0.0%) |
| Utilities | 0 (0.0%) | 0 (0.0%) |
| Information | 0 (0.0%) | 0 (0.0%) |
| Finance & Insurance | 11 (19.0%) | 47 (81.0%) |
| Real Estate, Rental & Leasing | 33 (100.0%) | 0 (0.0%) |
| Professional & Scientific | 86 (78.9%) | 23 (21.1%) |
| Enterprise Management | 0 (0.0%) | 0 (0.0%) |
| Administrative & Support | 0 (0.0%) | 0 (0.0%) |
| Educational Services | 0 (0.0%) | 8 (100.0%) |
| Health Care & Social Assistance | 14 (32.6%) | 29 (67.4%) |
| Arts, Entertainment & Recreation | 0 (0.0%) | 0 (0.0%) |
| Accommodation & Food Services | 11 (47.8%) | 12 (52.2%) |
| Public Administration | 0 (0.0%) | 0 (0.0%) |
| Total | 277 (63.5%) | 159 (36.5%) |
Education in Nellysford
School Enrollment in Nellysford
The most common levels of schooling among the 57 students in Nellysford are middle school (28 | 49.1%), high school (14 | 24.6%), and college / undergraduate (10 | 17.5%).
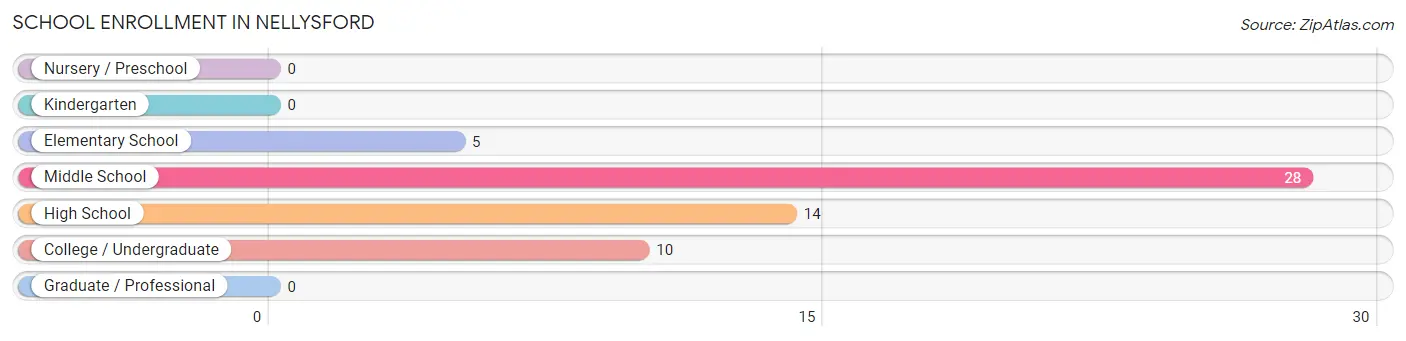
| School Level | # Students | % Students |
| Nursery / Preschool | 0 | 0.0% |
| Kindergarten | 0 | 0.0% |
| Elementary School | 5 | 8.8% |
| Middle School | 28 | 49.1% |
| High School | 14 | 24.6% |
| College / Undergraduate | 10 | 17.5% |
| Graduate / Professional | 0 | 0.0% |
| Total | 57 | 100.0% |
School Enrollment by Age by Funding Source in Nellysford
Out of a total of 57 students who are enrolled in schools in Nellysford, 9 (15.8%) attend a private institution, while the remaining 48 (84.2%) are enrolled in public schools. The age group of 10 to 14 year olds has the highest likelihood of being enrolled in private schools, with 9 (21.4% in the age bracket) enrolled. Conversely, the age group of 5 to 9 year old has the lowest likelihood of being enrolled in a private school, with 5 (100.0% in the age bracket) attending a public institution.
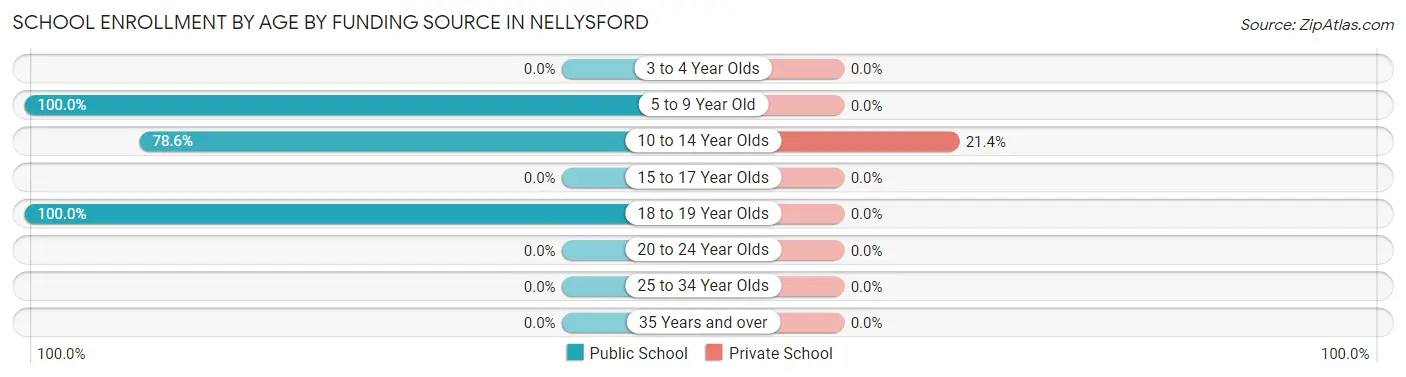
| Age Bracket | Public School | Private School |
| 3 to 4 Year Olds | 0 (0.0%) | 0 (0.0%) |
| 5 to 9 Year Old | 5 (100.0%) | 0 (0.0%) |
| 10 to 14 Year Olds | 33 (78.6%) | 9 (21.4%) |
| 15 to 17 Year Olds | 0 (0.0%) | 0 (0.0%) |
| 18 to 19 Year Olds | 10 (100.0%) | 0 (0.0%) |
| 20 to 24 Year Olds | 0 (0.0%) | 0 (0.0%) |
| 25 to 34 Year Olds | 0 (0.0%) | 0 (0.0%) |
| 35 Years and over | 0 (0.0%) | 0 (0.0%) |
| Total | 48 (84.2%) | 9 (15.8%) |
Educational Attainment by Field of Study in Nellysford
Business (194 | 22.4%), liberal arts & history (95 | 11.0%), engineering (81 | 9.3%), literature & languages (65 | 7.5%), and science & technology (64 | 7.4%) are the most common fields of study among 867 individuals in Nellysford who have obtained a bachelor's degree or higher.
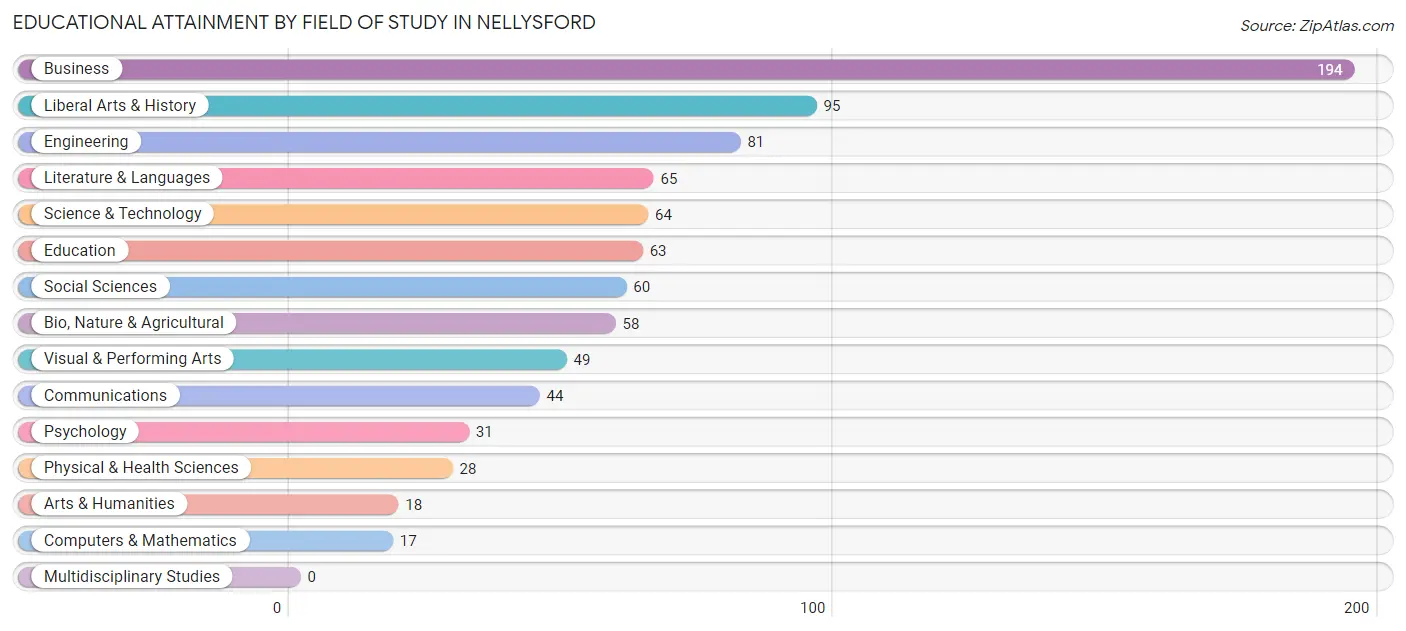
| Field of Study | # Graduates | % Graduates |
| Computers & Mathematics | 17 | 2.0% |
| Bio, Nature & Agricultural | 58 | 6.7% |
| Physical & Health Sciences | 28 | 3.2% |
| Psychology | 31 | 3.6% |
| Social Sciences | 60 | 6.9% |
| Engineering | 81 | 9.3% |
| Multidisciplinary Studies | 0 | 0.0% |
| Science & Technology | 64 | 7.4% |
| Business | 194 | 22.4% |
| Education | 63 | 7.3% |
| Literature & Languages | 65 | 7.5% |
| Liberal Arts & History | 95 | 11.0% |
| Visual & Performing Arts | 49 | 5.7% |
| Communications | 44 | 5.1% |
| Arts & Humanities | 18 | 2.1% |
| Total | 867 | 100.0% |
Transportation & Commute in Nellysford
Vehicle Availability by Sex in Nellysford
The most prevalent vehicle ownership categories in Nellysford are males with 3 vehicles (102, accounting for 50.2%) and females with 3 vehicles (35, making up 85.7%).
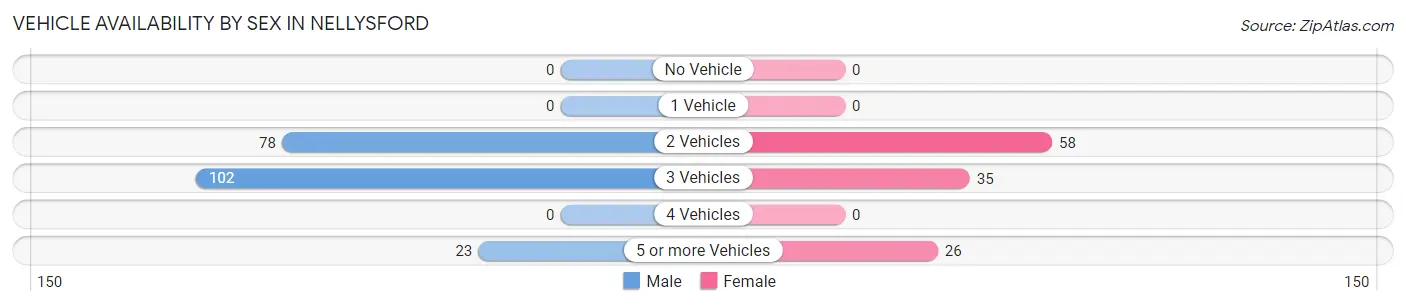
| Vehicles Available | Male | Female |
| No Vehicle | 0 (0.0%) | 0 (0.0%) |
| 1 Vehicle | 0 (0.0%) | 0 (0.0%) |
| 2 Vehicles | 78 (38.4%) | 58 (48.7%) |
| 3 Vehicles | 102 (50.2%) | 35 (29.4%) |
| 4 Vehicles | 0 (0.0%) | 0 (0.0%) |
| 5 or more Vehicles | 23 (11.3%) | 26 (21.8%) |
| Total | 203 (100.0%) | 119 (100.0%) |
Commute Time in Nellysford
The most frequently occuring commute durations in Nellysford are 5 to 9 minutes (37 commuters, 22.8%), less than 5 minutes (25 commuters, 15.4%), and 20 to 24 minutes (19 commuters, 11.7%).
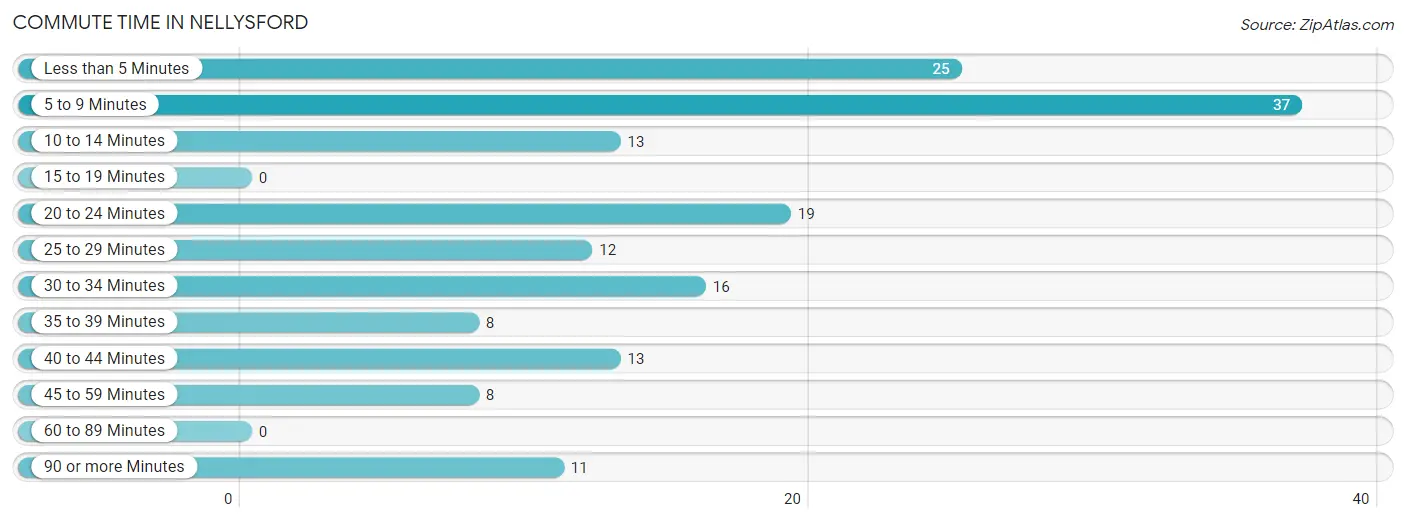
| Commute Time | # Commuters | % Commuters |
| Less than 5 Minutes | 25 | 15.4% |
| 5 to 9 Minutes | 37 | 22.8% |
| 10 to 14 Minutes | 13 | 8.0% |
| 15 to 19 Minutes | 0 | 0.0% |
| 20 to 24 Minutes | 19 | 11.7% |
| 25 to 29 Minutes | 12 | 7.4% |
| 30 to 34 Minutes | 16 | 9.9% |
| 35 to 39 Minutes | 8 | 4.9% |
| 40 to 44 Minutes | 13 | 8.0% |
| 45 to 59 Minutes | 8 | 4.9% |
| 60 to 89 Minutes | 0 | 0.0% |
| 90 or more Minutes | 11 | 6.8% |
Commute Time by Sex in Nellysford
The most common commute times in Nellysford are 5 to 9 minutes (37 commuters, 34.6%) for males and 30 to 34 minutes (16 commuters, 29.1%) for females.
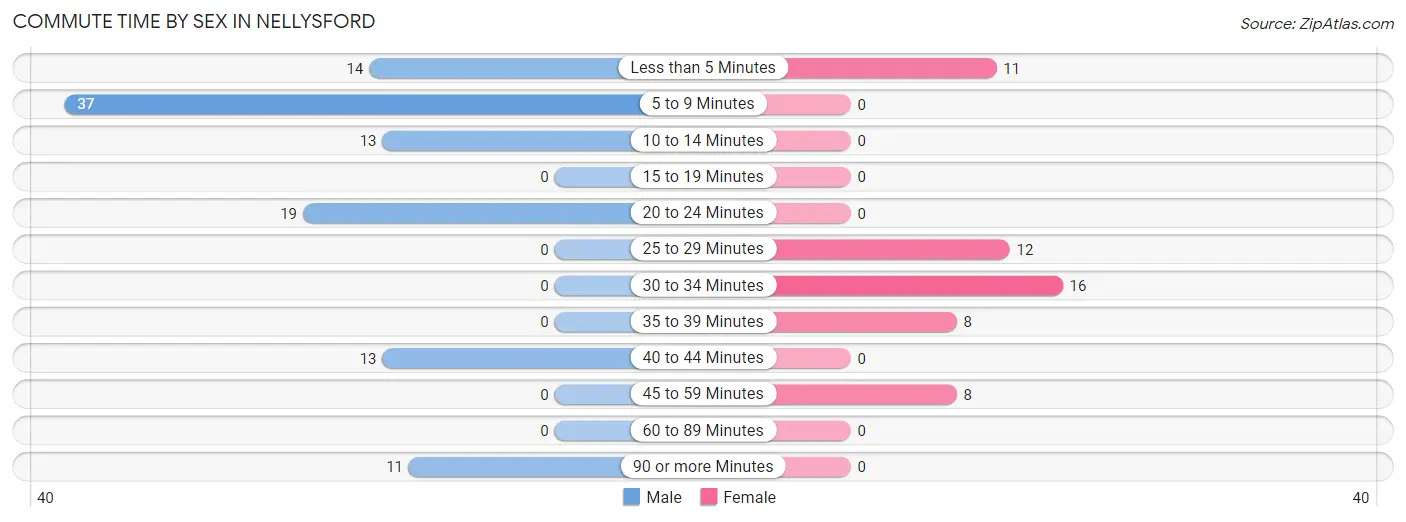
| Commute Time | Male | Female |
| Less than 5 Minutes | 14 (13.1%) | 11 (20.0%) |
| 5 to 9 Minutes | 37 (34.6%) | 0 (0.0%) |
| 10 to 14 Minutes | 13 (12.1%) | 0 (0.0%) |
| 15 to 19 Minutes | 0 (0.0%) | 0 (0.0%) |
| 20 to 24 Minutes | 19 (17.8%) | 0 (0.0%) |
| 25 to 29 Minutes | 0 (0.0%) | 12 (21.8%) |
| 30 to 34 Minutes | 0 (0.0%) | 16 (29.1%) |
| 35 to 39 Minutes | 0 (0.0%) | 8 (14.5%) |
| 40 to 44 Minutes | 13 (12.1%) | 0 (0.0%) |
| 45 to 59 Minutes | 0 (0.0%) | 8 (14.5%) |
| 60 to 89 Minutes | 0 (0.0%) | 0 (0.0%) |
| 90 or more Minutes | 11 (10.3%) | 0 (0.0%) |
Time of Departure to Work by Sex in Nellysford
The most frequent times of departure to work in Nellysford are 7:00 AM to 7:29 AM (27, 25.2%) for males and 10:00 AM to 10:59 AM (12, 21.8%) for females.
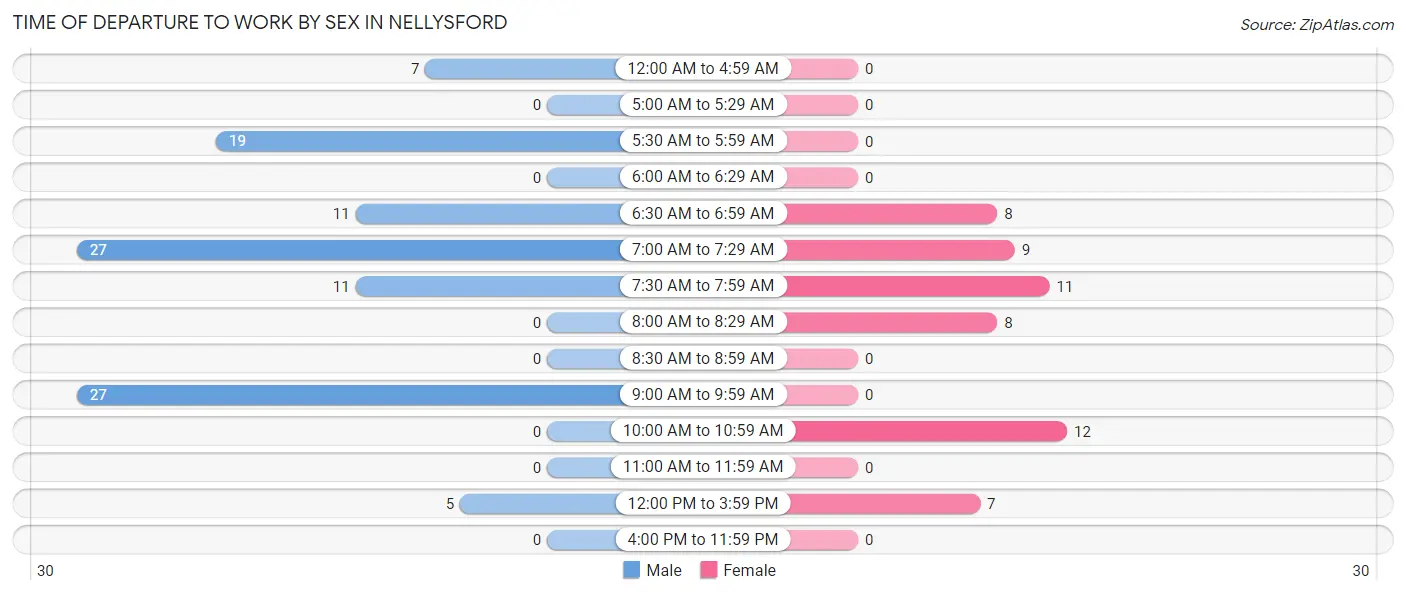
| Time of Departure | Male | Female |
| 12:00 AM to 4:59 AM | 7 (6.5%) | 0 (0.0%) |
| 5:00 AM to 5:29 AM | 0 (0.0%) | 0 (0.0%) |
| 5:30 AM to 5:59 AM | 19 (17.8%) | 0 (0.0%) |
| 6:00 AM to 6:29 AM | 0 (0.0%) | 0 (0.0%) |
| 6:30 AM to 6:59 AM | 11 (10.3%) | 8 (14.5%) |
| 7:00 AM to 7:29 AM | 27 (25.2%) | 9 (16.4%) |
| 7:30 AM to 7:59 AM | 11 (10.3%) | 11 (20.0%) |
| 8:00 AM to 8:29 AM | 0 (0.0%) | 8 (14.5%) |
| 8:30 AM to 8:59 AM | 0 (0.0%) | 0 (0.0%) |
| 9:00 AM to 9:59 AM | 27 (25.2%) | 0 (0.0%) |
| 10:00 AM to 10:59 AM | 0 (0.0%) | 12 (21.8%) |
| 11:00 AM to 11:59 AM | 0 (0.0%) | 0 (0.0%) |
| 12:00 PM to 3:59 PM | 5 (4.7%) | 7 (12.7%) |
| 4:00 PM to 11:59 PM | 0 (0.0%) | 0 (0.0%) |
| Total | 107 (100.0%) | 55 (100.0%) |
Housing Occupancy in Nellysford
Occupancy by Ownership in Nellysford
Of the total 723 dwellings in Nellysford, owner-occupied units account for 643 (88.9%), while renter-occupied units make up 80 (11.1%).
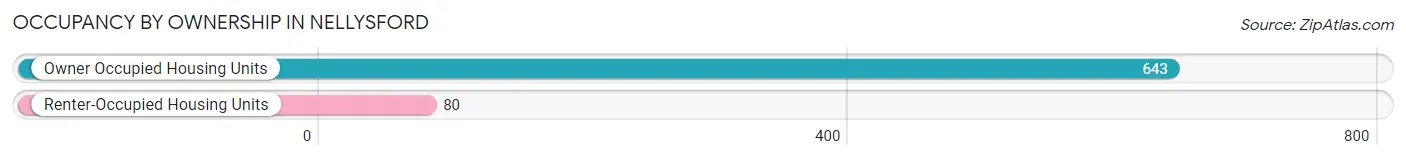
| Occupancy | # Housing Units | % Housing Units |
| Owner Occupied Housing Units | 643 | 88.9% |
| Renter-Occupied Housing Units | 80 | 11.1% |
| Total Occupied Housing Units | 723 | 100.0% |
Occupancy by Household Size in Nellysford
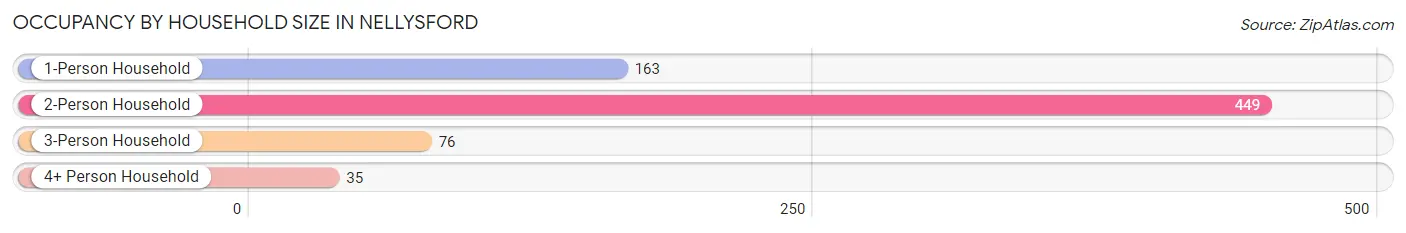
| Household Size | # Housing Units | % Housing Units |
| 1-Person Household | 163 | 22.5% |
| 2-Person Household | 449 | 62.1% |
| 3-Person Household | 76 | 10.5% |
| 4+ Person Household | 35 | 4.8% |
| Total Housing Units | 723 | 100.0% |
Occupancy by Ownership by Household Size in Nellysford
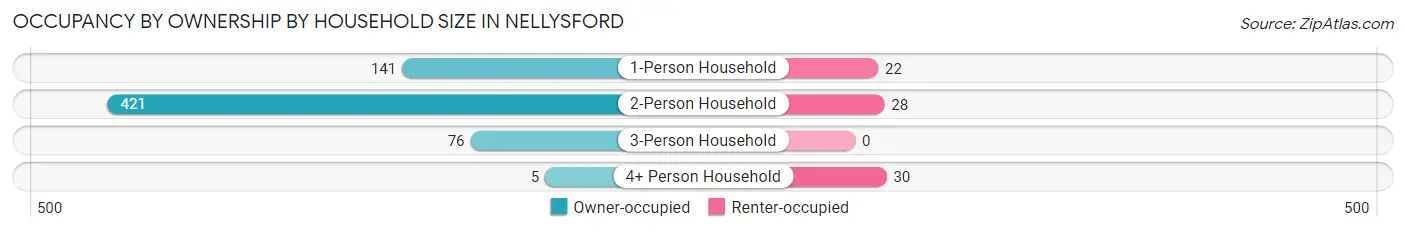
| Household Size | Owner-occupied | Renter-occupied |
| 1-Person Household | 141 (86.5%) | 22 (13.5%) |
| 2-Person Household | 421 (93.8%) | 28 (6.2%) |
| 3-Person Household | 76 (100.0%) | 0 (0.0%) |
| 4+ Person Household | 5 (14.3%) | 30 (85.7%) |
| Total Housing Units | 643 (88.9%) | 80 (11.1%) |
Occupancy by Educational Attainment in Nellysford
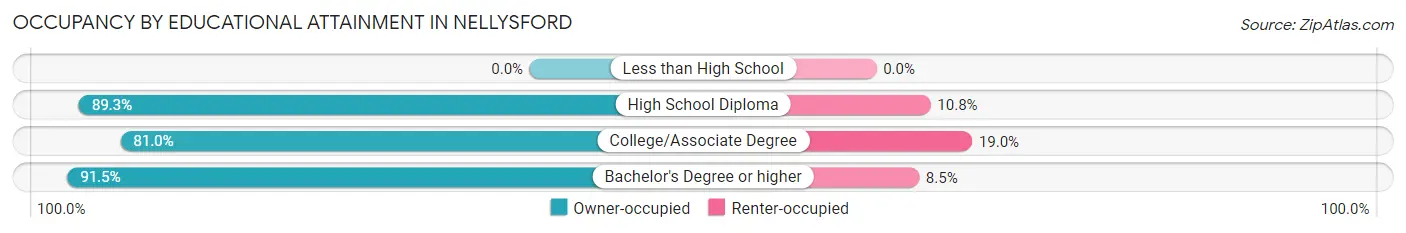
| Household Size | Owner-occupied | Renter-occupied |
| Less than High School | 0 (0.0%) | 0 (0.0%) |
| High School Diploma | 83 (89.2%) | 10 (10.7%) |
| College/Associate Degree | 128 (81.0%) | 30 (19.0%) |
| Bachelor's Degree or higher | 432 (91.5%) | 40 (8.5%) |
Occupancy by Age of Householder in Nellysford
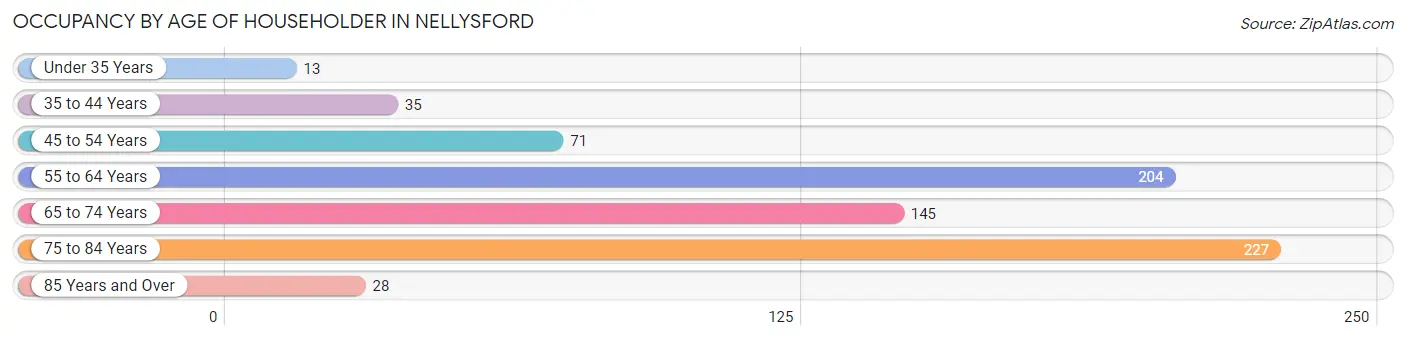
| Age Bracket | # Households | % Households |
| Under 35 Years | 13 | 1.8% |
| 35 to 44 Years | 35 | 4.8% |
| 45 to 54 Years | 71 | 9.8% |
| 55 to 64 Years | 204 | 28.2% |
| 65 to 74 Years | 145 | 20.1% |
| 75 to 84 Years | 227 | 31.4% |
| 85 Years and Over | 28 | 3.9% |
| Total | 723 | 100.0% |
Housing Finances in Nellysford
Median Income by Occupancy in Nellysford
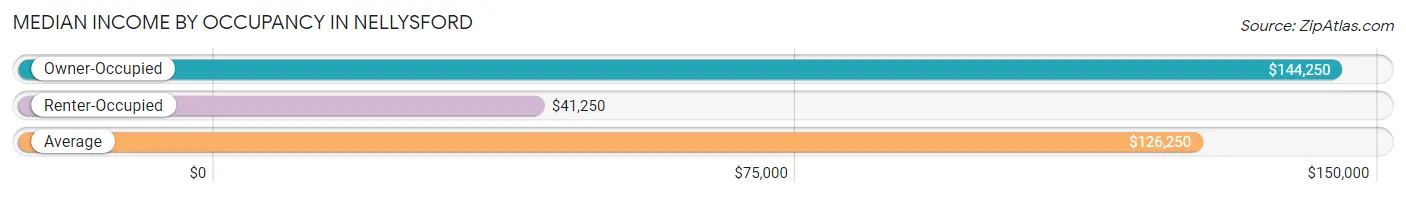
| Occupancy Type | # Households | Median Income |
| Owner-Occupied | 643 (88.9%) | $144,250 |
| Renter-Occupied | 80 (11.1%) | $41,250 |
| Average | 723 (100.0%) | $126,250 |
Occupancy by Householder Income Bracket in Nellysford
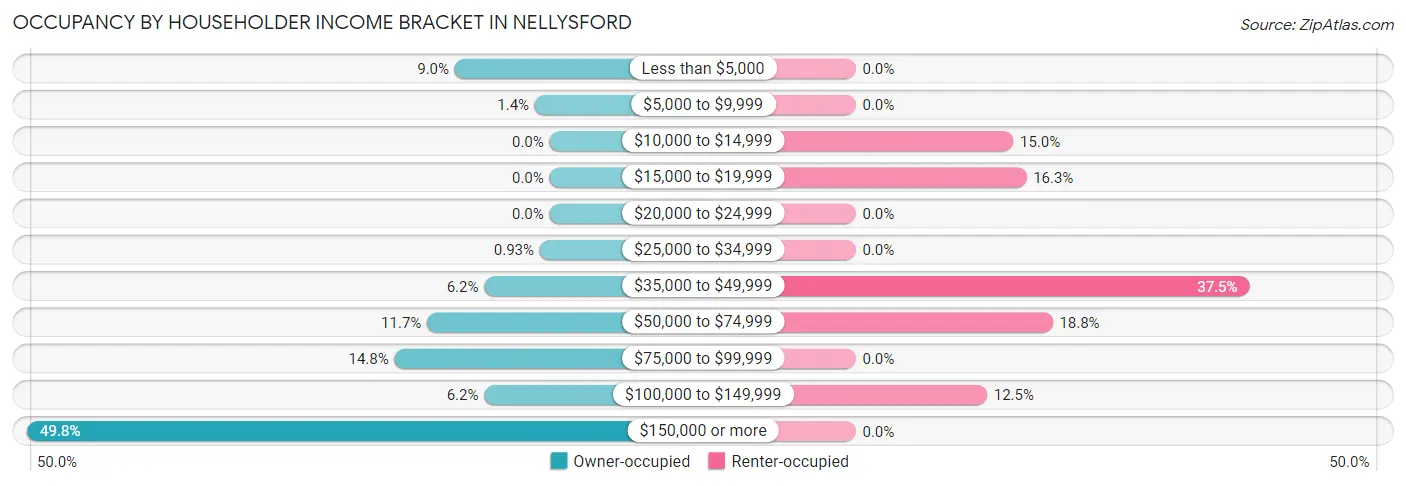
| Income Bracket | Owner-occupied | Renter-occupied |
| Less than $5,000 | 58 (9.0%) | 0 (0.0%) |
| $5,000 to $9,999 | 9 (1.4%) | 0 (0.0%) |
| $10,000 to $14,999 | 0 (0.0%) | 12 (15.0%) |
| $15,000 to $19,999 | 0 (0.0%) | 13 (16.3%) |
| $20,000 to $24,999 | 0 (0.0%) | 0 (0.0%) |
| $25,000 to $34,999 | 6 (0.9%) | 0 (0.0%) |
| $35,000 to $49,999 | 40 (6.2%) | 30 (37.5%) |
| $50,000 to $74,999 | 75 (11.7%) | 15 (18.8%) |
| $75,000 to $99,999 | 95 (14.8%) | 0 (0.0%) |
| $100,000 to $149,999 | 40 (6.2%) | 10 (12.5%) |
| $150,000 or more | 320 (49.8%) | 0 (0.0%) |
| Total | 643 (100.0%) | 80 (100.0%) |
Monthly Housing Cost Tiers in Nellysford
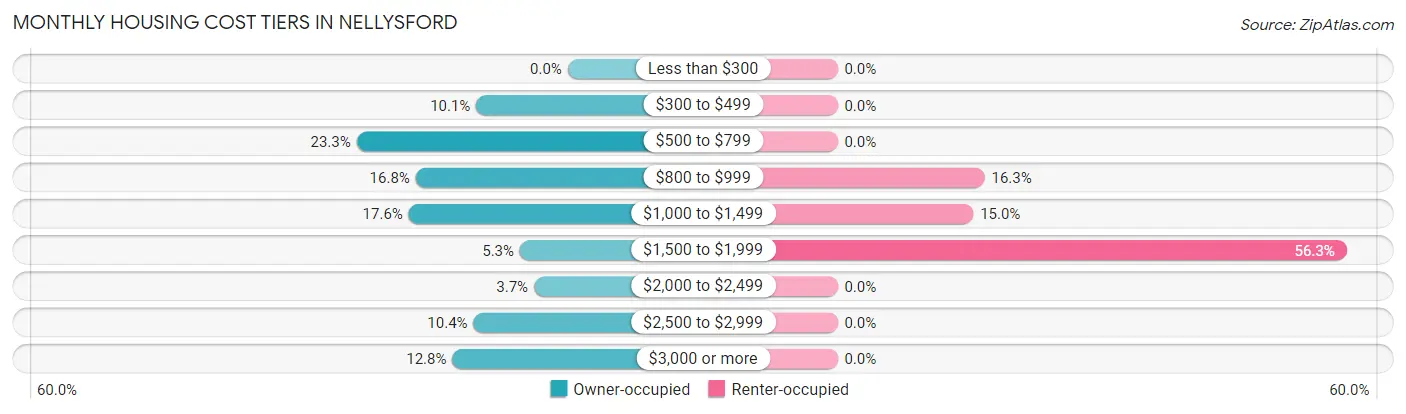
| Monthly Cost | Owner-occupied | Renter-occupied |
| Less than $300 | 0 (0.0%) | 0 (0.0%) |
| $300 to $499 | 65 (10.1%) | 0 (0.0%) |
| $500 to $799 | 150 (23.3%) | 0 (0.0%) |
| $800 to $999 | 108 (16.8%) | 13 (16.3%) |
| $1,000 to $1,499 | 113 (17.6%) | 12 (15.0%) |
| $1,500 to $1,999 | 34 (5.3%) | 45 (56.2%) |
| $2,000 to $2,499 | 24 (3.7%) | 0 (0.0%) |
| $2,500 to $2,999 | 67 (10.4%) | 0 (0.0%) |
| $3,000 or more | 82 (12.8%) | 0 (0.0%) |
| Total | 643 (100.0%) | 80 (100.0%) |
Physical Housing Characteristics in Nellysford
Housing Structures in Nellysford
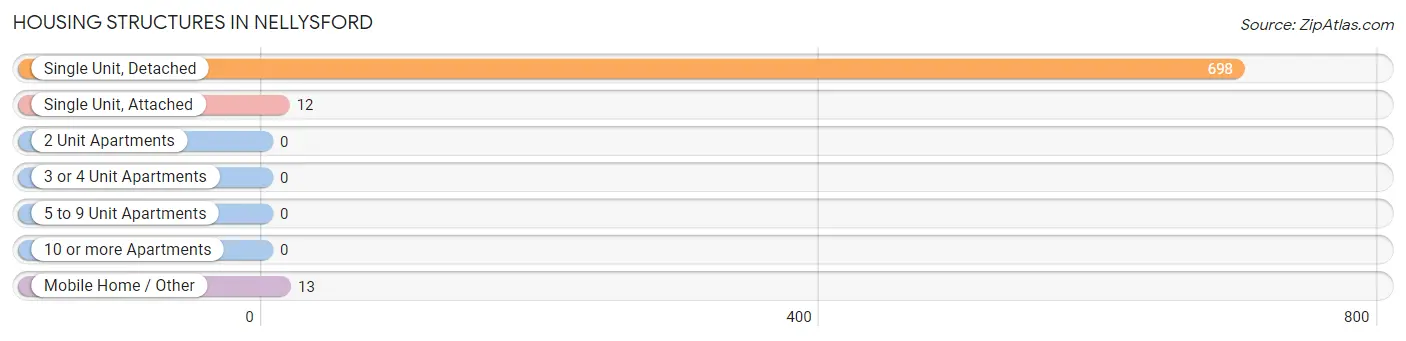
| Structure Type | # Housing Units | % Housing Units |
| Single Unit, Detached | 698 | 96.5% |
| Single Unit, Attached | 12 | 1.7% |
| 2 Unit Apartments | 0 | 0.0% |
| 3 or 4 Unit Apartments | 0 | 0.0% |
| 5 to 9 Unit Apartments | 0 | 0.0% |
| 10 or more Apartments | 0 | 0.0% |
| Mobile Home / Other | 13 | 1.8% |
| Total | 723 | 100.0% |
Housing Structures by Occupancy in Nellysford
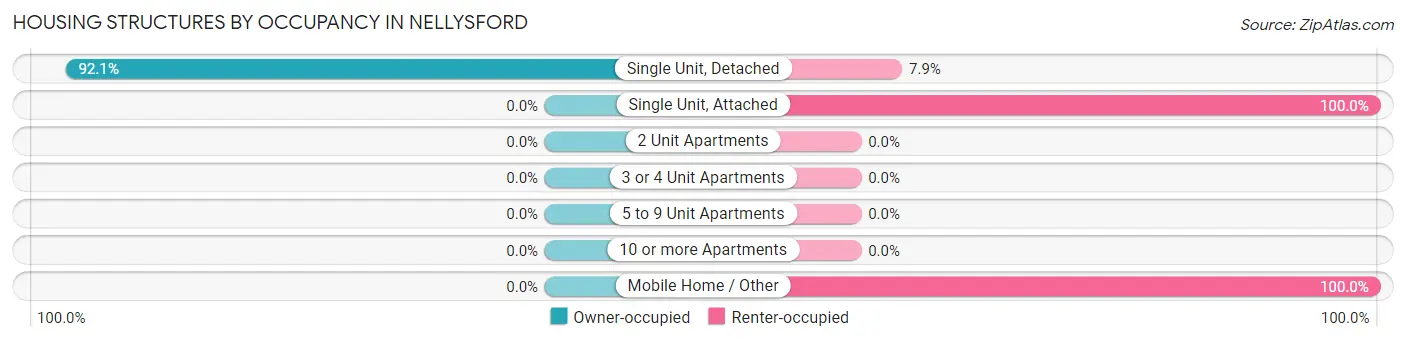
| Structure Type | Owner-occupied | Renter-occupied |
| Single Unit, Detached | 643 (92.1%) | 55 (7.9%) |
| Single Unit, Attached | 0 (0.0%) | 12 (100.0%) |
| 2 Unit Apartments | 0 (0.0%) | 0 (0.0%) |
| 3 or 4 Unit Apartments | 0 (0.0%) | 0 (0.0%) |
| 5 to 9 Unit Apartments | 0 (0.0%) | 0 (0.0%) |
| 10 or more Apartments | 0 (0.0%) | 0 (0.0%) |
| Mobile Home / Other | 0 (0.0%) | 13 (100.0%) |
| Total | 643 (88.9%) | 80 (11.1%) |
Housing Structures by Number of Rooms in Nellysford
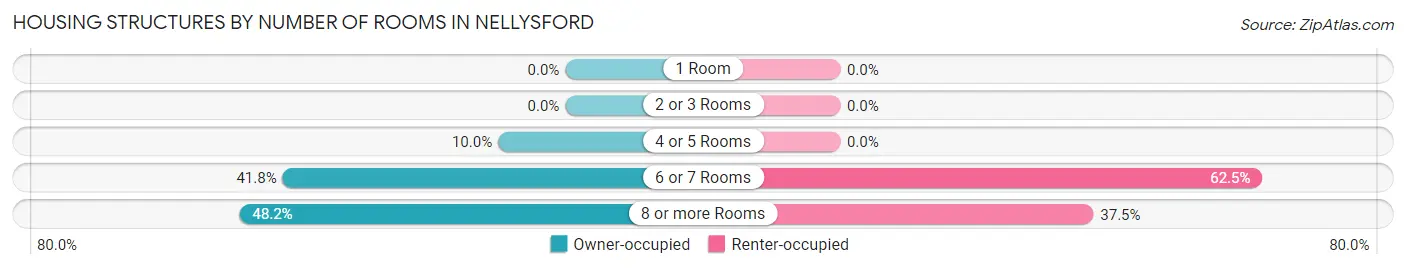
| Number of Rooms | Owner-occupied | Renter-occupied |
| 1 Room | 0 (0.0%) | 0 (0.0%) |
| 2 or 3 Rooms | 0 (0.0%) | 0 (0.0%) |
| 4 or 5 Rooms | 64 (10.0%) | 0 (0.0%) |
| 6 or 7 Rooms | 269 (41.8%) | 50 (62.5%) |
| 8 or more Rooms | 310 (48.2%) | 30 (37.5%) |
| Total | 643 (100.0%) | 80 (100.0%) |
Housing Structure by Heating Type in Nellysford
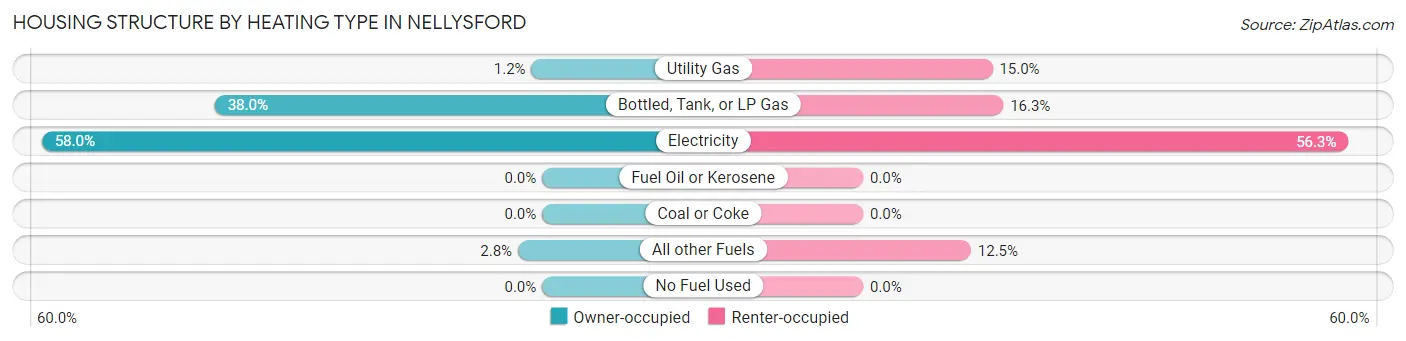
| Heating Type | Owner-occupied | Renter-occupied |
| Utility Gas | 8 (1.2%) | 12 (15.0%) |
| Bottled, Tank, or LP Gas | 244 (38.0%) | 13 (16.3%) |
| Electricity | 373 (58.0%) | 45 (56.2%) |
| Fuel Oil or Kerosene | 0 (0.0%) | 0 (0.0%) |
| Coal or Coke | 0 (0.0%) | 0 (0.0%) |
| All other Fuels | 18 (2.8%) | 10 (12.5%) |
| No Fuel Used | 0 (0.0%) | 0 (0.0%) |
| Total | 643 (100.0%) | 80 (100.0%) |
Household Vehicle Usage in Nellysford
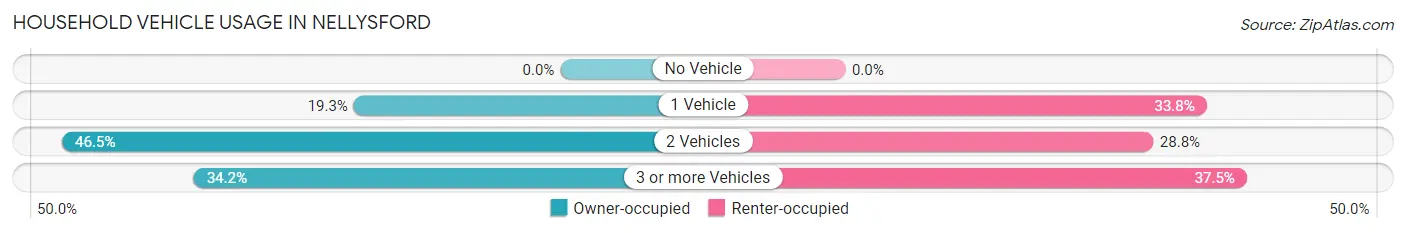
| Vehicles per Household | Owner-occupied | Renter-occupied |
| No Vehicle | 0 (0.0%) | 0 (0.0%) |
| 1 Vehicle | 124 (19.3%) | 27 (33.8%) |
| 2 Vehicles | 299 (46.5%) | 23 (28.7%) |
| 3 or more Vehicles | 220 (34.2%) | 30 (37.5%) |
| Total | 643 (100.0%) | 80 (100.0%) |
Real Estate & Mortgages in Nellysford
Real Estate and Mortgage Overview in Nellysford
| Characteristic | Without Mortgage | With Mortgage |
| Housing Units | 361 | 282 |
| Median Property Value | $455,100 | $595,000 |
| Median Household Income | $88,958 | $198 |
| Monthly Housing Costs | $801 | $82 |
| Real Estate Taxes | $2,875 | $0 |
Property Value by Mortgage Status in Nellysford
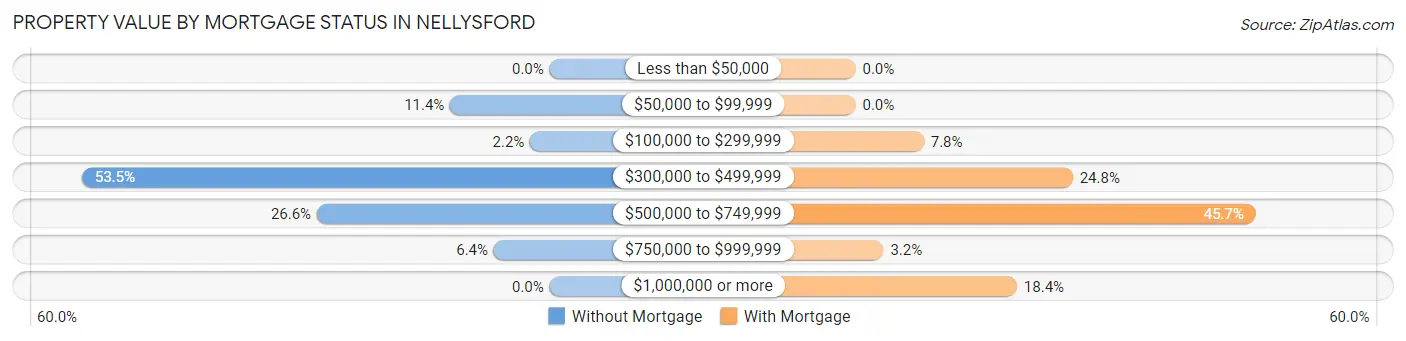
| Property Value | Without Mortgage | With Mortgage |
| Less than $50,000 | 0 (0.0%) | 0 (0.0%) |
| $50,000 to $99,999 | 41 (11.4%) | 0 (0.0%) |
| $100,000 to $299,999 | 8 (2.2%) | 22 (7.8%) |
| $300,000 to $499,999 | 193 (53.5%) | 70 (24.8%) |
| $500,000 to $749,999 | 96 (26.6%) | 129 (45.7%) |
| $750,000 to $999,999 | 23 (6.4%) | 9 (3.2%) |
| $1,000,000 or more | 0 (0.0%) | 52 (18.4%) |
| Total | 361 (100.0%) | 282 (100.0%) |
Household Income by Mortgage Status in Nellysford
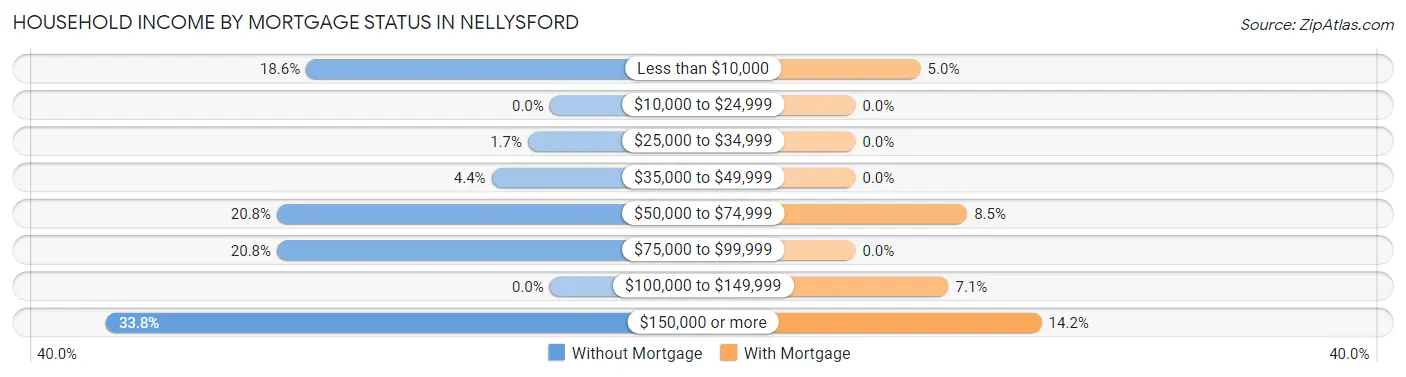
| Household Income | Without Mortgage | With Mortgage |
| Less than $10,000 | 67 (18.6%) | 14 (5.0%) |
| $10,000 to $24,999 | 0 (0.0%) | 0 (0.0%) |
| $25,000 to $34,999 | 6 (1.7%) | 0 (0.0%) |
| $35,000 to $49,999 | 16 (4.4%) | 0 (0.0%) |
| $50,000 to $74,999 | 75 (20.8%) | 24 (8.5%) |
| $75,000 to $99,999 | 75 (20.8%) | 0 (0.0%) |
| $100,000 to $149,999 | 0 (0.0%) | 20 (7.1%) |
| $150,000 or more | 122 (33.8%) | 40 (14.2%) |
| Total | 361 (100.0%) | 282 (100.0%) |
Property Value to Household Income Ratio in Nellysford
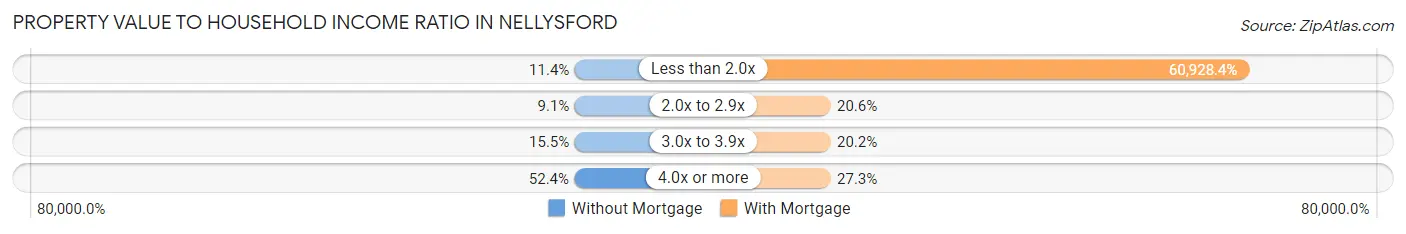
| Value-to-Income Ratio | Without Mortgage | With Mortgage |
| Less than 2.0x | 41 (11.4%) | 171,818 (60,928.4%) |
| 2.0x to 2.9x | 33 (9.1%) | 58 (20.6%) |
| 3.0x to 3.9x | 56 (15.5%) | 57 (20.2%) |
| 4.0x or more | 189 (52.3%) | 77 (27.3%) |
| Total | 361 (100.0%) | 282 (100.0%) |
Real Estate Taxes by Mortgage Status in Nellysford
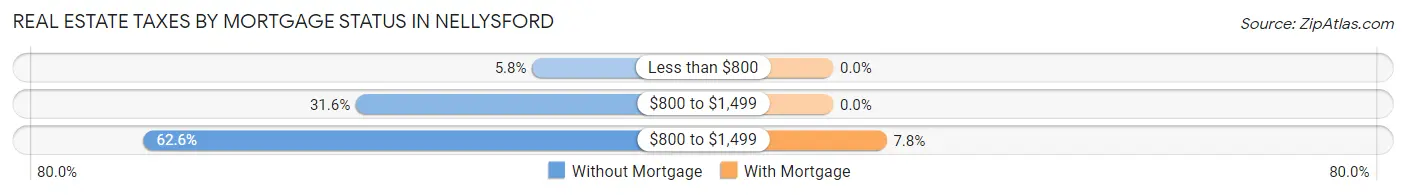
| Property Taxes | Without Mortgage | With Mortgage |
| Less than $800 | 21 (5.8%) | 0 (0.0%) |
| $800 to $1,499 | 114 (31.6%) | 0 (0.0%) |
| $800 to $1,499 | 226 (62.6%) | 22 (7.8%) |
| Total | 361 (100.0%) | 282 (100.0%) |
Health & Disability in Nellysford
Health Insurance Coverage by Age in Nellysford
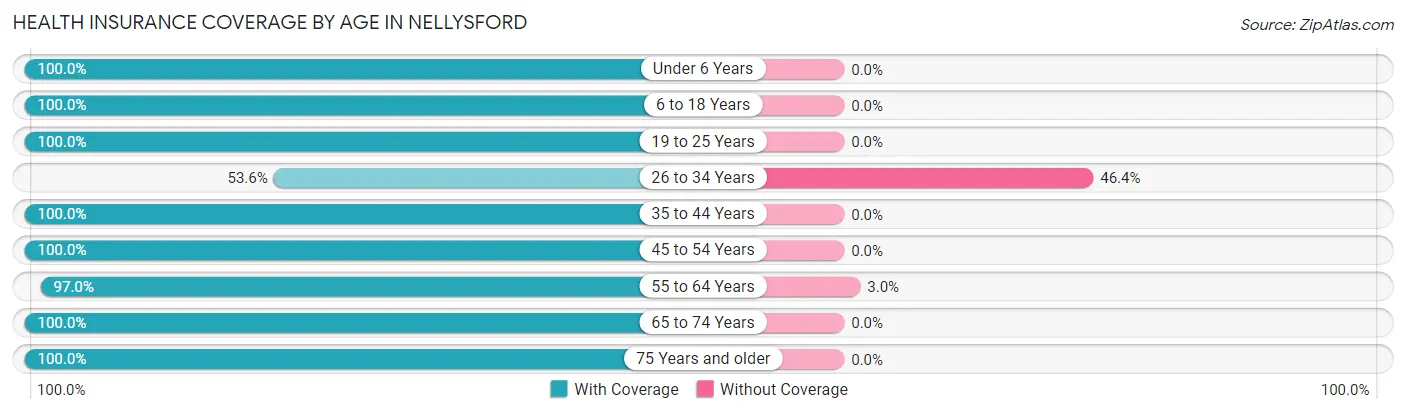
| Age Bracket | With Coverage | Without Coverage |
| Under 6 Years | 41 (100.0%) | 0 (0.0%) |
| 6 to 18 Years | 61 (100.0%) | 0 (0.0%) |
| 19 to 25 Years | 35 (100.0%) | 0 (0.0%) |
| 26 to 34 Years | 30 (53.6%) | 26 (46.4%) |
| 35 to 44 Years | 57 (100.0%) | 0 (0.0%) |
| 45 to 54 Years | 111 (100.0%) | 0 (0.0%) |
| 55 to 64 Years | 324 (97.0%) | 10 (3.0%) |
| 65 to 74 Years | 336 (100.0%) | 0 (0.0%) |
| 75 Years and older | 365 (100.0%) | 0 (0.0%) |
| Total | 1,360 (97.4%) | 36 (2.6%) |
Health Insurance Coverage by Citizenship Status in Nellysford
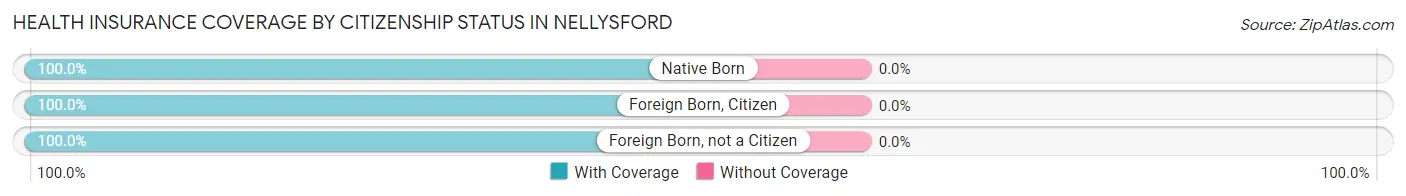
| Citizenship Status | With Coverage | Without Coverage |
| Native Born | 41 (100.0%) | 0 (0.0%) |
| Foreign Born, Citizen | 61 (100.0%) | 0 (0.0%) |
| Foreign Born, not a Citizen | 35 (100.0%) | 0 (0.0%) |
Health Insurance Coverage by Household Income in Nellysford
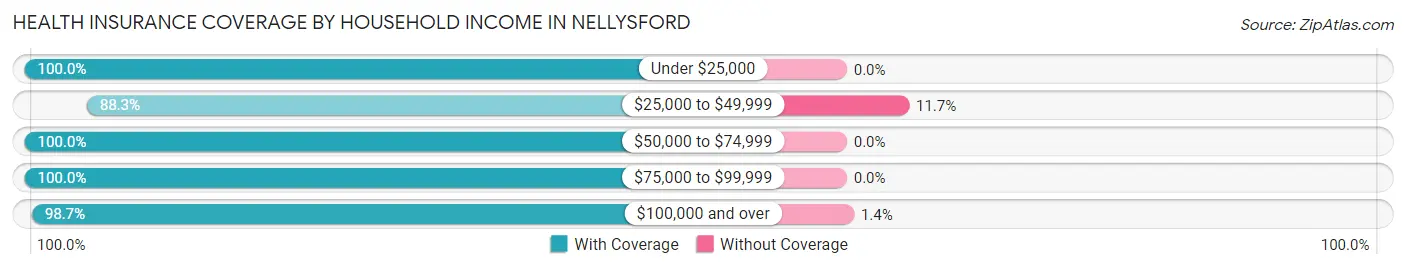
| Household Income | With Coverage | Without Coverage |
| Under $25,000 | 145 (100.0%) | 0 (0.0%) |
| $25,000 to $49,999 | 197 (88.3%) | 26 (11.7%) |
| $50,000 to $74,999 | 143 (100.0%) | 0 (0.0%) |
| $75,000 to $99,999 | 145 (100.0%) | 0 (0.0%) |
| $100,000 and over | 730 (98.7%) | 10 (1.3%) |
Public vs Private Health Insurance Coverage by Age in Nellysford
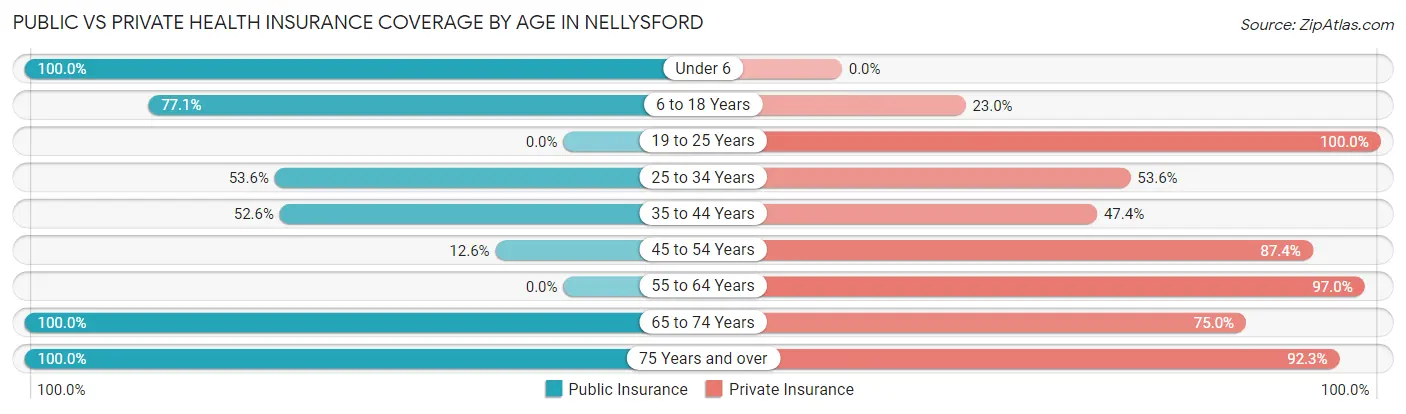
| Age Bracket | Public Insurance | Private Insurance |
| Under 6 | 41 (100.0%) | 0 (0.0%) |
| 6 to 18 Years | 47 (77.0%) | 14 (23.0%) |
| 19 to 25 Years | 0 (0.0%) | 35 (100.0%) |
| 25 to 34 Years | 30 (53.6%) | 30 (53.6%) |
| 35 to 44 Years | 30 (52.6%) | 27 (47.4%) |
| 45 to 54 Years | 14 (12.6%) | 97 (87.4%) |
| 55 to 64 Years | 0 (0.0%) | 324 (97.0%) |
| 65 to 74 Years | 336 (100.0%) | 252 (75.0%) |
| 75 Years and over | 365 (100.0%) | 337 (92.3%) |
| Total | 863 (61.8%) | 1,116 (79.9%) |
Disability Status by Sex by Age in Nellysford
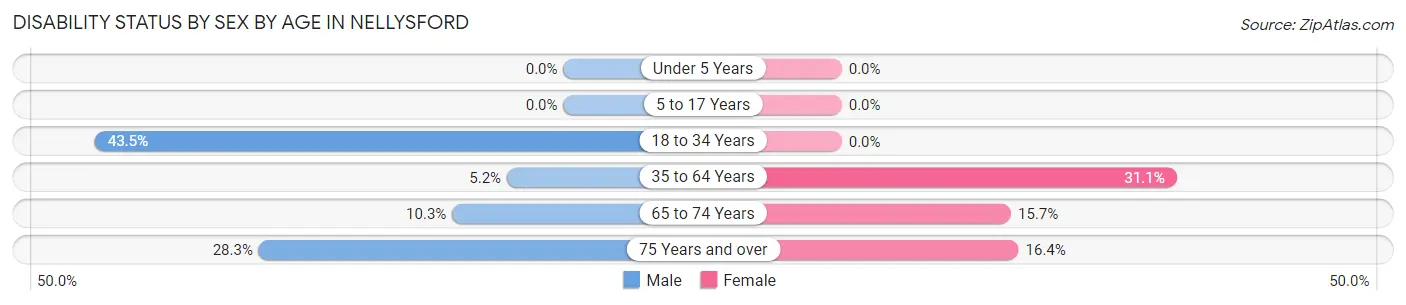
| Age Bracket | Male | Female |
| Under 5 Years | 0 (0.0%) | 0 (0.0%) |
| 5 to 17 Years | 0 (0.0%) | 0 (0.0%) |
| 18 to 34 Years | 30 (43.5%) | 0 (0.0%) |
| 35 to 64 Years | 14 (5.2%) | 73 (31.1%) |
| 65 to 74 Years | 13 (10.3%) | 33 (15.7%) |
| 75 Years and over | 67 (28.3%) | 21 (16.4%) |
Disability Class by Sex by Age in Nellysford
Disability Class: Hearing Difficulty
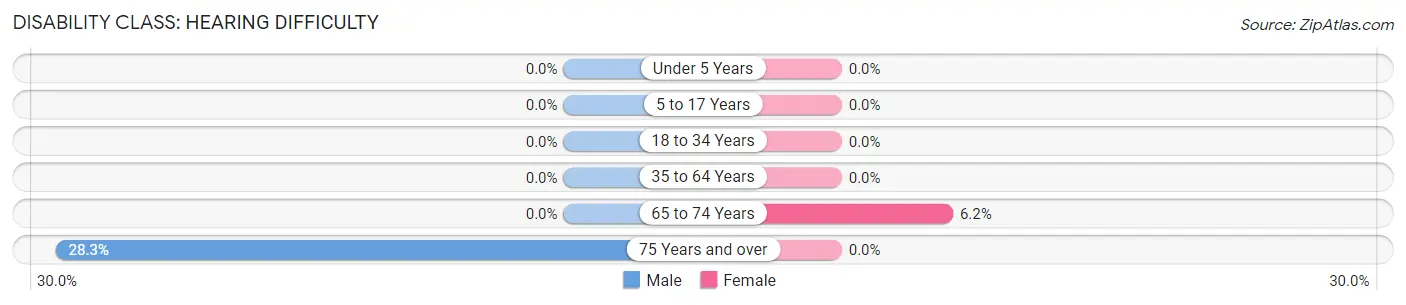
| Age Bracket | Male | Female |
| Under 5 Years | 0 (0.0%) | 0 (0.0%) |
| 5 to 17 Years | 0 (0.0%) | 0 (0.0%) |
| 18 to 34 Years | 0 (0.0%) | 0 (0.0%) |
| 35 to 64 Years | 0 (0.0%) | 0 (0.0%) |
| 65 to 74 Years | 0 (0.0%) | 13 (6.2%) |
| 75 Years and over | 67 (28.3%) | 0 (0.0%) |
Disability Class: Vision Difficulty
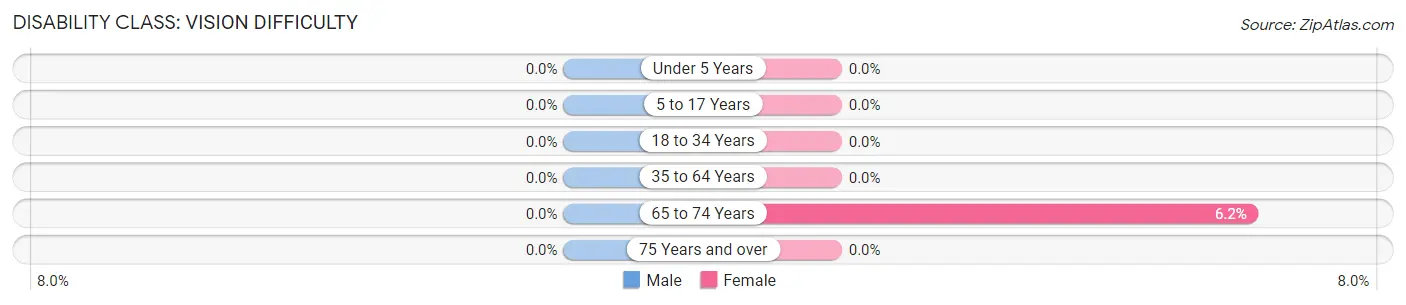
| Age Bracket | Male | Female |
| Under 5 Years | 0 (0.0%) | 0 (0.0%) |
| 5 to 17 Years | 0 (0.0%) | 0 (0.0%) |
| 18 to 34 Years | 0 (0.0%) | 0 (0.0%) |
| 35 to 64 Years | 0 (0.0%) | 0 (0.0%) |
| 65 to 74 Years | 0 (0.0%) | 13 (6.2%) |
| 75 Years and over | 0 (0.0%) | 0 (0.0%) |
Disability Class: Cognitive Difficulty
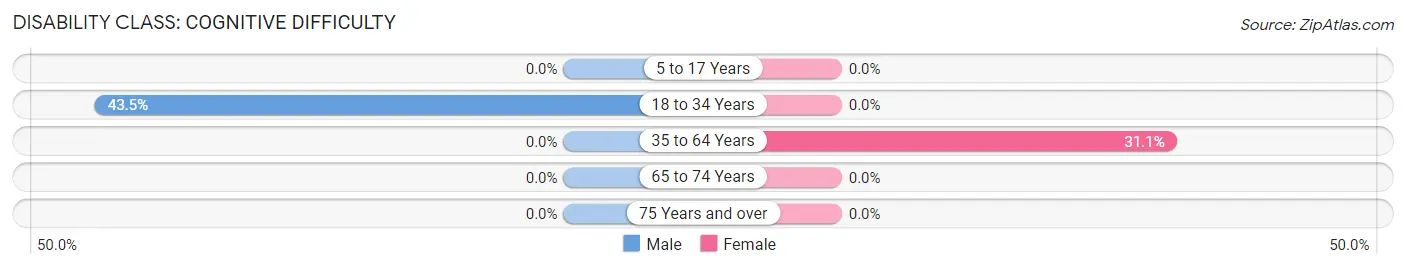
| Age Bracket | Male | Female |
| 5 to 17 Years | 0 (0.0%) | 0 (0.0%) |
| 18 to 34 Years | 30 (43.5%) | 0 (0.0%) |
| 35 to 64 Years | 0 (0.0%) | 73 (31.1%) |
| 65 to 74 Years | 0 (0.0%) | 0 (0.0%) |
| 75 Years and over | 0 (0.0%) | 0 (0.0%) |
Disability Class: Ambulatory Difficulty
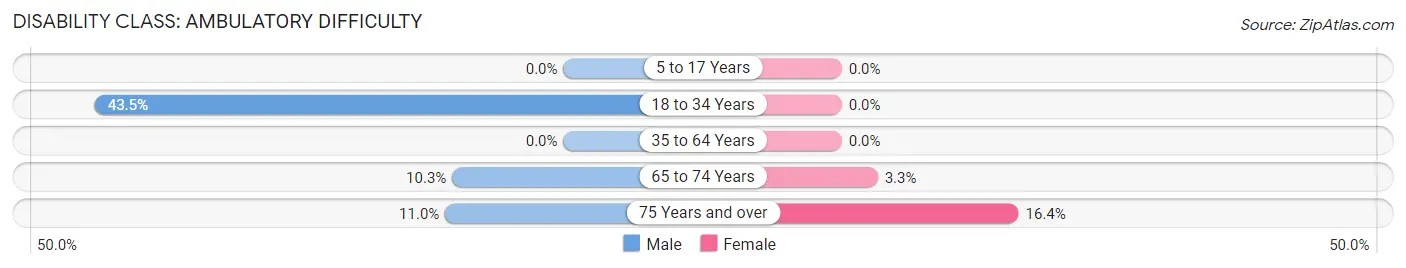
| Age Bracket | Male | Female |
| 5 to 17 Years | 0 (0.0%) | 0 (0.0%) |
| 18 to 34 Years | 30 (43.5%) | 0 (0.0%) |
| 35 to 64 Years | 0 (0.0%) | 0 (0.0%) |
| 65 to 74 Years | 13 (10.3%) | 7 (3.3%) |
| 75 Years and over | 26 (11.0%) | 21 (16.4%) |
Disability Class: Self-Care Difficulty
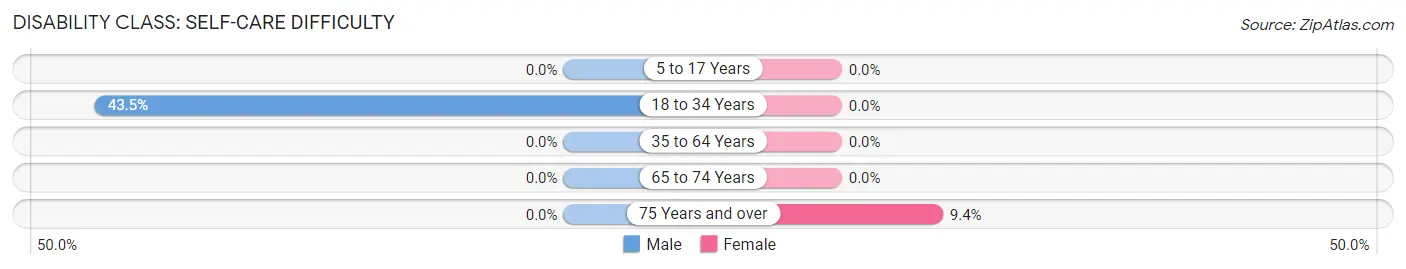
| Age Bracket | Male | Female |
| 5 to 17 Years | 0 (0.0%) | 0 (0.0%) |
| 18 to 34 Years | 30 (43.5%) | 0 (0.0%) |
| 35 to 64 Years | 0 (0.0%) | 0 (0.0%) |
| 65 to 74 Years | 0 (0.0%) | 0 (0.0%) |
| 75 Years and over | 0 (0.0%) | 12 (9.4%) |
Technology Access in Nellysford
Computing Device Access in Nellysford
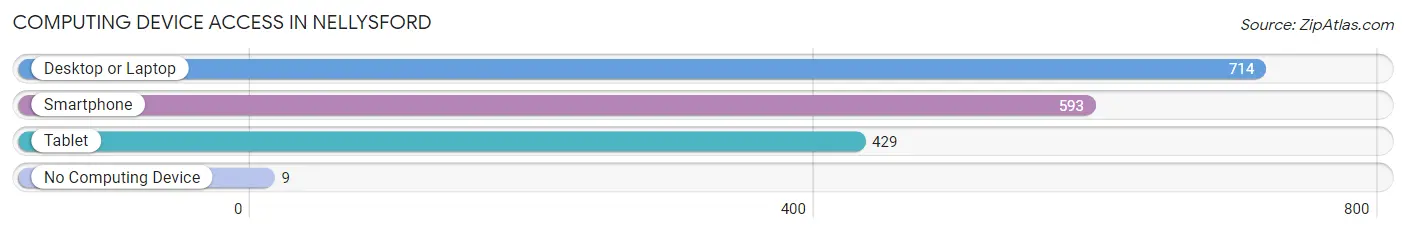
| Device Type | # Households | % Households |
| Desktop or Laptop | 714 | 98.8% |
| Smartphone | 593 | 82.0% |
| Tablet | 429 | 59.3% |
| No Computing Device | 9 | 1.2% |
| Total | 723 | 100.0% |
Internet Access in Nellysford
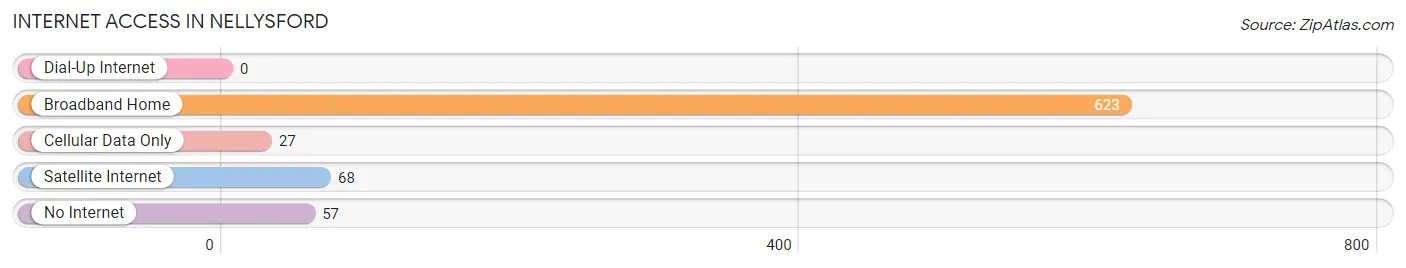
| Internet Type | # Households | % Households |
| Dial-Up Internet | 0 | 0.0% |
| Broadband Home | 623 | 86.2% |
| Cellular Data Only | 27 | 3.7% |
| Satellite Internet | 68 | 9.4% |
| No Internet | 57 | 7.9% |
| Total | 723 | 100.0% |
Nellysford Summary
Nellysford is an unincorporated community located in Nelson County, Virginia, United States. It is situated in the foothills of the Blue Ridge Mountains, and is part of the Charlottesville Metropolitan Statistical Area. The population of Nellysford was estimated to be 1,845 in 2019.
History
Nellysford was first settled in the late 1700s by the Nellys family, who were of English descent. The town was named after the family, and the area was known as Nellysford until the late 1800s when the name was changed to Nellysford. The town was officially incorporated in 1891.
The town was a popular destination for tourists in the early 1900s, and was home to several resorts and hotels. The town was also home to a number of businesses, including a general store, a post office, a blacksmith shop, and a sawmill.
In the mid-1900s, the town began to decline as the popularity of the resorts and hotels decreased. The town was also affected by the Great Depression, and many of the businesses closed.
In the late 1900s, the town began to experience a resurgence in popularity as a tourist destination. The town is now home to several wineries, breweries, and distilleries, as well as a number of restaurants and shops.
Geography
Nellysford is located in the foothills of the Blue Ridge Mountains in Nelson County, Virginia. The town is situated at an elevation of 1,845 feet (562 meters) above sea level. The town is located near the intersection of US Route 29 and US Route 250.
The town is located within the George Washington National Forest, and is surrounded by the Blue Ridge Mountains. The town is also located near several popular outdoor recreation areas, including the Blue Ridge Parkway, the Appalachian Trail, and the Shenandoah National Park.
Economy
The economy of Nellysford is largely based on tourism. The town is home to several wineries, breweries, and distilleries, as well as a number of restaurants and shops. The town is also home to a number of bed and breakfasts, as well as a number of outdoor recreation areas.
The town is also home to a number of businesses, including a general store, a post office, a blacksmith shop, and a sawmill.
Demographics
As of the 2010 census, the population of Nellysford was 1,845. The racial makeup of the town was 95.3% White, 1.2% African American, 0.3% Native American, 0.7% Asian, 0.1% Pacific Islander, 0.7% from other races, and 1.9% from two or more races. Hispanic or Latino of any race were 2.2% of the population.
The median household income in Nellysford was $45,938, and the median family income was $50,938. The per capita income in Nellysford was $22,938. About 8.3% of families and 10.3% of the population were below the poverty line, including 14.3% of those under age 18 and 5.3% of those age 65 or over.
Common Questions
What is Per Capita Income in Nellysford?
Per Capita income in Nellysford is $75,348.
What is the Median Family Income in Nellysford?
Median Family Income in Nellysford is $139,375.
What is the Median Household income in Nellysford?
Median Household Income in Nellysford is $126,250.
What is Family Income Deficit in Nellysford?
Family Income Deficit in Nellysford is $10,520.
Families that are below poverty line in Nellysford earn $10,520 less on average than the poverty threshold level.
What is Inequality or Gini Index in Nellysford?
Inequality or Gini Index in Nellysford is 0.47.
What is the Total Population of Nellysford?
Total Population of Nellysford is 1,396.
What is the Total Male Population of Nellysford?
Total Male Population of Nellysford is 777.
What is the Total Female Population of Nellysford?
Total Female Population of Nellysford is 619.
What is the Ratio of Males per 100 Females in Nellysford?
There are 125.53 Males per 100 Females in Nellysford.
What is the Ratio of Females per 100 Males in Nellysford?
There are 79.67 Females per 100 Males in Nellysford.
What is the Median Population Age in Nellysford?
Median Population Age in Nellysford is 65.1 Years.
What is the Average Family Size in Nellysford
Average Family Size in Nellysford is 2.2 People.
What is the Average Household Size in Nellysford
Average Household Size in Nellysford is 1.9 People.
How Large is the Labor Force in Nellysford?
There are 436 People in the Labor Forcein in Nellysford.
What is the Percentage of People in the Labor Force in Nellysford?
33.7% of People are in the Labor Force in Nellysford.