Bailey s Crossroads, VA Map & Demographics
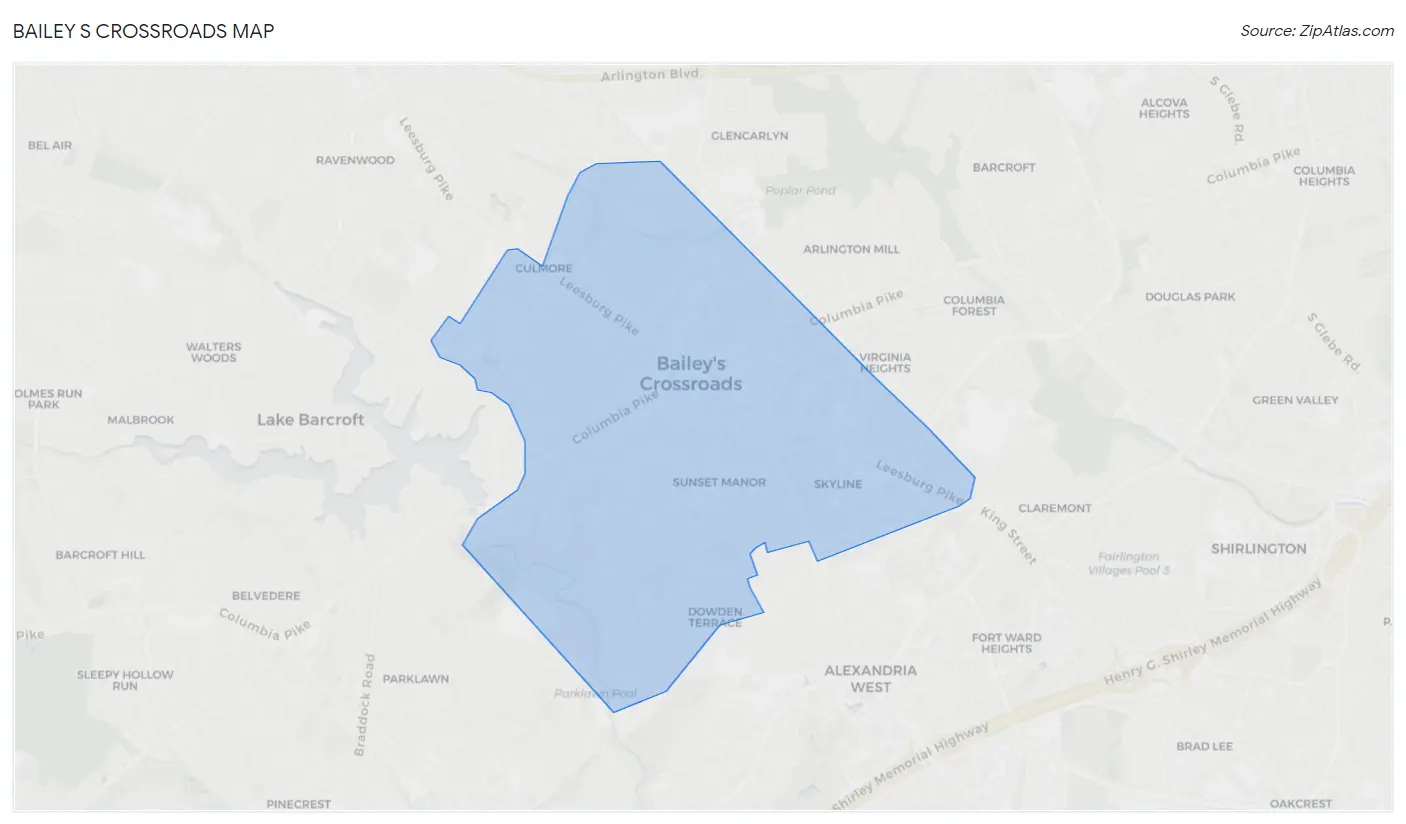
Bailey s Crossroads Map
Bailey s Crossroads Overview
$43,557
PER CAPITA INCOME
$75,948
AVG FAMILY INCOME
$78,286
AVG HOUSEHOLD INCOME
5.1%
WAGE / INCOME GAP [ % ]
94.9¢/ $1
WAGE / INCOME GAP [ $ ]
0.49
INEQUALITY / GINI INDEX
24,785
TOTAL POPULATION
13,022
MALE POPULATION
11,763
FEMALE POPULATION
110.70
MALES / 100 FEMALES
90.33
FEMALES / 100 MALES
33.9
MEDIAN AGE
3.5
AVG FAMILY SIZE
2.6
AVG HOUSEHOLD SIZE
13,007
LABOR FORCE [ PEOPLE ]
67.7%
PERCENT IN LABOR FORCE
7.3%
UNEMPLOYMENT RATE
Income in Bailey s Crossroads
Income Overview in Bailey s Crossroads
Per Capita Income in Bailey s Crossroads is $43,557, while median incomes of families and households are $75,948 and $78,286 respectively.
| Characteristic | Number | Measure |
| Per Capita Income | 24,785 | $43,557 |
| Median Family Income | 4,989 | $75,948 |
| Mean Family Income | 4,989 | $120,336 |
| Median Household Income | 9,545 | $78,286 |
| Mean Household Income | 9,545 | $110,589 |
| Income Deficit | 4,989 | $0 |
| Wage / Income Gap (%) | 24,785 | 5.11% |
| Wage / Income Gap ($) | 24,785 | 94.89¢ per $1 |
| Gini / Inequality Index | 24,785 | 0.49 |
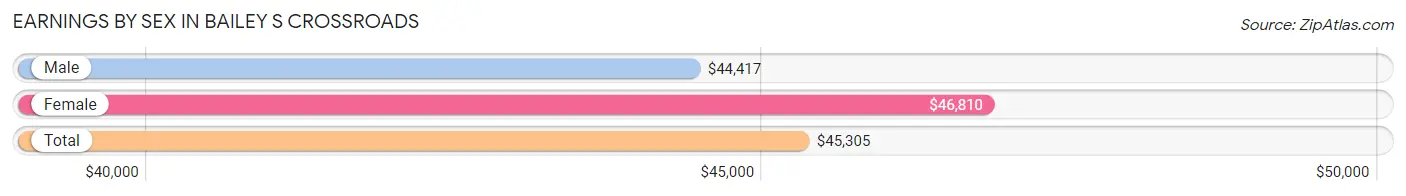
Earnings by Sex in Bailey s Crossroads
Average Earnings in Bailey s Crossroads are $45,305, $44,417 for men and $46,810 for women, a difference of 5.1%.
| Sex | Number | Average Earnings |
| Male | 7,720 (58.5%) | $44,417 |
| Female | 5,473 (41.5%) | $46,810 |
| Total | 13,193 (100.0%) | $45,305 |
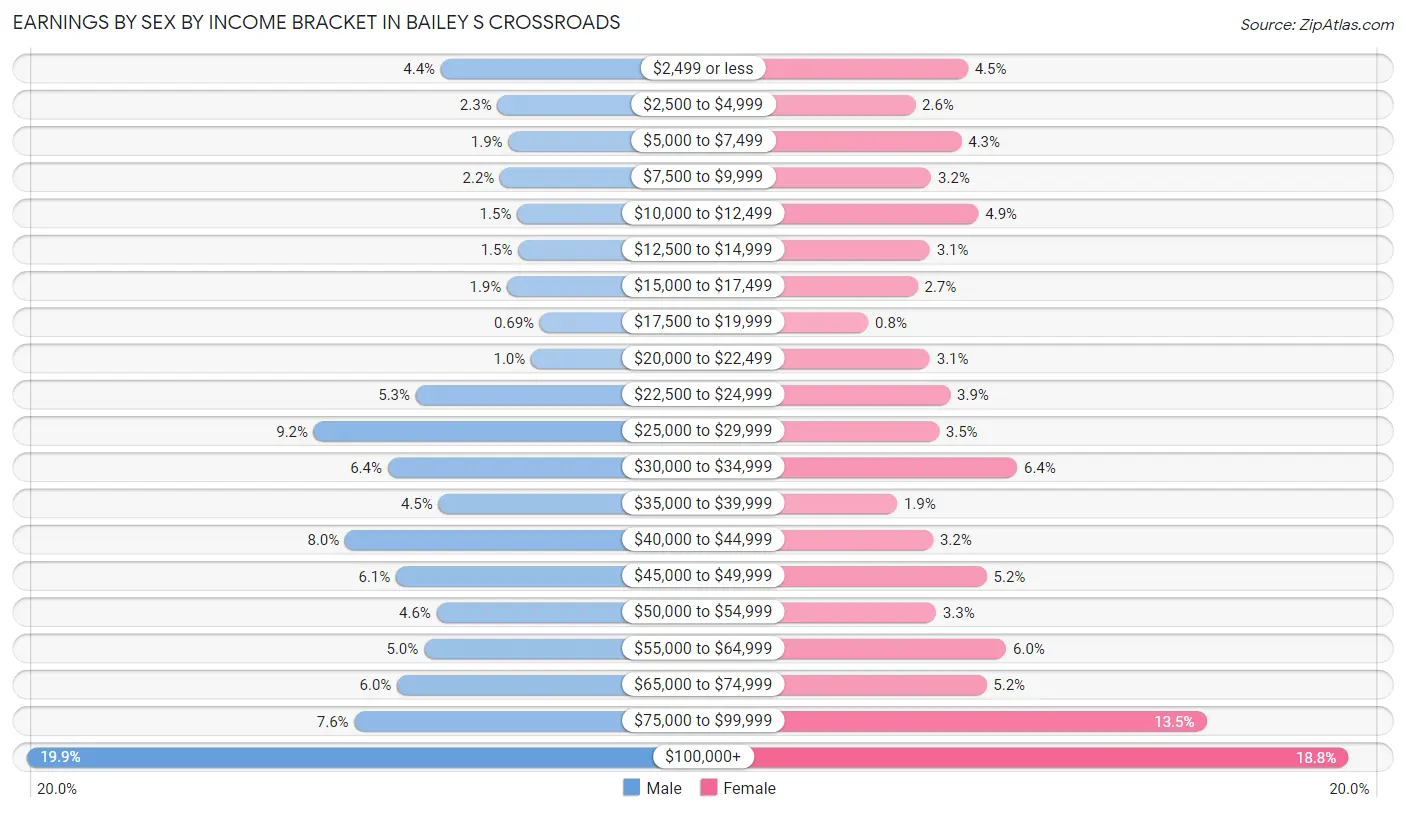
Earnings by Sex by Income Bracket in Bailey s Crossroads
The most common earnings brackets in Bailey s Crossroads are $100,000+ for men (1,536 | 19.9%) and $100,000+ for women (1,028 | 18.8%).
| Income | Male | Female |
| $2,499 or less | 340 (4.4%) | 248 (4.5%) |
| $2,500 to $4,999 | 176 (2.3%) | 140 (2.6%) |
| $5,000 to $7,499 | 144 (1.9%) | 235 (4.3%) |
| $7,500 to $9,999 | 168 (2.2%) | 173 (3.2%) |
| $10,000 to $12,499 | 119 (1.5%) | 270 (4.9%) |
| $12,500 to $14,999 | 116 (1.5%) | 170 (3.1%) |
| $15,000 to $17,499 | 148 (1.9%) | 145 (2.6%) |
| $17,500 to $19,999 | 53 (0.7%) | 44 (0.8%) |
| $20,000 to $22,499 | 79 (1.0%) | 170 (3.1%) |
| $22,500 to $24,999 | 412 (5.3%) | 212 (3.9%) |
| $25,000 to $29,999 | 707 (9.2%) | 189 (3.5%) |
| $30,000 to $34,999 | 493 (6.4%) | 349 (6.4%) |
| $35,000 to $39,999 | 347 (4.5%) | 103 (1.9%) |
| $40,000 to $44,999 | 617 (8.0%) | 177 (3.2%) |
| $45,000 to $49,999 | 469 (6.1%) | 287 (5.2%) |
| $50,000 to $54,999 | 352 (4.6%) | 183 (3.3%) |
| $55,000 to $64,999 | 388 (5.0%) | 327 (6.0%) |
| $65,000 to $74,999 | 466 (6.0%) | 286 (5.2%) |
| $75,000 to $99,999 | 590 (7.6%) | 737 (13.5%) |
| $100,000+ | 1,536 (19.9%) | 1,028 (18.8%) |
| Total | 7,720 (100.0%) | 5,473 (100.0%) |
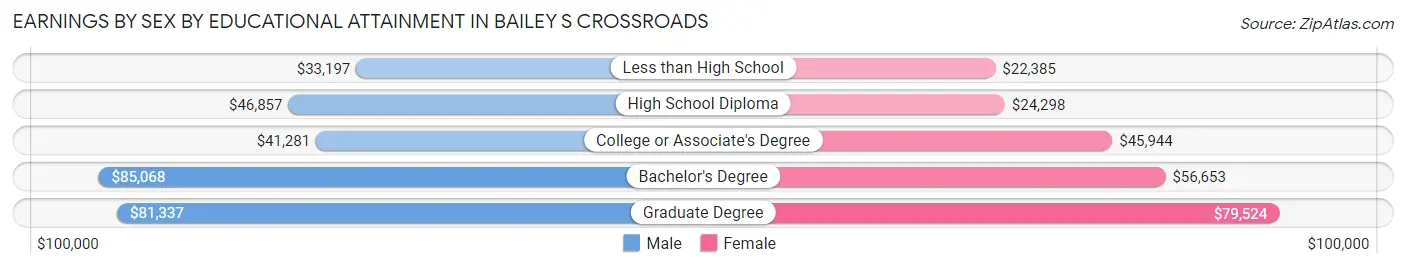
Earnings by Sex by Educational Attainment in Bailey s Crossroads
Average earnings in Bailey s Crossroads are $47,431 for men and $52,352 for women, a difference of 9.4%. Men with an educational attainment of bachelor's degree enjoy the highest average annual earnings of $85,068, while those with less than high school education earn the least with $33,197. Women with an educational attainment of graduate degree earn the most with the average annual earnings of $79,524, while those with less than high school education have the smallest earnings of $22,385.
| Educational Attainment | Male Income | Female Income |
| Less than High School | $33,197 | $22,385 |
| High School Diploma | $46,857 | $24,298 |
| College or Associate's Degree | $41,281 | $45,944 |
| Bachelor's Degree | $85,068 | $56,653 |
| Graduate Degree | $81,337 | $79,524 |
| Total | $47,431 | $52,352 |
Family Income in Bailey s Crossroads
Family Income Brackets in Bailey s Crossroads
According to the Bailey s Crossroads family income data, there are 798 families falling into the $100,000 to $149,999 income range, which is the most common income bracket and makes up 16.0% of all families. Conversely, the $15,000 to $24,999 income bracket is the least frequent group with only 165 families (3.3%) belonging to this category.
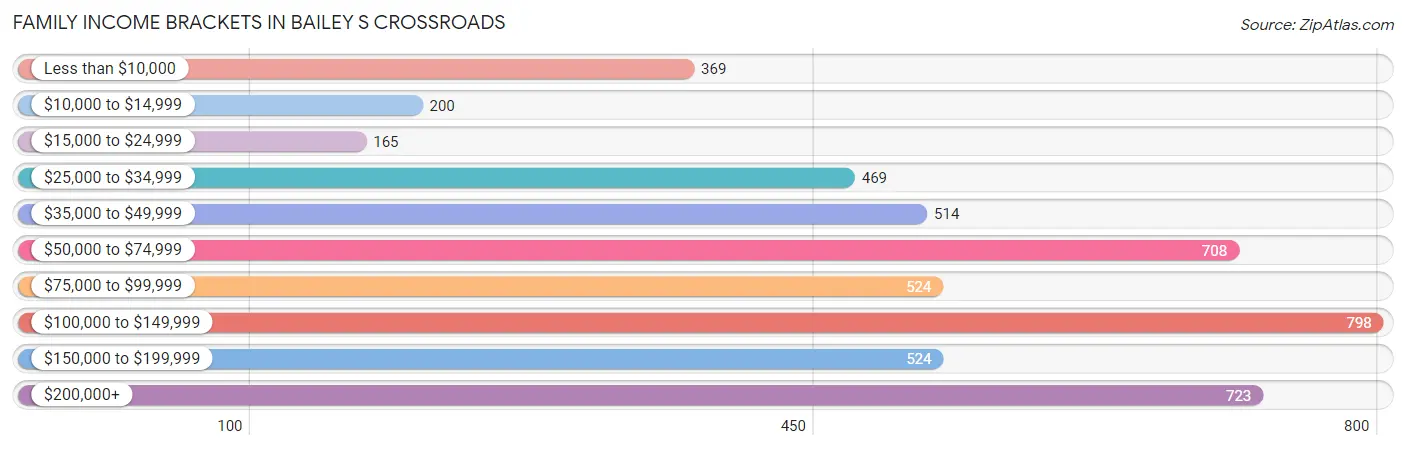
| Income Bracket | # Families | % Families |
| Less than $10,000 | 369 | 7.4% |
| $10,000 to $14,999 | 200 | 4.0% |
| $15,000 to $24,999 | 165 | 3.3% |
| $25,000 to $34,999 | 469 | 9.4% |
| $35,000 to $49,999 | 514 | 10.3% |
| $50,000 to $74,999 | 708 | 14.2% |
| $75,000 to $99,999 | 524 | 10.5% |
| $100,000 to $149,999 | 798 | 16.0% |
| $150,000 to $199,999 | 524 | 10.5% |
| $200,000+ | 723 | 14.5% |
Family Income by Famaliy Size in Bailey s Crossroads
2-person families (1,952 | 39.1%) account for the highest median family income in Bailey s Crossroads with $93,988 per family, while 2-person families (1,952 | 39.1%) have the highest median income of $46,994 per family member.
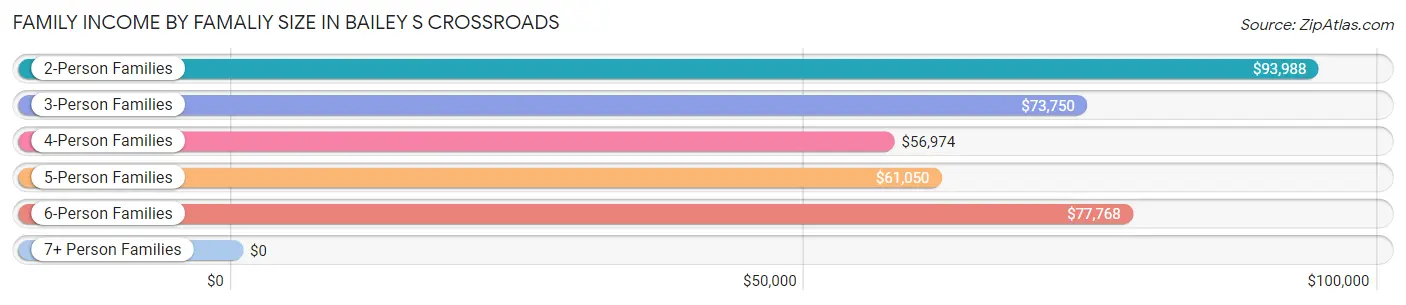
| Income Bracket | # Families | Median Income |
| 2-Person Families | 1,952 (39.1%) | $93,988 |
| 3-Person Families | 1,091 (21.9%) | $73,750 |
| 4-Person Families | 976 (19.6%) | $56,974 |
| 5-Person Families | 613 (12.3%) | $61,050 |
| 6-Person Families | 231 (4.6%) | $77,768 |
| 7+ Person Families | 126 (2.5%) | $0 |
| Total | 4,989 (100.0%) | $75,948 |
Family Income by Number of Earners in Bailey s Crossroads
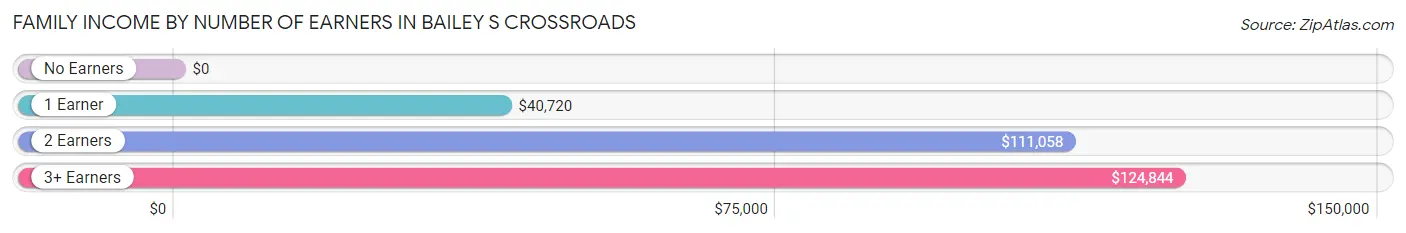
| Number of Earners | # Families | Median Income |
| No Earners | 498 (10.0%) | $0 |
| 1 Earner | 2,019 (40.5%) | $40,720 |
| 2 Earners | 2,029 (40.7%) | $111,058 |
| 3+ Earners | 443 (8.9%) | $124,844 |
| Total | 4,989 (100.0%) | $75,948 |
Household Income in Bailey s Crossroads
Household Income Brackets in Bailey s Crossroads
With 1,880 households falling in the category, the $100,000 to $149,999 income range is the most frequent in Bailey s Crossroads, accounting for 19.7% of all households. In contrast, only 334 households (3.5%) fall into the $10,000 to $14,999 income bracket, making it the least populous group.
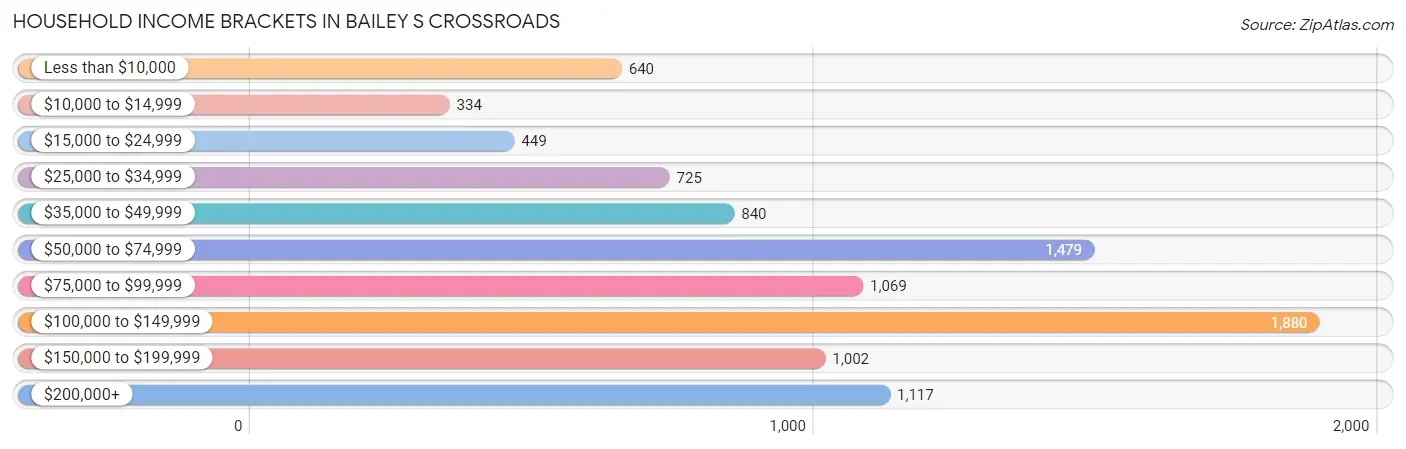
| Income Bracket | # Households | % Households |
| Less than $10,000 | 640 | 6.7% |
| $10,000 to $14,999 | 334 | 3.5% |
| $15,000 to $24,999 | 449 | 4.7% |
| $25,000 to $34,999 | 725 | 7.6% |
| $35,000 to $49,999 | 840 | 8.8% |
| $50,000 to $74,999 | 1,479 | 15.5% |
| $75,000 to $99,999 | 1,069 | 11.2% |
| $100,000 to $149,999 | 1,880 | 19.7% |
| $150,000 to $199,999 | 1,002 | 10.5% |
| $200,000+ | 1,117 | 11.7% |
Household Income by Householder Age in Bailey s Crossroads
The median household income in Bailey s Crossroads is $78,286, with the highest median household income of $86,106 found in the 25 to 44 years age bracket for the primary householder. A total of 4,083 households (42.8%) fall into this category. Meanwhile, the 15 to 24 years age bracket for the primary householder has the lowest median household income of $0, with 215 households (2.2%) in this group.
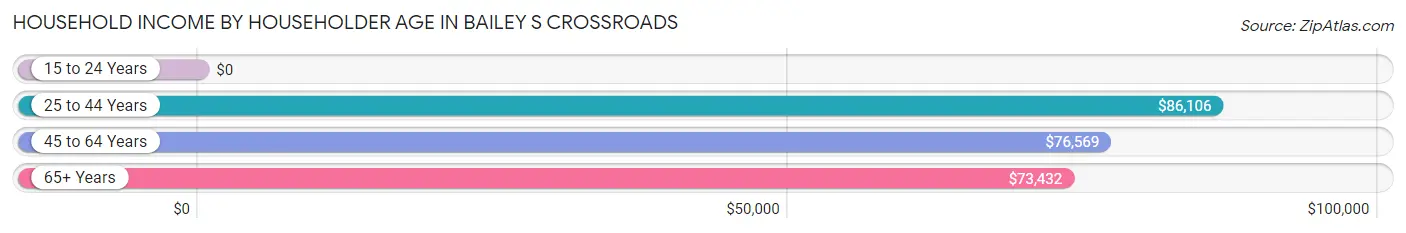
| Income Bracket | # Households | Median Income |
| 15 to 24 Years | 215 (2.2%) | $0 |
| 25 to 44 Years | 4,083 (42.8%) | $86,106 |
| 45 to 64 Years | 2,920 (30.6%) | $76,569 |
| 65+ Years | 2,327 (24.4%) | $73,432 |
| Total | 9,545 (100.0%) | $78,286 |
Poverty in Bailey s Crossroads
Income Below Poverty by Sex and Age in Bailey s Crossroads
With 18.8% poverty level for males and 24.2% for females among the residents of Bailey s Crossroads, 15 year old males and 5 year old females are the most vulnerable to poverty, with 87 males (75.0%) and 71 females (67.6%) in their respective age groups living below the poverty level.
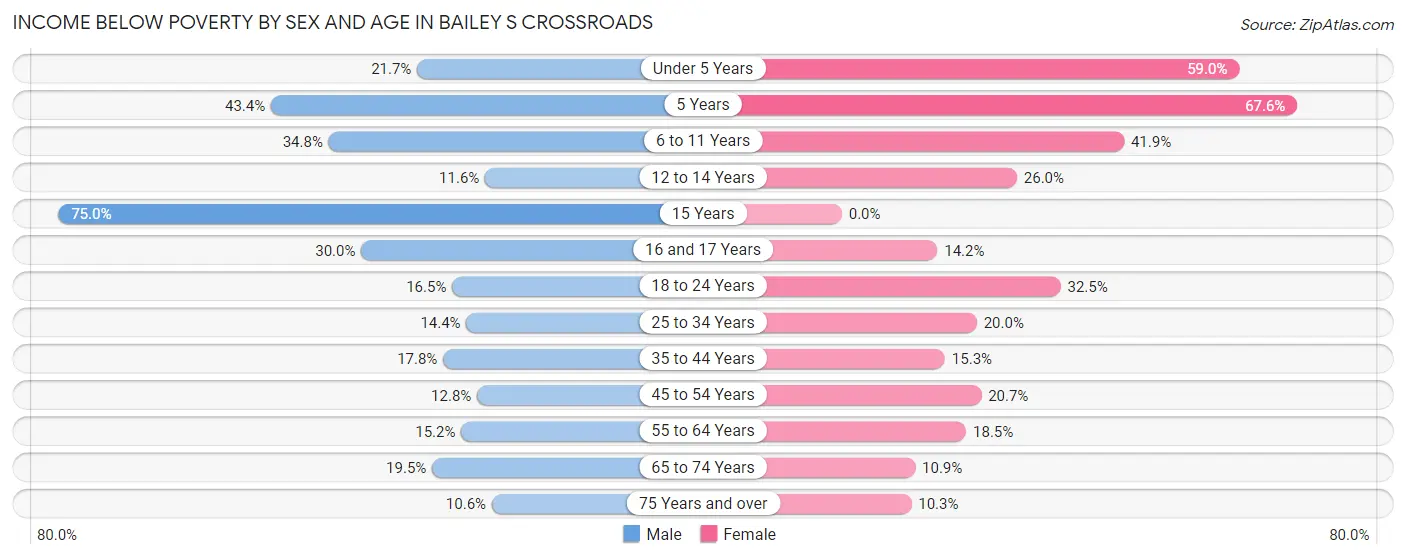
| Age Bracket | Male | Female |
| Under 5 Years | 302 (21.7%) | 583 (59.0%) |
| 5 Years | 69 (43.4%) | 71 (67.6%) |
| 6 to 11 Years | 402 (34.8%) | 393 (41.9%) |
| 12 to 14 Years | 44 (11.6%) | 65 (26.0%) |
| 15 Years | 87 (75.0%) | 0 (0.0%) |
| 16 and 17 Years | 69 (30.0%) | 40 (14.2%) |
| 18 to 24 Years | 163 (16.5%) | 267 (32.5%) |
| 25 to 34 Years | 422 (14.4%) | 415 (20.0%) |
| 35 to 44 Years | 330 (17.8%) | 203 (15.3%) |
| 45 to 54 Years | 172 (12.8%) | 308 (20.7%) |
| 55 to 64 Years | 145 (15.1%) | 290 (18.5%) |
| 65 to 74 Years | 164 (19.5%) | 87 (10.9%) |
| 75 Years and over | 71 (10.6%) | 105 (10.3%) |
| Total | 2,440 (18.8%) | 2,827 (24.2%) |
Income Above Poverty by Sex and Age in Bailey s Crossroads
According to the poverty statistics in Bailey s Crossroads, males aged 75 years and over and females aged 15 years are the age groups that are most secure financially, with 89.4% of males and 100.0% of females in these age groups living above the poverty line.
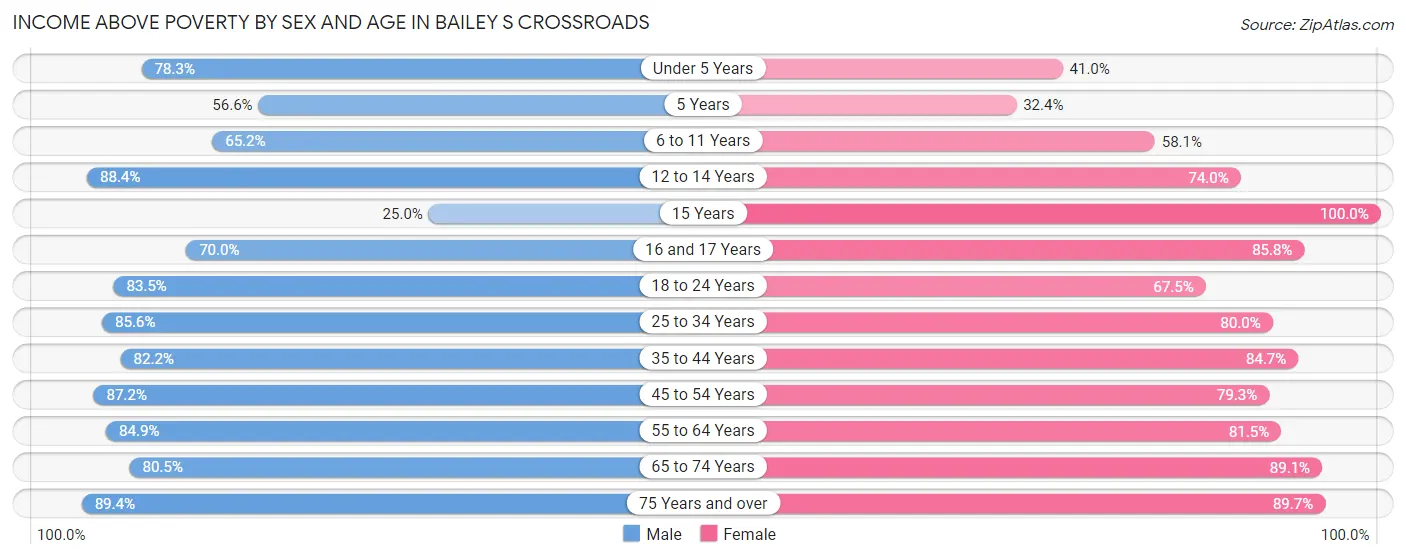
| Age Bracket | Male | Female |
| Under 5 Years | 1,090 (78.3%) | 405 (41.0%) |
| 5 Years | 90 (56.6%) | 34 (32.4%) |
| 6 to 11 Years | 752 (65.2%) | 545 (58.1%) |
| 12 to 14 Years | 335 (88.4%) | 185 (74.0%) |
| 15 Years | 29 (25.0%) | 42 (100.0%) |
| 16 and 17 Years | 161 (70.0%) | 242 (85.8%) |
| 18 to 24 Years | 825 (83.5%) | 555 (67.5%) |
| 25 to 34 Years | 2,510 (85.6%) | 1,656 (80.0%) |
| 35 to 44 Years | 1,520 (82.2%) | 1,123 (84.7%) |
| 45 to 54 Years | 1,172 (87.2%) | 1,180 (79.3%) |
| 55 to 64 Years | 812 (84.9%) | 1,281 (81.5%) |
| 65 to 74 Years | 678 (80.5%) | 712 (89.1%) |
| 75 Years and over | 598 (89.4%) | 912 (89.7%) |
| Total | 10,572 (81.2%) | 8,872 (75.8%) |
Income Below Poverty Among Married-Couple Families in Bailey s Crossroads
The poverty statistics for married-couple families in Bailey s Crossroads show that 16.4% or 569 of the total 3,473 families live below the poverty line. Families with 5 or more children have the highest poverty rate of 76.9%, comprising of 30 families. On the other hand, families with no children have the lowest poverty rate of 10.8%, which includes 182 families.
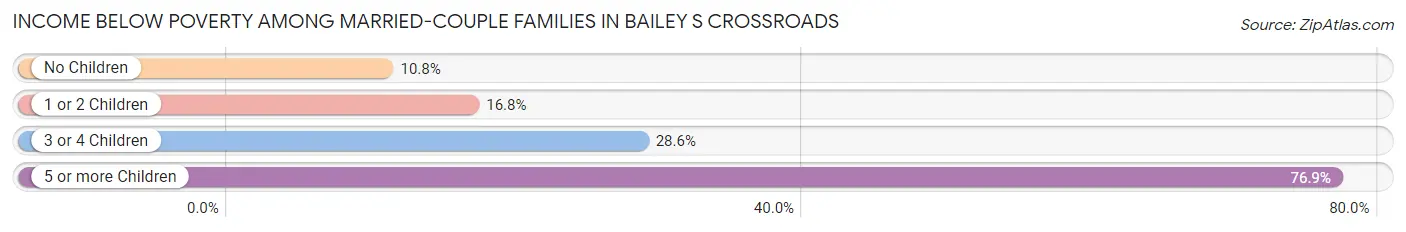
| Children | Above Poverty | Below Poverty |
| No Children | 1,498 (89.2%) | 182 (10.8%) |
| 1 or 2 Children | 1,020 (83.2%) | 206 (16.8%) |
| 3 or 4 Children | 377 (71.4%) | 151 (28.6%) |
| 5 or more Children | 9 (23.1%) | 30 (76.9%) |
| Total | 2,904 (83.6%) | 569 (16.4%) |
Income Below Poverty Among Single-Parent Households in Bailey s Crossroads
According to the poverty data in Bailey s Crossroads, 12.6% or 69 single-father households and 36.8% or 356 single-mother households are living below the poverty line. Among single-father households, those with 3 or 4 children have the highest poverty rate, with 52 households (57.1%) experiencing poverty. Likewise, among single-mother households, those with 3 or 4 children have the highest poverty rate, with 226 households (93.4%) falling below the poverty line.
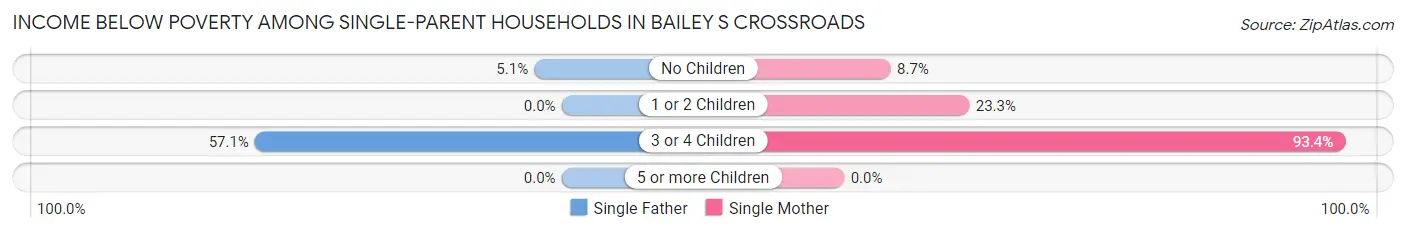
| Children | Single Father | Single Mother |
| No Children | 17 (5.1%) | 23 (8.6%) |
| 1 or 2 Children | 0 (0.0%) | 107 (23.3%) |
| 3 or 4 Children | 52 (57.1%) | 226 (93.4%) |
| 5 or more Children | 0 (0.0%) | 0 (0.0%) |
| Total | 69 (12.6%) | 356 (36.8%) |
Income Below Poverty Among Married-Couple vs Single-Parent Households in Bailey s Crossroads
The poverty data for Bailey s Crossroads shows that 569 of the married-couple family households (16.4%) and 425 of the single-parent households (28.0%) are living below the poverty level. Within the married-couple family households, those with 5 or more children have the highest poverty rate, with 30 households (76.9%) falling below the poverty line. Among the single-parent households, those with 3 or 4 children have the highest poverty rate, with 278 household (83.5%) living below poverty.
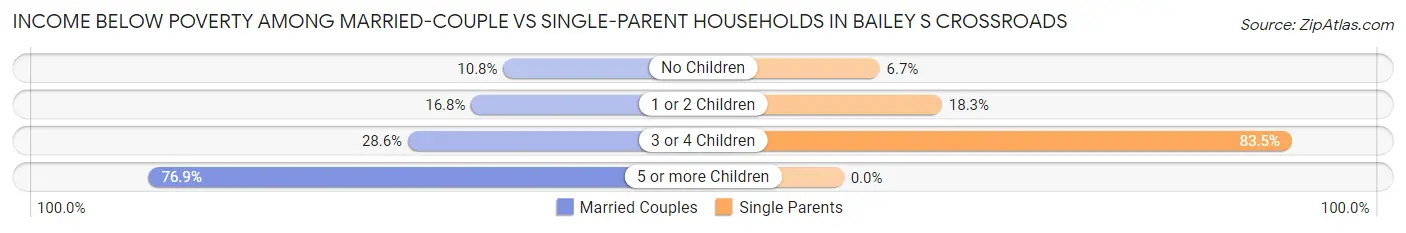
| Children | Married-Couple Families | Single-Parent Households |
| No Children | 182 (10.8%) | 40 (6.7%) |
| 1 or 2 Children | 206 (16.8%) | 107 (18.3%) |
| 3 or 4 Children | 151 (28.6%) | 278 (83.5%) |
| 5 or more Children | 30 (76.9%) | 0 (0.0%) |
| Total | 569 (16.4%) | 425 (28.0%) |
Race in Bailey s Crossroads
The most populous races in Bailey s Crossroads are Hispanic or Latino (8,396 | 33.9%), White / Caucasian (8,025 | 32.4%), and Some other Race (6,112 | 24.7%).
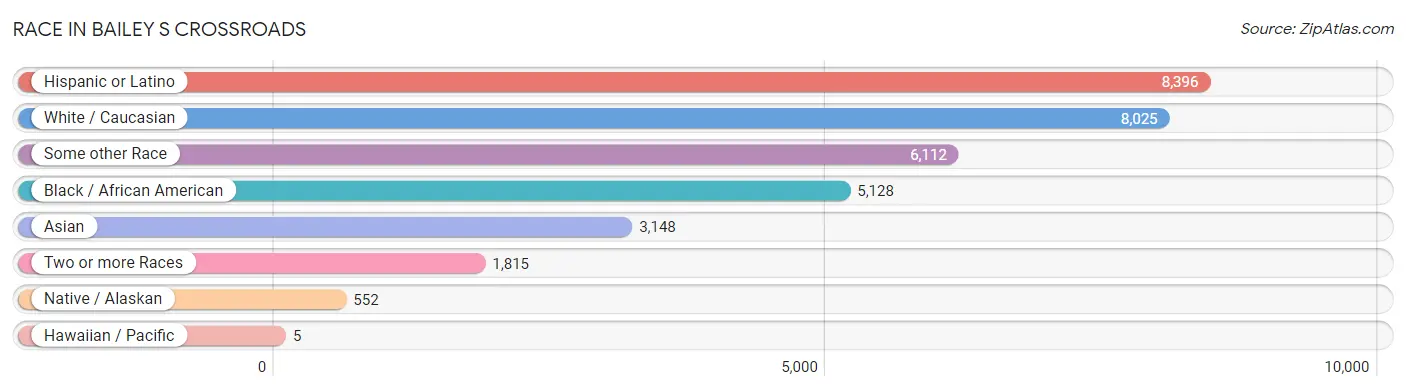
| Race | # Population | % Population |
| Asian | 3,148 | 12.7% |
| Black / African American | 5,128 | 20.7% |
| Hawaiian / Pacific | 5 | 0.0% |
| Hispanic or Latino | 8,396 | 33.9% |
| Native / Alaskan | 552 | 2.2% |
| White / Caucasian | 8,025 | 32.4% |
| Two or more Races | 1,815 | 7.3% |
| Some other Race | 6,112 | 24.7% |
| Total | 24,785 | 100.0% |
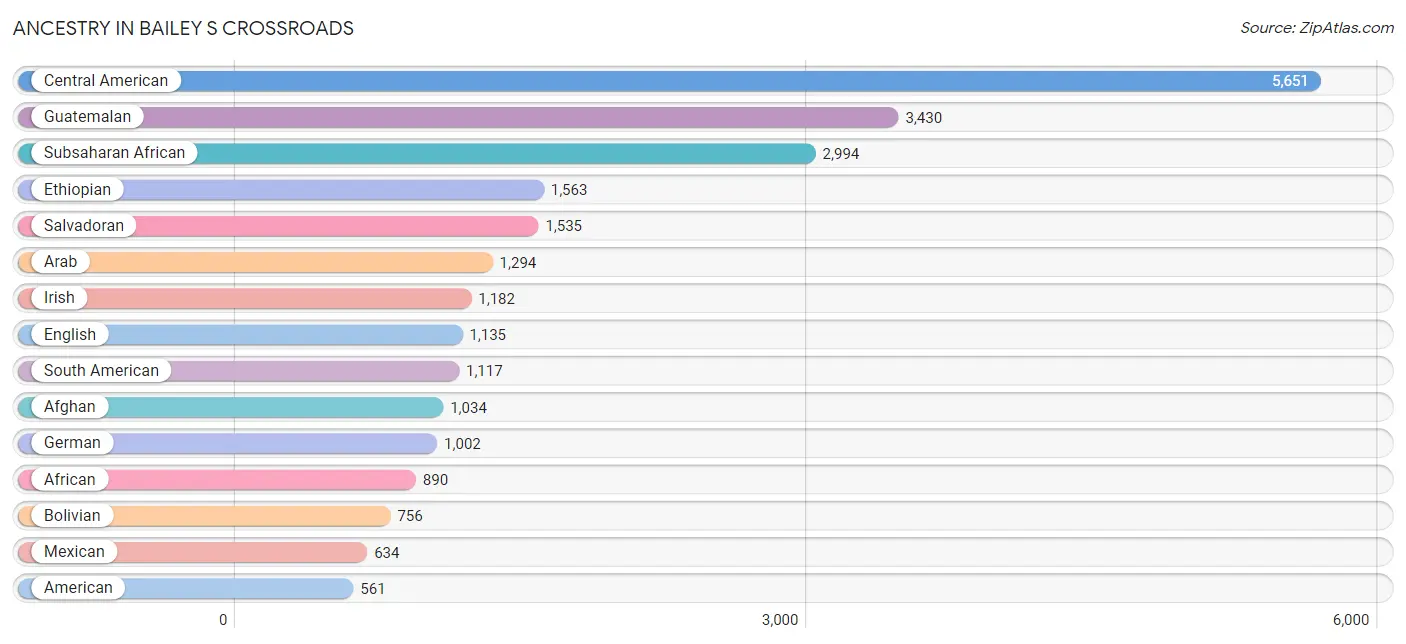
Ancestry in Bailey s Crossroads
The most populous ancestries reported in Bailey s Crossroads are Central American (5,651 | 22.8%), Guatemalan (3,430 | 13.8%), Subsaharan African (2,994 | 12.1%), Ethiopian (1,563 | 6.3%), and Salvadoran (1,535 | 6.2%), together accounting for 61.2% of all Bailey s Crossroads residents.
| Ancestry | # Population | % Population |
| Afghan | 1,034 | 4.2% |
| African | 890 | 3.6% |
| American | 561 | 2.3% |
| Arab | 1,294 | 5.2% |
| Argentinean | 130 | 0.5% |
| Armenian | 136 | 0.5% |
| Bhutanese | 47 | 0.2% |
| Bolivian | 756 | 3.0% |
| Brazilian | 49 | 0.2% |
| British | 102 | 0.4% |
| Burmese | 153 | 0.6% |
| Cambodian | 36 | 0.2% |
| Central American | 5,651 | 22.8% |
| Central American Indian | 466 | 1.9% |
| Cherokee | 131 | 0.5% |
| Chickasaw | 10 | 0.0% |
| Chilean | 61 | 0.3% |
| Colombian | 16 | 0.1% |
| Costa Rican | 81 | 0.3% |
| Cuban | 52 | 0.2% |
| Czech | 45 | 0.2% |
| Danish | 80 | 0.3% |
| Dominican | 5 | 0.0% |
| Dutch | 99 | 0.4% |
| Eastern European | 77 | 0.3% |
| Ecuadorian | 24 | 0.1% |
| Egyptian | 87 | 0.4% |
| English | 1,135 | 4.6% |
| Ethiopian | 1,563 | 6.3% |
| European | 365 | 1.5% |
| Filipino | 35 | 0.1% |
| French | 122 | 0.5% |
| French Canadian | 24 | 0.1% |
| German | 1,002 | 4.0% |
| Ghanaian | 51 | 0.2% |
| Greek | 41 | 0.2% |
| Guamanian / Chamorro | 12 | 0.1% |
| Guatemalan | 3,430 | 13.8% |
| Guyanese | 14 | 0.1% |
| Haitian | 20 | 0.1% |
| Honduran | 533 | 2.1% |
| Hungarian | 96 | 0.4% |
| Indian (Asian) | 227 | 0.9% |
| Inupiat | 22 | 0.1% |
| Iranian | 22 | 0.1% |
| Iraqi | 128 | 0.5% |
| Irish | 1,182 | 4.8% |
| Iroquois | 62 | 0.3% |
| Italian | 519 | 2.1% |
| Jamaican | 90 | 0.4% |
| Japanese | 236 | 0.9% |
| Korean | 376 | 1.5% |
| Laotian | 10 | 0.0% |
| Lebanese | 36 | 0.2% |
| Lithuanian | 11 | 0.0% |
| Mexican | 634 | 2.6% |
| Moroccan | 453 | 1.8% |
| Nicaraguan | 72 | 0.3% |
| Northern European | 28 | 0.1% |
| Norwegian | 87 | 0.4% |
| Pakistani | 82 | 0.3% |
| Palestinian | 161 | 0.6% |
| Peruvian | 109 | 0.4% |
| Polish | 341 | 1.4% |
| Portuguese | 51 | 0.2% |
| Puerto Rican | 82 | 0.3% |
| Russian | 63 | 0.3% |
| Salvadoran | 1,535 | 6.2% |
| Scandinavian | 9 | 0.0% |
| Scotch-Irish | 111 | 0.4% |
| Scottish | 277 | 1.1% |
| Sierra Leonean | 72 | 0.3% |
| Slavic | 166 | 0.7% |
| Slovak | 26 | 0.1% |
| Somali | 107 | 0.4% |
| South African | 23 | 0.1% |
| South American | 1,117 | 4.5% |
| Spaniard | 27 | 0.1% |
| Sri Lankan | 212 | 0.9% |
| Subsaharan African | 2,994 | 12.1% |
| Sudanese | 274 | 1.1% |
| Swedish | 63 | 0.3% |
| Swiss | 10 | 0.0% |
| Syrian | 10 | 0.0% |
| Thai | 388 | 1.6% |
| Turkish | 67 | 0.3% |
| Ukrainian | 31 | 0.1% |
| Venezuelan | 21 | 0.1% |
| Vietnamese | 61 | 0.3% |
| Welsh | 140 | 0.6% |
| Yugoslavian | 11 | 0.0% | View All 91 Rows |
Immigrants in Bailey s Crossroads
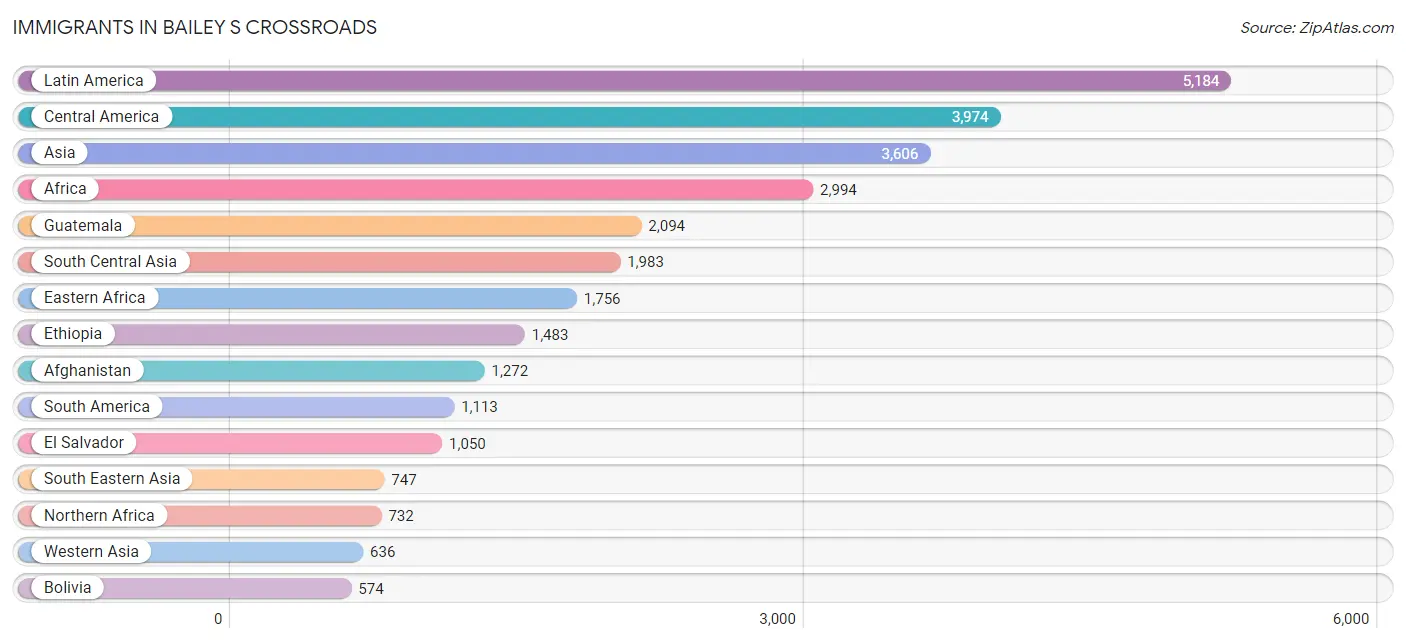
The most numerous immigrant groups reported in Bailey s Crossroads came from Latin America (5,184 | 20.9%), Central America (3,974 | 16.0%), Asia (3,606 | 14.5%), Africa (2,994 | 12.1%), and Guatemala (2,094 | 8.5%), together accounting for 72.0% of all Bailey s Crossroads residents.
| Immigration Origin | # Population | % Population |
| Afghanistan | 1,272 | 5.1% |
| Africa | 2,994 | 12.1% |
| Argentina | 81 | 0.3% |
| Armenia | 23 | 0.1% |
| Asia | 3,606 | 14.5% |
| Australia | 18 | 0.1% |
| Austria | 10 | 0.0% |
| Bangladesh | 74 | 0.3% |
| Bolivia | 574 | 2.3% |
| Bosnia and Herzegovina | 11 | 0.0% |
| Brazil | 49 | 0.2% |
| Cambodia | 181 | 0.7% |
| Canada | 80 | 0.3% |
| Caribbean | 97 | 0.4% |
| Central America | 3,974 | 16.0% |
| Chile | 73 | 0.3% |
| China | 96 | 0.4% |
| Colombia | 16 | 0.1% |
| Congo | 32 | 0.1% |
| Costa Rica | 81 | 0.3% |
| Cuba | 77 | 0.3% |
| Eastern Africa | 1,756 | 7.1% |
| Eastern Asia | 185 | 0.7% |
| Eastern Europe | 106 | 0.4% |
| Ecuador | 24 | 0.1% |
| Egypt | 130 | 0.5% |
| El Salvador | 1,050 | 4.2% |
| Eritrea | 157 | 0.6% |
| Ethiopia | 1,483 | 6.0% |
| Europe | 254 | 1.0% |
| Germany | 32 | 0.1% |
| Ghana | 102 | 0.4% |
| Greece | 10 | 0.0% |
| Guatemala | 2,094 | 8.5% |
| Guyana | 45 | 0.2% |
| Haiti | 20 | 0.1% |
| Honduras | 475 | 1.9% |
| Hong Kong | 10 | 0.0% |
| India | 317 | 1.3% |
| Indonesia | 10 | 0.0% |
| Iran | 17 | 0.1% |
| Iraq | 153 | 0.6% |
| Israel | 14 | 0.1% |
| Japan | 10 | 0.0% |
| Jordan | 29 | 0.1% |
| Kazakhstan | 13 | 0.1% |
| Kenya | 10 | 0.0% |
| Korea | 79 | 0.3% |
| Kuwait | 9 | 0.0% |
| Latin America | 5,184 | 20.9% |
| Lebanon | 57 | 0.2% |
| Mexico | 202 | 0.8% |
| Middle Africa | 76 | 0.3% |
| Morocco | 250 | 1.0% |
| Nepal | 142 | 0.6% |
| Nicaragua | 72 | 0.3% |
| Northern Africa | 732 | 2.9% |
| Northern Europe | 54 | 0.2% |
| Oceania | 18 | 0.1% |
| Pakistan | 112 | 0.4% |
| Peru | 230 | 0.9% |
| Philippines | 291 | 1.2% |
| Poland | 11 | 0.0% |
| Portugal | 28 | 0.1% |
| Romania | 9 | 0.0% |
| Russia | 75 | 0.3% |
| Saudi Arabia | 8 | 0.0% |
| Scotland | 13 | 0.1% |
| Sierra Leone | 185 | 0.7% |
| Somalia | 106 | 0.4% |
| South Africa | 59 | 0.2% |
| South America | 1,113 | 4.5% |
| South Central Asia | 1,983 | 8.0% |
| South Eastern Asia | 747 | 3.0% |
| Southern Europe | 52 | 0.2% |
| Spain | 14 | 0.1% |
| Sri Lanka | 36 | 0.2% |
| Sudan | 352 | 1.4% |
| Syria | 43 | 0.2% |
| Taiwan | 35 | 0.1% |
| Thailand | 100 | 0.4% |
| Turkey | 59 | 0.2% |
| Venezuela | 21 | 0.1% |
| Vietnam | 165 | 0.7% |
| Western Africa | 287 | 1.2% |
| Western Asia | 636 | 2.6% |
| Western Europe | 42 | 0.2% |
| Yemen | 141 | 0.6% |
| Zaire | 32 | 0.1% | View All 89 Rows |
Sex and Age in Bailey s Crossroads
Sex and Age in Bailey s Crossroads
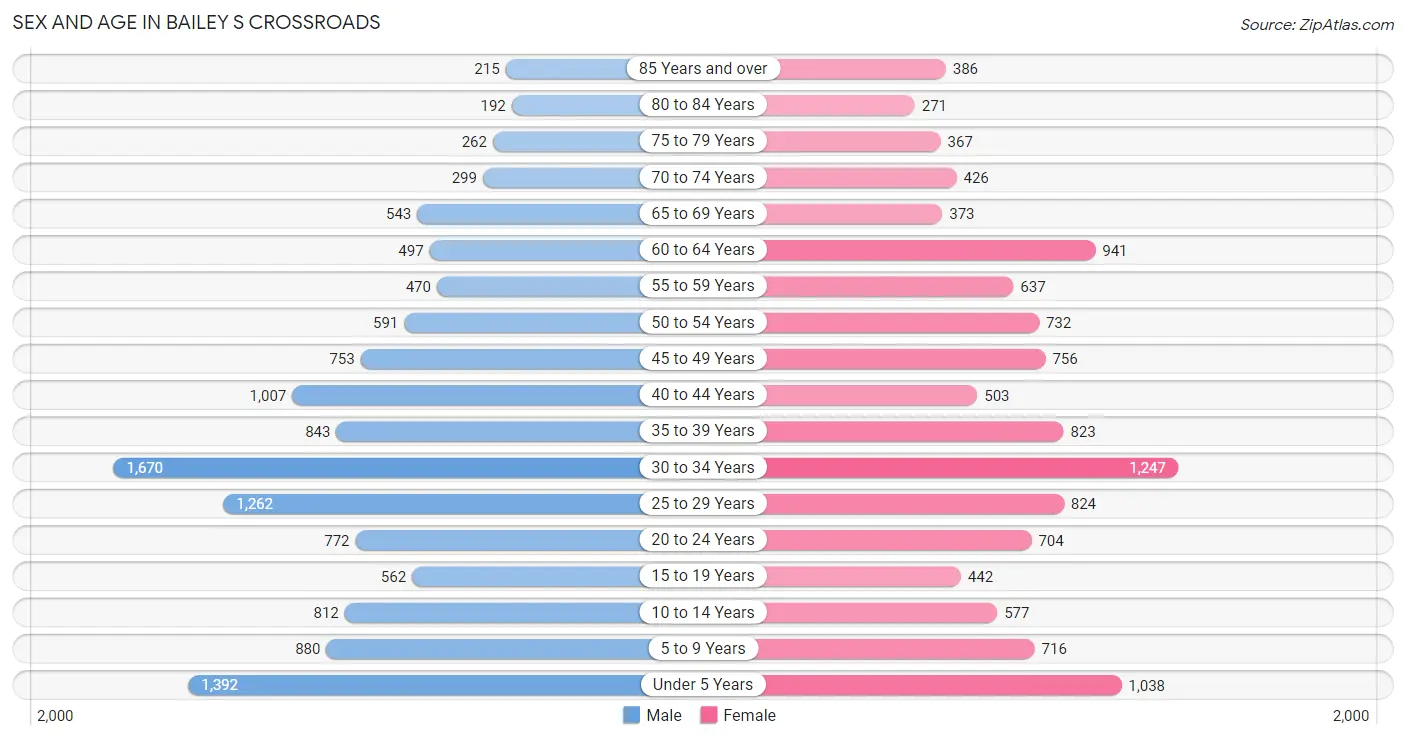
The most populous age groups in Bailey s Crossroads are 30 to 34 Years (1,670 | 12.8%) for men and 30 to 34 Years (1,247 | 10.6%) for women.
| Age Bracket | Male | Female |
| Under 5 Years | 1,392 (10.7%) | 1,038 (8.8%) |
| 5 to 9 Years | 880 (6.8%) | 716 (6.1%) |
| 10 to 14 Years | 812 (6.2%) | 577 (4.9%) |
| 15 to 19 Years | 562 (4.3%) | 442 (3.8%) |
| 20 to 24 Years | 772 (5.9%) | 704 (6.0%) |
| 25 to 29 Years | 1,262 (9.7%) | 824 (7.0%) |
| 30 to 34 Years | 1,670 (12.8%) | 1,247 (10.6%) |
| 35 to 39 Years | 843 (6.5%) | 823 (7.0%) |
| 40 to 44 Years | 1,007 (7.7%) | 503 (4.3%) |
| 45 to 49 Years | 753 (5.8%) | 756 (6.4%) |
| 50 to 54 Years | 591 (4.5%) | 732 (6.2%) |
| 55 to 59 Years | 470 (3.6%) | 637 (5.4%) |
| 60 to 64 Years | 497 (3.8%) | 941 (8.0%) |
| 65 to 69 Years | 543 (4.2%) | 373 (3.2%) |
| 70 to 74 Years | 299 (2.3%) | 426 (3.6%) |
| 75 to 79 Years | 262 (2.0%) | 367 (3.1%) |
| 80 to 84 Years | 192 (1.5%) | 271 (2.3%) |
| 85 Years and over | 215 (1.7%) | 386 (3.3%) |
| Total | 13,022 (100.0%) | 11,763 (100.0%) |
Families and Households in Bailey s Crossroads
Median Family Size in Bailey s Crossroads
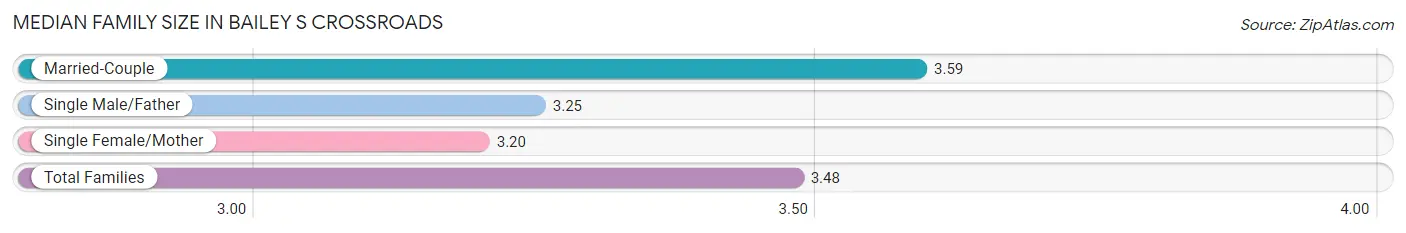
The median family size in Bailey s Crossroads is 3.48 persons per family, with married-couple families (3,473 | 69.6%) accounting for the largest median family size of 3.59 persons per family. On the other hand, single female/mother families (967 | 19.4%) represent the smallest median family size with 3.20 persons per family.
| Family Type | # Families | Family Size |
| Married-Couple | 3,473 (69.6%) | 3.59 |
| Single Male/Father | 549 (11.0%) | 3.25 |
| Single Female/Mother | 967 (19.4%) | 3.20 |
| Total Families | 4,989 (100.0%) | 3.48 |
Median Household Size in Bailey s Crossroads
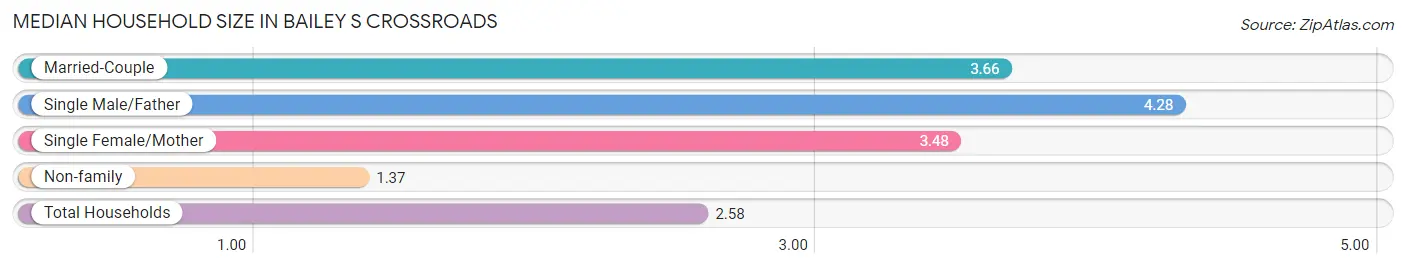
The median household size in Bailey s Crossroads is 2.58 persons per household, with single male/father households (549 | 5.8%) accounting for the largest median household size of 4.28 persons per household. non-family households (4,556 | 47.7%) represent the smallest median household size with 1.37 persons per household.
| Household Type | # Households | Household Size |
| Married-Couple | 3,473 (36.4%) | 3.66 |
| Single Male/Father | 549 (5.8%) | 4.28 |
| Single Female/Mother | 967 (10.1%) | 3.48 |
| Non-family | 4,556 (47.7%) | 1.37 |
| Total Households | 9,545 (100.0%) | 2.58 |
Household Size by Marriage Status in Bailey s Crossroads
Out of a total of 9,545 households in Bailey s Crossroads, 4,989 (52.3%) are family households, while 4,556 (47.7%) are nonfamily households. The most numerous type of family households are 2-person households, comprising 1,756, and the most common type of nonfamily households are 1-person households, comprising 3,512.
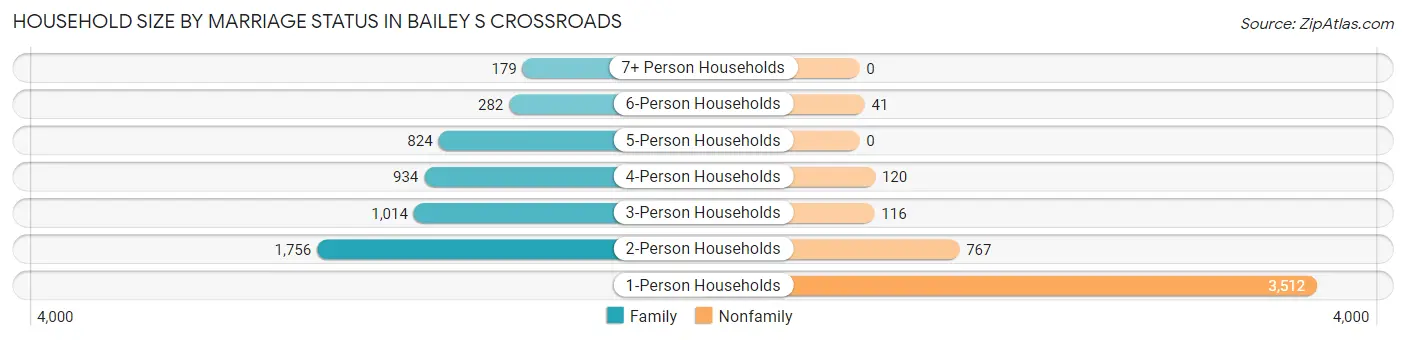
| Household Size | Family Households | Nonfamily Households |
| 1-Person Households | - | 3,512 (36.8%) |
| 2-Person Households | 1,756 (18.4%) | 767 (8.0%) |
| 3-Person Households | 1,014 (10.6%) | 116 (1.2%) |
| 4-Person Households | 934 (9.8%) | 120 (1.3%) |
| 5-Person Households | 824 (8.6%) | 0 (0.0%) |
| 6-Person Households | 282 (2.9%) | 41 (0.4%) |
| 7+ Person Households | 179 (1.9%) | 0 (0.0%) |
| Total | 4,989 (52.3%) | 4,556 (47.7%) |
Female Fertility in Bailey s Crossroads
Fertility by Age in Bailey s Crossroads
Average fertility rate in Bailey s Crossroads is 145.0 births per 1,000 women. Women in the age bracket of 35 to 50 years have the highest fertility rate with 162.0 births per 1,000 women. Women in the age bracket of 20 to 34 years acount for 53.8% of all women with births.
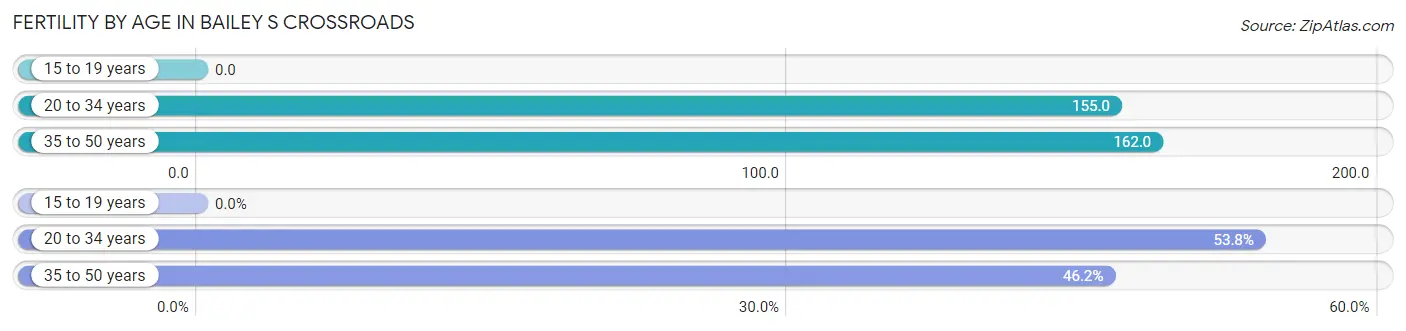
| Age Bracket | Women with Births | Births / 1,000 Women |
| 15 to 19 years | 0 (0.0%) | 0.0 |
| 20 to 34 years | 429 (53.8%) | 155.0 |
| 35 to 50 years | 368 (46.2%) | 162.0 |
| Total | 797 (100.0%) | 145.0 |
Fertility by Age by Marriage Status in Bailey s Crossroads
80.9% of women with births (797) in Bailey s Crossroads are married. The highest percentage of unmarried women with births falls into 35 to 50 years age bracket with 41.3% of them unmarried at the time of birth, while the lowest percentage of unmarried women with births belong to 20 to 34 years age bracket with 0.0% of them unmarried.
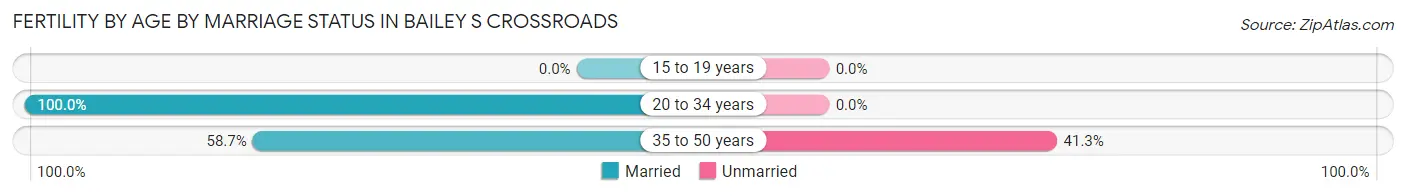
| Age Bracket | Married | Unmarried |
| 15 to 19 years | 0 (0.0%) | 0 (0.0%) |
| 20 to 34 years | 429 (100.0%) | 0 (0.0%) |
| 35 to 50 years | 216 (58.7%) | 152 (41.3%) |
| Total | 645 (80.9%) | 152 (19.1%) |
Fertility by Education in Bailey s Crossroads
Average fertility rate in Bailey s Crossroads is 145.0 births per 1,000 women. Women with the education attainment of bachelor's degree have the highest fertility rate of 261.0 births per 1,000 women, while women with the education attainment of graduate degree have the lowest fertility at 39.0 births per 1,000 women. Women with the education attainment of bachelor's degree represent 39.2% of all women with births.
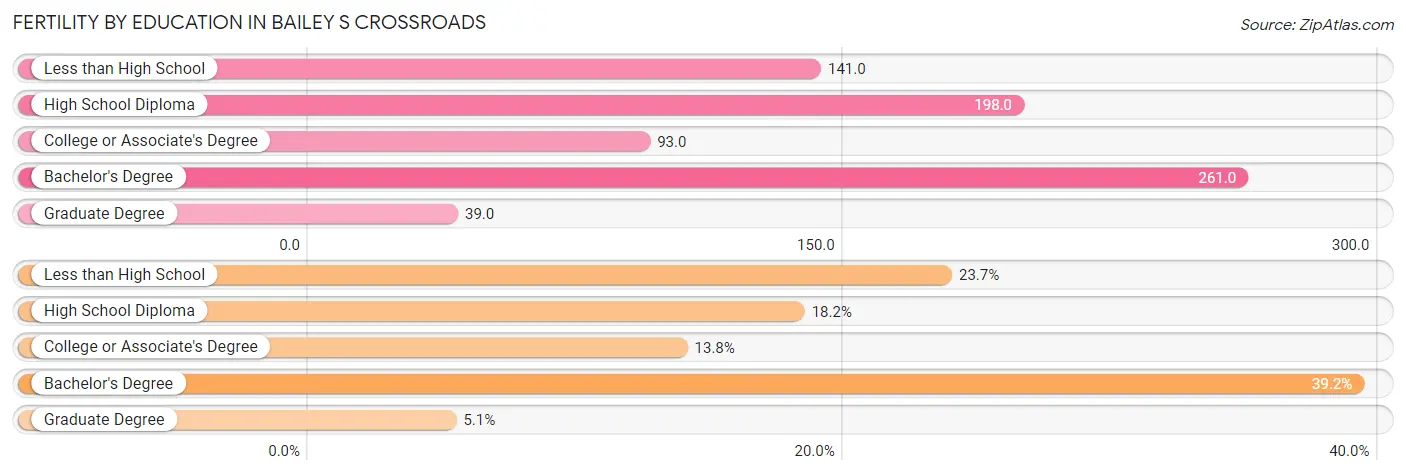
| Educational Attainment | Women with Births | Births / 1,000 Women |
| Less than High School | 189 (23.7%) | 141.0 |
| High School Diploma | 145 (18.2%) | 198.0 |
| College or Associate's Degree | 110 (13.8%) | 93.0 |
| Bachelor's Degree | 312 (39.2%) | 261.0 |
| Graduate Degree | 41 (5.1%) | 39.0 |
| Total | 797 (100.0%) | 145.0 |
Fertility by Education by Marriage Status in Bailey s Crossroads
19.1% of women with births in Bailey s Crossroads are unmarried. Women with the educational attainment of high school diploma are most likely to be married with 100.0% of them married at childbirth, while women with the educational attainment of less than high school are least likely to be married with 80.4% of them unmarried at childbirth.
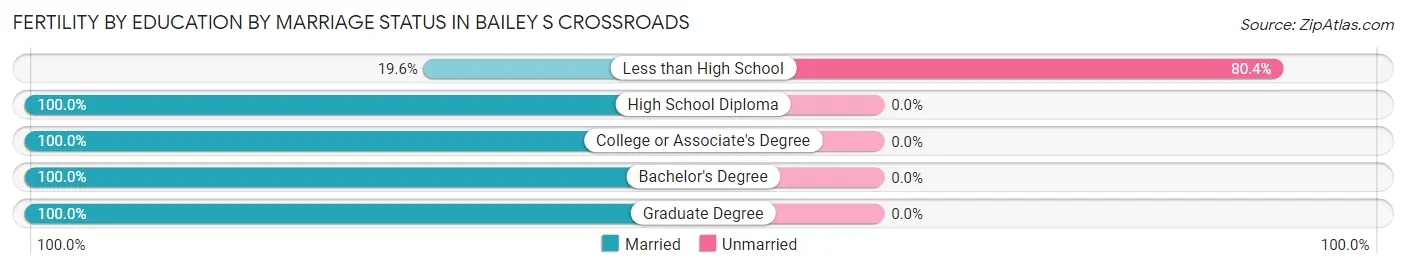
| Educational Attainment | Married | Unmarried |
| Less than High School | 37 (19.6%) | 152 (80.4%) |
| High School Diploma | 145 (100.0%) | 0 (0.0%) |
| College or Associate's Degree | 110 (100.0%) | 0 (0.0%) |
| Bachelor's Degree | 312 (100.0%) | 0 (0.0%) |
| Graduate Degree | 41 (100.0%) | 0 (0.0%) |
| Total | 645 (80.9%) | 152 (19.1%) |
Employment Characteristics in Bailey s Crossroads
Employment by Class of Employer in Bailey s Crossroads
Among the 11,760 employed individuals in Bailey s Crossroads, private company employees (7,645 | 65.0%), not-for-profit organizations (1,151 | 9.8%), and federal government employees (1,088 | 9.2%) make up the most common classes of employment.
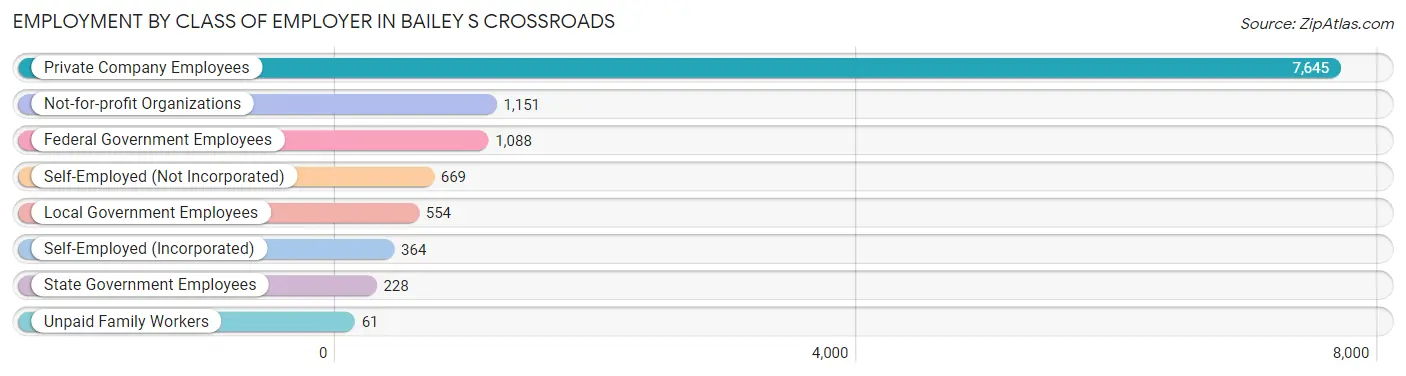
| Employer Class | # Employees | % Employees |
| Private Company Employees | 7,645 | 65.0% |
| Self-Employed (Incorporated) | 364 | 3.1% |
| Self-Employed (Not Incorporated) | 669 | 5.7% |
| Not-for-profit Organizations | 1,151 | 9.8% |
| Local Government Employees | 554 | 4.7% |
| State Government Employees | 228 | 1.9% |
| Federal Government Employees | 1,088 | 9.2% |
| Unpaid Family Workers | 61 | 0.5% |
| Total | 11,760 | 100.0% |
Employment Status by Age in Bailey s Crossroads
According to the labor force statistics for Bailey s Crossroads, out of the total population over 16 years of age (19,212), 67.7% or 13,007 individuals are in the labor force, with 7.3% or 950 of them unemployed. The age group with the highest labor force participation rate is 30 to 34 years, with 86.2% or 2,514 individuals in the labor force. Within the labor force, the 20 to 24 years age range has the highest percentage of unemployed individuals, with 13.8% or 169 of them being unemployed.
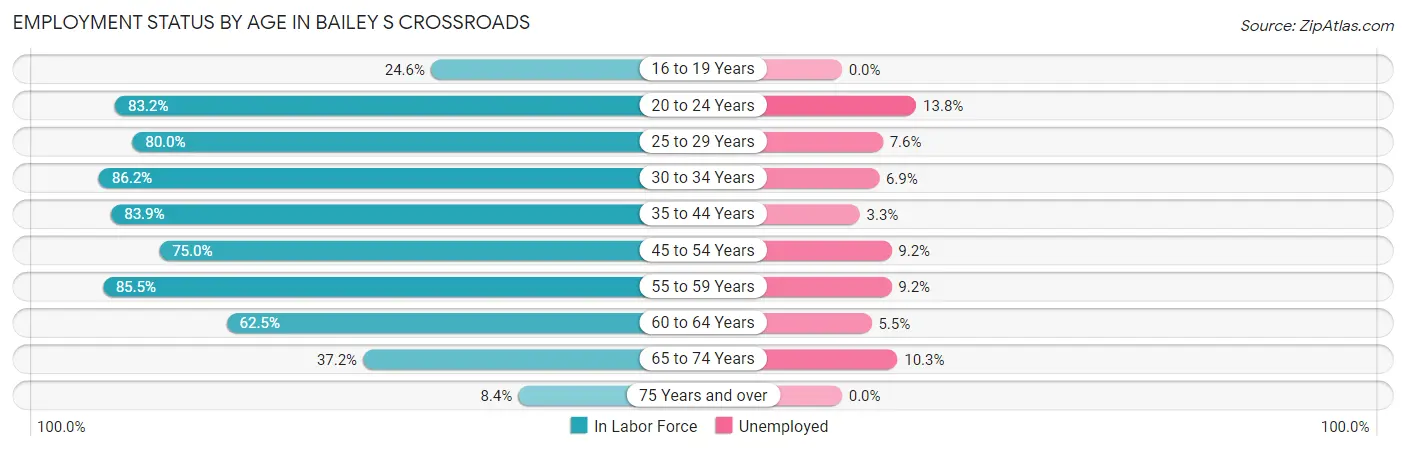
| Age Bracket | In Labor Force | Unemployed |
| 16 to 19 Years | 208 (24.6%) | 0 (0.0%) |
| 20 to 24 Years | 1,228 (83.2%) | 169 (13.8%) |
| 25 to 29 Years | 1,669 (80.0%) | 127 (7.6%) |
| 30 to 34 Years | 2,514 (86.2%) | 173 (6.9%) |
| 35 to 44 Years | 2,665 (83.9%) | 88 (3.3%) |
| 45 to 54 Years | 2,124 (75.0%) | 195 (9.2%) |
| 55 to 59 Years | 946 (85.5%) | 87 (9.2%) |
| 60 to 64 Years | 899 (62.5%) | 49 (5.5%) |
| 65 to 74 Years | 610 (37.2%) | 63 (10.3%) |
| 75 Years and over | 142 (8.4%) | 0 (0.0%) |
| Total | 13,007 (67.7%) | 950 (7.3%) |
Employment Status by Educational Attainment in Bailey s Crossroads
According to labor force statistics for Bailey s Crossroads, 79.8% of individuals (10,818) out of the total population between 25 and 64 years of age (13,556) are in the labor force, with 6.6% or 714 of them being unemployed. The group with the highest labor force participation rate are those with the educational attainment of bachelor's degree or higher, with 88.3% or 5,027 individuals in the labor force. Within the labor force, individuals with bachelor's degree or higher education have the highest percentage of unemployment, with 7.6% or 382 of them being unemployed.
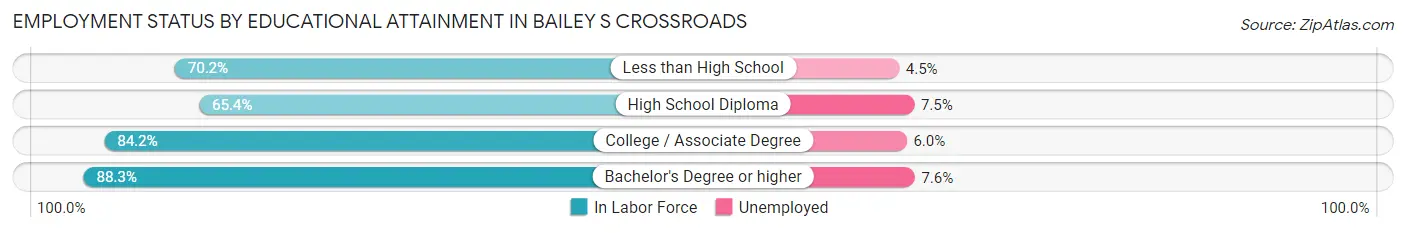
| Educational Attainment | In Labor Force | Unemployed |
| Less than High School | 1,995 (70.2%) | 128 (4.5%) |
| High School Diploma | 1,513 (65.4%) | 173 (7.5%) |
| College / Associate Degree | 2,280 (84.2%) | 162 (6.0%) |
| Bachelor's Degree or higher | 5,027 (88.3%) | 433 (7.6%) |
| Total | 10,818 (79.8%) | 895 (6.6%) |
Employment Occupations by Sex in Bailey s Crossroads
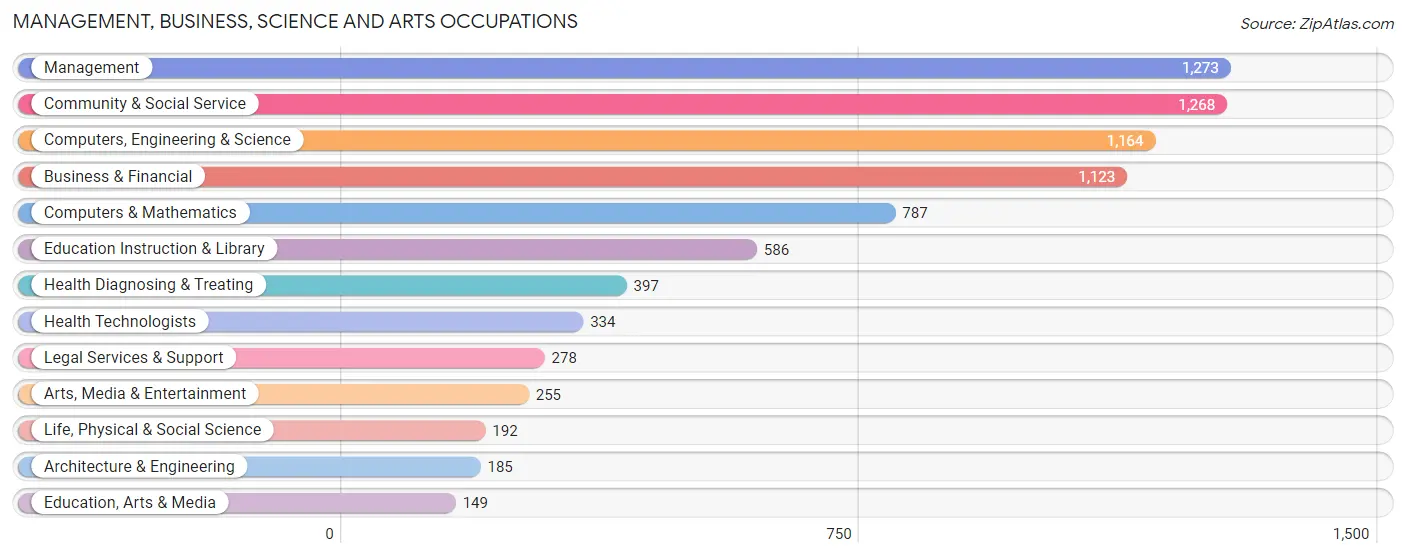
Management, Business, Science and Arts Occupations
The most common Management, Business, Science and Arts occupations in Bailey s Crossroads are Management (1,273 | 10.7%), Community & Social Service (1,268 | 10.6%), Computers, Engineering & Science (1,164 | 9.8%), Business & Financial (1,123 | 9.4%), and Computers & Mathematics (787 | 6.6%).
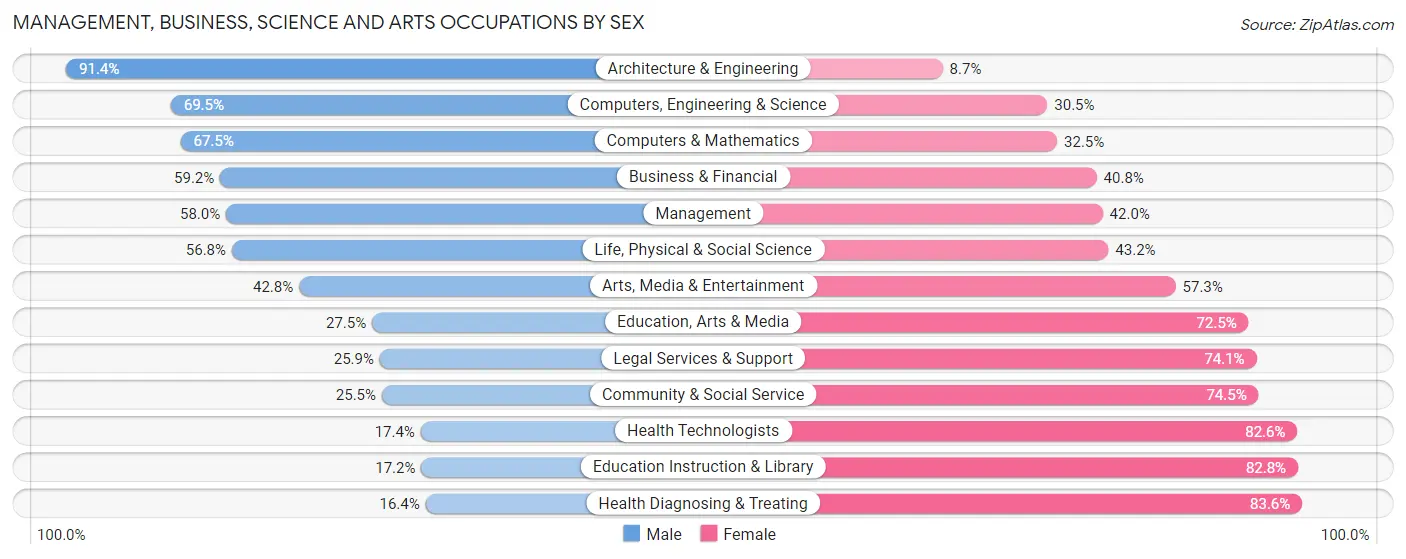
Management, Business, Science and Arts Occupations by Sex
Within the Management, Business, Science and Arts occupations in Bailey s Crossroads, the most male-oriented occupations are Architecture & Engineering (91.3%), Computers, Engineering & Science (69.5%), and Computers & Mathematics (67.5%), while the most female-oriented occupations are Health Diagnosing & Treating (83.6%), Education Instruction & Library (82.8%), and Health Technologists (82.6%).
| Occupation | Male | Female |
| Management | 738 (58.0%) | 535 (42.0%) |
| Business & Financial | 665 (59.2%) | 458 (40.8%) |
| Computers, Engineering & Science | 809 (69.5%) | 355 (30.5%) |
| Computers & Mathematics | 531 (67.5%) | 256 (32.5%) |
| Architecture & Engineering | 169 (91.3%) | 16 (8.6%) |
| Life, Physical & Social Science | 109 (56.8%) | 83 (43.2%) |
| Community & Social Service | 323 (25.5%) | 945 (74.5%) |
| Education, Arts & Media | 41 (27.5%) | 108 (72.5%) |
| Legal Services & Support | 72 (25.9%) | 206 (74.1%) |
| Education Instruction & Library | 101 (17.2%) | 485 (82.8%) |
| Arts, Media & Entertainment | 109 (42.7%) | 146 (57.3%) |
| Health Diagnosing & Treating | 65 (16.4%) | 332 (83.6%) |
| Health Technologists | 58 (17.4%) | 276 (82.6%) |
| Total (Category) | 2,600 (49.8%) | 2,625 (50.2%) |
| Total (Overall) | 6,893 (57.9%) | 5,021 (42.1%) |
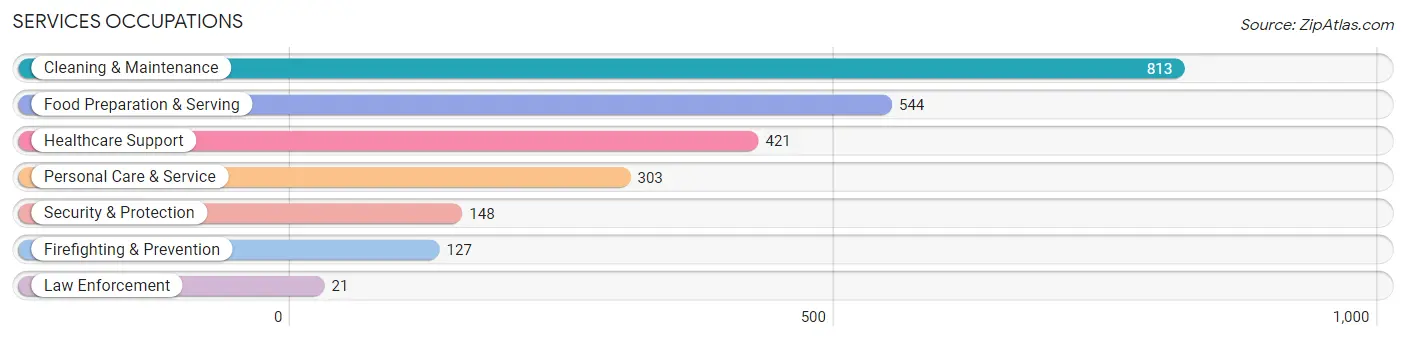
Services Occupations
The most common Services occupations in Bailey s Crossroads are Cleaning & Maintenance (813 | 6.8%), Food Preparation & Serving (544 | 4.6%), Healthcare Support (421 | 3.5%), Personal Care & Service (303 | 2.5%), and Security & Protection (148 | 1.2%).
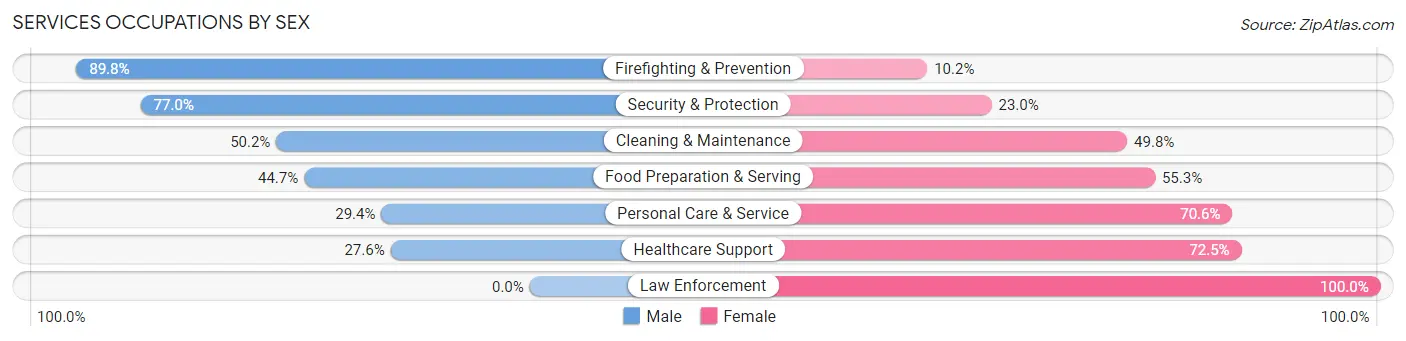
Services Occupations by Sex
Within the Services occupations in Bailey s Crossroads, the most male-oriented occupations are Firefighting & Prevention (89.8%), Security & Protection (77.0%), and Cleaning & Maintenance (50.2%), while the most female-oriented occupations are Law Enforcement (100.0%), Healthcare Support (72.5%), and Personal Care & Service (70.6%).
| Occupation | Male | Female |
| Healthcare Support | 116 (27.6%) | 305 (72.5%) |
| Security & Protection | 114 (77.0%) | 34 (23.0%) |
| Firefighting & Prevention | 114 (89.8%) | 13 (10.2%) |
| Law Enforcement | 0 (0.0%) | 21 (100.0%) |
| Food Preparation & Serving | 243 (44.7%) | 301 (55.3%) |
| Cleaning & Maintenance | 408 (50.2%) | 405 (49.8%) |
| Personal Care & Service | 89 (29.4%) | 214 (70.6%) |
| Total (Category) | 970 (43.5%) | 1,259 (56.5%) |
| Total (Overall) | 6,893 (57.9%) | 5,021 (42.1%) |
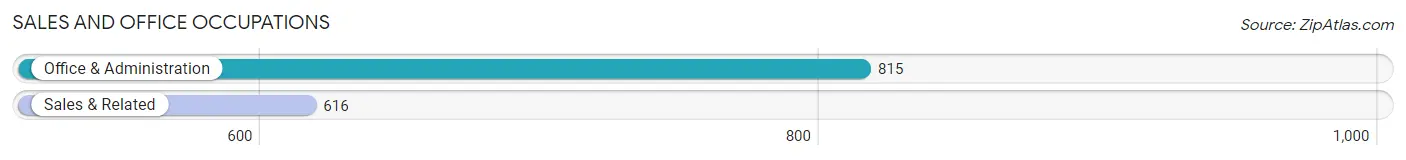
Sales and Office Occupations
The most common Sales and Office occupations in Bailey s Crossroads are Office & Administration (815 | 6.8%), and Sales & Related (616 | 5.2%).
Sales and Office Occupations by Sex
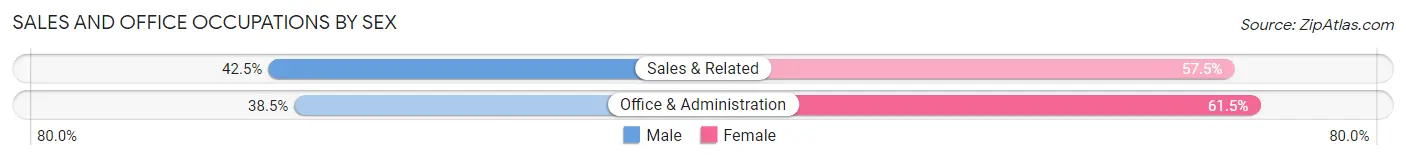
| Occupation | Male | Female |
| Sales & Related | 262 (42.5%) | 354 (57.5%) |
| Office & Administration | 314 (38.5%) | 501 (61.5%) |
| Total (Category) | 576 (40.3%) | 855 (59.8%) |
| Total (Overall) | 6,893 (57.9%) | 5,021 (42.1%) |
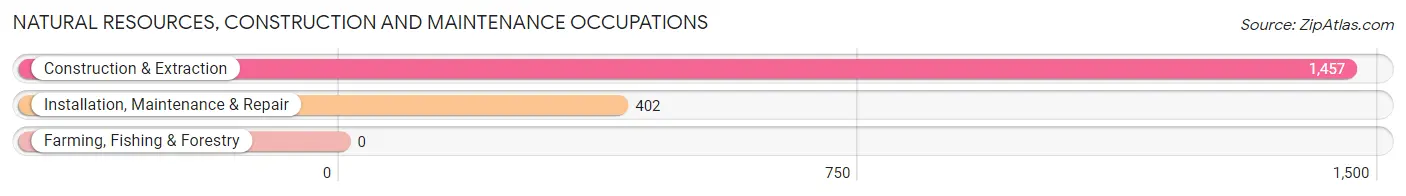
Natural Resources, Construction and Maintenance Occupations
The most common Natural Resources, Construction and Maintenance occupations in Bailey s Crossroads are Construction & Extraction (1,457 | 12.2%), and Installation, Maintenance & Repair (402 | 3.4%).
Natural Resources, Construction and Maintenance Occupations by Sex
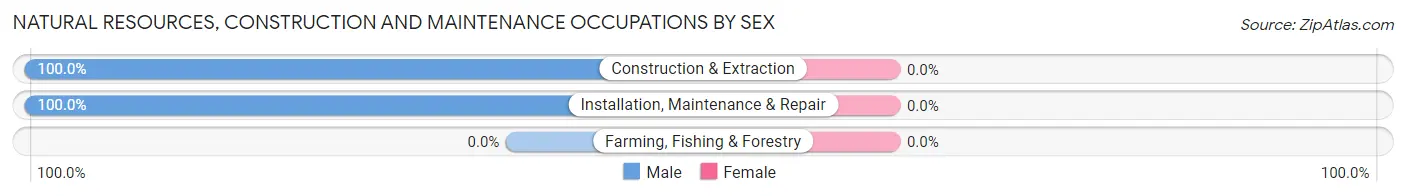
| Occupation | Male | Female |
| Farming, Fishing & Forestry | 0 (0.0%) | 0 (0.0%) |
| Construction & Extraction | 1,457 (100.0%) | 0 (0.0%) |
| Installation, Maintenance & Repair | 402 (100.0%) | 0 (0.0%) |
| Total (Category) | 1,859 (100.0%) | 0 (0.0%) |
| Total (Overall) | 6,893 (57.9%) | 5,021 (42.1%) |
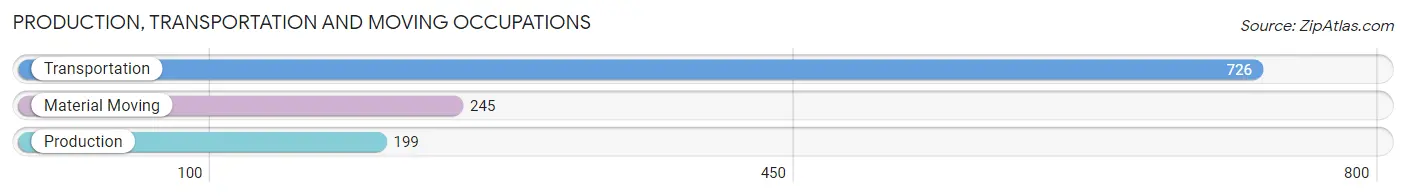
Production, Transportation and Moving Occupations
The most common Production, Transportation and Moving occupations in Bailey s Crossroads are Transportation (726 | 6.1%), Material Moving (245 | 2.1%), and Production (199 | 1.7%).
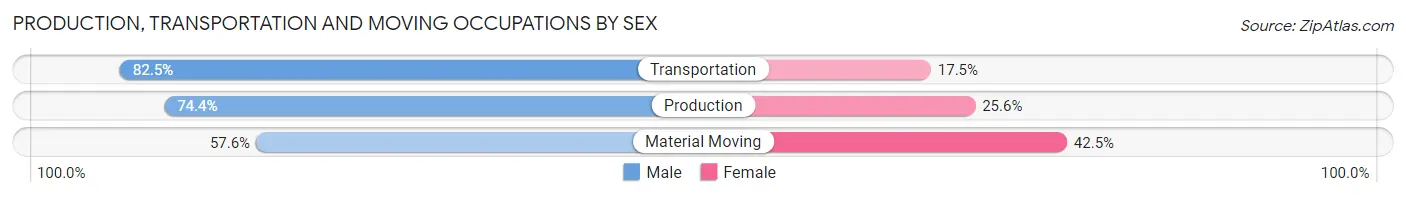
Production, Transportation and Moving Occupations by Sex
| Occupation | Male | Female |
| Production | 148 (74.4%) | 51 (25.6%) |
| Transportation | 599 (82.5%) | 127 (17.5%) |
| Material Moving | 141 (57.6%) | 104 (42.4%) |
| Total (Category) | 888 (75.9%) | 282 (24.1%) |
| Total (Overall) | 6,893 (57.9%) | 5,021 (42.1%) |
Employment Industries by Sex in Bailey s Crossroads
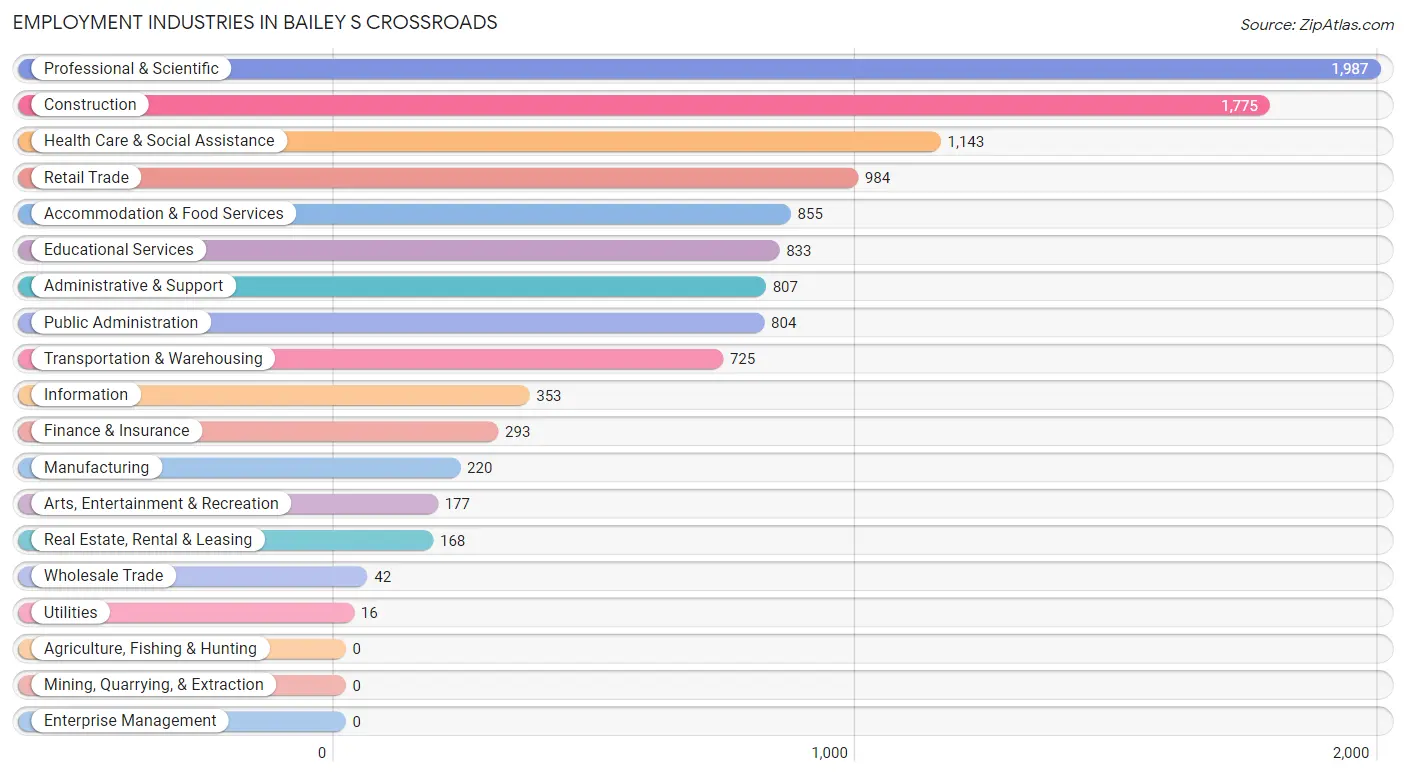
Employment Industries in Bailey s Crossroads
The major employment industries in Bailey s Crossroads include Professional & Scientific (1,987 | 16.7%), Construction (1,775 | 14.9%), Health Care & Social Assistance (1,143 | 9.6%), Retail Trade (984 | 8.3%), and Accommodation & Food Services (855 | 7.2%).
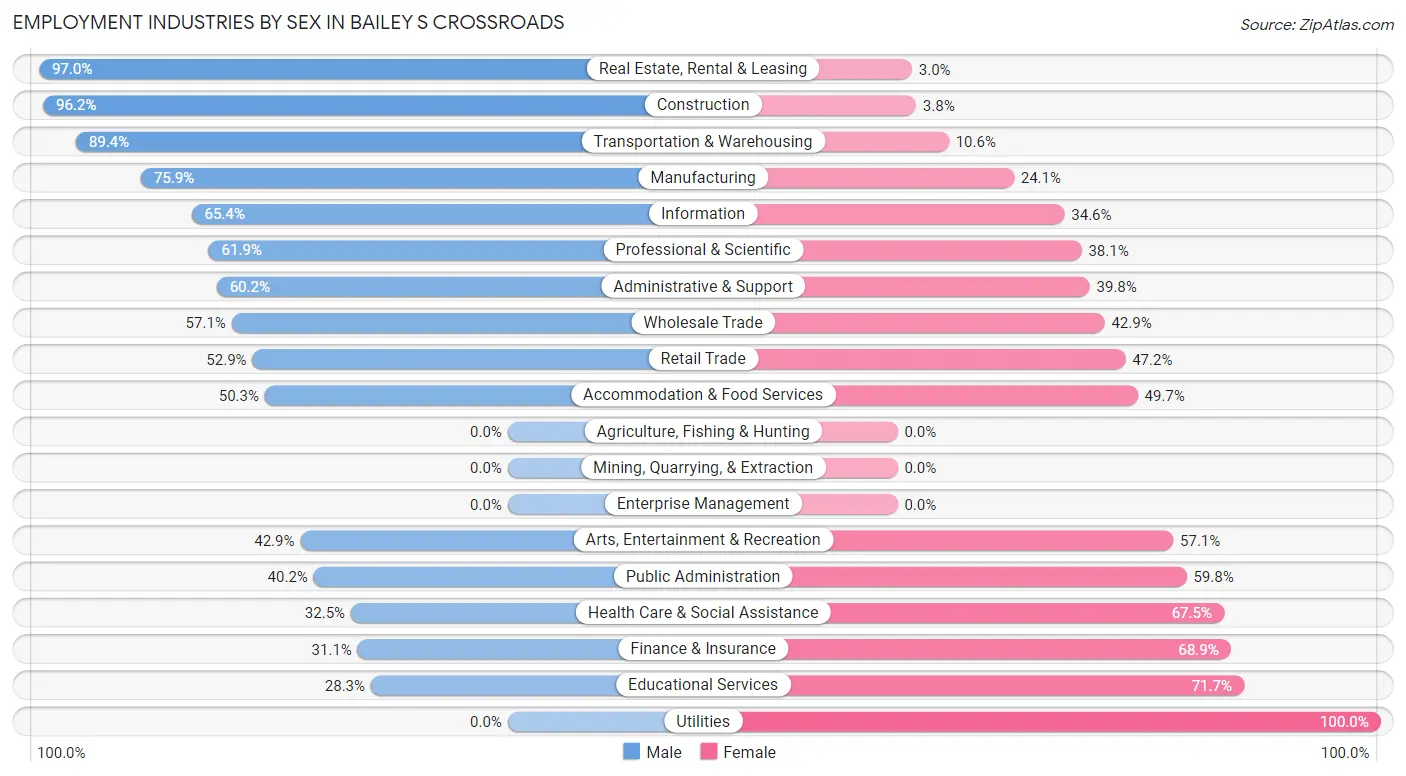
Employment Industries by Sex in Bailey s Crossroads
The Bailey s Crossroads industries that see more men than women are Real Estate, Rental & Leasing (97.0%), Construction (96.2%), and Transportation & Warehousing (89.4%), whereas the industries that tend to have a higher number of women are Utilities (100.0%), Educational Services (71.7%), and Finance & Insurance (68.9%).
| Industry | Male | Female |
| Agriculture, Fishing & Hunting | 0 (0.0%) | 0 (0.0%) |
| Mining, Quarrying, & Extraction | 0 (0.0%) | 0 (0.0%) |
| Construction | 1,707 (96.2%) | 68 (3.8%) |
| Manufacturing | 167 (75.9%) | 53 (24.1%) |
| Wholesale Trade | 24 (57.1%) | 18 (42.9%) |
| Retail Trade | 520 (52.8%) | 464 (47.1%) |
| Transportation & Warehousing | 648 (89.4%) | 77 (10.6%) |
| Utilities | 0 (0.0%) | 16 (100.0%) |
| Information | 231 (65.4%) | 122 (34.6%) |
| Finance & Insurance | 91 (31.1%) | 202 (68.9%) |
| Real Estate, Rental & Leasing | 163 (97.0%) | 5 (3.0%) |
| Professional & Scientific | 1,230 (61.9%) | 757 (38.1%) |
| Enterprise Management | 0 (0.0%) | 0 (0.0%) |
| Administrative & Support | 486 (60.2%) | 321 (39.8%) |
| Educational Services | 236 (28.3%) | 597 (71.7%) |
| Health Care & Social Assistance | 371 (32.5%) | 772 (67.5%) |
| Arts, Entertainment & Recreation | 76 (42.9%) | 101 (57.1%) |
| Accommodation & Food Services | 430 (50.3%) | 425 (49.7%) |
| Public Administration | 323 (40.2%) | 481 (59.8%) |
| Total | 6,893 (57.9%) | 5,021 (42.1%) |
Education in Bailey s Crossroads
School Enrollment in Bailey s Crossroads
The most common levels of schooling among the 5,057 students in Bailey s Crossroads are elementary school (1,296 | 25.6%), middle school (1,259 | 24.9%), and college / undergraduate (785 | 15.5%).
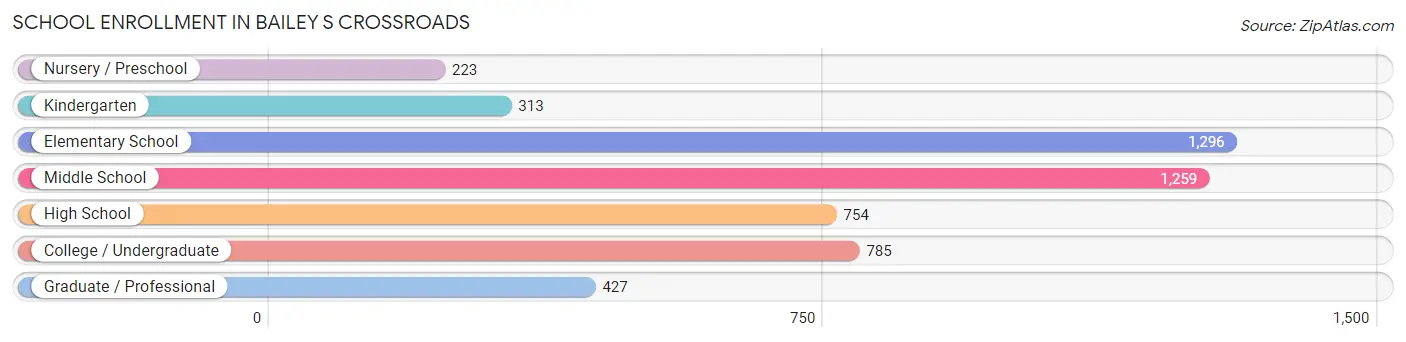
| School Level | # Students | % Students |
| Nursery / Preschool | 223 | 4.4% |
| Kindergarten | 313 | 6.2% |
| Elementary School | 1,296 | 25.6% |
| Middle School | 1,259 | 24.9% |
| High School | 754 | 14.9% |
| College / Undergraduate | 785 | 15.5% |
| Graduate / Professional | 427 | 8.4% |
| Total | 5,057 | 100.0% |
School Enrollment by Age by Funding Source in Bailey s Crossroads
Out of a total of 5,057 students who are enrolled in schools in Bailey s Crossroads, 642 (12.7%) attend a private institution, while the remaining 4,415 (87.3%) are enrolled in public schools. The age group of 35 years and over has the highest likelihood of being enrolled in private schools, with 104 (44.4% in the age bracket) enrolled. Conversely, the age group of 5 to 9 year old has the lowest likelihood of being enrolled in a private school, with 1,394 (94.6% in the age bracket) attending a public institution.
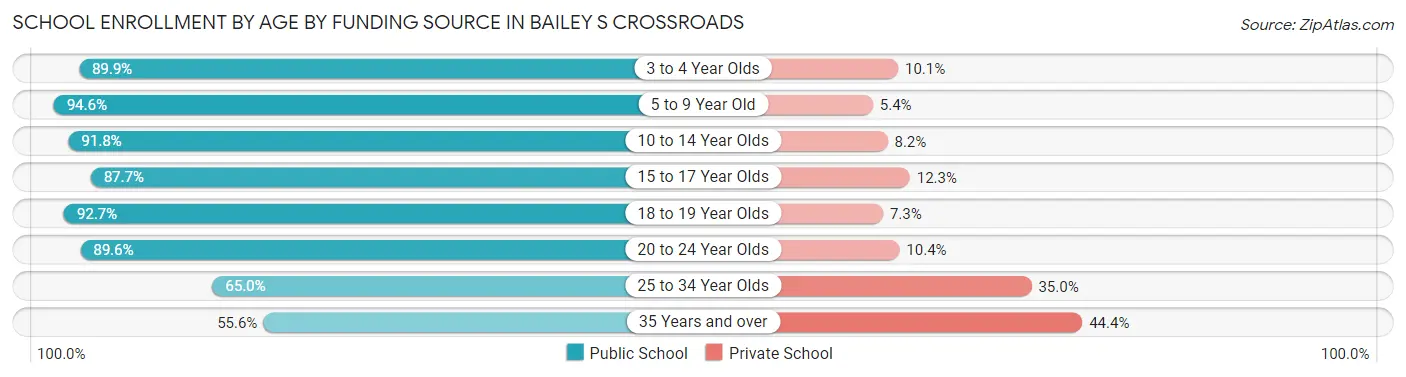
| Age Bracket | Public School | Private School |
| 3 to 4 Year Olds | 213 (89.9%) | 24 (10.1%) |
| 5 to 9 Year Old | 1,394 (94.6%) | 80 (5.4%) |
| 10 to 14 Year Olds | 1,236 (91.8%) | 110 (8.2%) |
| 15 to 17 Year Olds | 548 (87.7%) | 77 (12.3%) |
| 18 to 19 Year Olds | 114 (92.7%) | 9 (7.3%) |
| 20 to 24 Year Olds | 423 (89.6%) | 49 (10.4%) |
| 25 to 34 Year Olds | 355 (65.0%) | 191 (35.0%) |
| 35 Years and over | 130 (55.6%) | 104 (44.4%) |
| Total | 4,415 (87.3%) | 642 (12.7%) |
Educational Attainment by Field of Study in Bailey s Crossroads
Business (1,440 | 18.0%), social sciences (1,227 | 15.3%), computers & mathematics (718 | 9.0%), education (711 | 8.9%), and literature & languages (568 | 7.1%) are the most common fields of study among 8,011 individuals in Bailey s Crossroads who have obtained a bachelor's degree or higher.
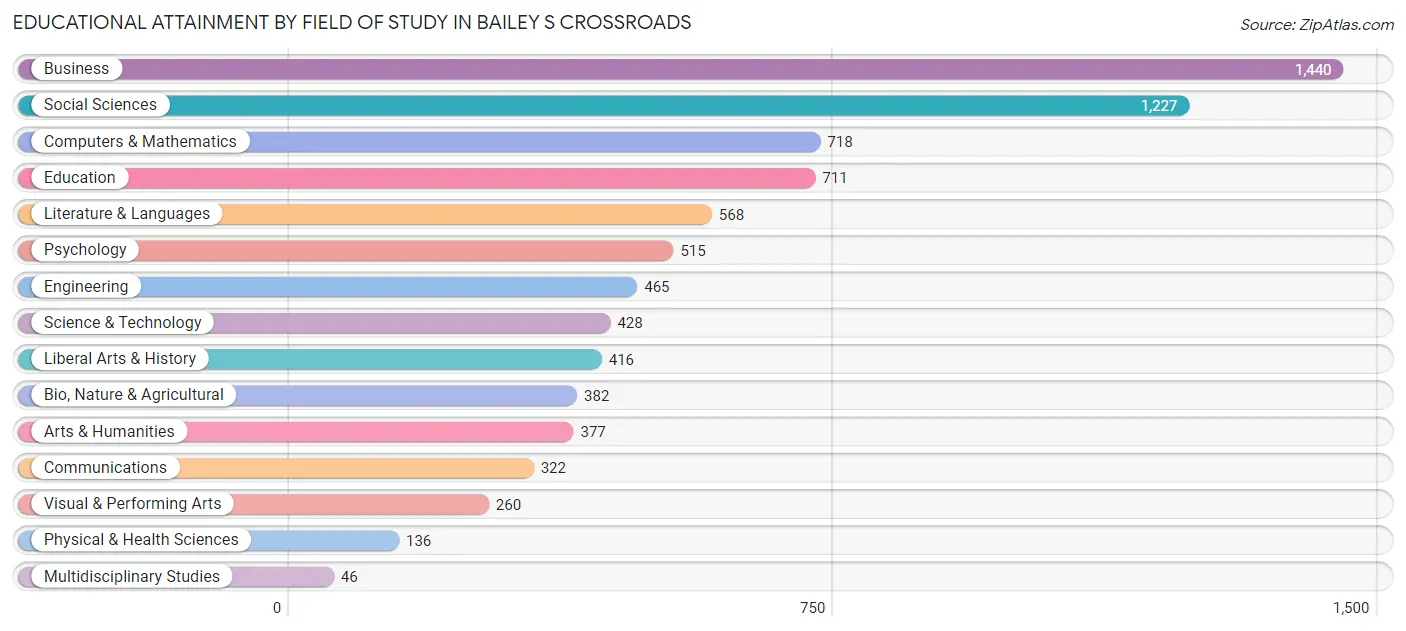
| Field of Study | # Graduates | % Graduates |
| Computers & Mathematics | 718 | 9.0% |
| Bio, Nature & Agricultural | 382 | 4.8% |
| Physical & Health Sciences | 136 | 1.7% |
| Psychology | 515 | 6.4% |
| Social Sciences | 1,227 | 15.3% |
| Engineering | 465 | 5.8% |
| Multidisciplinary Studies | 46 | 0.6% |
| Science & Technology | 428 | 5.3% |
| Business | 1,440 | 18.0% |
| Education | 711 | 8.9% |
| Literature & Languages | 568 | 7.1% |
| Liberal Arts & History | 416 | 5.2% |
| Visual & Performing Arts | 260 | 3.3% |
| Communications | 322 | 4.0% |
| Arts & Humanities | 377 | 4.7% |
| Total | 8,011 | 100.0% |
Transportation & Commute in Bailey s Crossroads
Vehicle Availability by Sex in Bailey s Crossroads
The most prevalent vehicle ownership categories in Bailey s Crossroads are males with 2 vehicles (2,679, accounting for 38.5%) and females with 2 vehicles (1,560, making up 56.4%).
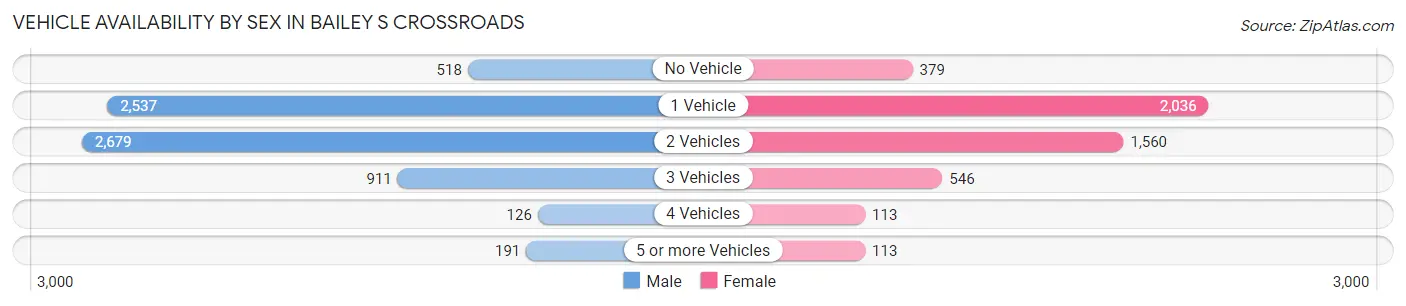
| Vehicles Available | Male | Female |
| No Vehicle | 518 (7.4%) | 379 (8.0%) |
| 1 Vehicle | 2,537 (36.4%) | 2,036 (42.9%) |
| 2 Vehicles | 2,679 (38.5%) | 1,560 (32.9%) |
| 3 Vehicles | 911 (13.1%) | 546 (11.5%) |
| 4 Vehicles | 126 (1.8%) | 113 (2.4%) |
| 5 or more Vehicles | 191 (2.7%) | 113 (2.4%) |
| Total | 6,962 (100.0%) | 4,747 (100.0%) |
Commute Time in Bailey s Crossroads
The most frequently occuring commute durations in Bailey s Crossroads are 30 to 34 minutes (2,448 commuters, 23.9%), 15 to 19 minutes (1,485 commuters, 14.5%), and 20 to 24 minutes (1,391 commuters, 13.6%).
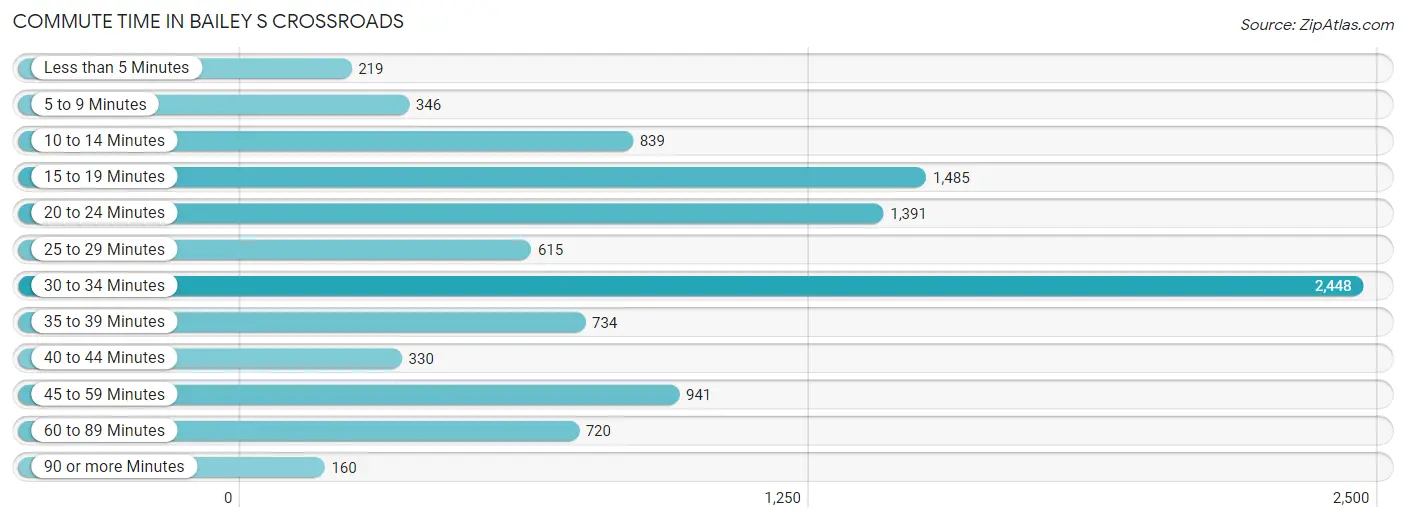
| Commute Time | # Commuters | % Commuters |
| Less than 5 Minutes | 219 | 2.1% |
| 5 to 9 Minutes | 346 | 3.4% |
| 10 to 14 Minutes | 839 | 8.2% |
| 15 to 19 Minutes | 1,485 | 14.5% |
| 20 to 24 Minutes | 1,391 | 13.6% |
| 25 to 29 Minutes | 615 | 6.0% |
| 30 to 34 Minutes | 2,448 | 23.9% |
| 35 to 39 Minutes | 734 | 7.2% |
| 40 to 44 Minutes | 330 | 3.2% |
| 45 to 59 Minutes | 941 | 9.2% |
| 60 to 89 Minutes | 720 | 7.0% |
| 90 or more Minutes | 160 | 1.6% |
Commute Time by Sex in Bailey s Crossroads
The most common commute times in Bailey s Crossroads are 30 to 34 minutes (1,665 commuters, 26.5%) for males and 30 to 34 minutes (783 commuters, 19.8%) for females.
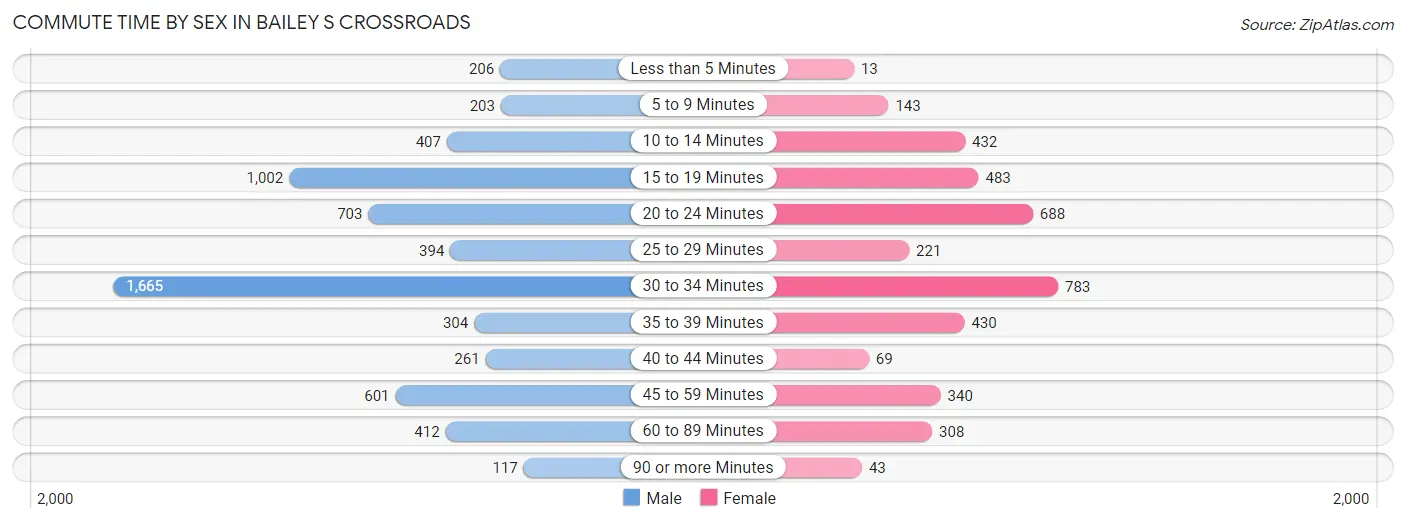
| Commute Time | Male | Female |
| Less than 5 Minutes | 206 (3.3%) | 13 (0.3%) |
| 5 to 9 Minutes | 203 (3.2%) | 143 (3.6%) |
| 10 to 14 Minutes | 407 (6.5%) | 432 (10.9%) |
| 15 to 19 Minutes | 1,002 (16.0%) | 483 (12.2%) |
| 20 to 24 Minutes | 703 (11.2%) | 688 (17.4%) |
| 25 to 29 Minutes | 394 (6.3%) | 221 (5.6%) |
| 30 to 34 Minutes | 1,665 (26.5%) | 783 (19.8%) |
| 35 to 39 Minutes | 304 (4.8%) | 430 (10.9%) |
| 40 to 44 Minutes | 261 (4.2%) | 69 (1.8%) |
| 45 to 59 Minutes | 601 (9.6%) | 340 (8.6%) |
| 60 to 89 Minutes | 412 (6.6%) | 308 (7.8%) |
| 90 or more Minutes | 117 (1.9%) | 43 (1.1%) |
Time of Departure to Work by Sex in Bailey s Crossroads
The most frequent times of departure to work in Bailey s Crossroads are 7:00 AM to 7:29 AM (1,063, 16.9%) for males and 8:00 AM to 8:29 AM (522, 13.2%) for females.
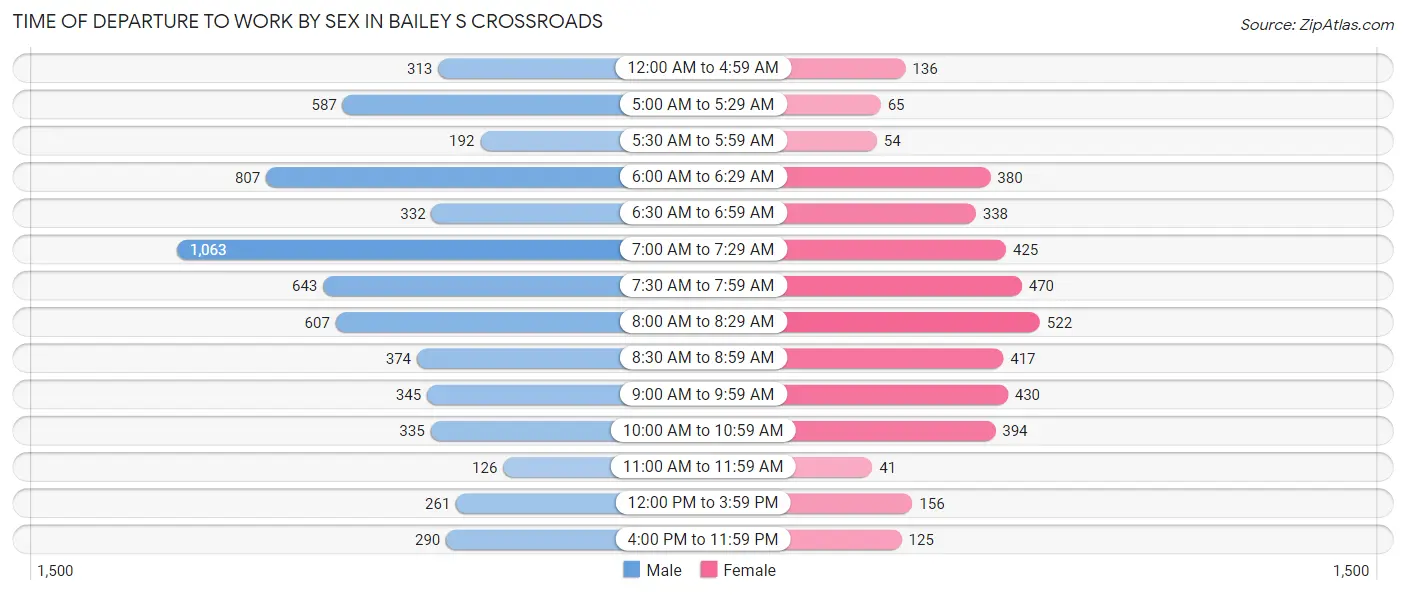
| Time of Departure | Male | Female |
| 12:00 AM to 4:59 AM | 313 (5.0%) | 136 (3.4%) |
| 5:00 AM to 5:29 AM | 587 (9.3%) | 65 (1.6%) |
| 5:30 AM to 5:59 AM | 192 (3.1%) | 54 (1.4%) |
| 6:00 AM to 6:29 AM | 807 (12.9%) | 380 (9.6%) |
| 6:30 AM to 6:59 AM | 332 (5.3%) | 338 (8.6%) |
| 7:00 AM to 7:29 AM | 1,063 (16.9%) | 425 (10.7%) |
| 7:30 AM to 7:59 AM | 643 (10.2%) | 470 (11.9%) |
| 8:00 AM to 8:29 AM | 607 (9.7%) | 522 (13.2%) |
| 8:30 AM to 8:59 AM | 374 (6.0%) | 417 (10.5%) |
| 9:00 AM to 9:59 AM | 345 (5.5%) | 430 (10.9%) |
| 10:00 AM to 10:59 AM | 335 (5.3%) | 394 (10.0%) |
| 11:00 AM to 11:59 AM | 126 (2.0%) | 41 (1.0%) |
| 12:00 PM to 3:59 PM | 261 (4.2%) | 156 (4.0%) |
| 4:00 PM to 11:59 PM | 290 (4.6%) | 125 (3.2%) |
| Total | 6,275 (100.0%) | 3,953 (100.0%) |
Housing Occupancy in Bailey s Crossroads
Occupancy by Ownership in Bailey s Crossroads
Of the total 9,545 dwellings in Bailey s Crossroads, owner-occupied units account for 4,398 (46.1%), while renter-occupied units make up 5,147 (53.9%).
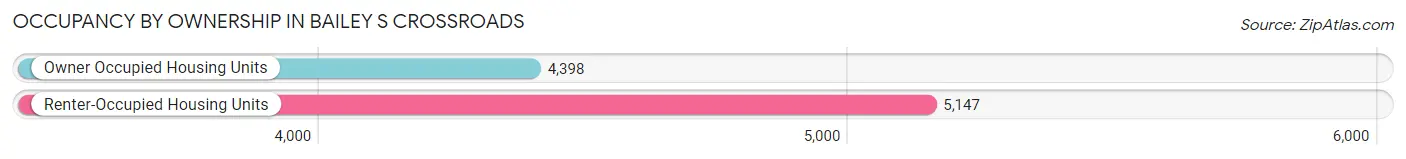
| Occupancy | # Housing Units | % Housing Units |
| Owner Occupied Housing Units | 4,398 | 46.1% |
| Renter-Occupied Housing Units | 5,147 | 53.9% |
| Total Occupied Housing Units | 9,545 | 100.0% |
Occupancy by Household Size in Bailey s Crossroads
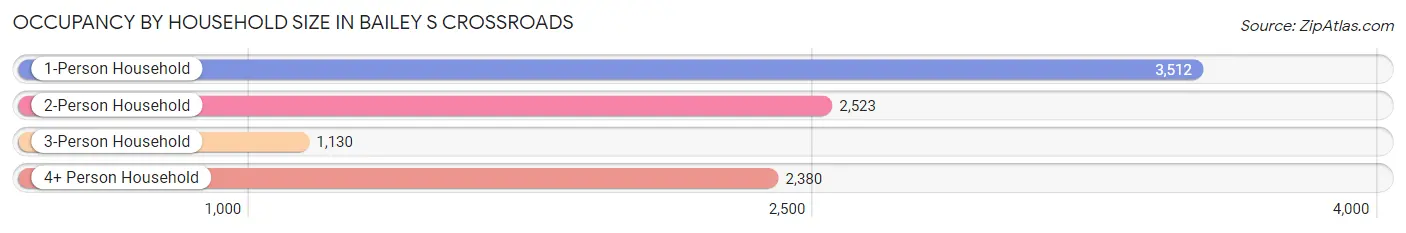
| Household Size | # Housing Units | % Housing Units |
| 1-Person Household | 3,512 | 36.8% |
| 2-Person Household | 2,523 | 26.4% |
| 3-Person Household | 1,130 | 11.8% |
| 4+ Person Household | 2,380 | 24.9% |
| Total Housing Units | 9,545 | 100.0% |
Occupancy by Ownership by Household Size in Bailey s Crossroads
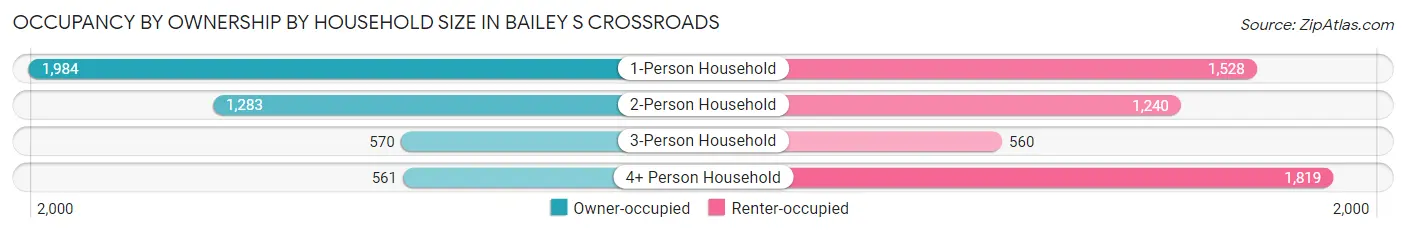
| Household Size | Owner-occupied | Renter-occupied |
| 1-Person Household | 1,984 (56.5%) | 1,528 (43.5%) |
| 2-Person Household | 1,283 (50.8%) | 1,240 (49.1%) |
| 3-Person Household | 570 (50.4%) | 560 (49.6%) |
| 4+ Person Household | 561 (23.6%) | 1,819 (76.4%) |
| Total Housing Units | 4,398 (46.1%) | 5,147 (53.9%) |
Occupancy by Educational Attainment in Bailey s Crossroads
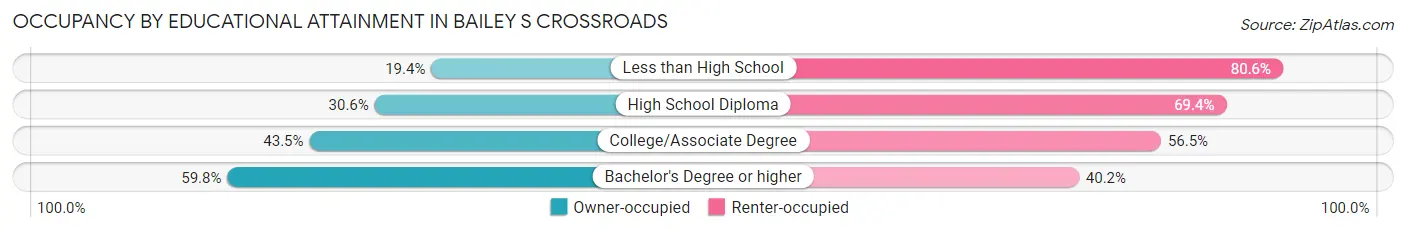
| Household Size | Owner-occupied | Renter-occupied |
| Less than High School | 296 (19.4%) | 1,231 (80.6%) |
| High School Diploma | 377 (30.6%) | 855 (69.4%) |
| College/Associate Degree | 893 (43.5%) | 1,158 (56.5%) |
| Bachelor's Degree or higher | 2,832 (59.8%) | 1,903 (40.2%) |
Occupancy by Age of Householder in Bailey s Crossroads
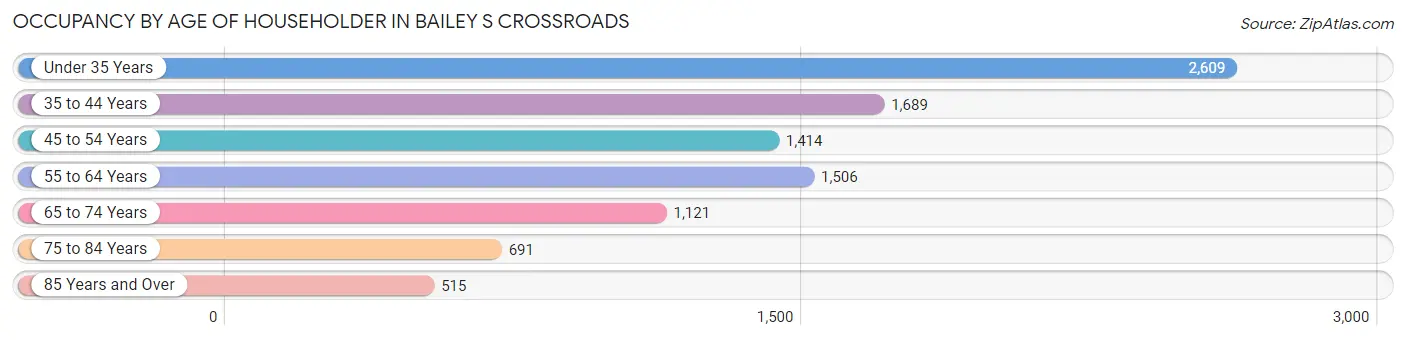
| Age Bracket | # Households | % Households |
| Under 35 Years | 2,609 | 27.3% |
| 35 to 44 Years | 1,689 | 17.7% |
| 45 to 54 Years | 1,414 | 14.8% |
| 55 to 64 Years | 1,506 | 15.8% |
| 65 to 74 Years | 1,121 | 11.7% |
| 75 to 84 Years | 691 | 7.2% |
| 85 Years and Over | 515 | 5.4% |
| Total | 9,545 | 100.0% |
Housing Finances in Bailey s Crossroads
Median Income by Occupancy in Bailey s Crossroads
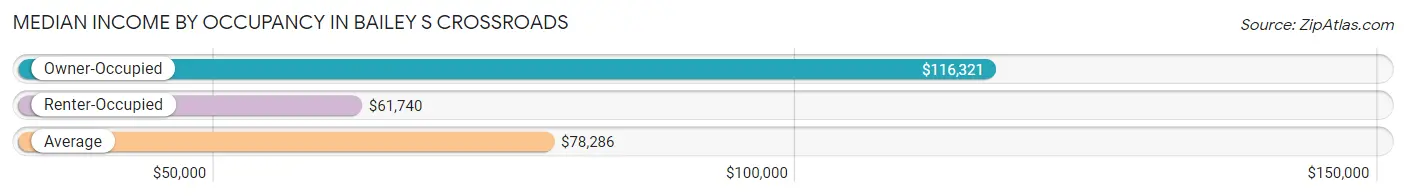
| Occupancy Type | # Households | Median Income |
| Owner-Occupied | 4,398 (46.1%) | $116,321 |
| Renter-Occupied | 5,147 (53.9%) | $61,740 |
| Average | 9,545 (100.0%) | $78,286 |
Occupancy by Householder Income Bracket in Bailey s Crossroads
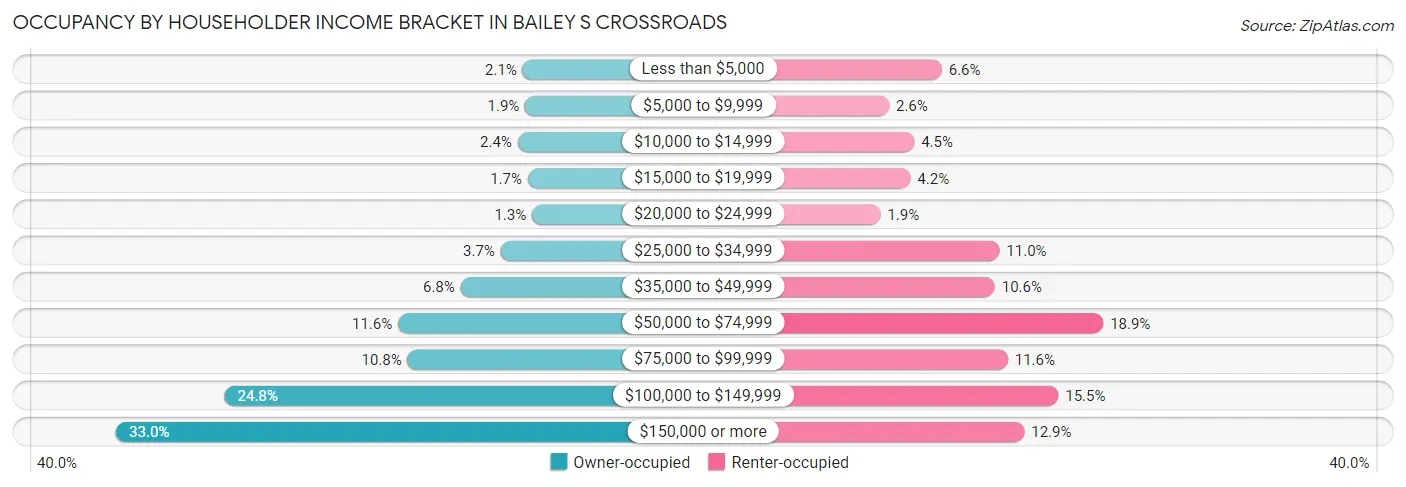
| Income Bracket | Owner-occupied | Renter-occupied |
| Less than $5,000 | 90 (2.1%) | 338 (6.6%) |
| $5,000 to $9,999 | 82 (1.9%) | 131 (2.5%) |
| $10,000 to $14,999 | 107 (2.4%) | 230 (4.5%) |
| $15,000 to $19,999 | 73 (1.7%) | 215 (4.2%) |
| $20,000 to $24,999 | 59 (1.3%) | 98 (1.9%) |
| $25,000 to $34,999 | 164 (3.7%) | 564 (11.0%) |
| $35,000 to $49,999 | 298 (6.8%) | 546 (10.6%) |
| $50,000 to $74,999 | 508 (11.6%) | 971 (18.9%) |
| $75,000 to $99,999 | 476 (10.8%) | 597 (11.6%) |
| $100,000 to $149,999 | 1,089 (24.8%) | 795 (15.4%) |
| $150,000 or more | 1,452 (33.0%) | 662 (12.9%) |
| Total | 4,398 (100.0%) | 5,147 (100.0%) |
Monthly Housing Cost Tiers in Bailey s Crossroads
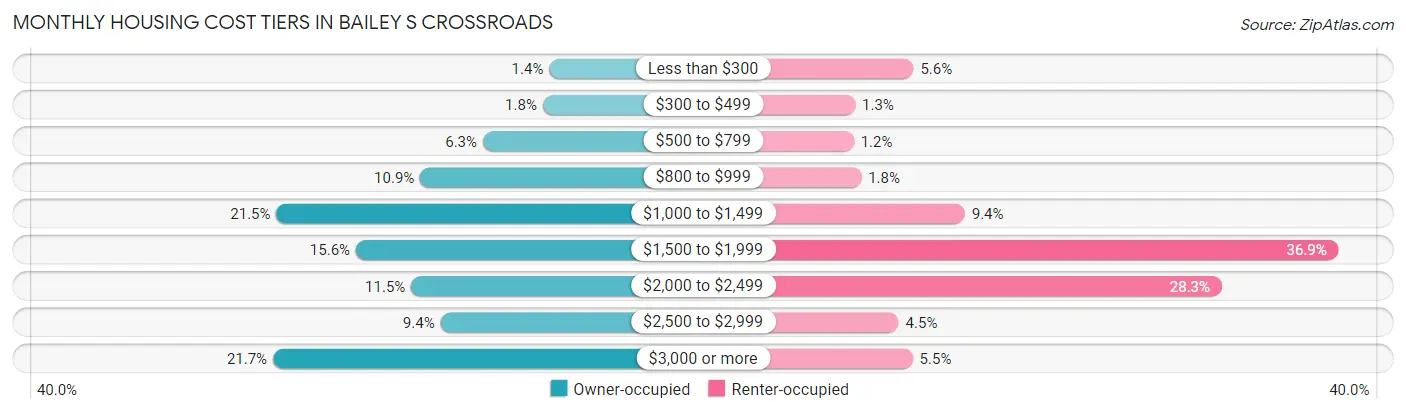
| Monthly Cost | Owner-occupied | Renter-occupied |
| Less than $300 | 60 (1.4%) | 288 (5.6%) |
| $300 to $499 | 81 (1.8%) | 67 (1.3%) |
| $500 to $799 | 275 (6.2%) | 62 (1.2%) |
| $800 to $999 | 478 (10.9%) | 90 (1.8%) |
| $1,000 to $1,499 | 944 (21.5%) | 483 (9.4%) |
| $1,500 to $1,999 | 686 (15.6%) | 1,900 (36.9%) |
| $2,000 to $2,499 | 507 (11.5%) | 1,457 (28.3%) |
| $2,500 to $2,999 | 412 (9.4%) | 232 (4.5%) |
| $3,000 or more | 955 (21.7%) | 285 (5.5%) |
| Total | 4,398 (100.0%) | 5,147 (100.0%) |
Physical Housing Characteristics in Bailey s Crossroads
Housing Structures in Bailey s Crossroads
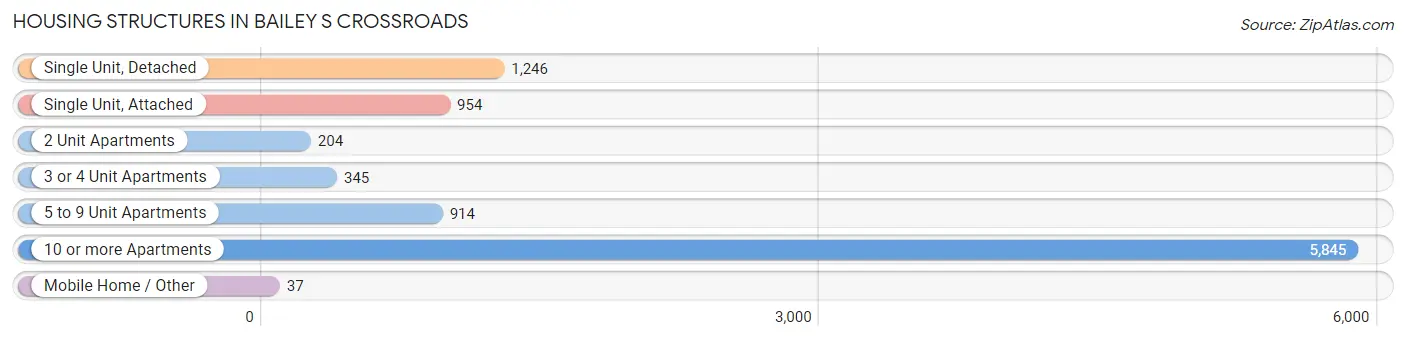
| Structure Type | # Housing Units | % Housing Units |
| Single Unit, Detached | 1,246 | 13.1% |
| Single Unit, Attached | 954 | 10.0% |
| 2 Unit Apartments | 204 | 2.1% |
| 3 or 4 Unit Apartments | 345 | 3.6% |
| 5 to 9 Unit Apartments | 914 | 9.6% |
| 10 or more Apartments | 5,845 | 61.2% |
| Mobile Home / Other | 37 | 0.4% |
| Total | 9,545 | 100.0% |
Housing Structures by Occupancy in Bailey s Crossroads
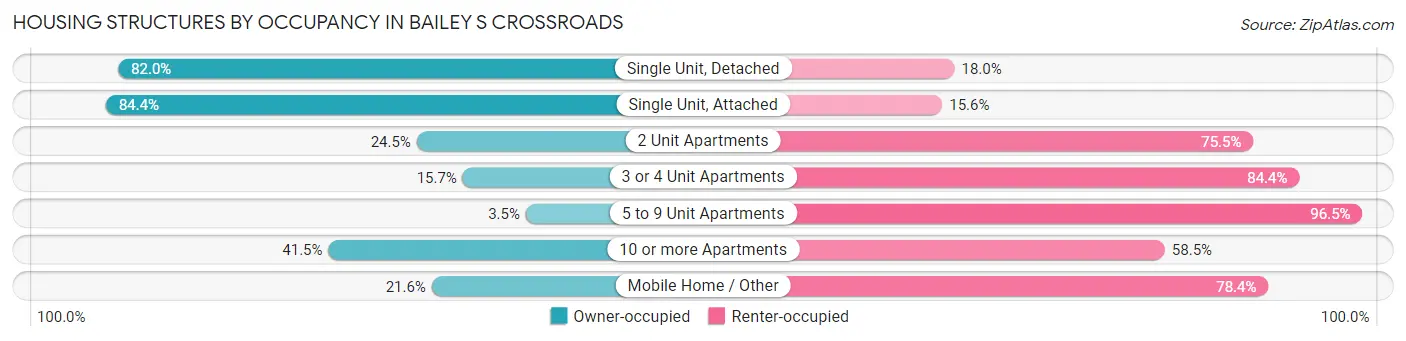
| Structure Type | Owner-occupied | Renter-occupied |
| Single Unit, Detached | 1,022 (82.0%) | 224 (18.0%) |
| Single Unit, Attached | 805 (84.4%) | 149 (15.6%) |
| 2 Unit Apartments | 50 (24.5%) | 154 (75.5%) |
| 3 or 4 Unit Apartments | 54 (15.7%) | 291 (84.4%) |
| 5 to 9 Unit Apartments | 32 (3.5%) | 882 (96.5%) |
| 10 or more Apartments | 2,427 (41.5%) | 3,418 (58.5%) |
| Mobile Home / Other | 8 (21.6%) | 29 (78.4%) |
| Total | 4,398 (46.1%) | 5,147 (53.9%) |
Housing Structures by Number of Rooms in Bailey s Crossroads
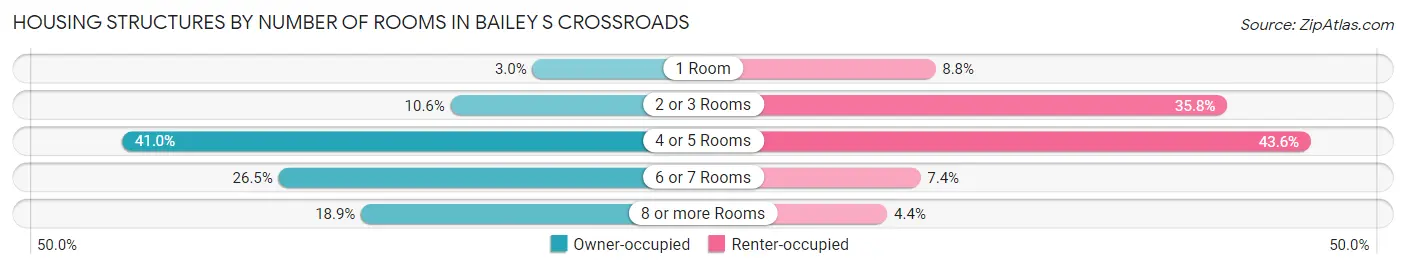
| Number of Rooms | Owner-occupied | Renter-occupied |
| 1 Room | 133 (3.0%) | 454 (8.8%) |
| 2 or 3 Rooms | 466 (10.6%) | 1,843 (35.8%) |
| 4 or 5 Rooms | 1,803 (41.0%) | 2,242 (43.6%) |
| 6 or 7 Rooms | 1,166 (26.5%) | 383 (7.4%) |
| 8 or more Rooms | 830 (18.9%) | 225 (4.4%) |
| Total | 4,398 (100.0%) | 5,147 (100.0%) |
Housing Structure by Heating Type in Bailey s Crossroads
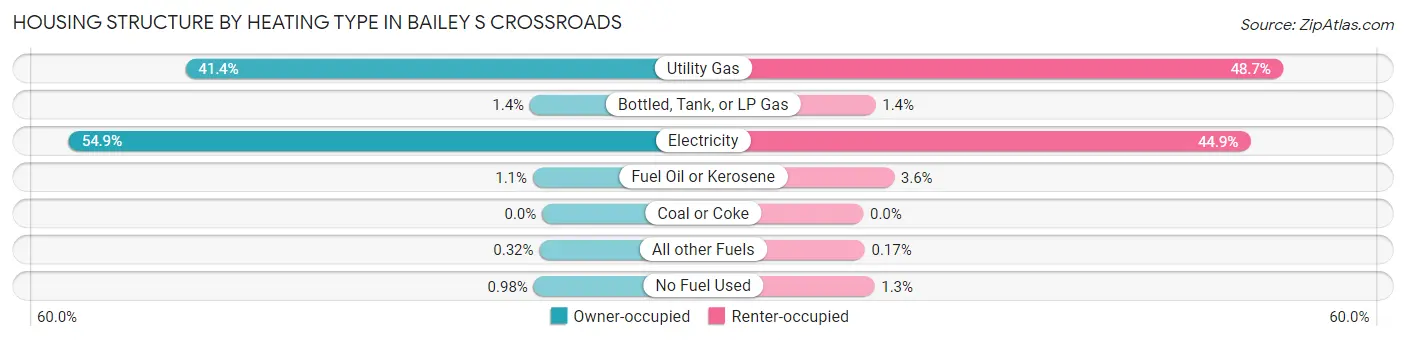
| Heating Type | Owner-occupied | Renter-occupied |
| Utility Gas | 1,819 (41.4%) | 2,504 (48.6%) |
| Bottled, Tank, or LP Gas | 62 (1.4%) | 73 (1.4%) |
| Electricity | 2,413 (54.9%) | 2,310 (44.9%) |
| Fuel Oil or Kerosene | 47 (1.1%) | 184 (3.6%) |
| Coal or Coke | 0 (0.0%) | 0 (0.0%) |
| All other Fuels | 14 (0.3%) | 9 (0.2%) |
| No Fuel Used | 43 (1.0%) | 67 (1.3%) |
| Total | 4,398 (100.0%) | 5,147 (100.0%) |
Household Vehicle Usage in Bailey s Crossroads
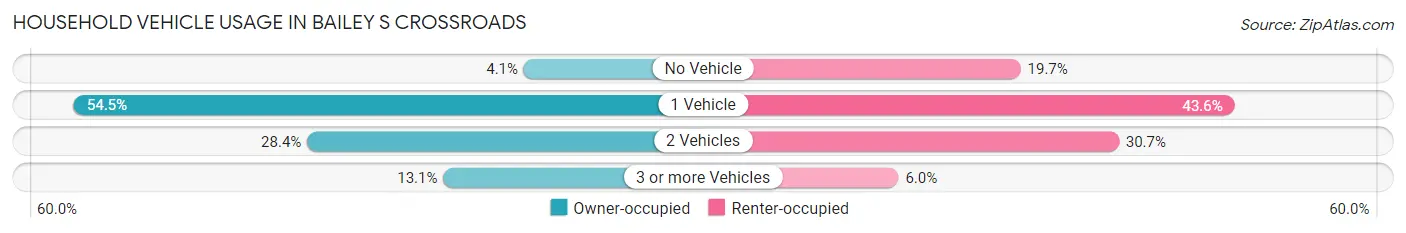
| Vehicles per Household | Owner-occupied | Renter-occupied |
| No Vehicle | 179 (4.1%) | 1,013 (19.7%) |
| 1 Vehicle | 2,396 (54.5%) | 2,246 (43.6%) |
| 2 Vehicles | 1,247 (28.3%) | 1,579 (30.7%) |
| 3 or more Vehicles | 576 (13.1%) | 309 (6.0%) |
| Total | 4,398 (100.0%) | 5,147 (100.0%) |
Real Estate & Mortgages in Bailey s Crossroads
Real Estate and Mortgage Overview in Bailey s Crossroads
| Characteristic | Without Mortgage | With Mortgage |
| Housing Units | 1,633 | 2,765 |
| Median Property Value | $376,600 | $392,600 |
| Median Household Income | $116,250 | $961 |
| Monthly Housing Costs | $980 | $955 |
| Real Estate Taxes | $4,305 | $154 |
Property Value by Mortgage Status in Bailey s Crossroads
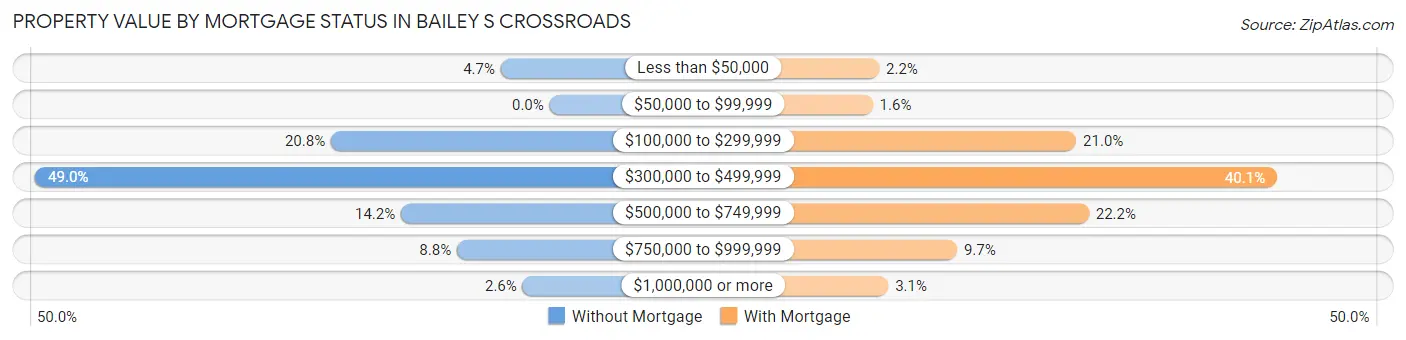
| Property Value | Without Mortgage | With Mortgage |
| Less than $50,000 | 76 (4.6%) | 62 (2.2%) |
| $50,000 to $99,999 | 0 (0.0%) | 45 (1.6%) |
| $100,000 to $299,999 | 340 (20.8%) | 581 (21.0%) |
| $300,000 to $499,999 | 800 (49.0%) | 1,110 (40.1%) |
| $500,000 to $749,999 | 231 (14.1%) | 614 (22.2%) |
| $750,000 to $999,999 | 144 (8.8%) | 267 (9.7%) |
| $1,000,000 or more | 42 (2.6%) | 86 (3.1%) |
| Total | 1,633 (100.0%) | 2,765 (100.0%) |
Household Income by Mortgage Status in Bailey s Crossroads
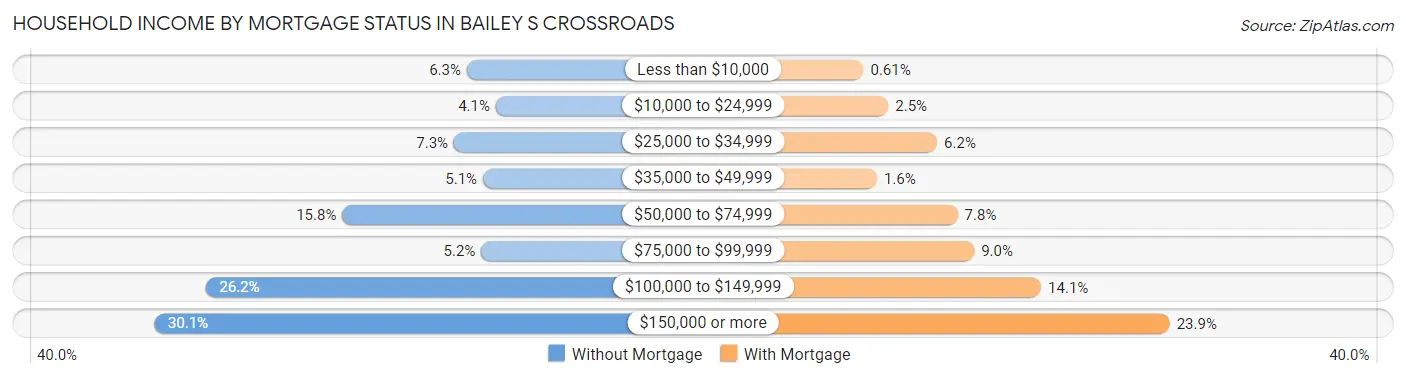
| Household Income | Without Mortgage | With Mortgage |
| Less than $10,000 | 103 (6.3%) | 17 (0.6%) |
| $10,000 to $24,999 | 67 (4.1%) | 69 (2.5%) |
| $25,000 to $34,999 | 119 (7.3%) | 172 (6.2%) |
| $35,000 to $49,999 | 83 (5.1%) | 45 (1.6%) |
| $50,000 to $74,999 | 258 (15.8%) | 215 (7.8%) |
| $75,000 to $99,999 | 85 (5.2%) | 250 (9.0%) |
| $100,000 to $149,999 | 427 (26.2%) | 391 (14.1%) |
| $150,000 or more | 491 (30.1%) | 662 (23.9%) |
| Total | 1,633 (100.0%) | 2,765 (100.0%) |
Property Value to Household Income Ratio in Bailey s Crossroads
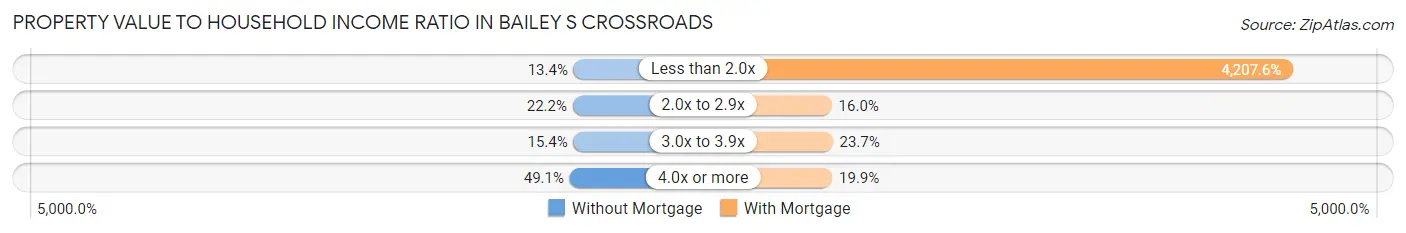
| Value-to-Income Ratio | Without Mortgage | With Mortgage |
| Less than 2.0x | 218 (13.4%) | 116,341 (4,207.6%) |
| 2.0x to 2.9x | 362 (22.2%) | 441 (16.0%) |
| 3.0x to 3.9x | 252 (15.4%) | 656 (23.7%) |
| 4.0x or more | 801 (49.0%) | 550 (19.9%) |
| Total | 1,633 (100.0%) | 2,765 (100.0%) |
Real Estate Taxes by Mortgage Status in Bailey s Crossroads
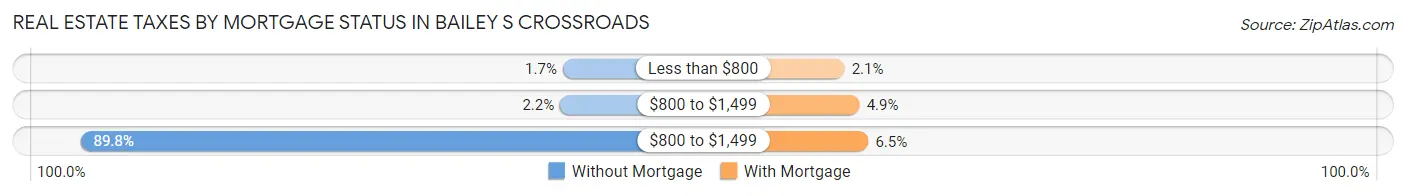
| Property Taxes | Without Mortgage | With Mortgage |
| Less than $800 | 28 (1.7%) | 59 (2.1%) |
| $800 to $1,499 | 36 (2.2%) | 135 (4.9%) |
| $800 to $1,499 | 1,466 (89.8%) | 179 (6.5%) |
| Total | 1,633 (100.0%) | 2,765 (100.0%) |
Health & Disability in Bailey s Crossroads
Health Insurance Coverage by Age in Bailey s Crossroads
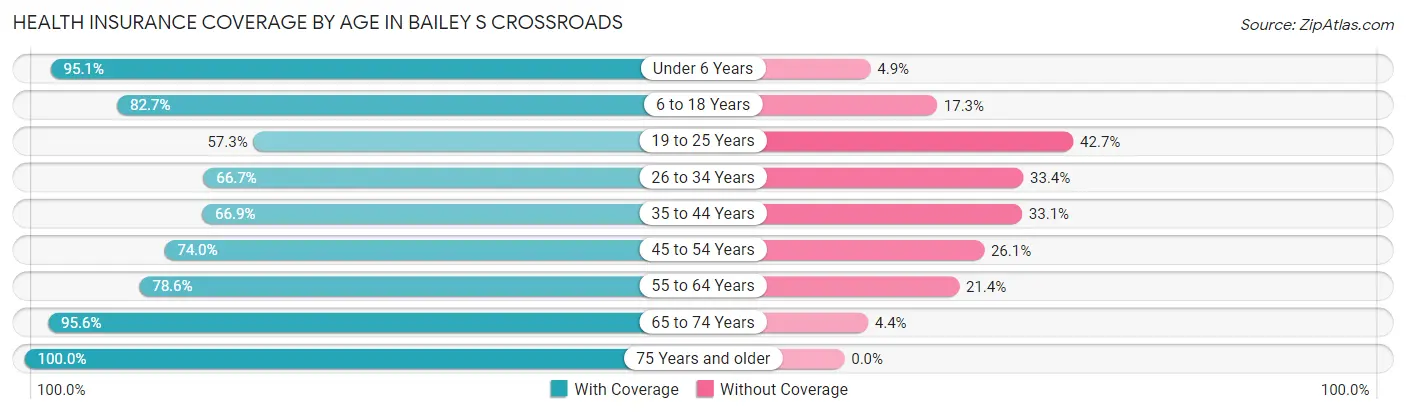
| Age Bracket | With Coverage | Without Coverage |
| Under 6 Years | 2,563 (95.1%) | 131 (4.9%) |
| 6 to 18 Years | 2,895 (82.7%) | 604 (17.3%) |
| 19 to 25 Years | 1,136 (57.3%) | 846 (42.7%) |
| 26 to 34 Years | 3,094 (66.6%) | 1,548 (33.4%) |
| 35 to 44 Years | 2,096 (66.9%) | 1,038 (33.1%) |
| 45 to 54 Years | 2,069 (74.0%) | 729 (26.1%) |
| 55 to 64 Years | 1,987 (78.6%) | 541 (21.4%) |
| 65 to 74 Years | 1,569 (95.6%) | 72 (4.4%) |
| 75 Years and older | 1,686 (100.0%) | 0 (0.0%) |
| Total | 19,095 (77.6%) | 5,509 (22.4%) |
Health Insurance Coverage by Citizenship Status in Bailey s Crossroads
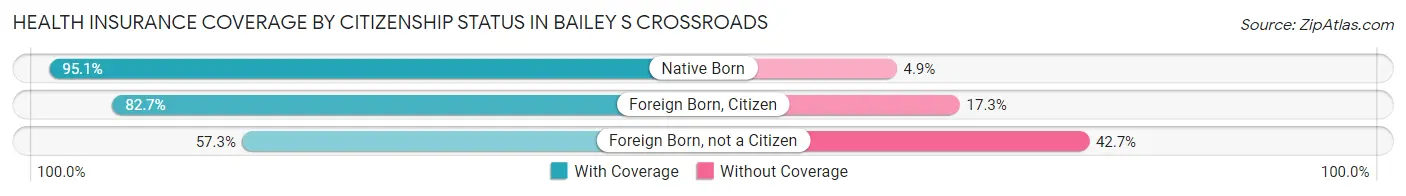
| Citizenship Status | With Coverage | Without Coverage |
| Native Born | 2,563 (95.1%) | 131 (4.9%) |
| Foreign Born, Citizen | 2,895 (82.7%) | 604 (17.3%) |
| Foreign Born, not a Citizen | 1,136 (57.3%) | 846 (42.7%) |
Health Insurance Coverage by Household Income in Bailey s Crossroads
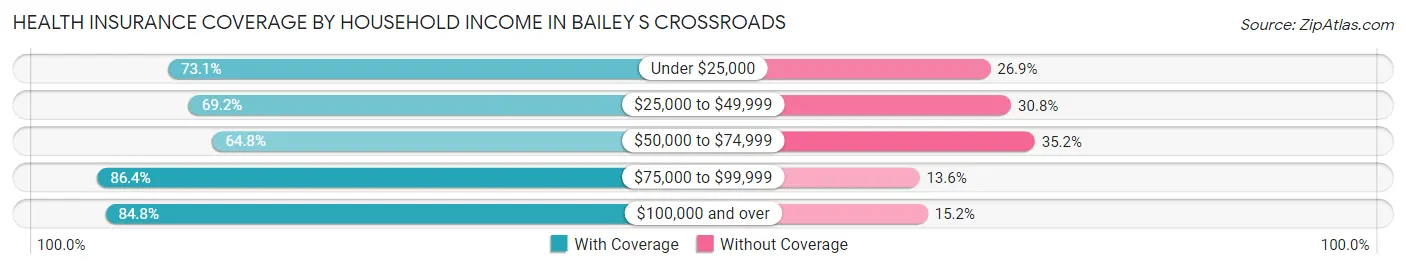
| Household Income | With Coverage | Without Coverage |
| Under $25,000 | 2,339 (73.1%) | 860 (26.9%) |
| $25,000 to $49,999 | 3,098 (69.2%) | 1,378 (30.8%) |
| $50,000 to $74,999 | 2,381 (64.8%) | 1,295 (35.2%) |
| $75,000 to $99,999 | 1,934 (86.4%) | 305 (13.6%) |
| $100,000 and over | 9,268 (84.8%) | 1,658 (15.2%) |
Public vs Private Health Insurance Coverage by Age in Bailey s Crossroads
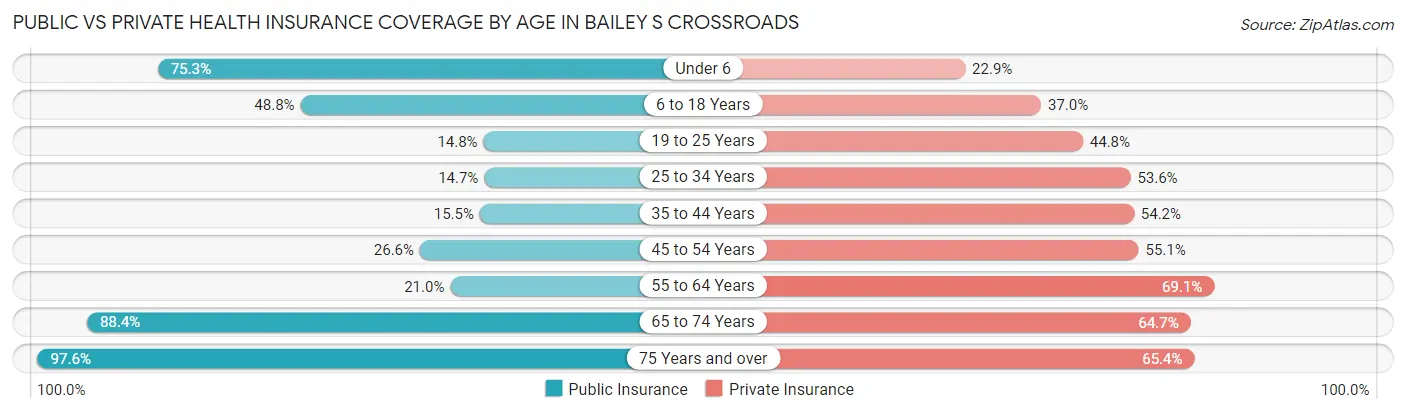
| Age Bracket | Public Insurance | Private Insurance |
| Under 6 | 2,028 (75.3%) | 617 (22.9%) |
| 6 to 18 Years | 1,708 (48.8%) | 1,294 (37.0%) |
| 19 to 25 Years | 294 (14.8%) | 887 (44.8%) |
| 25 to 34 Years | 682 (14.7%) | 2,487 (53.6%) |
| 35 to 44 Years | 486 (15.5%) | 1,699 (54.2%) |
| 45 to 54 Years | 745 (26.6%) | 1,541 (55.1%) |
| 55 to 64 Years | 531 (21.0%) | 1,747 (69.1%) |
| 65 to 74 Years | 1,451 (88.4%) | 1,062 (64.7%) |
| 75 Years and over | 1,645 (97.6%) | 1,103 (65.4%) |
| Total | 9,570 (38.9%) | 12,437 (50.5%) |
Disability Status by Sex by Age in Bailey s Crossroads
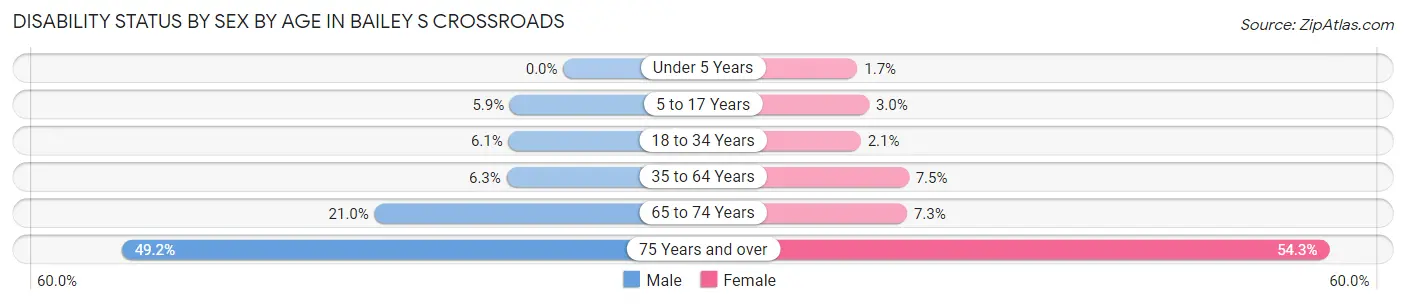
| Age Bracket | Male | Female |
| Under 5 Years | 0 (0.0%) | 18 (1.7%) |
| 5 to 17 Years | 121 (5.9%) | 49 (3.0%) |
| 18 to 34 Years | 234 (6.1%) | 61 (2.1%) |
| 35 to 64 Years | 258 (6.3%) | 326 (7.4%) |
| 65 to 74 Years | 177 (21.0%) | 58 (7.3%) |
| 75 Years and over | 329 (49.2%) | 552 (54.3%) |
Disability Class by Sex by Age in Bailey s Crossroads
Disability Class: Hearing Difficulty
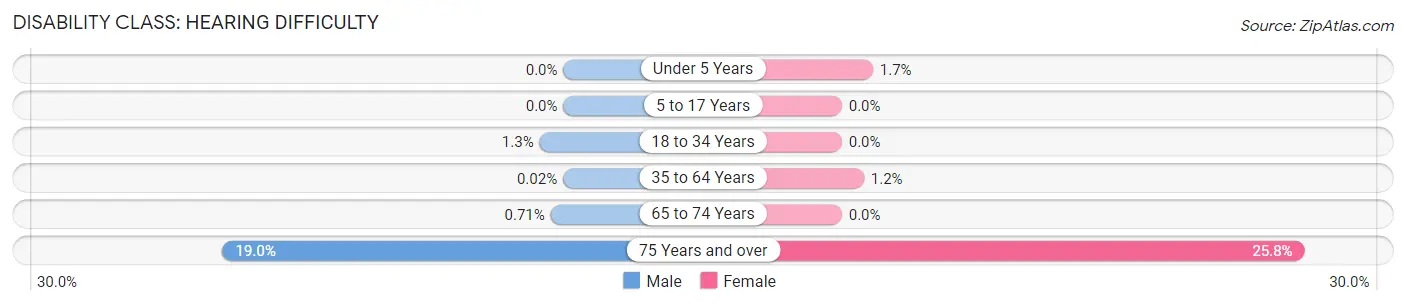
| Age Bracket | Male | Female |
| Under 5 Years | 0 (0.0%) | 18 (1.7%) |
| 5 to 17 Years | 0 (0.0%) | 0 (0.0%) |
| 18 to 34 Years | 51 (1.3%) | 0 (0.0%) |
| 35 to 64 Years | 1 (0.0%) | 54 (1.2%) |
| 65 to 74 Years | 6 (0.7%) | 0 (0.0%) |
| 75 Years and over | 127 (19.0%) | 262 (25.8%) |
Disability Class: Vision Difficulty
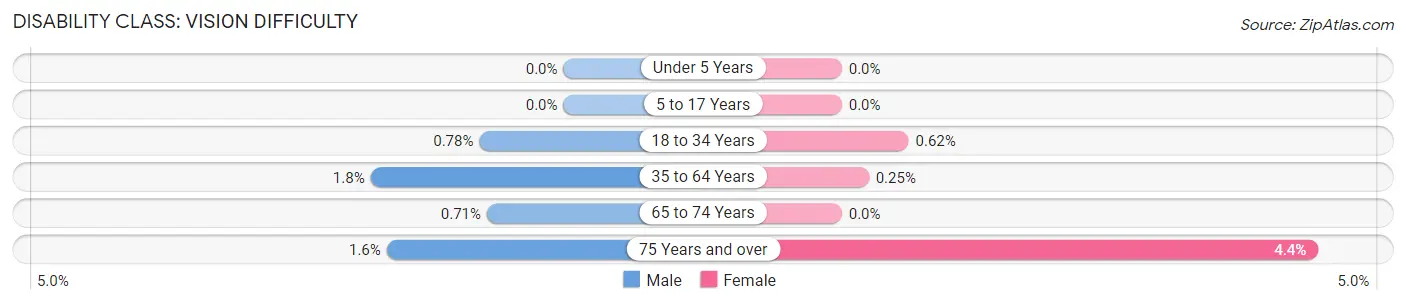
| Age Bracket | Male | Female |
| Under 5 Years | 0 (0.0%) | 0 (0.0%) |
| 5 to 17 Years | 0 (0.0%) | 0 (0.0%) |
| 18 to 34 Years | 30 (0.8%) | 18 (0.6%) |
| 35 to 64 Years | 73 (1.8%) | 11 (0.3%) |
| 65 to 74 Years | 6 (0.7%) | 0 (0.0%) |
| 75 Years and over | 11 (1.6%) | 45 (4.4%) |
Disability Class: Cognitive Difficulty
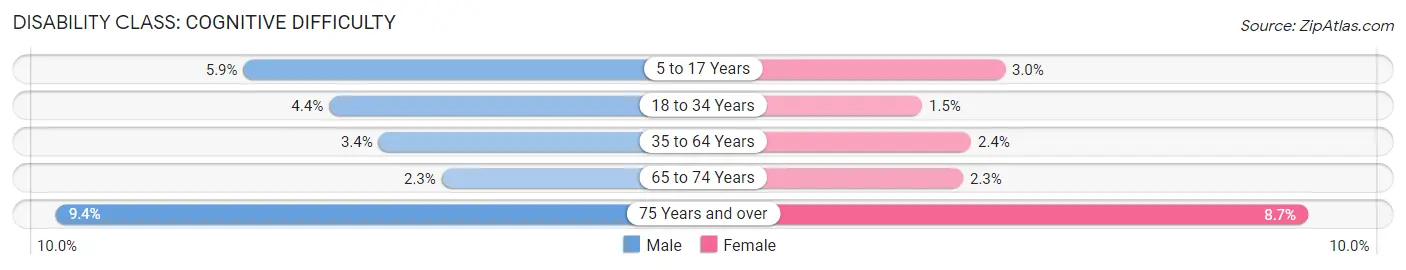
| Age Bracket | Male | Female |
| 5 to 17 Years | 121 (5.9%) | 49 (3.0%) |
| 18 to 34 Years | 167 (4.3%) | 43 (1.5%) |
| 35 to 64 Years | 140 (3.4%) | 105 (2.4%) |
| 65 to 74 Years | 19 (2.3%) | 18 (2.2%) |
| 75 Years and over | 63 (9.4%) | 88 (8.6%) |
Disability Class: Ambulatory Difficulty
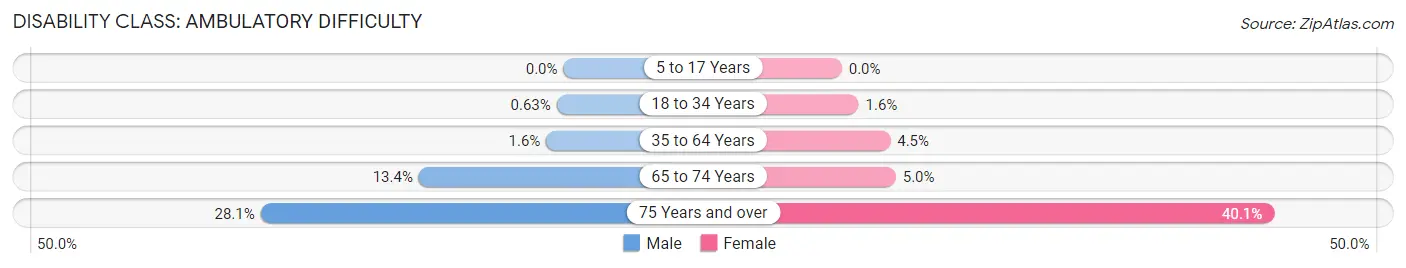
| Age Bracket | Male | Female |
| 5 to 17 Years | 0 (0.0%) | 0 (0.0%) |
| 18 to 34 Years | 24 (0.6%) | 45 (1.6%) |
| 35 to 64 Years | 65 (1.6%) | 197 (4.5%) |
| 65 to 74 Years | 113 (13.4%) | 40 (5.0%) |
| 75 Years and over | 188 (28.1%) | 408 (40.1%) |
Disability Class: Self-Care Difficulty
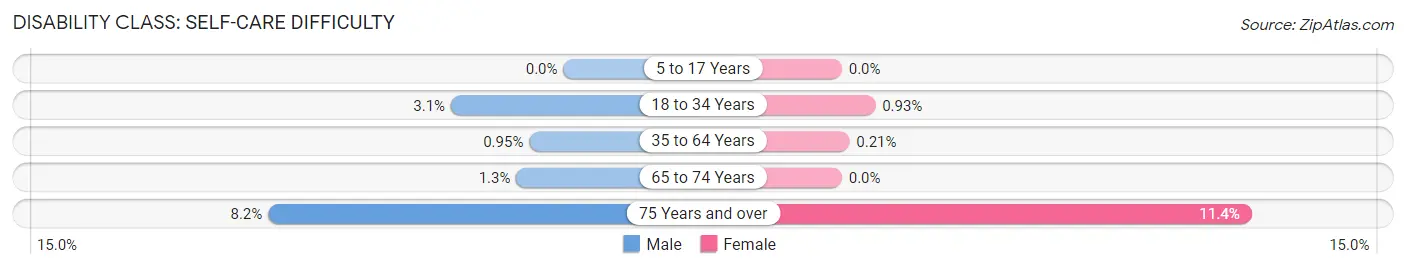
| Age Bracket | Male | Female |
| 5 to 17 Years | 0 (0.0%) | 0 (0.0%) |
| 18 to 34 Years | 120 (3.1%) | 27 (0.9%) |
| 35 to 64 Years | 39 (0.9%) | 9 (0.2%) |
| 65 to 74 Years | 11 (1.3%) | 0 (0.0%) |
| 75 Years and over | 55 (8.2%) | 116 (11.4%) |
Technology Access in Bailey s Crossroads
Computing Device Access in Bailey s Crossroads
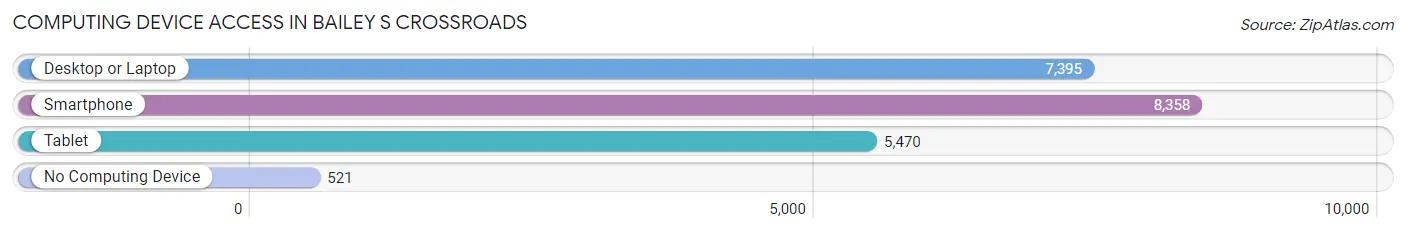
| Device Type | # Households | % Households |
| Desktop or Laptop | 7,395 | 77.5% |
| Smartphone | 8,358 | 87.6% |
| Tablet | 5,470 | 57.3% |
| No Computing Device | 521 | 5.5% |
| Total | 9,545 | 100.0% |
Internet Access in Bailey s Crossroads
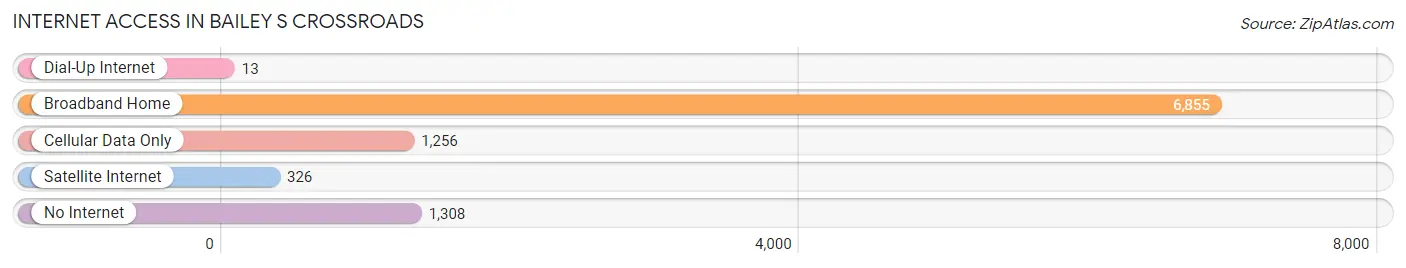
| Internet Type | # Households | % Households |
| Dial-Up Internet | 13 | 0.1% |
| Broadband Home | 6,855 | 71.8% |
| Cellular Data Only | 1,256 | 13.2% |
| Satellite Internet | 326 | 3.4% |
| No Internet | 1,308 | 13.7% |
| Total | 9,545 | 100.0% |
Bailey s Crossroads Summary
Bailey's Crossroads is an unincorporated community in Fairfax County, Virginia, located just south of the Washington, D.C. border. It is a densely populated area with a diverse population, and is home to a variety of businesses, restaurants, and other amenities.
History
The area now known as Bailey's Crossroads was first settled in the late 1700s by the Bailey family, who owned a large tract of land in the area. The family built a crossroads at the intersection of what is now Leesburg Pike and Columbia Pike, and the area became known as Bailey's Crossroads.
In the early 1900s, the area began to develop as a residential community. The first homes were built in the 1920s, and the area continued to grow throughout the mid-20th century. By the 1960s, the area had become a bustling suburban community, with a variety of businesses, restaurants, and other amenities.
Geography
Bailey's Crossroads is located in Fairfax County, Virginia, just south of the Washington, D.C. border. It is bordered by the cities of Falls Church and Arlington to the north, and the towns of Vienna and Dunn Loring to the south. The area is situated at the intersection of Leesburg Pike and Columbia Pike, and is approximately 8 miles from downtown Washington, D.C.
The area is characterized by its dense population and urban development. It is home to a variety of businesses, restaurants, and other amenities, as well as several parks and recreational areas.
Economy
Bailey's Crossroads is home to a variety of businesses, including retail stores, restaurants, and other services. The area is also home to a number of corporate offices, including those of the defense contractor Northrop Grumman and the software company Oracle.
The area is also home to a number of government agencies, including the Department of Homeland Security, the Department of Defense, and the Department of Transportation.
Demographics
As of the 2010 census, the population of Bailey's Crossroads was 24,917. The population is diverse, with a mix of races and ethnicities. The largest racial group is White (63.3%), followed by Asian (17.2%), Hispanic or Latino (7.7%), and African American (6.7%).
The median household income in Bailey's Crossroads is $77,845, and the median home value is $521,000. The area is well-educated, with over half of the population having a bachelor's degree or higher.
Conclusion
Bailey's Crossroads is an unincorporated community in Fairfax County, Virginia, located just south of the Washington, D.C. border. It is a densely populated area with a diverse population, and is home to a variety of businesses, restaurants, and other amenities. The area is characterized by its dense population and urban development, and is home to a variety of businesses, government agencies, and recreational areas. The population is diverse, with a mix of races and ethnicities, and the median household income is $77,845. Bailey's Crossroads is a vibrant and diverse community that offers a variety of amenities and opportunities for its residents.
Common Questions
What is Per Capita Income in Bailey s Crossroads?
Per Capita income in Bailey s Crossroads is $43,557.
What is the Median Family Income in Bailey s Crossroads?
Median Family Income in Bailey s Crossroads is $75,948.
What is the Median Household income in Bailey s Crossroads?
Median Household Income in Bailey s Crossroads is $78,286.
What is Income or Wage Gap in Bailey s Crossroads?
Income or Wage Gap in Bailey s Crossroads is 5.1%.
Women in Bailey s Crossroads earn 94.9 cents for every dollar earned by a man.
What is Inequality or Gini Index in Bailey s Crossroads?
Inequality or Gini Index in Bailey s Crossroads is 0.49.
What is the Total Population of Bailey s Crossroads?
Total Population of Bailey s Crossroads is 24,785.
What is the Total Male Population of Bailey s Crossroads?
Total Male Population of Bailey s Crossroads is 13,022.
What is the Total Female Population of Bailey s Crossroads?
Total Female Population of Bailey s Crossroads is 11,763.
What is the Ratio of Males per 100 Females in Bailey s Crossroads?
There are 110.70 Males per 100 Females in Bailey s Crossroads.
What is the Ratio of Females per 100 Males in Bailey s Crossroads?
There are 90.33 Females per 100 Males in Bailey s Crossroads.
What is the Median Population Age in Bailey s Crossroads?
Median Population Age in Bailey s Crossroads is 33.9 Years.
What is the Average Family Size in Bailey s Crossroads
Average Family Size in Bailey s Crossroads is 3.5 People.
What is the Average Household Size in Bailey s Crossroads
Average Household Size in Bailey s Crossroads is 2.6 People.
How Large is the Labor Force in Bailey s Crossroads?
There are 13,007 People in the Labor Forcein in Bailey s Crossroads.
What is the Percentage of People in the Labor Force in Bailey s Crossroads?
67.7% of People are in the Labor Force in Bailey s Crossroads.
What is the Unemployment Rate in Bailey s Crossroads?
Unemployment Rate in Bailey s Crossroads is 7.3%.