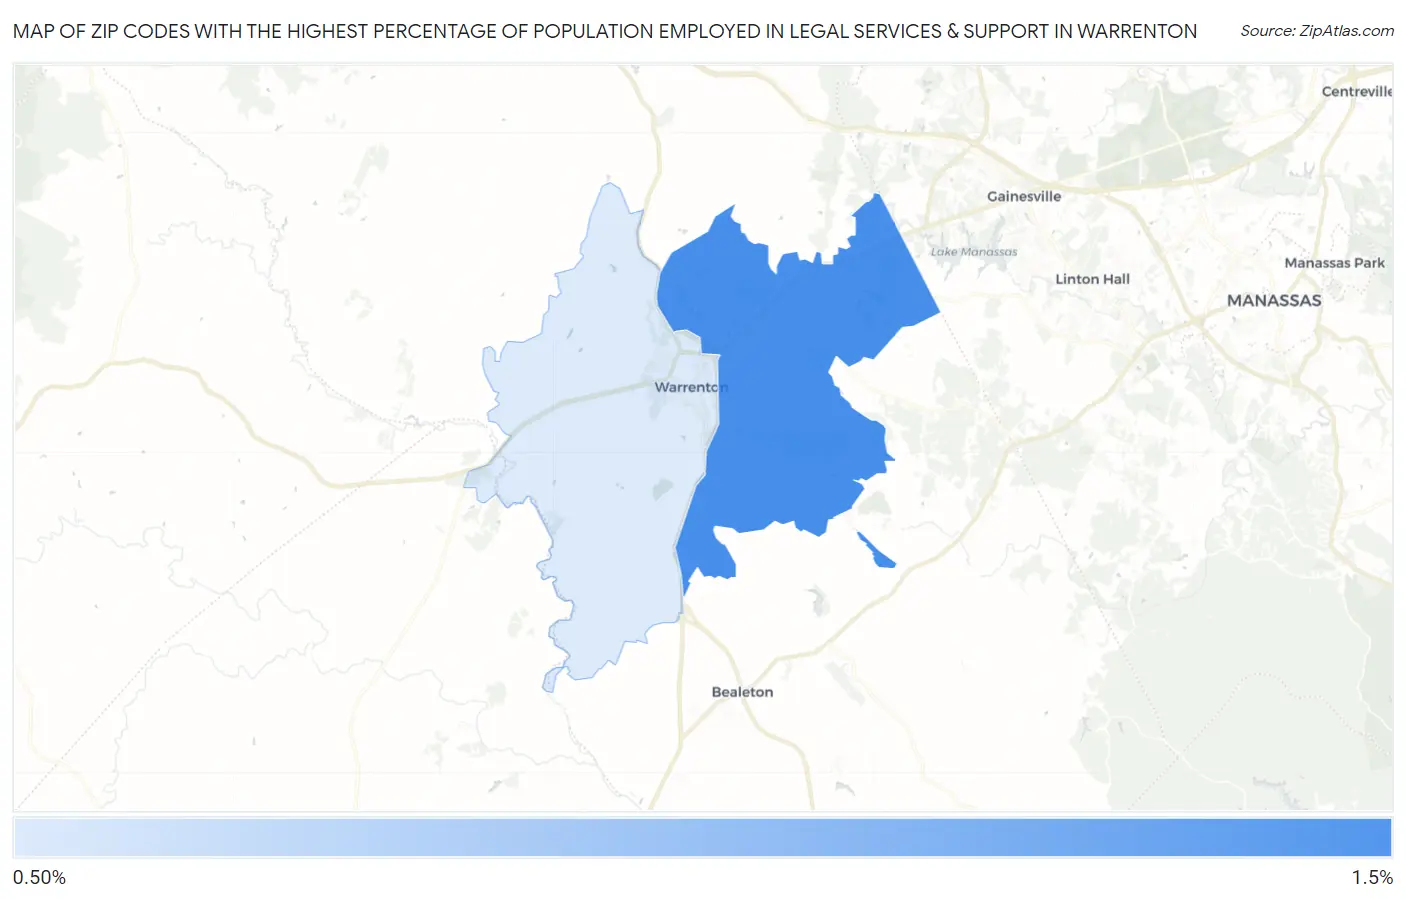
Zip Codes with the Highest Percentage of Population Employed in Legal Services & Support in Warrenton, VA
RELATED REPORTS & OPTIONS
Legal Services & Support
Warrenton
Compare Zip Codes
Map of Zip Codes with the Highest Percentage of Population Employed in Legal Services & Support in Warrenton
1.0%
1.4%
Zip Codes with the Highest Percentage of Population Employed in Legal Services & Support in Warrenton, VA
| Zip Code | % Employed | vs State | vs National | |
| 1. | 20187 | 1.4% | 1.6%(-0.218)#192 | 1.2%(+0.220)#5,452 |
| 2. | 20186 | 1.0% | 1.6%(-0.617)#248 | 1.2%(-0.178)#7,790 |
1
Common Questions
What are the Top Zip Codes with the Highest Percentage of Population Employed in Legal Services & Support in Warrenton, VA?
Top Zip Codes with the Highest Percentage of Population Employed in Legal Services & Support in Warrenton, VA are:
What zip code has the Highest Percentage of Population Employed in Legal Services & Support in Warrenton, VA?
20187 has the Highest Percentage of Population Employed in Legal Services & Support in Warrenton, VA with 1.4%.
What is the Percentage of Population Employed in Legal Services & Support in Warrenton, VA?
Percentage of Population Employed in Legal Services & Support in Warrenton is 0.84%.
What is the Percentage of Population Employed in Legal Services & Support in Virginia?
Percentage of Population Employed in Legal Services & Support in Virginia is 1.6%.
What is the Percentage of Population Employed in Legal Services & Support in the United States?
Percentage of Population Employed in Legal Services & Support in the United States is 1.2%.