Zip Codes with the Highest Percentage of Population Employed in Legal Services & Support in Chantilly, VA
RELATED REPORTS & OPTIONS
Legal Services & Support
Chantilly
Compare Zip Codes
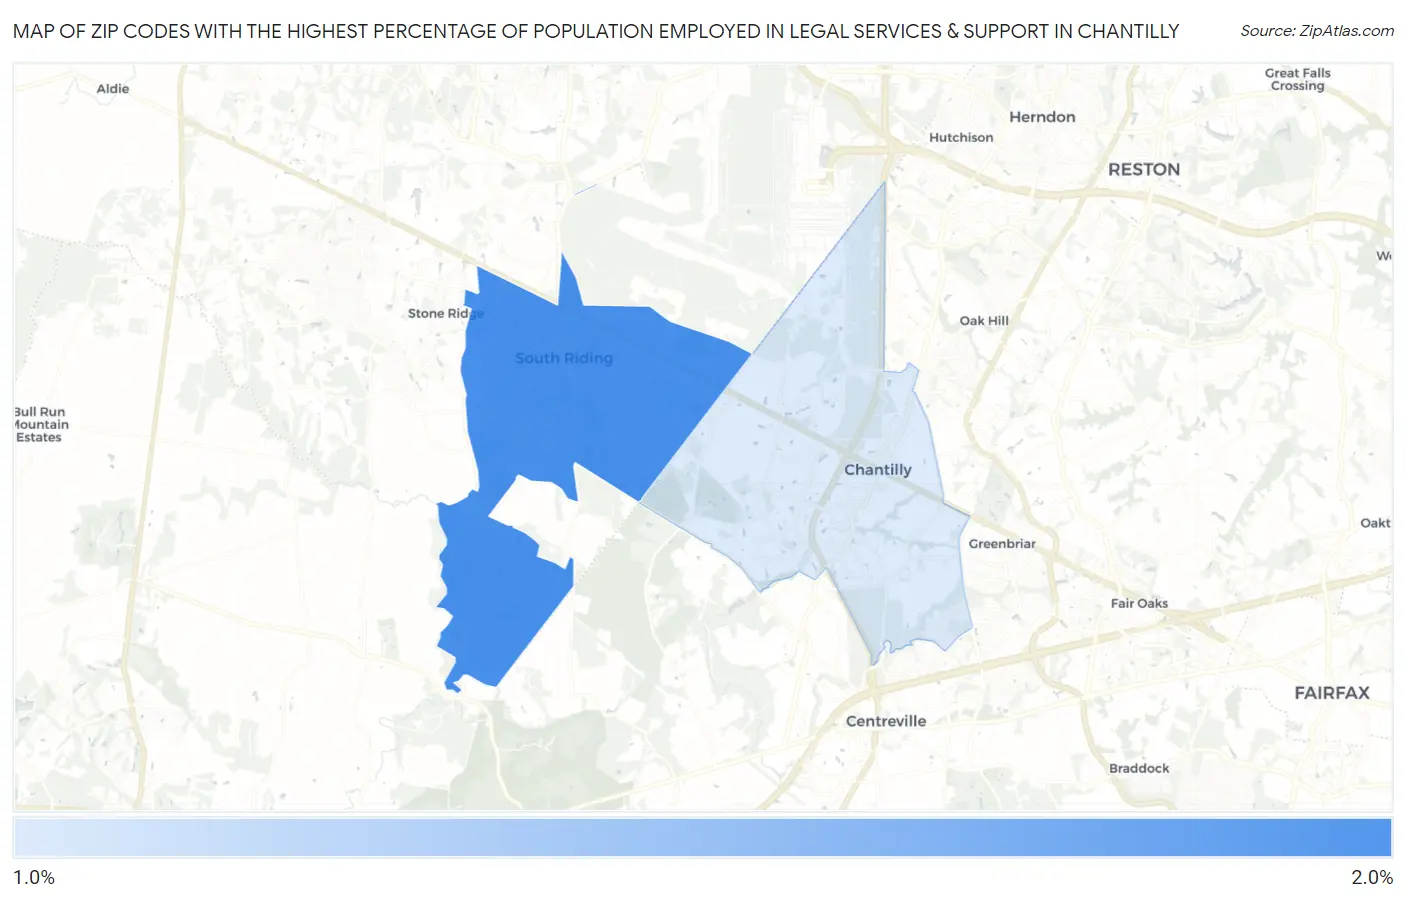
Map of Zip Codes with the Highest Percentage of Population Employed in Legal Services & Support in Chantilly
1.5%
1.6%
Zip Codes with the Highest Percentage of Population Employed in Legal Services & Support in Chantilly, VA
| Zip Code | % Employed | vs State | vs National | |
| 1. | 20152 | 1.6% | 1.6%(-0.052)#168 | 1.2%(+0.387)#4,779 |
| 2. | 20151 | 1.5% | 1.6%(-0.135)#179 | 1.2%(+0.303)#5,099 |
1
Common Questions
What are the Top Zip Codes with the Highest Percentage of Population Employed in Legal Services & Support in Chantilly, VA?
Top Zip Codes with the Highest Percentage of Population Employed in Legal Services & Support in Chantilly, VA are:
What zip code has the Highest Percentage of Population Employed in Legal Services & Support in Chantilly, VA?
20152 has the Highest Percentage of Population Employed in Legal Services & Support in Chantilly, VA with 1.6%.
What is the Percentage of Population Employed in Legal Services & Support in Chantilly, VA?
Percentage of Population Employed in Legal Services & Support in Chantilly is 1.4%.
What is the Percentage of Population Employed in Legal Services & Support in Virginia?
Percentage of Population Employed in Legal Services & Support in Virginia is 1.6%.
What is the Percentage of Population Employed in Legal Services & Support in the United States?
Percentage of Population Employed in Legal Services & Support in the United States is 1.2%.