Burkeville, VA Map & Demographics
Burkeville Map
Burkeville Overview
$32,130
PER CAPITA INCOME
$84,583
AVG FAMILY INCOME
$68,036
AVG HOUSEHOLD INCOME
54.9%
WAGE / INCOME GAP [ % ]
45.1¢/ $1
WAGE / INCOME GAP [ $ ]
0.41
INEQUALITY / GINI INDEX
485
TOTAL POPULATION
220
MALE POPULATION
265
FEMALE POPULATION
83.02
MALES / 100 FEMALES
120.45
FEMALES / 100 MALES
36.8
MEDIAN AGE
2.8
AVG FAMILY SIZE
2.5
AVG HOUSEHOLD SIZE
226
LABOR FORCE [ PEOPLE ]
61.1%
PERCENT IN LABOR FORCE
0.4%
UNEMPLOYMENT RATE
Burkeville Zip Codes
Burkeville Area Codes
Income in Burkeville
Income Overview in Burkeville
Per Capita Income in Burkeville is $32,130, while median incomes of families and households are $84,583 and $68,036 respectively.
| Characteristic | Number | Measure |
| Per Capita Income | 485 | $32,130 |
| Median Family Income | 147 | $84,583 |
| Mean Family Income | 147 | $85,430 |
| Median Household Income | 191 | $68,036 |
| Mean Household Income | 191 | $78,494 |
| Income Deficit | 147 | $0 |
| Wage / Income Gap (%) | 485 | 54.91% |
| Wage / Income Gap ($) | 485 | 45.09¢ per $1 |
| Gini / Inequality Index | 485 | 0.41 |
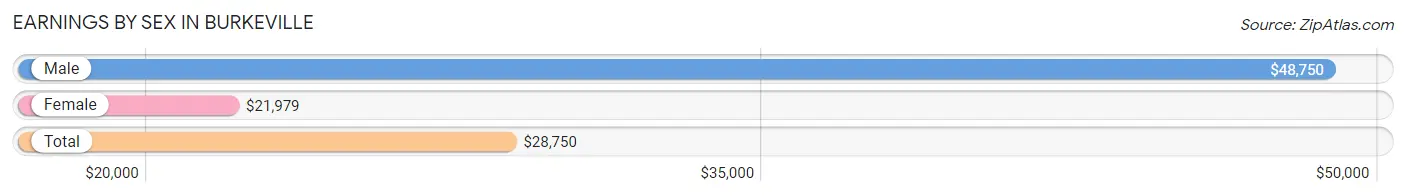
Earnings by Sex in Burkeville
Average Earnings in Burkeville are $28,750, $48,750 for men and $21,979 for women, a difference of 54.9%.
| Sex | Number | Average Earnings |
| Male | 126 (55.0%) | $48,750 |
| Female | 103 (45.0%) | $21,979 |
| Total | 229 (100.0%) | $28,750 |
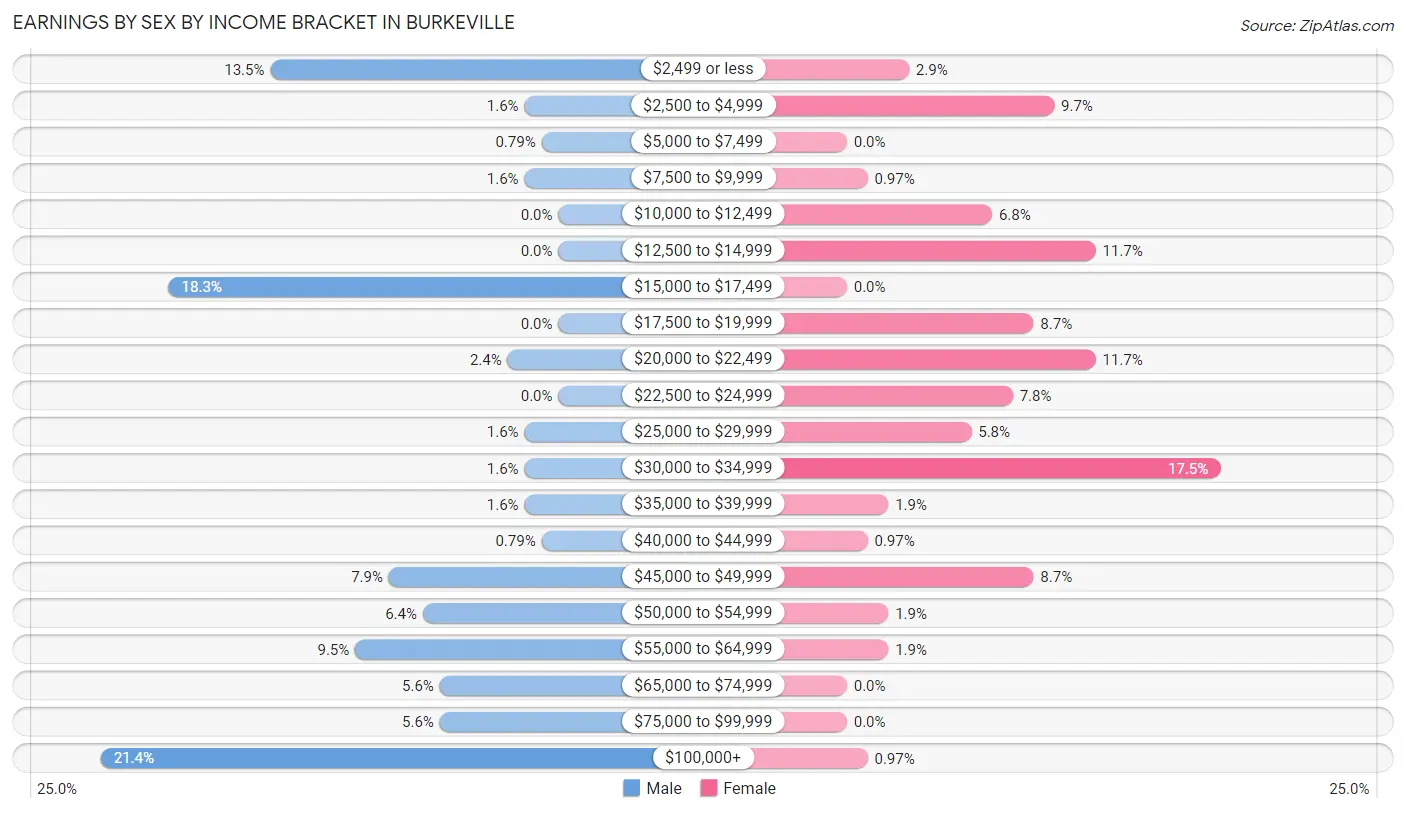
Earnings by Sex by Income Bracket in Burkeville
The most common earnings brackets in Burkeville are $100,000+ for men (27 | 21.4%) and $30,000 to $34,999 for women (18 | 17.5%).
| Income | Male | Female |
| $2,499 or less | 17 (13.5%) | 3 (2.9%) |
| $2,500 to $4,999 | 2 (1.6%) | 10 (9.7%) |
| $5,000 to $7,499 | 1 (0.8%) | 0 (0.0%) |
| $7,500 to $9,999 | 2 (1.6%) | 1 (1.0%) |
| $10,000 to $12,499 | 0 (0.0%) | 7 (6.8%) |
| $12,500 to $14,999 | 0 (0.0%) | 12 (11.7%) |
| $15,000 to $17,499 | 23 (18.2%) | 0 (0.0%) |
| $17,500 to $19,999 | 0 (0.0%) | 9 (8.7%) |
| $20,000 to $22,499 | 3 (2.4%) | 12 (11.7%) |
| $22,500 to $24,999 | 0 (0.0%) | 8 (7.8%) |
| $25,000 to $29,999 | 2 (1.6%) | 6 (5.8%) |
| $30,000 to $34,999 | 2 (1.6%) | 18 (17.5%) |
| $35,000 to $39,999 | 2 (1.6%) | 2 (1.9%) |
| $40,000 to $44,999 | 1 (0.8%) | 1 (1.0%) |
| $45,000 to $49,999 | 10 (7.9%) | 9 (8.7%) |
| $50,000 to $54,999 | 8 (6.4%) | 2 (1.9%) |
| $55,000 to $64,999 | 12 (9.5%) | 2 (1.9%) |
| $65,000 to $74,999 | 7 (5.6%) | 0 (0.0%) |
| $75,000 to $99,999 | 7 (5.6%) | 0 (0.0%) |
| $100,000+ | 27 (21.4%) | 1 (1.0%) |
| Total | 126 (100.0%) | 103 (100.0%) |
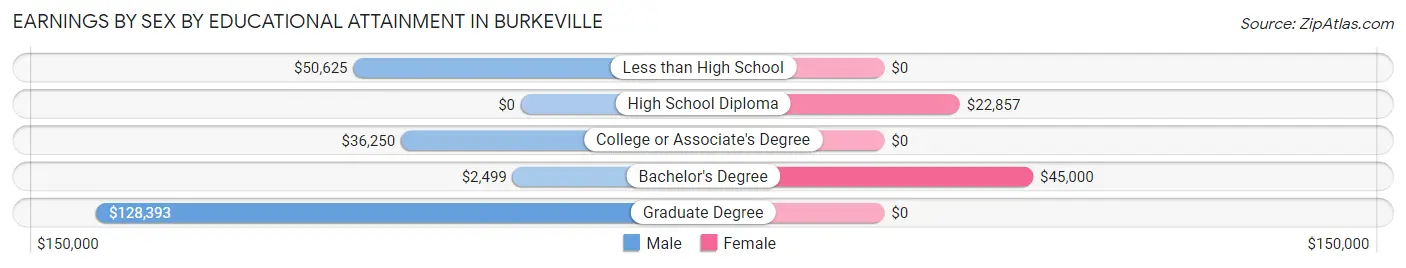
Earnings by Sex by Educational Attainment in Burkeville
Average earnings in Burkeville are $52,250 for men and $22,813 for women, a difference of 56.3%. Men with an educational attainment of graduate degree enjoy the highest average annual earnings of $128,393, while those with bachelor's degree education earn the least with $2,499. Women with an educational attainment of bachelor's degree earn the most with the average annual earnings of $45,000, while those with high school diploma education have the smallest earnings of $22,857.
| Educational Attainment | Male Income | Female Income |
| Less than High School | $50,625 | $0 |
| High School Diploma | - | - |
| College or Associate's Degree | $36,250 | $0 |
| Bachelor's Degree | $2,499 | $45,000 |
| Graduate Degree | $128,393 | $0 |
| Total | $52,250 | $22,813 |
Family Income in Burkeville
Family Income Brackets in Burkeville
According to the Burkeville family income data, there are 54 families falling into the $100,000 to $149,999 income range, which is the most common income bracket and makes up 36.7% of all families. Conversely, the less than $10,000 income bracket is the least frequent group with only 2 families (1.4%) belonging to this category.
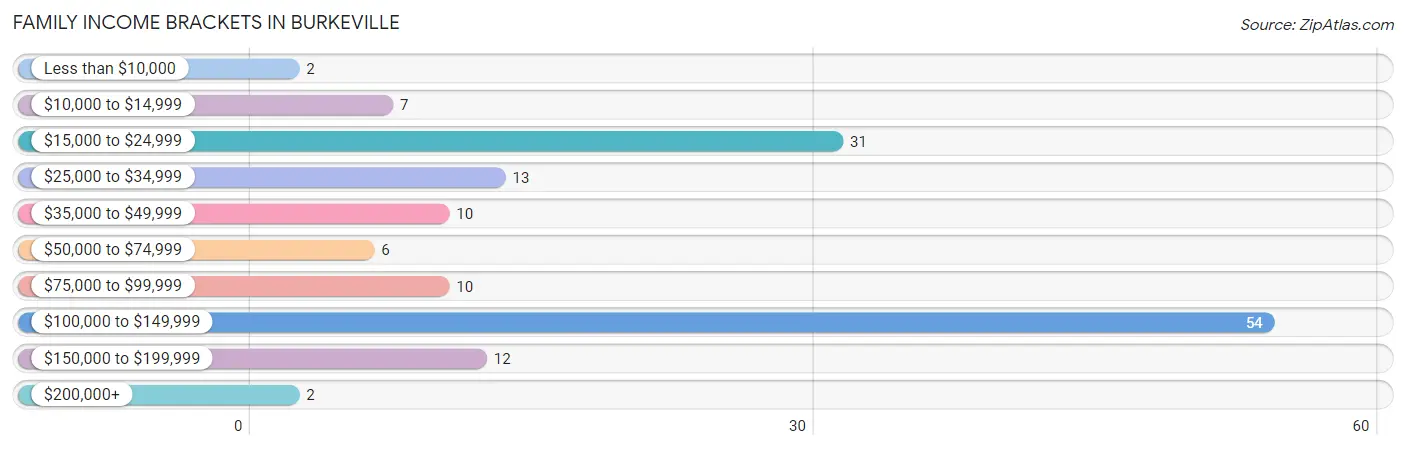
| Income Bracket | # Families | % Families |
| Less than $10,000 | 2 | 1.4% |
| $10,000 to $14,999 | 7 | 4.8% |
| $15,000 to $24,999 | 31 | 21.1% |
| $25,000 to $34,999 | 13 | 8.8% |
| $35,000 to $49,999 | 10 | 6.8% |
| $50,000 to $74,999 | 6 | 4.1% |
| $75,000 to $99,999 | 10 | 6.8% |
| $100,000 to $149,999 | 54 | 36.7% |
| $150,000 to $199,999 | 12 | 8.2% |
| $200,000+ | 2 | 1.4% |
Family Income by Famaliy Size in Burkeville
4-person families (30 | 20.4%) account for the highest median family income in Burkeville with $129,048 per family, while 4-person families (30 | 20.4%) have the highest median income of $32,262 per family member.
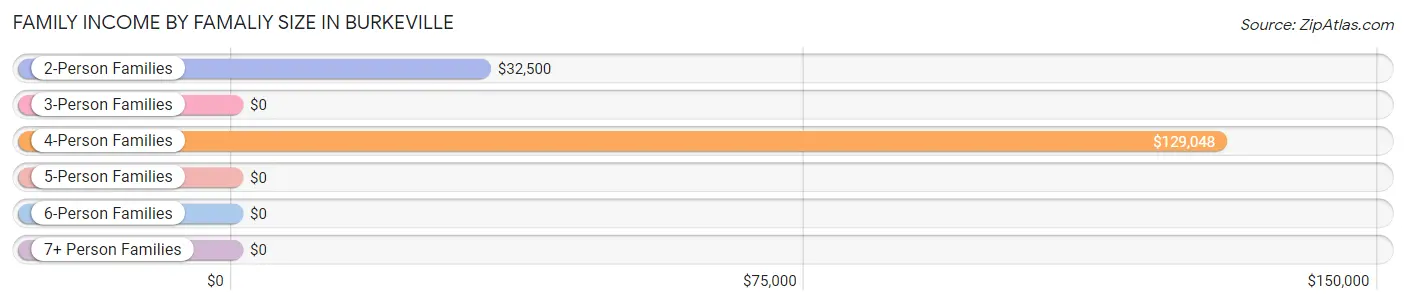
| Income Bracket | # Families | Median Income |
| 2-Person Families | 76 (51.7%) | $32,500 |
| 3-Person Families | 36 (24.5%) | $0 |
| 4-Person Families | 30 (20.4%) | $129,048 |
| 5-Person Families | 2 (1.4%) | $0 |
| 6-Person Families | 2 (1.4%) | $0 |
| 7+ Person Families | 1 (0.7%) | $0 |
| Total | 147 (100.0%) | $84,583 |
Family Income by Number of Earners in Burkeville
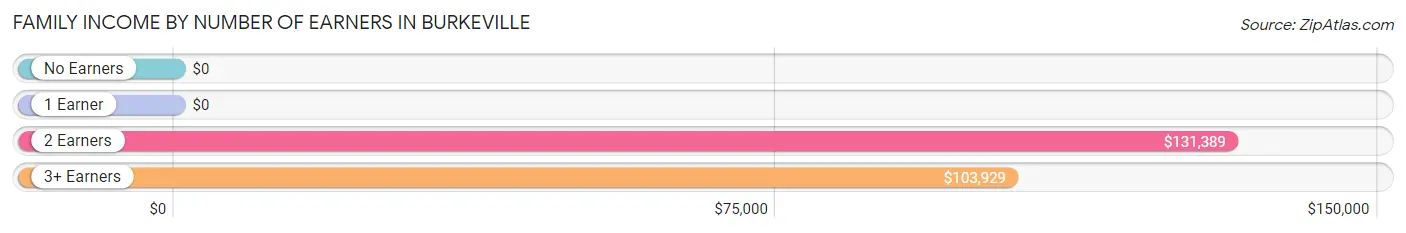
| Number of Earners | # Families | Median Income |
| No Earners | 15 (10.2%) | $0 |
| 1 Earner | 90 (61.2%) | $0 |
| 2 Earners | 28 (19.1%) | $131,389 |
| 3+ Earners | 14 (9.5%) | $103,929 |
| Total | 147 (100.0%) | $84,583 |
Household Income in Burkeville
Household Income Brackets in Burkeville
With 54 households falling in the category, the $100,000 to $149,999 income range is the most frequent in Burkeville, accounting for 28.3% of all households. In contrast, only 2 households (1.1%) fall into the less than $10,000 income bracket, making it the least populous group.
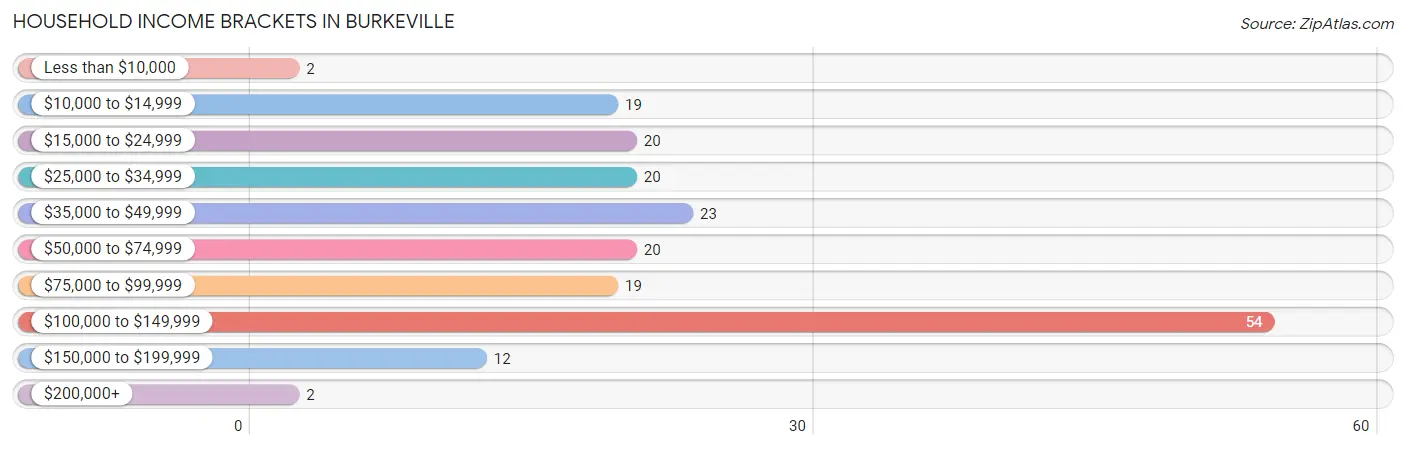
| Income Bracket | # Households | % Households |
| Less than $10,000 | 2 | 1.0% |
| $10,000 to $14,999 | 19 | 9.9% |
| $15,000 to $24,999 | 20 | 10.5% |
| $25,000 to $34,999 | 20 | 10.5% |
| $35,000 to $49,999 | 23 | 12.0% |
| $50,000 to $74,999 | 20 | 10.5% |
| $75,000 to $99,999 | 19 | 9.9% |
| $100,000 to $149,999 | 54 | 28.3% |
| $150,000 to $199,999 | 12 | 6.3% |
| $200,000+ | 2 | 1.0% |
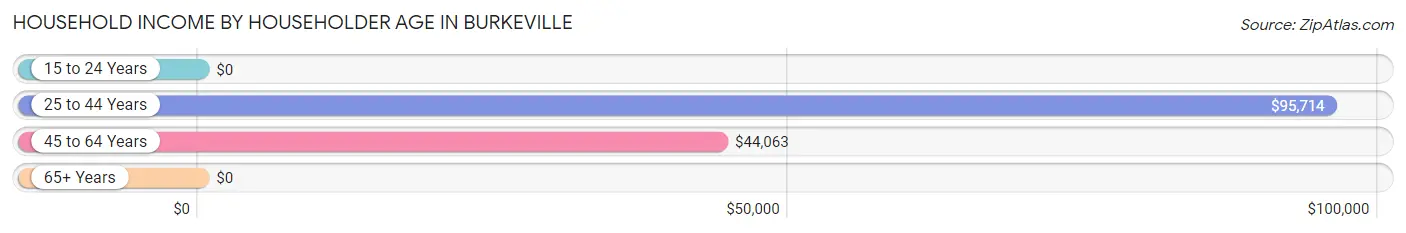
Household Income by Householder Age in Burkeville
The median household income in Burkeville is $68,036, with the highest median household income of $95,714 found in the 25 to 44 years age bracket for the primary householder. A total of 56 households (29.3%) fall into this category.
| Income Bracket | # Households | Median Income |
| 15 to 24 Years | 0 (0.0%) | $0 |
| 25 to 44 Years | 56 (29.3%) | $95,714 |
| 45 to 64 Years | 69 (36.1%) | $44,063 |
| 65+ Years | 66 (34.5%) | $0 |
| Total | 191 (100.0%) | $68,036 |
Poverty in Burkeville
Income Below Poverty by Sex and Age in Burkeville
With 7.7% poverty level for males and 29.4% for females among the residents of Burkeville, 15 year old males and 15 year old females are the most vulnerable to poverty, with 2 males (66.7%) and 1 females (100.0%) in their respective age groups living below the poverty level.
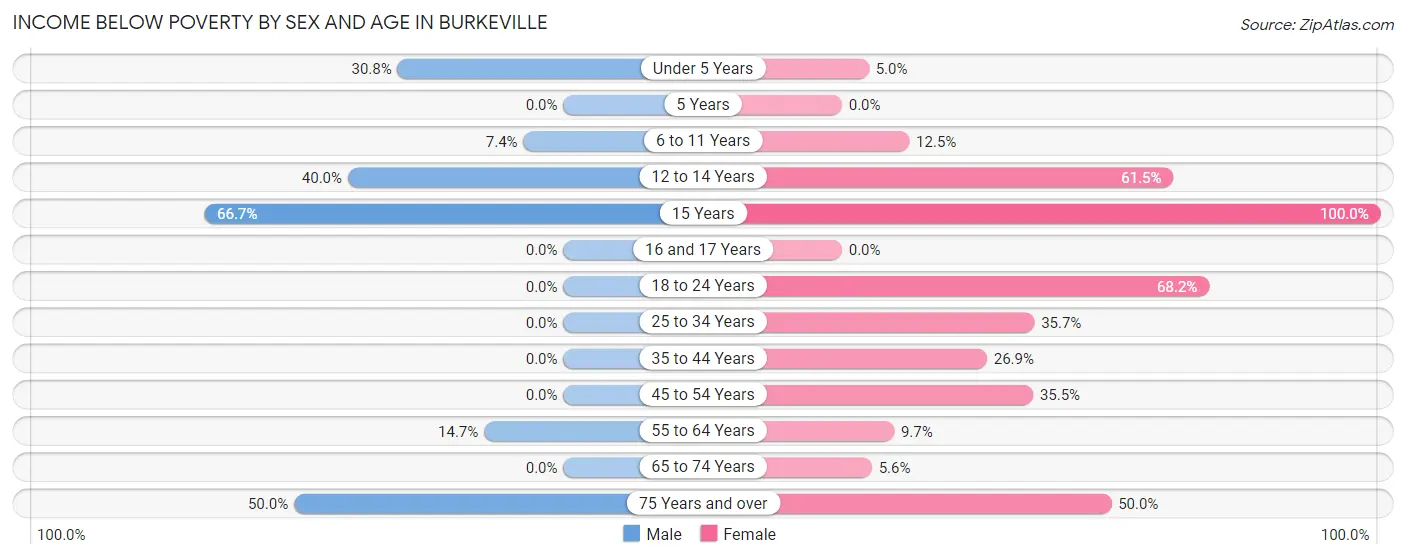
| Age Bracket | Male | Female |
| Under 5 Years | 4 (30.8%) | 1 (5.0%) |
| 5 Years | 0 (0.0%) | 0 (0.0%) |
| 6 to 11 Years | 2 (7.4%) | 3 (12.5%) |
| 12 to 14 Years | 2 (40.0%) | 8 (61.5%) |
| 15 Years | 2 (66.7%) | 1 (100.0%) |
| 16 and 17 Years | 0 (0.0%) | 0 (0.0%) |
| 18 to 24 Years | 0 (0.0%) | 15 (68.2%) |
| 25 to 34 Years | 0 (0.0%) | 15 (35.7%) |
| 35 to 44 Years | 0 (0.0%) | 7 (26.9%) |
| 45 to 54 Years | 0 (0.0%) | 11 (35.5%) |
| 55 to 64 Years | 5 (14.7%) | 3 (9.7%) |
| 65 to 74 Years | 0 (0.0%) | 1 (5.6%) |
| 75 Years and over | 2 (50.0%) | 13 (50.0%) |
| Total | 17 (7.7%) | 78 (29.4%) |
Income Above Poverty by Sex and Age in Burkeville
According to the poverty statistics in Burkeville, males aged 16 and 17 years and females aged 5 years are the age groups that are most secure financially, with 100.0% of males and 100.0% of females in these age groups living above the poverty line.
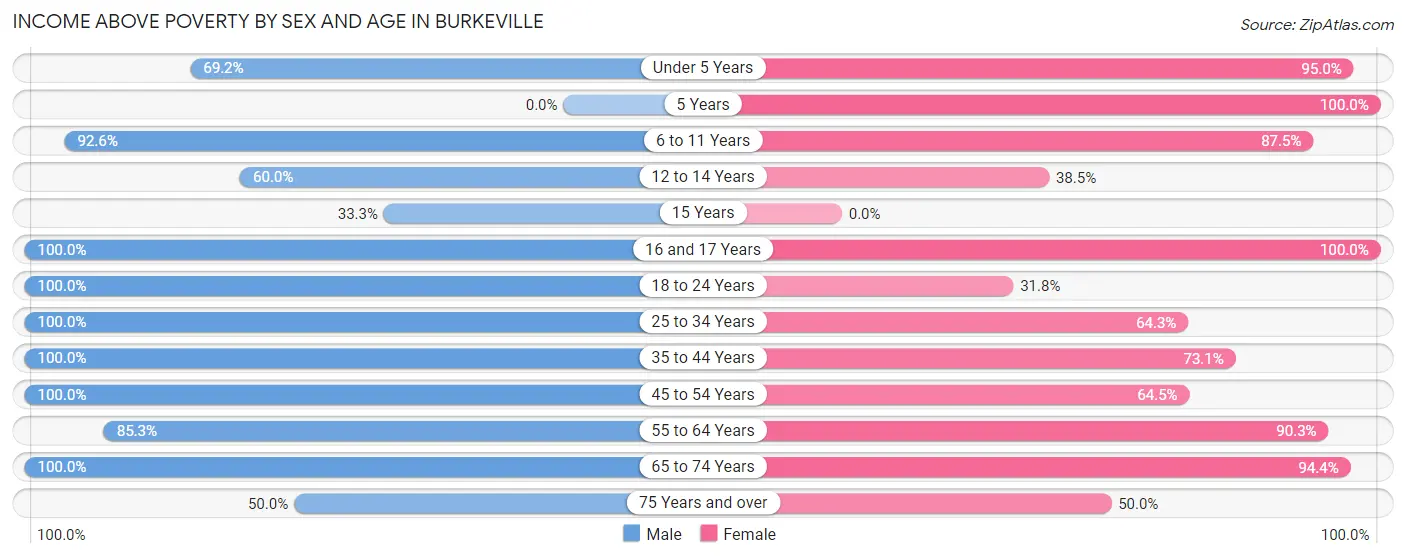
| Age Bracket | Male | Female |
| Under 5 Years | 9 (69.2%) | 19 (95.0%) |
| 5 Years | 0 (0.0%) | 9 (100.0%) |
| 6 to 11 Years | 25 (92.6%) | 21 (87.5%) |
| 12 to 14 Years | 3 (60.0%) | 5 (38.5%) |
| 15 Years | 1 (33.3%) | 0 (0.0%) |
| 16 and 17 Years | 5 (100.0%) | 2 (100.0%) |
| 18 to 24 Years | 20 (100.0%) | 7 (31.8%) |
| 25 to 34 Years | 28 (100.0%) | 27 (64.3%) |
| 35 to 44 Years | 17 (100.0%) | 19 (73.1%) |
| 45 to 54 Years | 15 (100.0%) | 20 (64.5%) |
| 55 to 64 Years | 29 (85.3%) | 28 (90.3%) |
| 65 to 74 Years | 49 (100.0%) | 17 (94.4%) |
| 75 Years and over | 2 (50.0%) | 13 (50.0%) |
| Total | 203 (92.3%) | 187 (70.6%) |
Income Below Poverty Among Married-Couple Families in Burkeville
The poverty statistics for married-couple families in Burkeville show that 4.1% or 3 of the total 74 families live below the poverty line. Families with no children have the highest poverty rate of 7.5%, comprising of 3 families. On the other hand, families with 1 or 2 children have the lowest poverty rate of 0.0%, which includes 0 families.
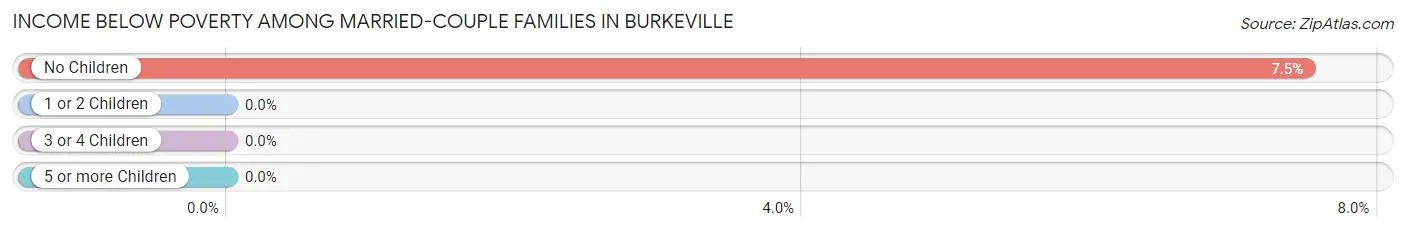
| Children | Above Poverty | Below Poverty |
| No Children | 37 (92.5%) | 3 (7.5%) |
| 1 or 2 Children | 31 (100.0%) | 0 (0.0%) |
| 3 or 4 Children | 3 (100.0%) | 0 (0.0%) |
| 5 or more Children | 0 (0.0%) | 0 (0.0%) |
| Total | 71 (96.0%) | 3 (4.1%) |
Income Below Poverty Among Single-Parent Households in Burkeville
According to the poverty data in Burkeville, 12.9% or 4 single-father households and 42.9% or 18 single-mother households are living below the poverty line. Among single-father households, those with 1 or 2 children have the highest poverty rate, with 4 households (57.1%) experiencing poverty. Likewise, among single-mother households, those with 1 or 2 children have the highest poverty rate, with 18 households (47.4%) falling below the poverty line.
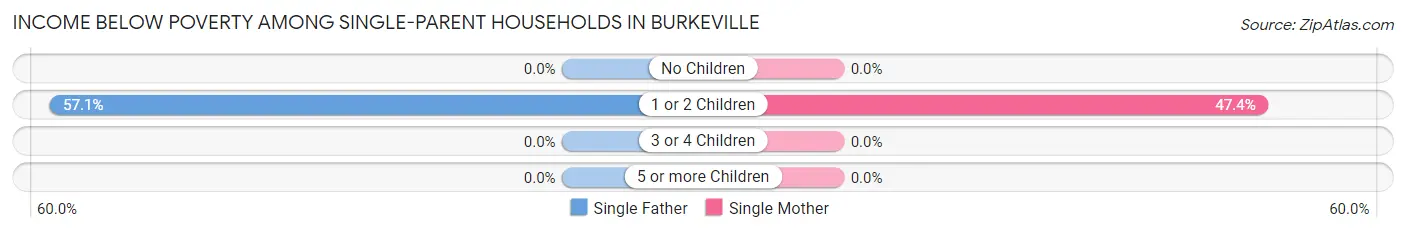
| Children | Single Father | Single Mother |
| No Children | 0 (0.0%) | 0 (0.0%) |
| 1 or 2 Children | 4 (57.1%) | 18 (47.4%) |
| 3 or 4 Children | 0 (0.0%) | 0 (0.0%) |
| 5 or more Children | 0 (0.0%) | 0 (0.0%) |
| Total | 4 (12.9%) | 18 (42.9%) |
Income Below Poverty Among Married-Couple vs Single-Parent Households in Burkeville
The poverty data for Burkeville shows that 3 of the married-couple family households (4.1%) and 22 of the single-parent households (30.1%) are living below the poverty level. Within the married-couple family households, those with no children have the highest poverty rate, with 3 households (7.5%) falling below the poverty line. Among the single-parent households, those with 1 or 2 children have the highest poverty rate, with 22 household (48.9%) living below poverty.
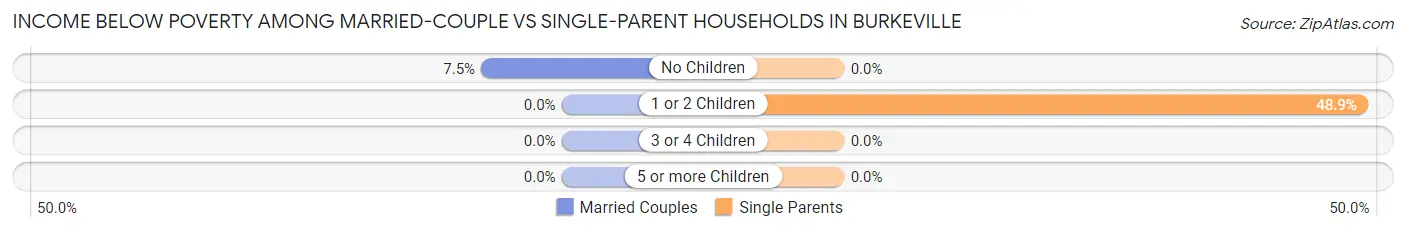
| Children | Married-Couple Families | Single-Parent Households |
| No Children | 3 (7.5%) | 0 (0.0%) |
| 1 or 2 Children | 0 (0.0%) | 22 (48.9%) |
| 3 or 4 Children | 0 (0.0%) | 0 (0.0%) |
| 5 or more Children | 0 (0.0%) | 0 (0.0%) |
| Total | 3 (4.1%) | 22 (30.1%) |
Race in Burkeville
The most populous races in Burkeville are White / Caucasian (323 | 66.6%), Two or more Races (84 | 17.3%), and Black / African American (71 | 14.6%).
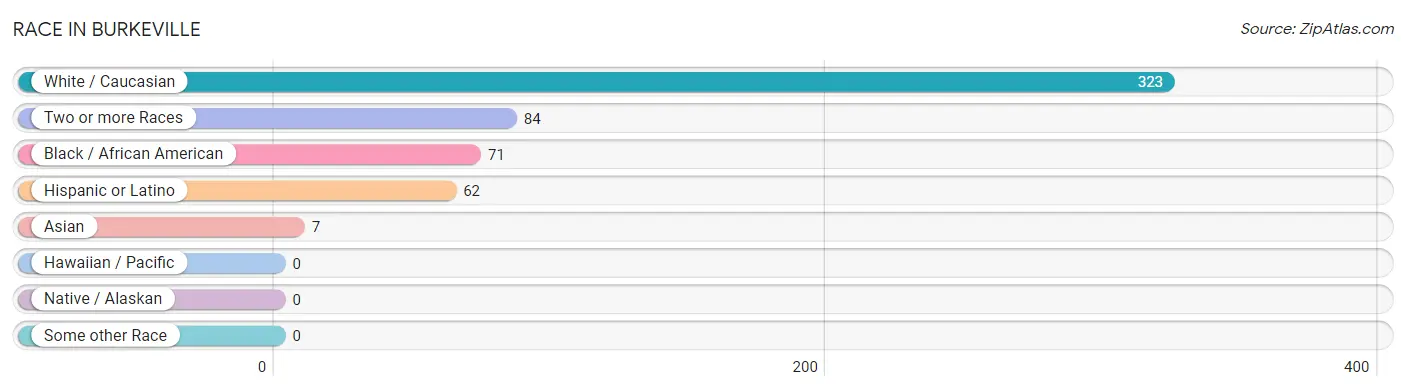
| Race | # Population | % Population |
| Asian | 7 | 1.4% |
| Black / African American | 71 | 14.6% |
| Hawaiian / Pacific | 0 | 0.0% |
| Hispanic or Latino | 62 | 12.8% |
| Native / Alaskan | 0 | 0.0% |
| White / Caucasian | 323 | 66.6% |
| Two or more Races | 84 | 17.3% |
| Some other Race | 0 | 0.0% |
| Total | 485 | 100.0% |
Ancestry in Burkeville
The most populous ancestries reported in Burkeville are American (165 | 34.0%), Mexican (62 | 12.8%), English (35 | 7.2%), Irish (29 | 6.0%), and German (23 | 4.7%), together accounting for 64.7% of all Burkeville residents.
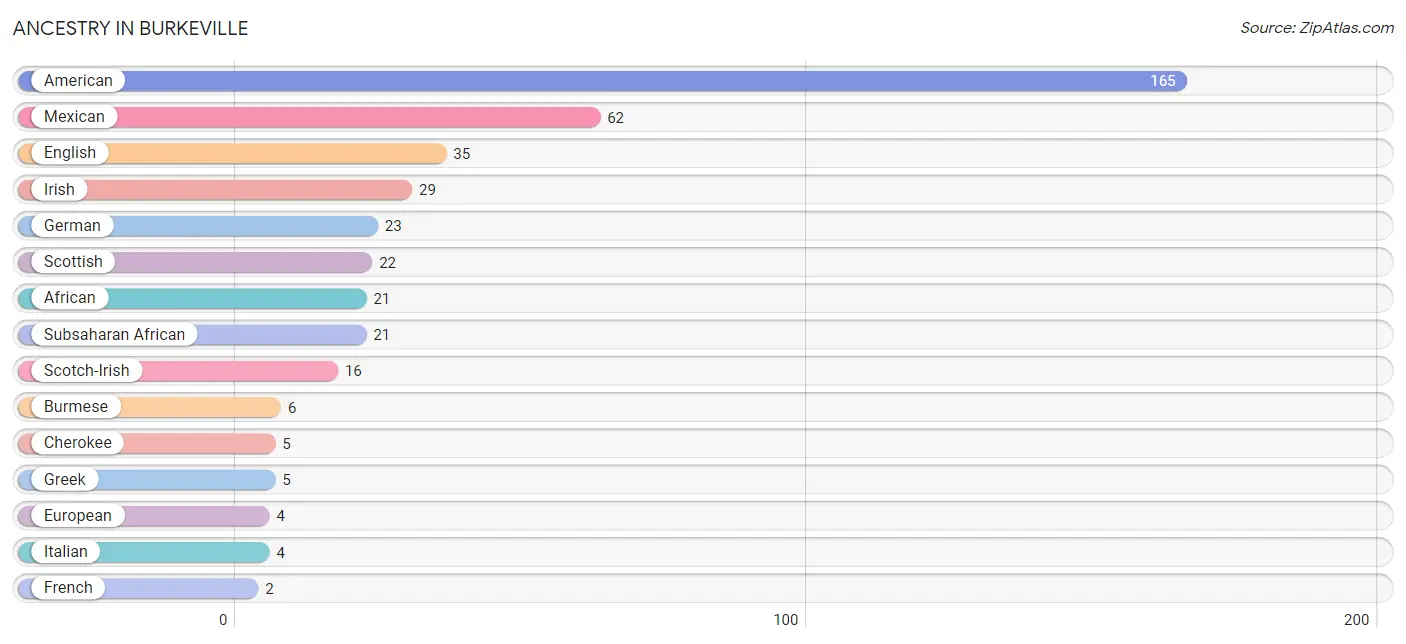
| Ancestry | # Population | % Population |
| African | 21 | 4.3% |
| American | 165 | 34.0% |
| Burmese | 6 | 1.2% |
| Cherokee | 5 | 1.0% |
| English | 35 | 7.2% |
| European | 4 | 0.8% |
| French | 2 | 0.4% |
| German | 23 | 4.7% |
| Greek | 5 | 1.0% |
| Hungarian | 2 | 0.4% |
| Irish | 29 | 6.0% |
| Italian | 4 | 0.8% |
| Korean | 1 | 0.2% |
| Mexican | 62 | 12.8% |
| Norwegian | 2 | 0.4% |
| Scotch-Irish | 16 | 3.3% |
| Scottish | 22 | 4.5% |
| Subsaharan African | 21 | 4.3% |
| Swiss | 1 | 0.2% |
| Thai | 1 | 0.2% |
| Welsh | 2 | 0.4% | View All 21 Rows |
Immigrants in Burkeville
The most numerous immigrant groups reported in Burkeville came from Central America (21 | 4.3%), Latin America (21 | 4.3%), Mexico (21 | 4.3%), Asia (6 | 1.2%), and Eastern Asia (6 | 1.2%), together accounting for 15.5% of all Burkeville residents.
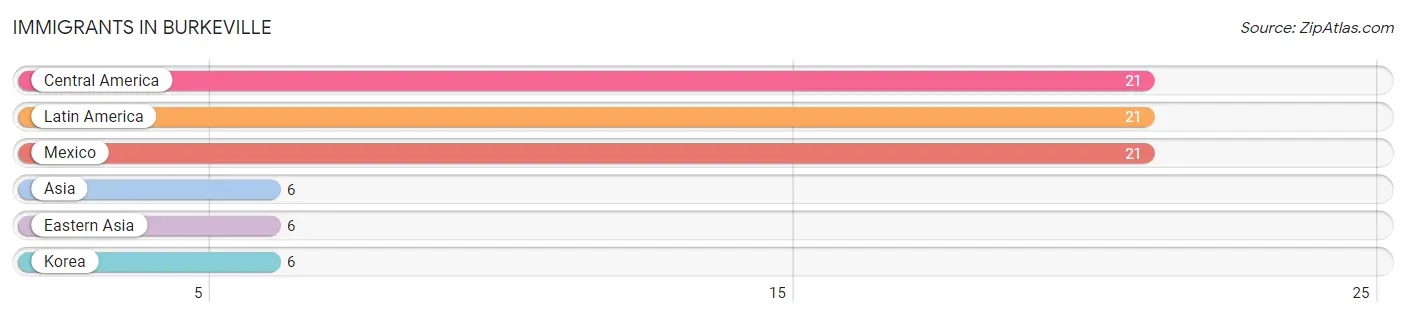
| Immigration Origin | # Population | % Population |
| Asia | 6 | 1.2% |
| Central America | 21 | 4.3% |
| Eastern Asia | 6 | 1.2% |
| Korea | 6 | 1.2% |
| Latin America | 21 | 4.3% |
| Mexico | 21 | 4.3% | View All 6 Rows |
Sex and Age in Burkeville
Sex and Age in Burkeville
The most populous age groups in Burkeville are 65 to 69 Years (34 | 15.4%) for men and 5 to 9 Years (33 | 12.4%) for women.
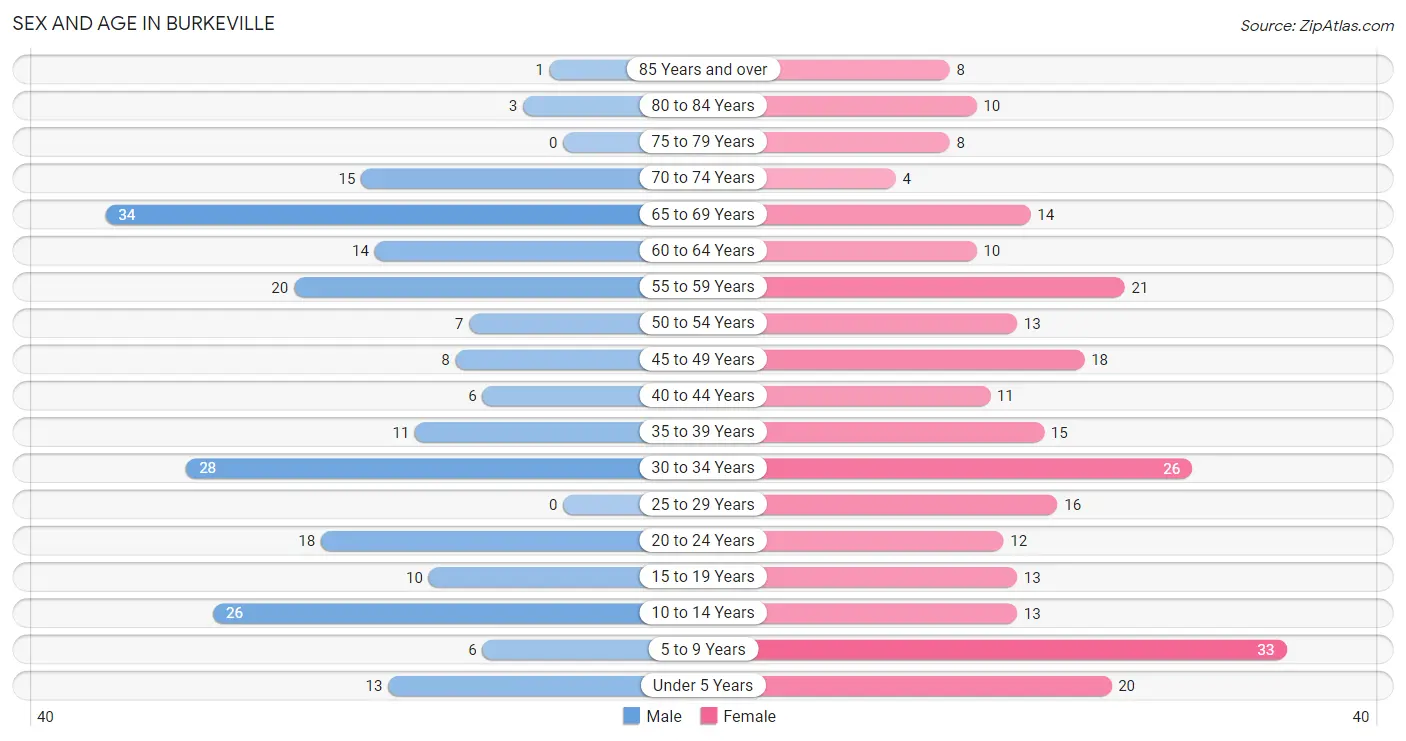
| Age Bracket | Male | Female |
| Under 5 Years | 13 (5.9%) | 20 (7.5%) |
| 5 to 9 Years | 6 (2.7%) | 33 (12.4%) |
| 10 to 14 Years | 26 (11.8%) | 13 (4.9%) |
| 15 to 19 Years | 10 (4.5%) | 13 (4.9%) |
| 20 to 24 Years | 18 (8.2%) | 12 (4.5%) |
| 25 to 29 Years | 0 (0.0%) | 16 (6.0%) |
| 30 to 34 Years | 28 (12.7%) | 26 (9.8%) |
| 35 to 39 Years | 11 (5.0%) | 15 (5.7%) |
| 40 to 44 Years | 6 (2.7%) | 11 (4.2%) |
| 45 to 49 Years | 8 (3.6%) | 18 (6.8%) |
| 50 to 54 Years | 7 (3.2%) | 13 (4.9%) |
| 55 to 59 Years | 20 (9.1%) | 21 (7.9%) |
| 60 to 64 Years | 14 (6.4%) | 10 (3.8%) |
| 65 to 69 Years | 34 (15.4%) | 14 (5.3%) |
| 70 to 74 Years | 15 (6.8%) | 4 (1.5%) |
| 75 to 79 Years | 0 (0.0%) | 8 (3.0%) |
| 80 to 84 Years | 3 (1.4%) | 10 (3.8%) |
| 85 Years and over | 1 (0.4%) | 8 (3.0%) |
| Total | 220 (100.0%) | 265 (100.0%) |
Families and Households in Burkeville
Median Family Size in Burkeville
The median family size in Burkeville is 2.81 persons per family, with married-couple families (74 | 50.3%) accounting for the largest median family size of 3.11 persons per family. On the other hand, single female/mother families (42 | 28.6%) represent the smallest median family size with 2.40 persons per family.
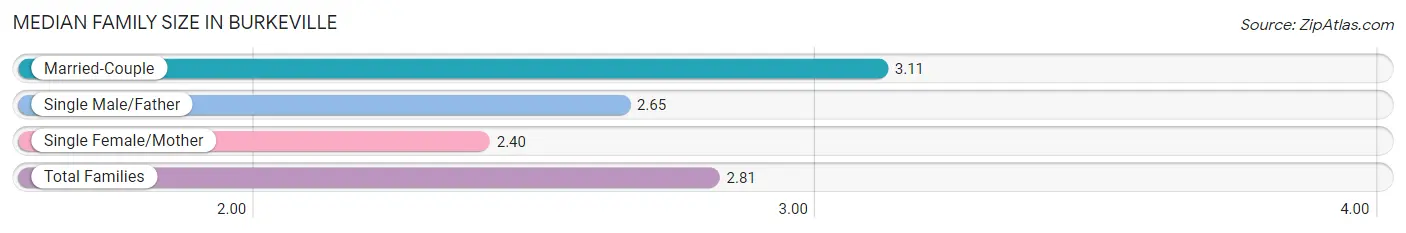
| Family Type | # Families | Family Size |
| Married-Couple | 74 (50.3%) | 3.11 |
| Single Male/Father | 31 (21.1%) | 2.65 |
| Single Female/Mother | 42 (28.6%) | 2.40 |
| Total Families | 147 (100.0%) | 2.81 |
Median Household Size in Burkeville
The median household size in Burkeville is 2.54 persons per household, with married-couple households (74 | 38.7%) accounting for the largest median household size of 3.2 persons per household. non-family households (44 | 23.0%) represent the smallest median household size with 1.23 persons per household.
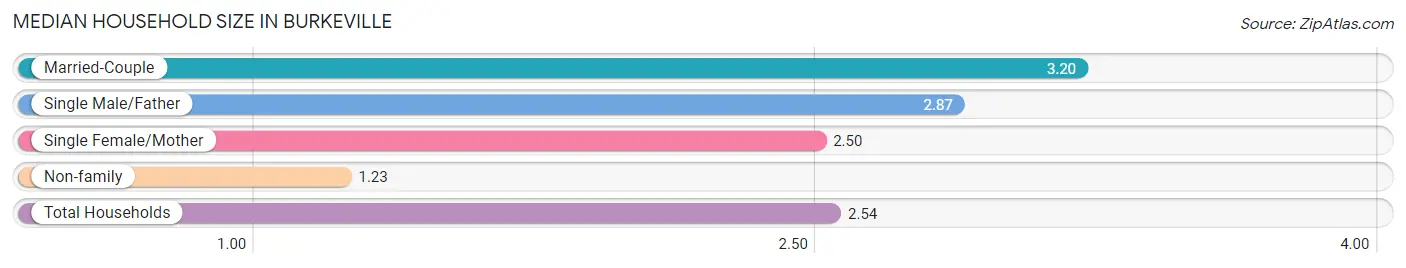
| Household Type | # Households | Household Size |
| Married-Couple | 74 (38.7%) | 3.20 |
| Single Male/Father | 31 (16.2%) | 2.87 |
| Single Female/Mother | 42 (22.0%) | 2.50 |
| Non-family | 44 (23.0%) | 1.23 |
| Total Households | 191 (100.0%) | 2.54 |
Household Size by Marriage Status in Burkeville
Out of a total of 191 households in Burkeville, 147 (77.0%) are family households, while 44 (23.0%) are nonfamily households. The most numerous type of family households are 2-person households, comprising 60, and the most common type of nonfamily households are 1-person households, comprising 40.
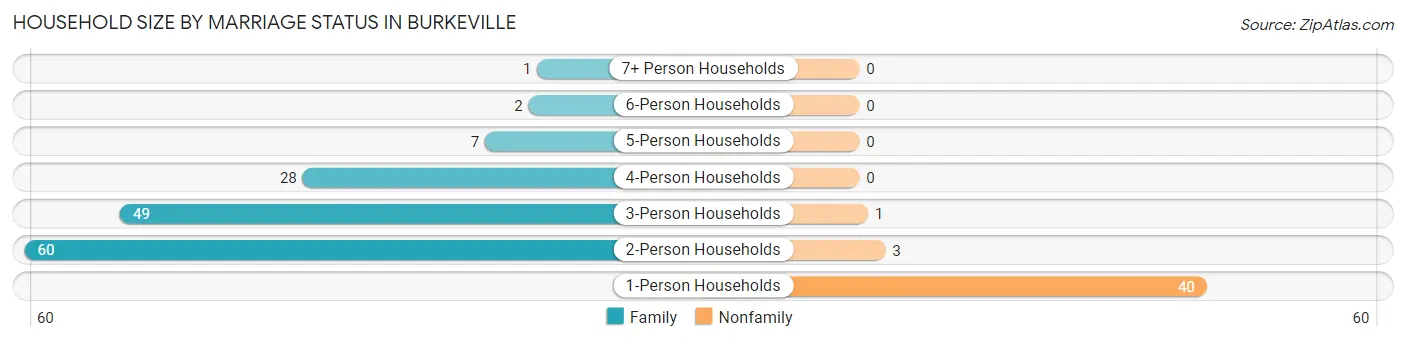
| Household Size | Family Households | Nonfamily Households |
| 1-Person Households | - | 40 (20.9%) |
| 2-Person Households | 60 (31.4%) | 3 (1.6%) |
| 3-Person Households | 49 (25.7%) | 1 (0.5%) |
| 4-Person Households | 28 (14.7%) | 0 (0.0%) |
| 5-Person Households | 7 (3.7%) | 0 (0.0%) |
| 6-Person Households | 2 (1.1%) | 0 (0.0%) |
| 7+ Person Households | 1 (0.5%) | 0 (0.0%) |
| Total | 147 (77.0%) | 44 (23.0%) |
Female Fertility in Burkeville
Fertility by Age in Burkeville
| Age Bracket | Women with Births | Births / 1,000 Women |
| 15 to 19 years | 0 (0.0%) | 0.0 |
| 20 to 34 years | 0 (0.0%) | 0.0 |
| 35 to 50 years | 0 (0.0%) | 0.0 |
| Total | 0 (0.0%) | 0.0 |
Fertility by Age by Marriage Status in Burkeville
| Age Bracket | Married | Unmarried |
| 15 to 19 years | 0 (0.0%) | 0 (0.0%) |
| 20 to 34 years | 0 (0.0%) | 0 (0.0%) |
| 35 to 50 years | 0 (0.0%) | 0 (0.0%) |
| Total | 0 (0.0%) | 0 (0.0%) |
Fertility by Education in Burkeville
| Educational Attainment | Women with Births | Births / 1,000 Women |
| Less than High School | 0 (0.0%) | 0.0 |
| High School Diploma | 0 (0.0%) | 0.0 |
| College or Associate's Degree | 0 (0.0%) | 0.0 |
| Bachelor's Degree | 0 (0.0%) | 0.0 |
| Graduate Degree | 0 (0.0%) | 0.0 |
| Total | 0 (0.0%) | 0.0 |
Fertility by Education by Marriage Status in Burkeville
| Educational Attainment | Married | Unmarried |
| Less than High School | 0 (0.0%) | 0 (0.0%) |
| High School Diploma | 0 (0.0%) | 0 (0.0%) |
| College or Associate's Degree | 0 (0.0%) | 0 (0.0%) |
| Bachelor's Degree | 0 (0.0%) | 0 (0.0%) |
| Graduate Degree | 0 (0.0%) | 0 (0.0%) |
| Total | 0 (0.0%) | 0 (0.0%) |
Employment Characteristics in Burkeville
Employment by Class of Employer in Burkeville
Among the 225 employed individuals in Burkeville, private company employees (136 | 60.4%), self-employed (not incorporated) (41 | 18.2%), and local government employees (24 | 10.7%) make up the most common classes of employment.
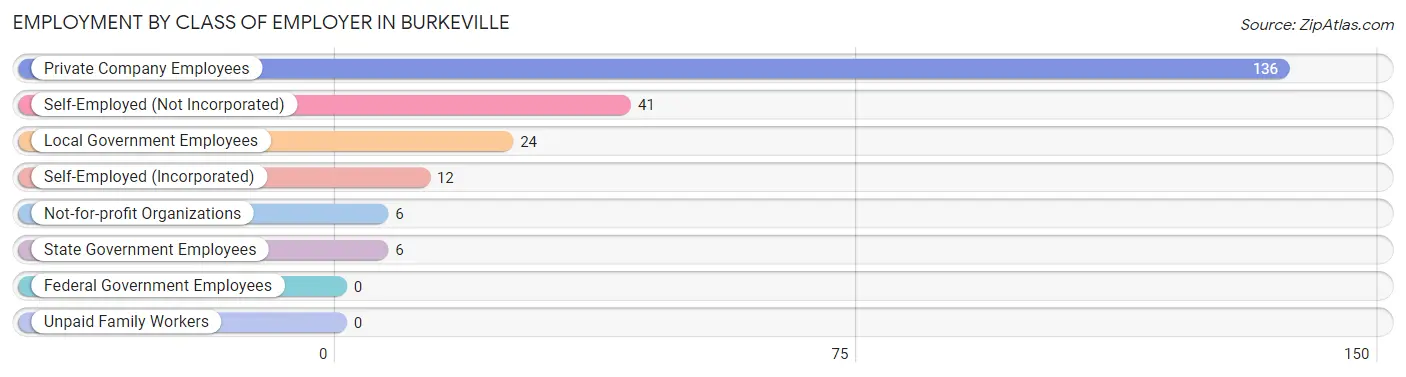
| Employer Class | # Employees | % Employees |
| Private Company Employees | 136 | 60.4% |
| Self-Employed (Incorporated) | 12 | 5.3% |
| Self-Employed (Not Incorporated) | 41 | 18.2% |
| Not-for-profit Organizations | 6 | 2.7% |
| Local Government Employees | 24 | 10.7% |
| State Government Employees | 6 | 2.7% |
| Federal Government Employees | 0 | 0.0% |
| Unpaid Family Workers | 0 | 0.0% |
| Total | 225 | 100.0% |
Employment Status by Age in Burkeville
According to the labor force statistics for Burkeville, out of the total population over 16 years of age (370), 61.1% or 226 individuals are in the labor force, with 0.4% or 1 of them unemployed. The age group with the highest labor force participation rate is 25 to 29 years, with 100.0% or 16 individuals in the labor force. Within the labor force, the 30 to 34 years age range has the highest percentage of unemployed individuals, with 2.3% or 1 of them being unemployed.
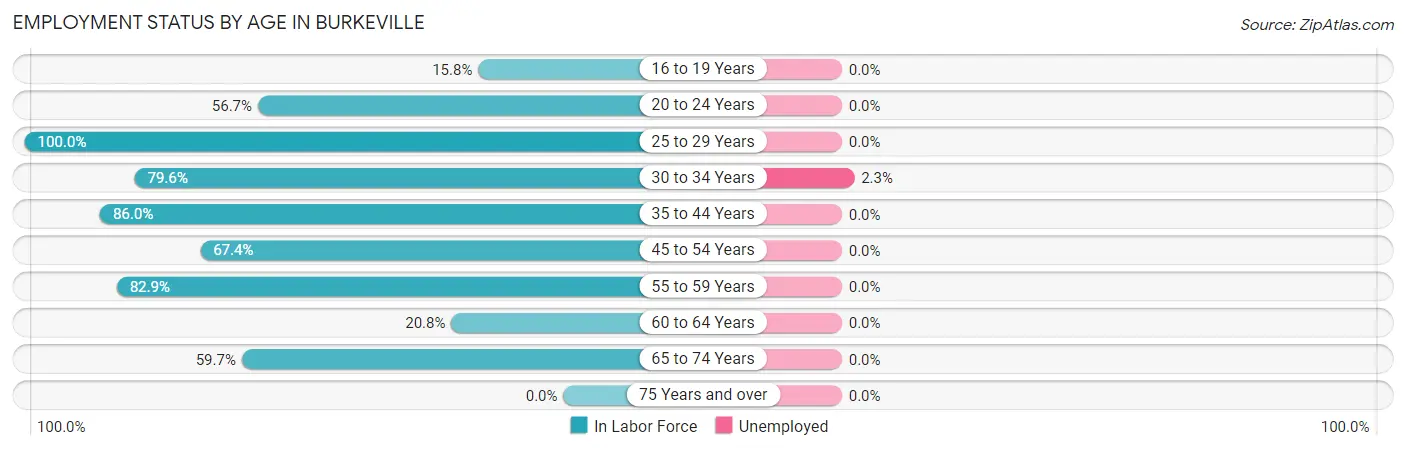
| Age Bracket | In Labor Force | Unemployed |
| 16 to 19 Years | 3 (15.8%) | 0 (0.0%) |
| 20 to 24 Years | 17 (56.7%) | 0 (0.0%) |
| 25 to 29 Years | 16 (100.0%) | 0 (0.0%) |
| 30 to 34 Years | 43 (79.6%) | 1 (2.3%) |
| 35 to 44 Years | 37 (86.0%) | 0 (0.0%) |
| 45 to 54 Years | 31 (67.4%) | 0 (0.0%) |
| 55 to 59 Years | 34 (82.9%) | 0 (0.0%) |
| 60 to 64 Years | 5 (20.8%) | 0 (0.0%) |
| 65 to 74 Years | 40 (59.7%) | 0 (0.0%) |
| 75 Years and over | 0 (0.0%) | 0 (0.0%) |
| Total | 226 (61.1%) | 1 (0.4%) |
Employment Status by Educational Attainment in Burkeville
According to labor force statistics for Burkeville, 74.1% of individuals (166) out of the total population between 25 and 64 years of age (224) are in the labor force, with 0.6% or 1 of them being unemployed. The group with the highest labor force participation rate are those with the educational attainment of less than high school, with 89.5% or 17 individuals in the labor force. Within the labor force, individuals with high school diploma education have the highest percentage of unemployment, with 2.1% or 1 of them being unemployed.
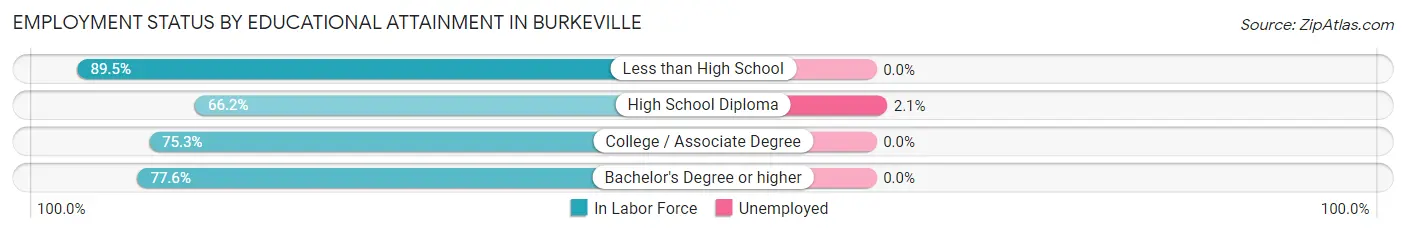
| Educational Attainment | In Labor Force | Unemployed |
| Less than High School | 17 (89.5%) | 0 (0.0%) |
| High School Diploma | 47 (66.2%) | 1 (2.1%) |
| College / Associate Degree | 64 (75.3%) | 0 (0.0%) |
| Bachelor's Degree or higher | 38 (77.6%) | 0 (0.0%) |
| Total | 166 (74.1%) | 1 (0.6%) |
Employment Occupations by Sex in Burkeville
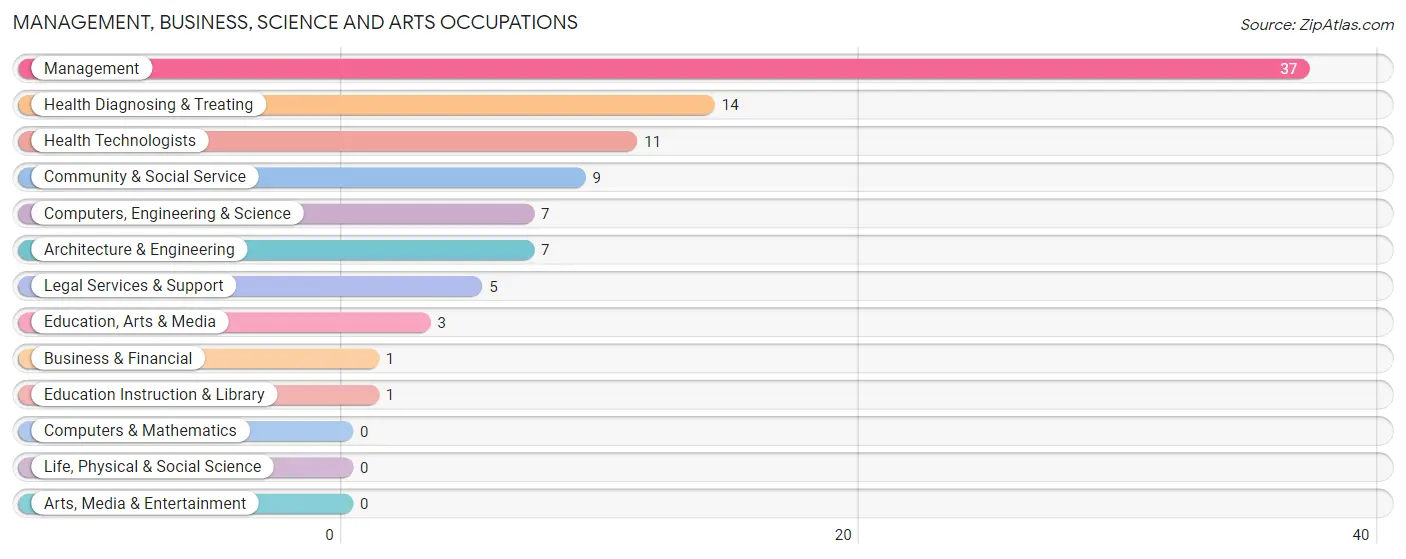
Management, Business, Science and Arts Occupations
The most common Management, Business, Science and Arts occupations in Burkeville are Management (37 | 16.4%), Health Diagnosing & Treating (14 | 6.2%), Health Technologists (11 | 4.9%), Community & Social Service (9 | 4.0%), and Computers, Engineering & Science (7 | 3.1%).
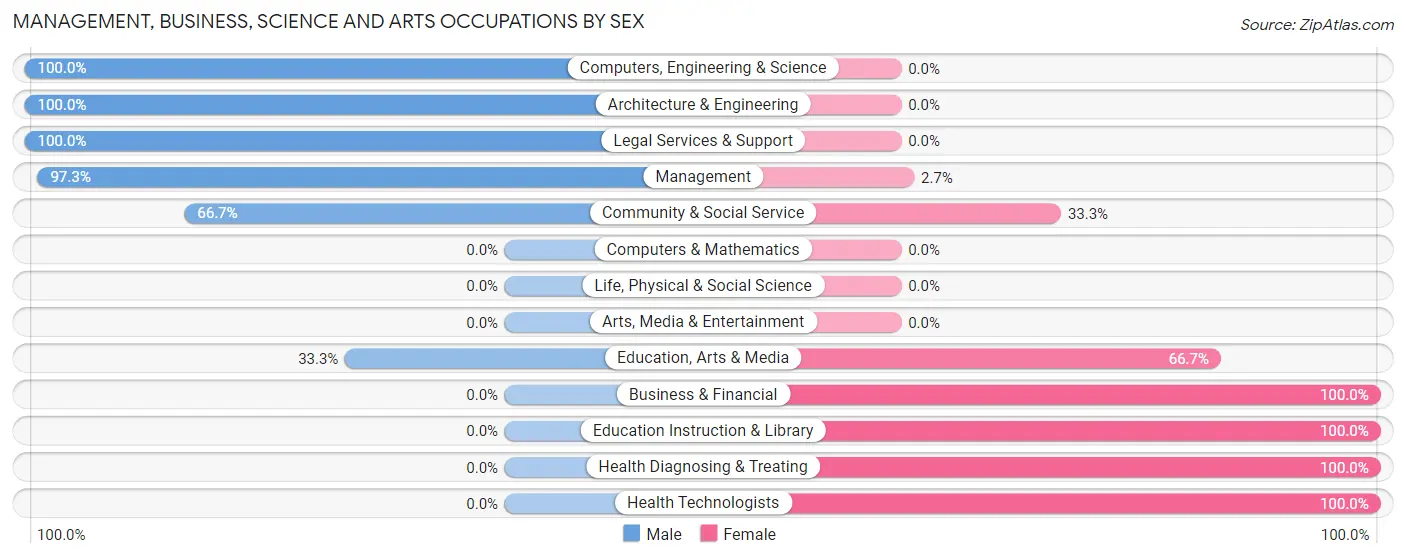
Management, Business, Science and Arts Occupations by Sex
Within the Management, Business, Science and Arts occupations in Burkeville, the most male-oriented occupations are Computers, Engineering & Science (100.0%), Architecture & Engineering (100.0%), and Legal Services & Support (100.0%), while the most female-oriented occupations are Business & Financial (100.0%), Education Instruction & Library (100.0%), and Health Diagnosing & Treating (100.0%).
| Occupation | Male | Female |
| Management | 36 (97.3%) | 1 (2.7%) |
| Business & Financial | 0 (0.0%) | 1 (100.0%) |
| Computers, Engineering & Science | 7 (100.0%) | 0 (0.0%) |
| Computers & Mathematics | 0 (0.0%) | 0 (0.0%) |
| Architecture & Engineering | 7 (100.0%) | 0 (0.0%) |
| Life, Physical & Social Science | 0 (0.0%) | 0 (0.0%) |
| Community & Social Service | 6 (66.7%) | 3 (33.3%) |
| Education, Arts & Media | 1 (33.3%) | 2 (66.7%) |
| Legal Services & Support | 5 (100.0%) | 0 (0.0%) |
| Education Instruction & Library | 0 (0.0%) | 1 (100.0%) |
| Arts, Media & Entertainment | 0 (0.0%) | 0 (0.0%) |
| Health Diagnosing & Treating | 0 (0.0%) | 14 (100.0%) |
| Health Technologists | 0 (0.0%) | 11 (100.0%) |
| Total (Category) | 49 (72.1%) | 19 (27.9%) |
| Total (Overall) | 123 (54.7%) | 102 (45.3%) |
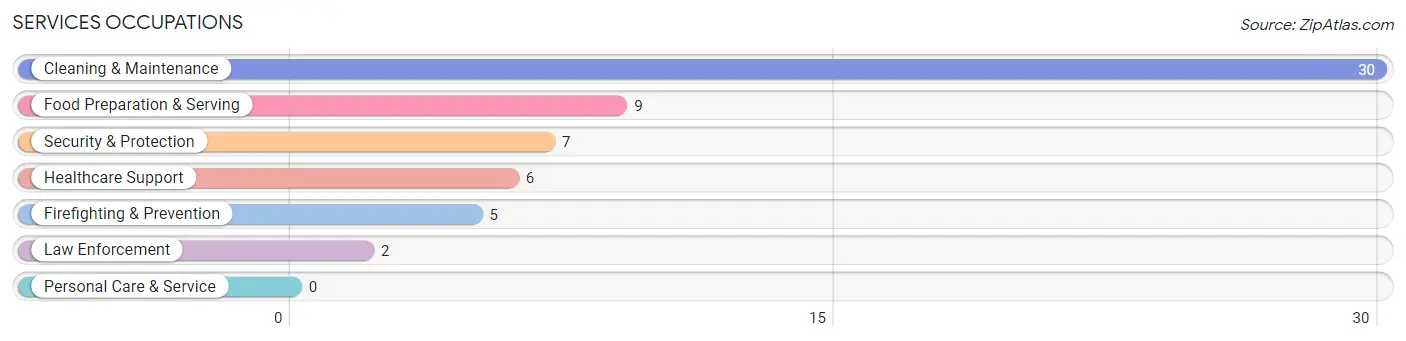
Services Occupations
The most common Services occupations in Burkeville are Cleaning & Maintenance (30 | 13.3%), Food Preparation & Serving (9 | 4.0%), Security & Protection (7 | 3.1%), Healthcare Support (6 | 2.7%), and Firefighting & Prevention (5 | 2.2%).
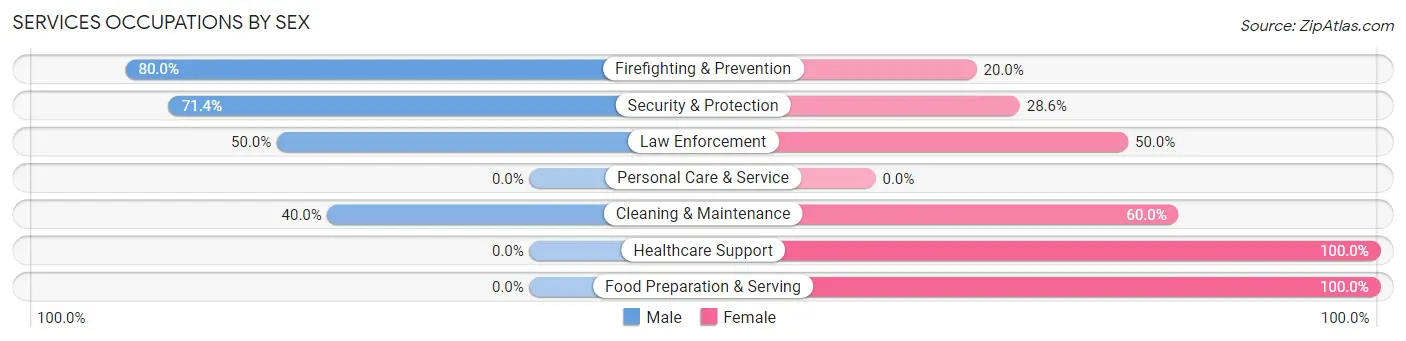
Services Occupations by Sex
Within the Services occupations in Burkeville, the most male-oriented occupations are Firefighting & Prevention (80.0%), Security & Protection (71.4%), and Law Enforcement (50.0%), while the most female-oriented occupations are Healthcare Support (100.0%), Food Preparation & Serving (100.0%), and Cleaning & Maintenance (60.0%).
| Occupation | Male | Female |
| Healthcare Support | 0 (0.0%) | 6 (100.0%) |
| Security & Protection | 5 (71.4%) | 2 (28.6%) |
| Firefighting & Prevention | 4 (80.0%) | 1 (20.0%) |
| Law Enforcement | 1 (50.0%) | 1 (50.0%) |
| Food Preparation & Serving | 0 (0.0%) | 9 (100.0%) |
| Cleaning & Maintenance | 12 (40.0%) | 18 (60.0%) |
| Personal Care & Service | 0 (0.0%) | 0 (0.0%) |
| Total (Category) | 17 (32.7%) | 35 (67.3%) |
| Total (Overall) | 123 (54.7%) | 102 (45.3%) |
Sales and Office Occupations
The most common Sales and Office occupations in Burkeville are Office & Administration (61 | 27.1%), and Sales & Related (10 | 4.4%).

Sales and Office Occupations by Sex
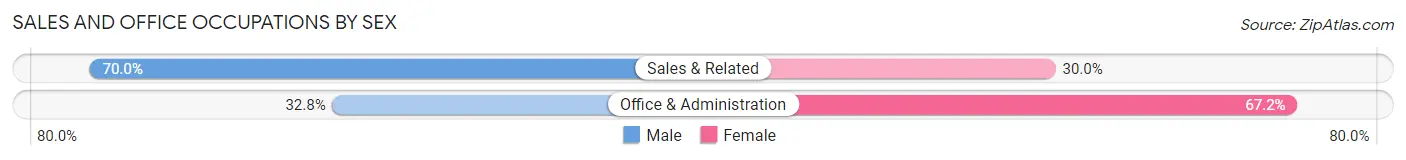
| Occupation | Male | Female |
| Sales & Related | 7 (70.0%) | 3 (30.0%) |
| Office & Administration | 20 (32.8%) | 41 (67.2%) |
| Total (Category) | 27 (38.0%) | 44 (62.0%) |
| Total (Overall) | 123 (54.7%) | 102 (45.3%) |
Natural Resources, Construction and Maintenance Occupations
The most common Natural Resources, Construction and Maintenance occupations in Burkeville are Construction & Extraction (13 | 5.8%), and Installation, Maintenance & Repair (4 | 1.8%).

Natural Resources, Construction and Maintenance Occupations by Sex
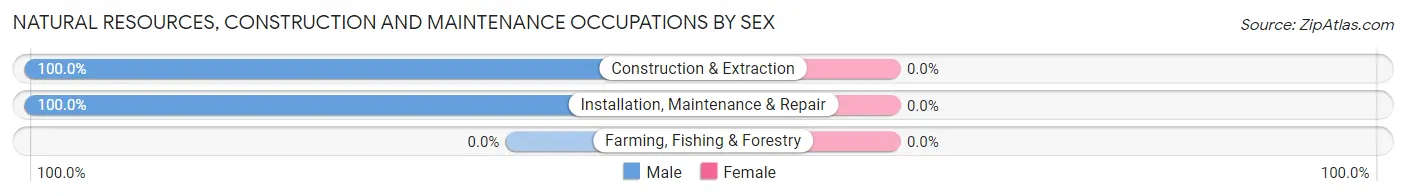
| Occupation | Male | Female |
| Farming, Fishing & Forestry | 0 (0.0%) | 0 (0.0%) |
| Construction & Extraction | 13 (100.0%) | 0 (0.0%) |
| Installation, Maintenance & Repair | 4 (100.0%) | 0 (0.0%) |
| Total (Category) | 17 (100.0%) | 0 (0.0%) |
| Total (Overall) | 123 (54.7%) | 102 (45.3%) |
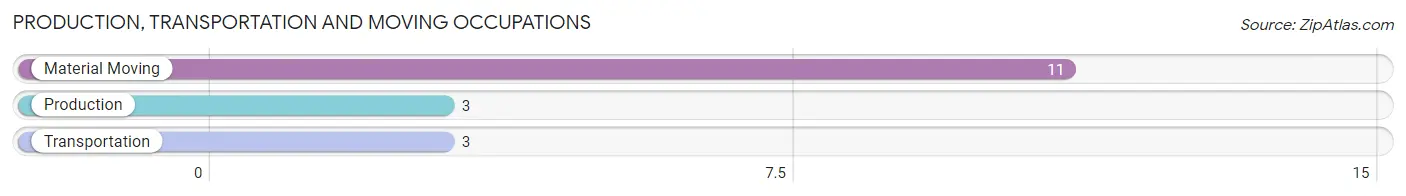
Production, Transportation and Moving Occupations
The most common Production, Transportation and Moving occupations in Burkeville are Material Moving (11 | 4.9%), Production (3 | 1.3%), and Transportation (3 | 1.3%).
Production, Transportation and Moving Occupations by Sex
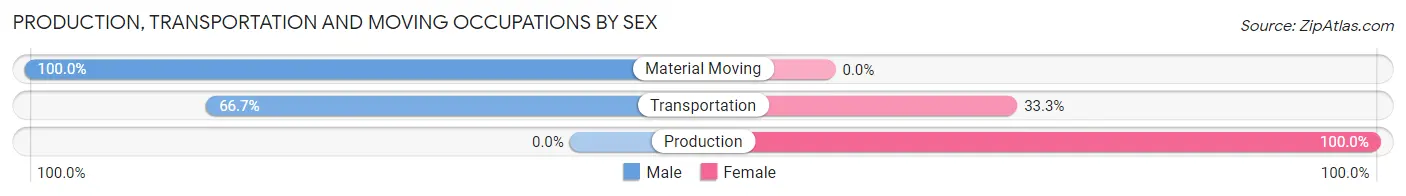
| Occupation | Male | Female |
| Production | 0 (0.0%) | 3 (100.0%) |
| Transportation | 2 (66.7%) | 1 (33.3%) |
| Material Moving | 11 (100.0%) | 0 (0.0%) |
| Total (Category) | 13 (76.5%) | 4 (23.5%) |
| Total (Overall) | 123 (54.7%) | 102 (45.3%) |
Employment Industries by Sex in Burkeville
Employment Industries in Burkeville
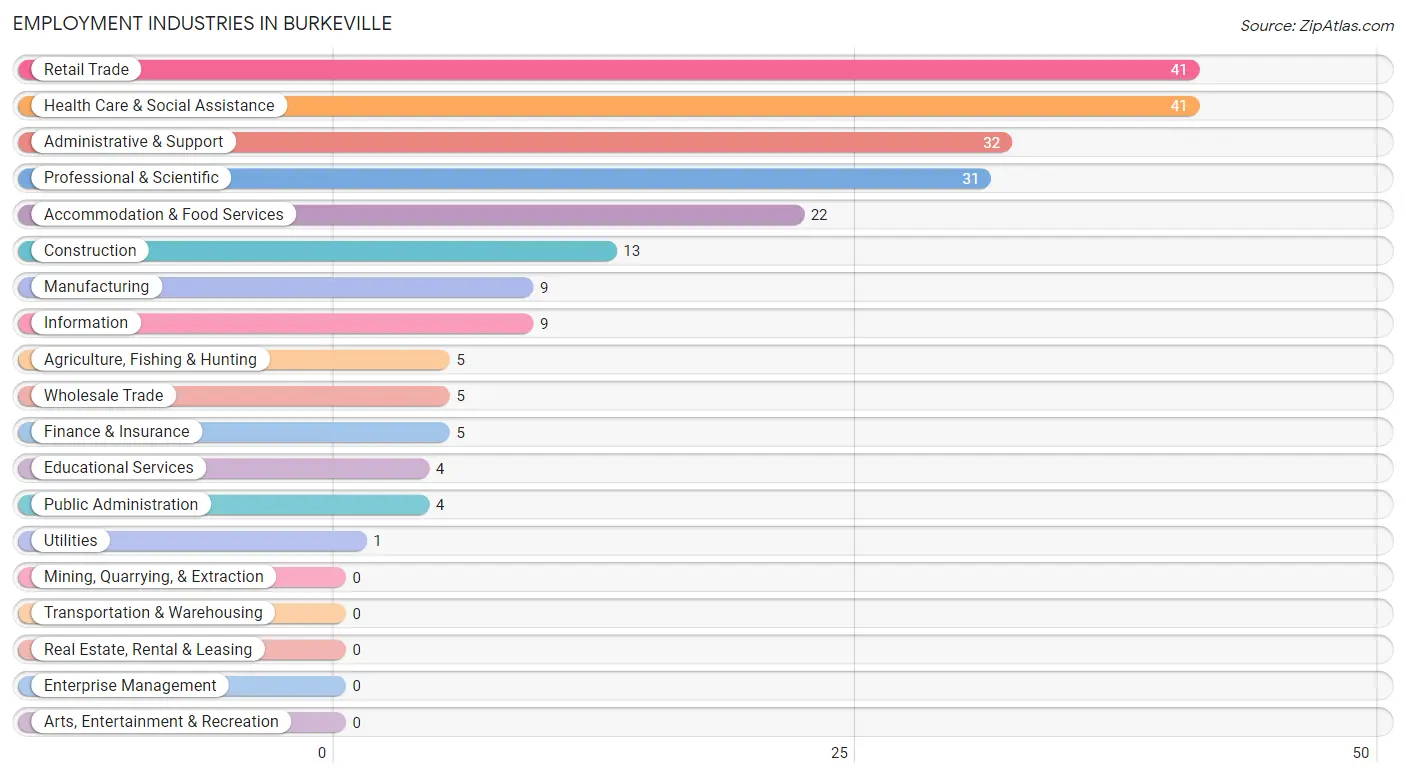
The major employment industries in Burkeville include Retail Trade (41 | 18.2%), Health Care & Social Assistance (41 | 18.2%), Administrative & Support (32 | 14.2%), Professional & Scientific (31 | 13.8%), and Accommodation & Food Services (22 | 9.8%).
Employment Industries by Sex in Burkeville
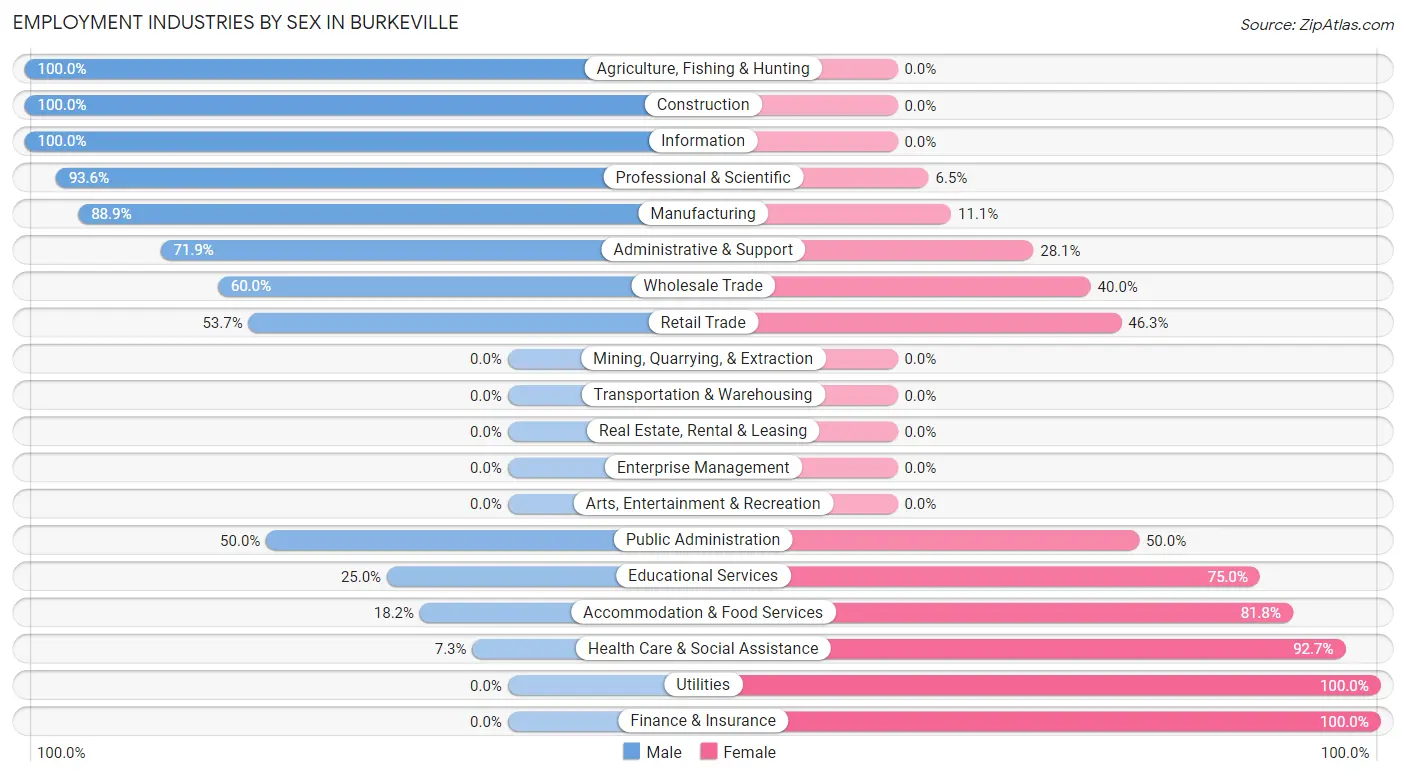
The Burkeville industries that see more men than women are Agriculture, Fishing & Hunting (100.0%), Construction (100.0%), and Information (100.0%), whereas the industries that tend to have a higher number of women are Utilities (100.0%), Finance & Insurance (100.0%), and Health Care & Social Assistance (92.7%).
| Industry | Male | Female |
| Agriculture, Fishing & Hunting | 5 (100.0%) | 0 (0.0%) |
| Mining, Quarrying, & Extraction | 0 (0.0%) | 0 (0.0%) |
| Construction | 13 (100.0%) | 0 (0.0%) |
| Manufacturing | 8 (88.9%) | 1 (11.1%) |
| Wholesale Trade | 3 (60.0%) | 2 (40.0%) |
| Retail Trade | 22 (53.7%) | 19 (46.3%) |
| Transportation & Warehousing | 0 (0.0%) | 0 (0.0%) |
| Utilities | 0 (0.0%) | 1 (100.0%) |
| Information | 9 (100.0%) | 0 (0.0%) |
| Finance & Insurance | 0 (0.0%) | 5 (100.0%) |
| Real Estate, Rental & Leasing | 0 (0.0%) | 0 (0.0%) |
| Professional & Scientific | 29 (93.5%) | 2 (6.5%) |
| Enterprise Management | 0 (0.0%) | 0 (0.0%) |
| Administrative & Support | 23 (71.9%) | 9 (28.1%) |
| Educational Services | 1 (25.0%) | 3 (75.0%) |
| Health Care & Social Assistance | 3 (7.3%) | 38 (92.7%) |
| Arts, Entertainment & Recreation | 0 (0.0%) | 0 (0.0%) |
| Accommodation & Food Services | 4 (18.2%) | 18 (81.8%) |
| Public Administration | 2 (50.0%) | 2 (50.0%) |
| Total | 123 (54.7%) | 102 (45.3%) |
Education in Burkeville
School Enrollment in Burkeville
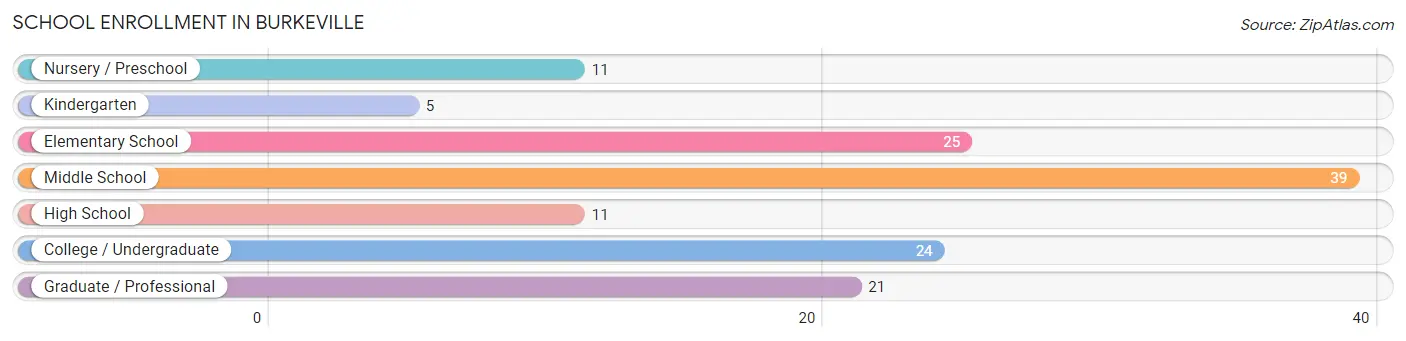
The most common levels of schooling among the 136 students in Burkeville are middle school (39 | 28.7%), elementary school (25 | 18.4%), and college / undergraduate (24 | 17.6%).
| School Level | # Students | % Students |
| Nursery / Preschool | 11 | 8.1% |
| Kindergarten | 5 | 3.7% |
| Elementary School | 25 | 18.4% |
| Middle School | 39 | 28.7% |
| High School | 11 | 8.1% |
| College / Undergraduate | 24 | 17.6% |
| Graduate / Professional | 21 | 15.4% |
| Total | 136 | 100.0% |
School Enrollment by Age by Funding Source in Burkeville
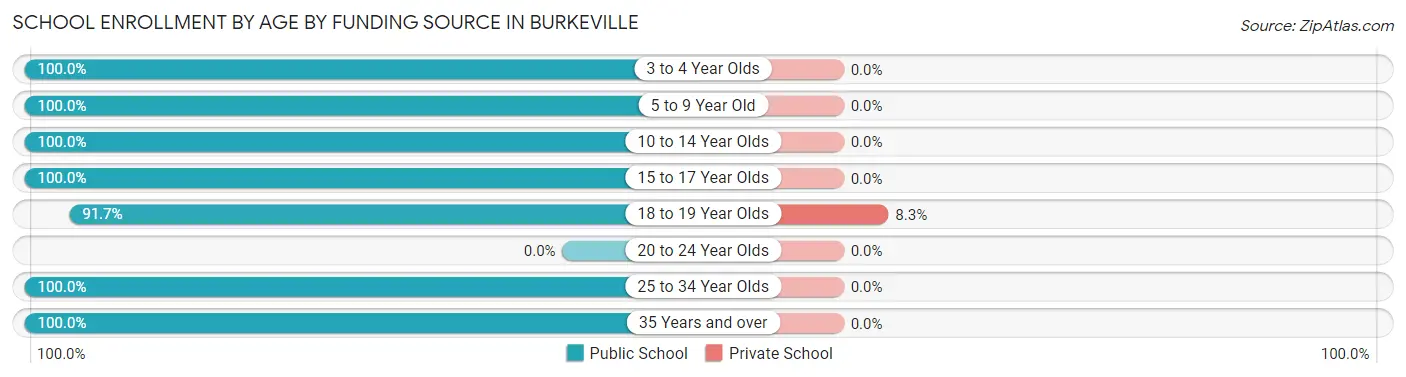
Out of a total of 136 students who are enrolled in schools in Burkeville, 1 (0.7%) attend a private institution, while the remaining 135 (99.3%) are enrolled in public schools. The age group of 18 to 19 year olds has the highest likelihood of being enrolled in private schools, with 1 (8.3% in the age bracket) enrolled. Conversely, the age group of 3 to 4 year olds has the lowest likelihood of being enrolled in a private school, with 2 (100.0% in the age bracket) attending a public institution.
| Age Bracket | Public School | Private School |
| 3 to 4 Year Olds | 2 (100.0%) | 0 (0.0%) |
| 5 to 9 Year Old | 39 (100.0%) | 0 (0.0%) |
| 10 to 14 Year Olds | 39 (100.0%) | 0 (0.0%) |
| 15 to 17 Year Olds | 10 (100.0%) | 0 (0.0%) |
| 18 to 19 Year Olds | 11 (91.7%) | 1 (8.3%) |
| 20 to 24 Year Olds | 0 (0.0%) | 0 (0.0%) |
| 25 to 34 Year Olds | 28 (100.0%) | 0 (0.0%) |
| 35 Years and over | 6 (100.0%) | 0 (0.0%) |
| Total | 135 (99.3%) | 1 (0.7%) |
Educational Attainment by Field of Study in Burkeville
Business (22 | 33.9%), engineering (21 | 32.3%), social sciences (11 | 16.9%), psychology (4 | 6.1%), and liberal arts & history (3 | 4.6%) are the most common fields of study among 65 individuals in Burkeville who have obtained a bachelor's degree or higher.
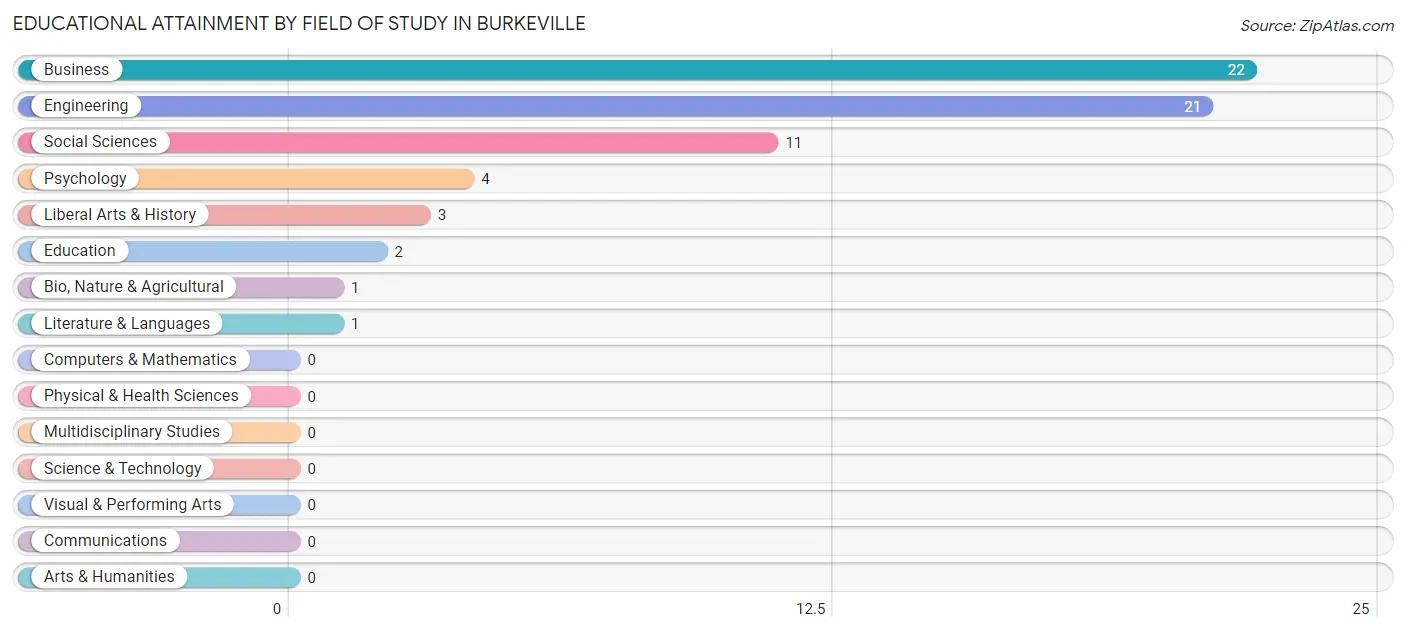
| Field of Study | # Graduates | % Graduates |
| Computers & Mathematics | 0 | 0.0% |
| Bio, Nature & Agricultural | 1 | 1.5% |
| Physical & Health Sciences | 0 | 0.0% |
| Psychology | 4 | 6.1% |
| Social Sciences | 11 | 16.9% |
| Engineering | 21 | 32.3% |
| Multidisciplinary Studies | 0 | 0.0% |
| Science & Technology | 0 | 0.0% |
| Business | 22 | 33.9% |
| Education | 2 | 3.1% |
| Literature & Languages | 1 | 1.5% |
| Liberal Arts & History | 3 | 4.6% |
| Visual & Performing Arts | 0 | 0.0% |
| Communications | 0 | 0.0% |
| Arts & Humanities | 0 | 0.0% |
| Total | 65 | 100.0% |
Transportation & Commute in Burkeville
Vehicle Availability by Sex in Burkeville
The most prevalent vehicle ownership categories in Burkeville are males with 3 vehicles (53, accounting for 43.1%) and females with 3 vehicles (24, making up 52.0%).
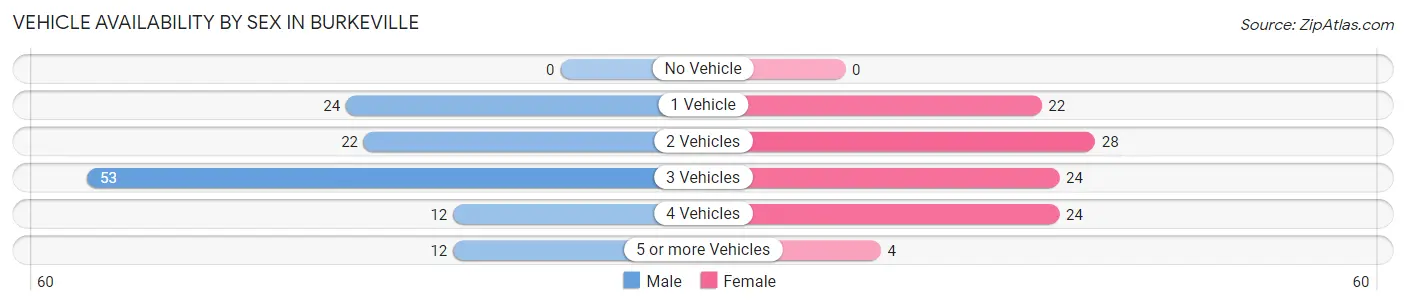
| Vehicles Available | Male | Female |
| No Vehicle | 0 (0.0%) | 0 (0.0%) |
| 1 Vehicle | 24 (19.5%) | 22 (21.6%) |
| 2 Vehicles | 22 (17.9%) | 28 (27.5%) |
| 3 Vehicles | 53 (43.1%) | 24 (23.5%) |
| 4 Vehicles | 12 (9.8%) | 24 (23.5%) |
| 5 or more Vehicles | 12 (9.8%) | 4 (3.9%) |
| Total | 123 (100.0%) | 102 (100.0%) |
Commute Time in Burkeville
The most frequently occuring commute durations in Burkeville are 30 to 34 minutes (54 commuters, 26.3%), 20 to 24 minutes (40 commuters, 19.5%), and 10 to 14 minutes (36 commuters, 17.6%).
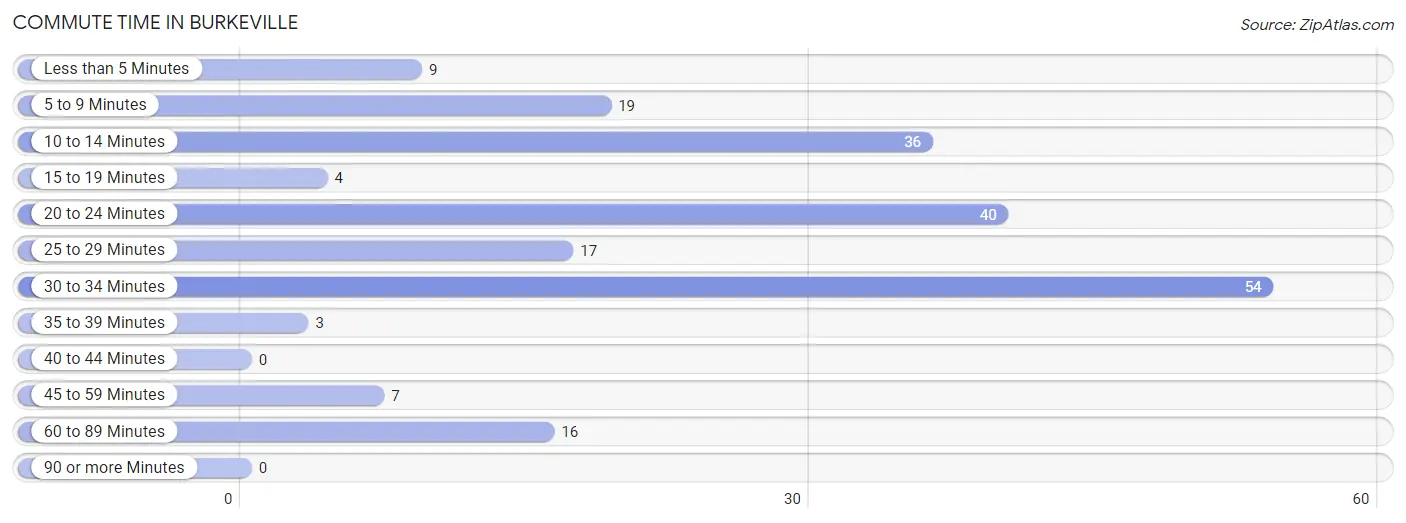
| Commute Time | # Commuters | % Commuters |
| Less than 5 Minutes | 9 | 4.4% |
| 5 to 9 Minutes | 19 | 9.3% |
| 10 to 14 Minutes | 36 | 17.6% |
| 15 to 19 Minutes | 4 | 1.9% |
| 20 to 24 Minutes | 40 | 19.5% |
| 25 to 29 Minutes | 17 | 8.3% |
| 30 to 34 Minutes | 54 | 26.3% |
| 35 to 39 Minutes | 3 | 1.5% |
| 40 to 44 Minutes | 0 | 0.0% |
| 45 to 59 Minutes | 7 | 3.4% |
| 60 to 89 Minutes | 16 | 7.8% |
| 90 or more Minutes | 0 | 0.0% |
Commute Time by Sex in Burkeville
The most common commute times in Burkeville are 30 to 34 minutes (39 commuters, 34.2%) for males and 20 to 24 minutes (32 commuters, 35.2%) for females.
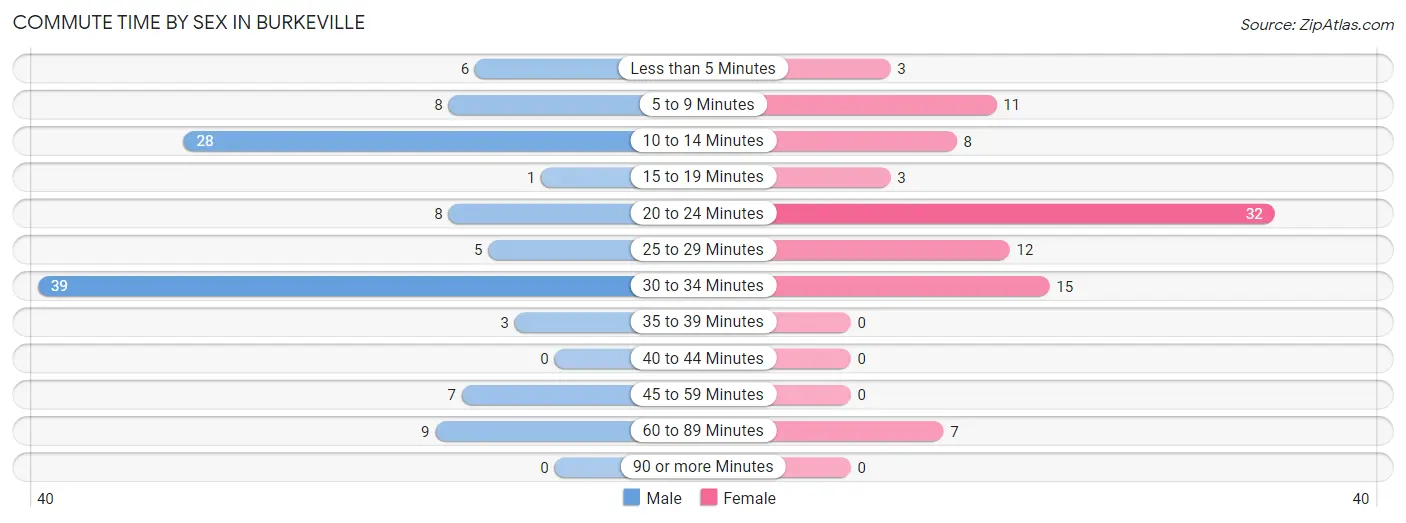
| Commute Time | Male | Female |
| Less than 5 Minutes | 6 (5.3%) | 3 (3.3%) |
| 5 to 9 Minutes | 8 (7.0%) | 11 (12.1%) |
| 10 to 14 Minutes | 28 (24.6%) | 8 (8.8%) |
| 15 to 19 Minutes | 1 (0.9%) | 3 (3.3%) |
| 20 to 24 Minutes | 8 (7.0%) | 32 (35.2%) |
| 25 to 29 Minutes | 5 (4.4%) | 12 (13.2%) |
| 30 to 34 Minutes | 39 (34.2%) | 15 (16.5%) |
| 35 to 39 Minutes | 3 (2.6%) | 0 (0.0%) |
| 40 to 44 Minutes | 0 (0.0%) | 0 (0.0%) |
| 45 to 59 Minutes | 7 (6.1%) | 0 (0.0%) |
| 60 to 89 Minutes | 9 (7.9%) | 7 (7.7%) |
| 90 or more Minutes | 0 (0.0%) | 0 (0.0%) |
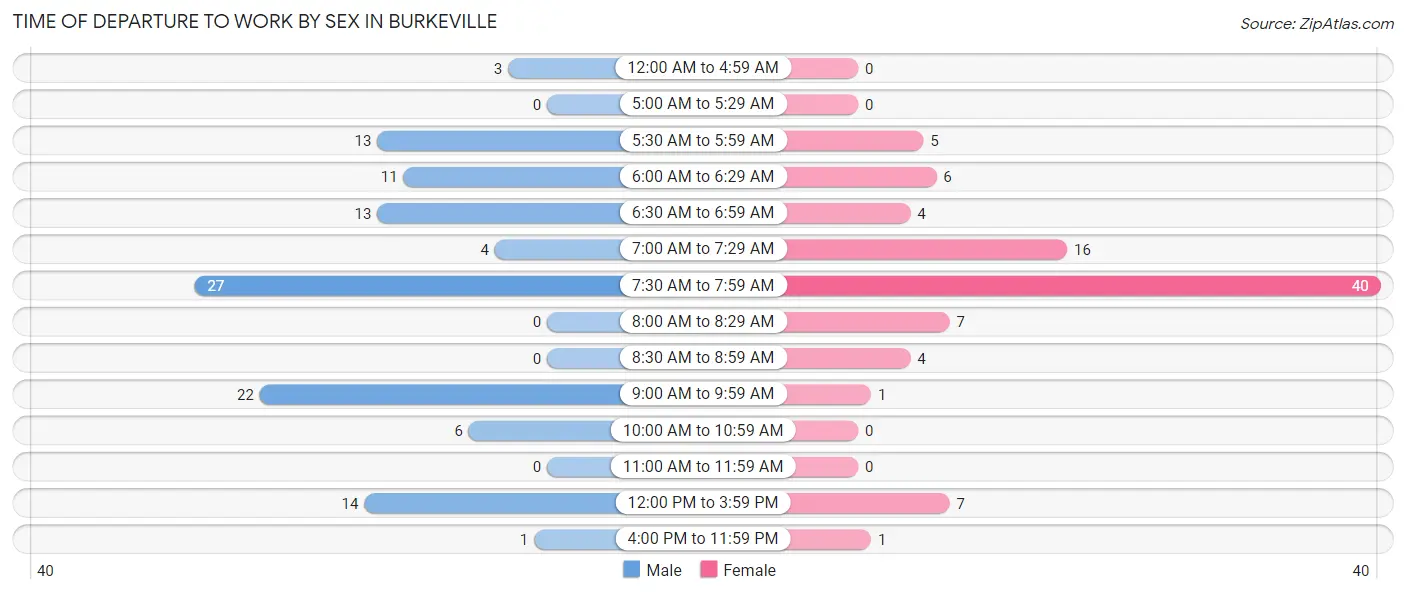
Time of Departure to Work by Sex in Burkeville
The most frequent times of departure to work in Burkeville are 7:30 AM to 7:59 AM (27, 23.7%) for males and 7:30 AM to 7:59 AM (40, 44.0%) for females.
| Time of Departure | Male | Female |
| 12:00 AM to 4:59 AM | 3 (2.6%) | 0 (0.0%) |
| 5:00 AM to 5:29 AM | 0 (0.0%) | 0 (0.0%) |
| 5:30 AM to 5:59 AM | 13 (11.4%) | 5 (5.5%) |
| 6:00 AM to 6:29 AM | 11 (9.7%) | 6 (6.6%) |
| 6:30 AM to 6:59 AM | 13 (11.4%) | 4 (4.4%) |
| 7:00 AM to 7:29 AM | 4 (3.5%) | 16 (17.6%) |
| 7:30 AM to 7:59 AM | 27 (23.7%) | 40 (44.0%) |
| 8:00 AM to 8:29 AM | 0 (0.0%) | 7 (7.7%) |
| 8:30 AM to 8:59 AM | 0 (0.0%) | 4 (4.4%) |
| 9:00 AM to 9:59 AM | 22 (19.3%) | 1 (1.1%) |
| 10:00 AM to 10:59 AM | 6 (5.3%) | 0 (0.0%) |
| 11:00 AM to 11:59 AM | 0 (0.0%) | 0 (0.0%) |
| 12:00 PM to 3:59 PM | 14 (12.3%) | 7 (7.7%) |
| 4:00 PM to 11:59 PM | 1 (0.9%) | 1 (1.1%) |
| Total | 114 (100.0%) | 91 (100.0%) |
Housing Occupancy in Burkeville
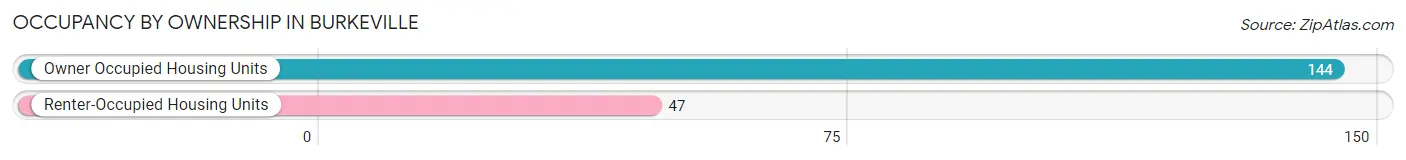
Occupancy by Ownership in Burkeville
Of the total 191 dwellings in Burkeville, owner-occupied units account for 144 (75.4%), while renter-occupied units make up 47 (24.6%).
| Occupancy | # Housing Units | % Housing Units |
| Owner Occupied Housing Units | 144 | 75.4% |
| Renter-Occupied Housing Units | 47 | 24.6% |
| Total Occupied Housing Units | 191 | 100.0% |
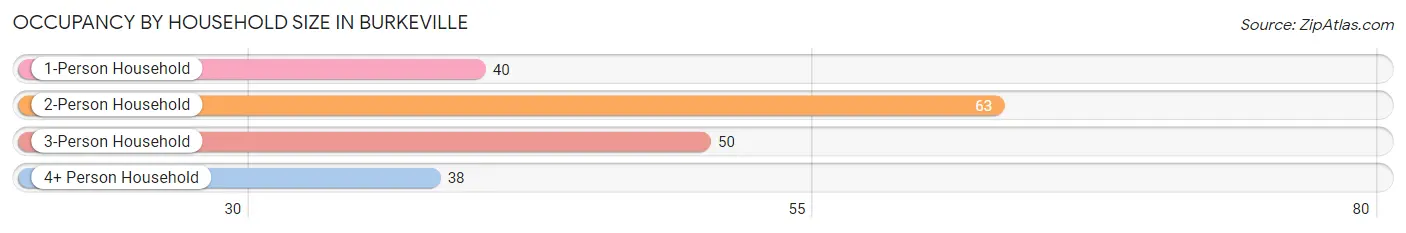
Occupancy by Household Size in Burkeville
| Household Size | # Housing Units | % Housing Units |
| 1-Person Household | 40 | 20.9% |
| 2-Person Household | 63 | 33.0% |
| 3-Person Household | 50 | 26.2% |
| 4+ Person Household | 38 | 19.9% |
| Total Housing Units | 191 | 100.0% |
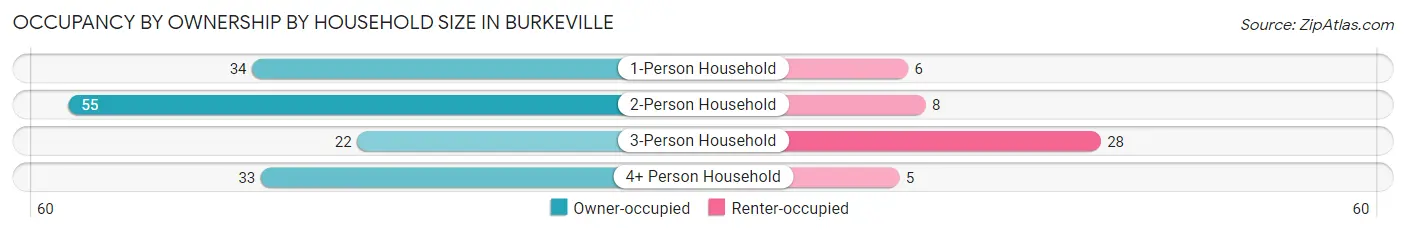
Occupancy by Ownership by Household Size in Burkeville
| Household Size | Owner-occupied | Renter-occupied |
| 1-Person Household | 34 (85.0%) | 6 (15.0%) |
| 2-Person Household | 55 (87.3%) | 8 (12.7%) |
| 3-Person Household | 22 (44.0%) | 28 (56.0%) |
| 4+ Person Household | 33 (86.8%) | 5 (13.2%) |
| Total Housing Units | 144 (75.4%) | 47 (24.6%) |
Occupancy by Educational Attainment in Burkeville
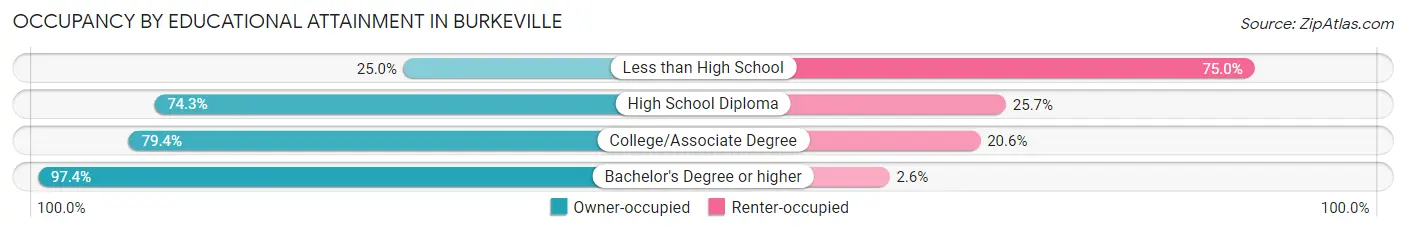
| Household Size | Owner-occupied | Renter-occupied |
| Less than High School | 5 (25.0%) | 15 (75.0%) |
| High School Diploma | 52 (74.3%) | 18 (25.7%) |
| College/Associate Degree | 50 (79.4%) | 13 (20.6%) |
| Bachelor's Degree or higher | 37 (97.4%) | 1 (2.6%) |
Occupancy by Age of Householder in Burkeville
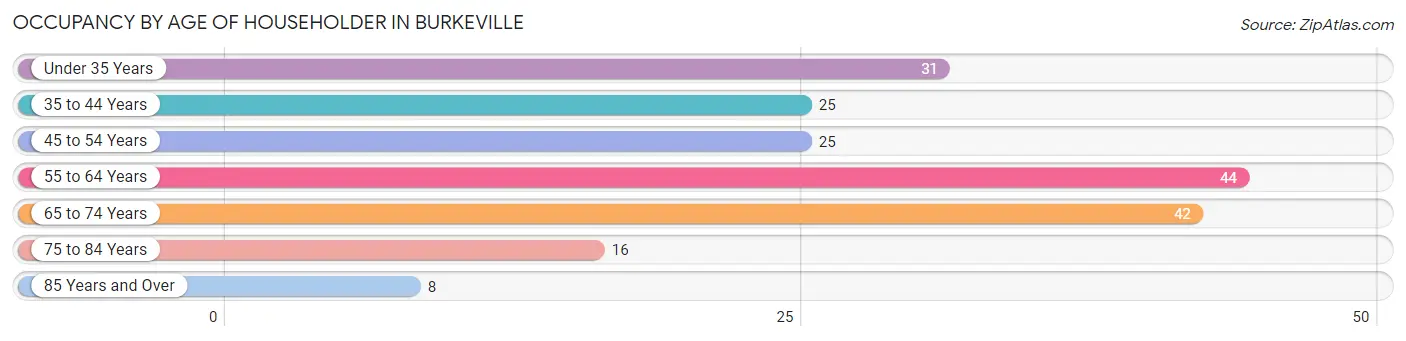
| Age Bracket | # Households | % Households |
| Under 35 Years | 31 | 16.2% |
| 35 to 44 Years | 25 | 13.1% |
| 45 to 54 Years | 25 | 13.1% |
| 55 to 64 Years | 44 | 23.0% |
| 65 to 74 Years | 42 | 22.0% |
| 75 to 84 Years | 16 | 8.4% |
| 85 Years and Over | 8 | 4.2% |
| Total | 191 | 100.0% |
Housing Finances in Burkeville
Median Income by Occupancy in Burkeville
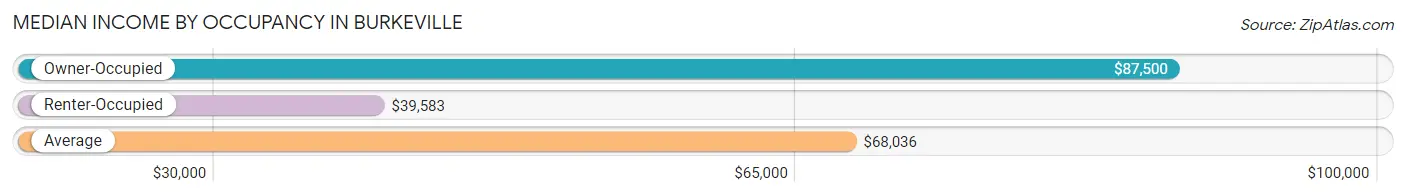
| Occupancy Type | # Households | Median Income |
| Owner-Occupied | 144 (75.4%) | $87,500 |
| Renter-Occupied | 47 (24.6%) | $39,583 |
| Average | 191 (100.0%) | $68,036 |
Occupancy by Householder Income Bracket in Burkeville
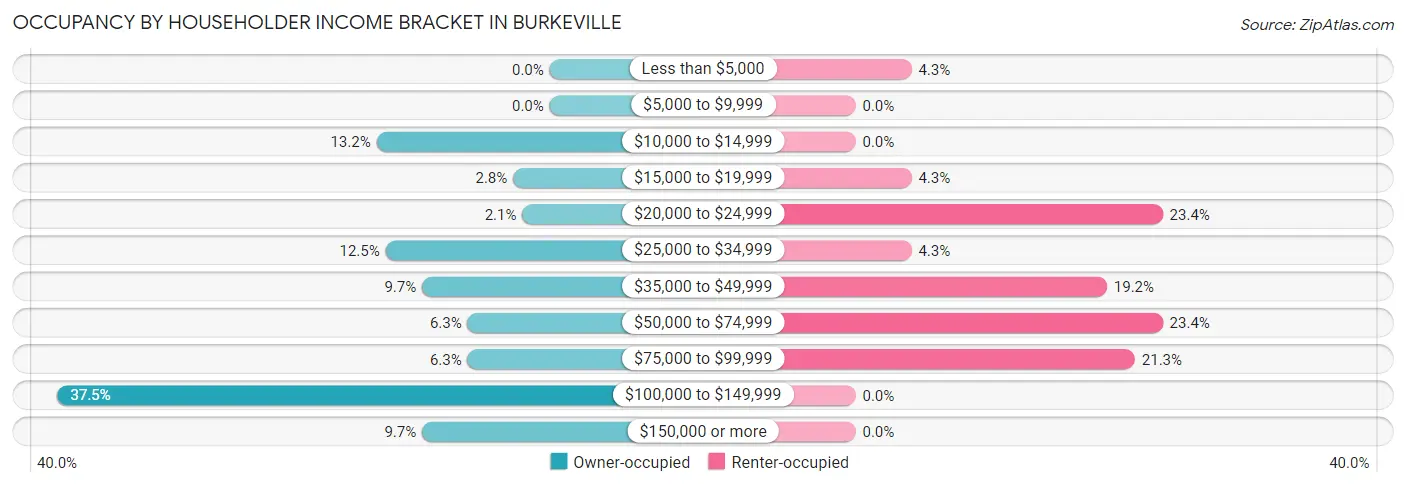
| Income Bracket | Owner-occupied | Renter-occupied |
| Less than $5,000 | 0 (0.0%) | 2 (4.3%) |
| $5,000 to $9,999 | 0 (0.0%) | 0 (0.0%) |
| $10,000 to $14,999 | 19 (13.2%) | 0 (0.0%) |
| $15,000 to $19,999 | 4 (2.8%) | 2 (4.3%) |
| $20,000 to $24,999 | 3 (2.1%) | 11 (23.4%) |
| $25,000 to $34,999 | 18 (12.5%) | 2 (4.3%) |
| $35,000 to $49,999 | 14 (9.7%) | 9 (19.2%) |
| $50,000 to $74,999 | 9 (6.2%) | 11 (23.4%) |
| $75,000 to $99,999 | 9 (6.2%) | 10 (21.3%) |
| $100,000 to $149,999 | 54 (37.5%) | 0 (0.0%) |
| $150,000 or more | 14 (9.7%) | 0 (0.0%) |
| Total | 144 (100.0%) | 47 (100.0%) |
Monthly Housing Cost Tiers in Burkeville
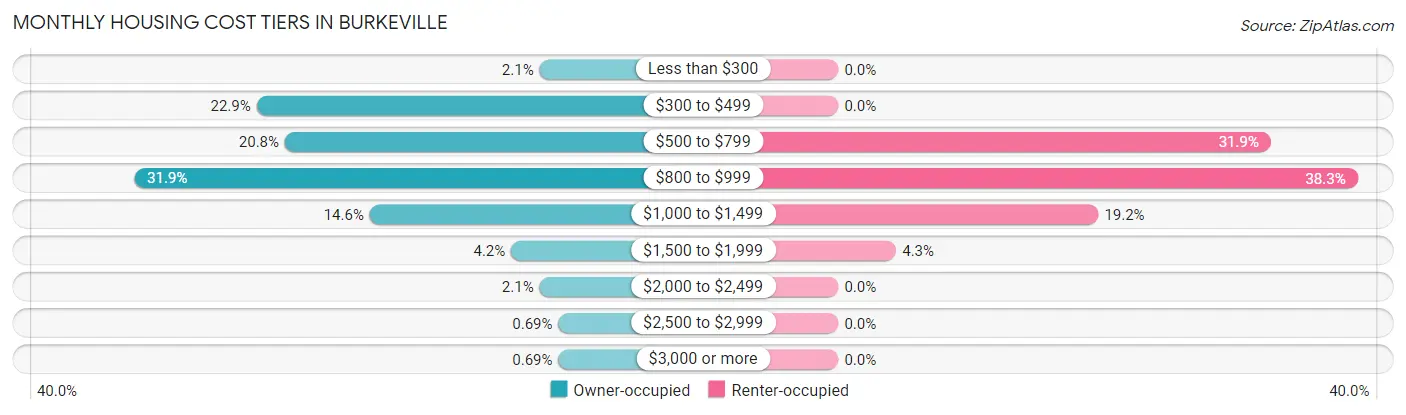
| Monthly Cost | Owner-occupied | Renter-occupied |
| Less than $300 | 3 (2.1%) | 0 (0.0%) |
| $300 to $499 | 33 (22.9%) | 0 (0.0%) |
| $500 to $799 | 30 (20.8%) | 15 (31.9%) |
| $800 to $999 | 46 (31.9%) | 18 (38.3%) |
| $1,000 to $1,499 | 21 (14.6%) | 9 (19.2%) |
| $1,500 to $1,999 | 6 (4.2%) | 2 (4.3%) |
| $2,000 to $2,499 | 3 (2.1%) | 0 (0.0%) |
| $2,500 to $2,999 | 1 (0.7%) | 0 (0.0%) |
| $3,000 or more | 1 (0.7%) | 0 (0.0%) |
| Total | 144 (100.0%) | 47 (100.0%) |
Physical Housing Characteristics in Burkeville
Housing Structures in Burkeville
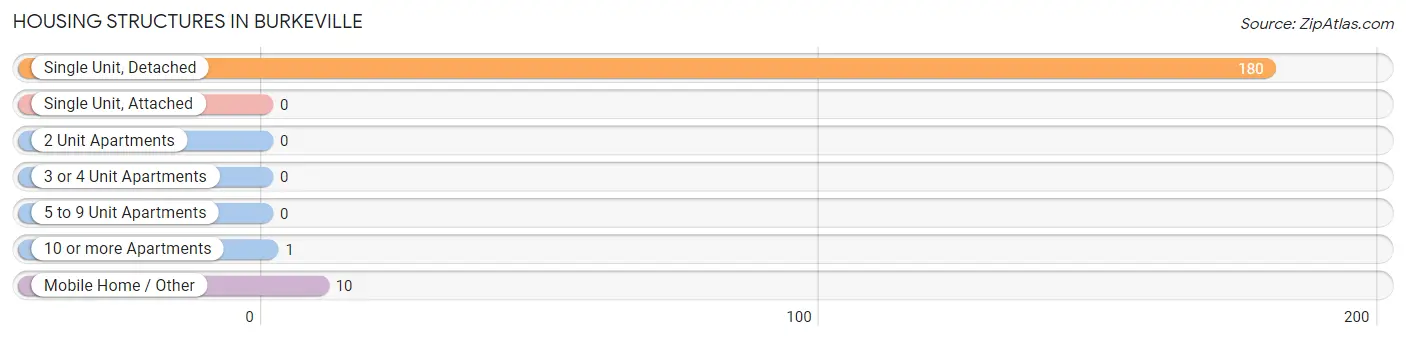
| Structure Type | # Housing Units | % Housing Units |
| Single Unit, Detached | 180 | 94.2% |
| Single Unit, Attached | 0 | 0.0% |
| 2 Unit Apartments | 0 | 0.0% |
| 3 or 4 Unit Apartments | 0 | 0.0% |
| 5 to 9 Unit Apartments | 0 | 0.0% |
| 10 or more Apartments | 1 | 0.5% |
| Mobile Home / Other | 10 | 5.2% |
| Total | 191 | 100.0% |
Housing Structures by Occupancy in Burkeville
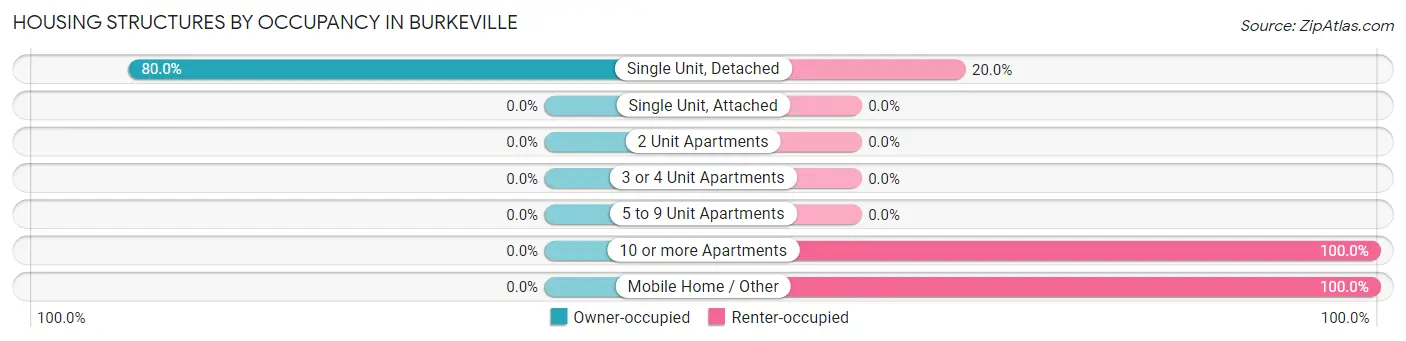
| Structure Type | Owner-occupied | Renter-occupied |
| Single Unit, Detached | 144 (80.0%) | 36 (20.0%) |
| Single Unit, Attached | 0 (0.0%) | 0 (0.0%) |
| 2 Unit Apartments | 0 (0.0%) | 0 (0.0%) |
| 3 or 4 Unit Apartments | 0 (0.0%) | 0 (0.0%) |
| 5 to 9 Unit Apartments | 0 (0.0%) | 0 (0.0%) |
| 10 or more Apartments | 0 (0.0%) | 1 (100.0%) |
| Mobile Home / Other | 0 (0.0%) | 10 (100.0%) |
| Total | 144 (75.4%) | 47 (24.6%) |
Housing Structures by Number of Rooms in Burkeville
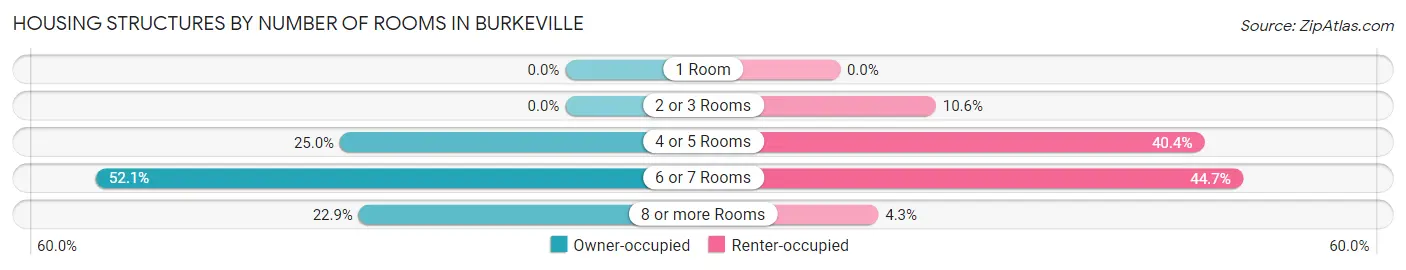
| Number of Rooms | Owner-occupied | Renter-occupied |
| 1 Room | 0 (0.0%) | 0 (0.0%) |
| 2 or 3 Rooms | 0 (0.0%) | 5 (10.6%) |
| 4 or 5 Rooms | 36 (25.0%) | 19 (40.4%) |
| 6 or 7 Rooms | 75 (52.1%) | 21 (44.7%) |
| 8 or more Rooms | 33 (22.9%) | 2 (4.3%) |
| Total | 144 (100.0%) | 47 (100.0%) |
Housing Structure by Heating Type in Burkeville
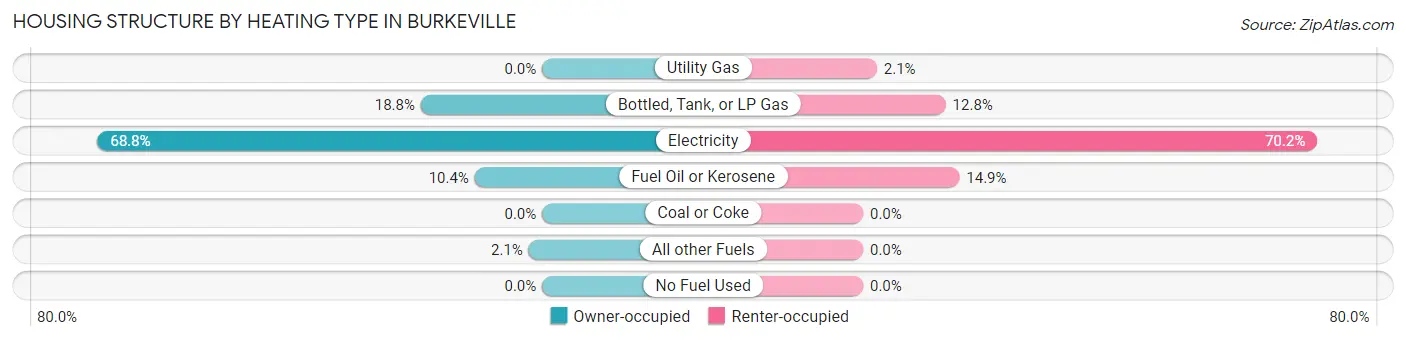
| Heating Type | Owner-occupied | Renter-occupied |
| Utility Gas | 0 (0.0%) | 1 (2.1%) |
| Bottled, Tank, or LP Gas | 27 (18.8%) | 6 (12.8%) |
| Electricity | 99 (68.8%) | 33 (70.2%) |
| Fuel Oil or Kerosene | 15 (10.4%) | 7 (14.9%) |
| Coal or Coke | 0 (0.0%) | 0 (0.0%) |
| All other Fuels | 3 (2.1%) | 0 (0.0%) |
| No Fuel Used | 0 (0.0%) | 0 (0.0%) |
| Total | 144 (100.0%) | 47 (100.0%) |
Household Vehicle Usage in Burkeville
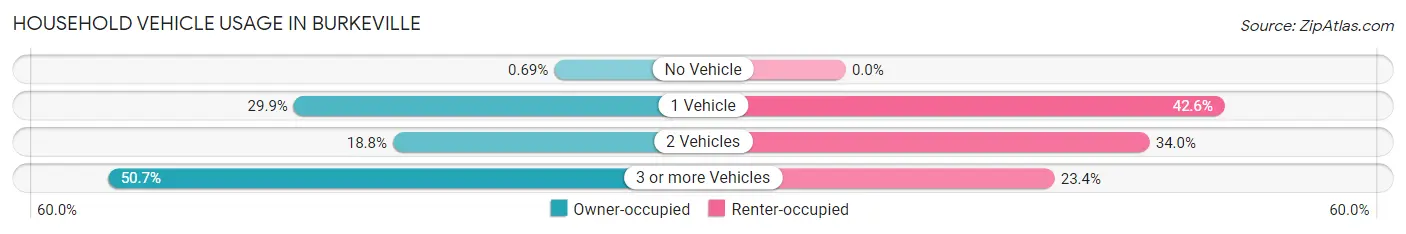
| Vehicles per Household | Owner-occupied | Renter-occupied |
| No Vehicle | 1 (0.7%) | 0 (0.0%) |
| 1 Vehicle | 43 (29.9%) | 20 (42.5%) |
| 2 Vehicles | 27 (18.8%) | 16 (34.0%) |
| 3 or more Vehicles | 73 (50.7%) | 11 (23.4%) |
| Total | 144 (100.0%) | 47 (100.0%) |
Real Estate & Mortgages in Burkeville
Real Estate and Mortgage Overview in Burkeville
| Characteristic | Without Mortgage | With Mortgage |
| Housing Units | 59 | 85 |
| Median Property Value | $101,600 | $86,100 |
| Median Household Income | $46,563 | $11 |
| Monthly Housing Costs | $464 | $1 |
| Real Estate Taxes | $660 | $3 |
Property Value by Mortgage Status in Burkeville
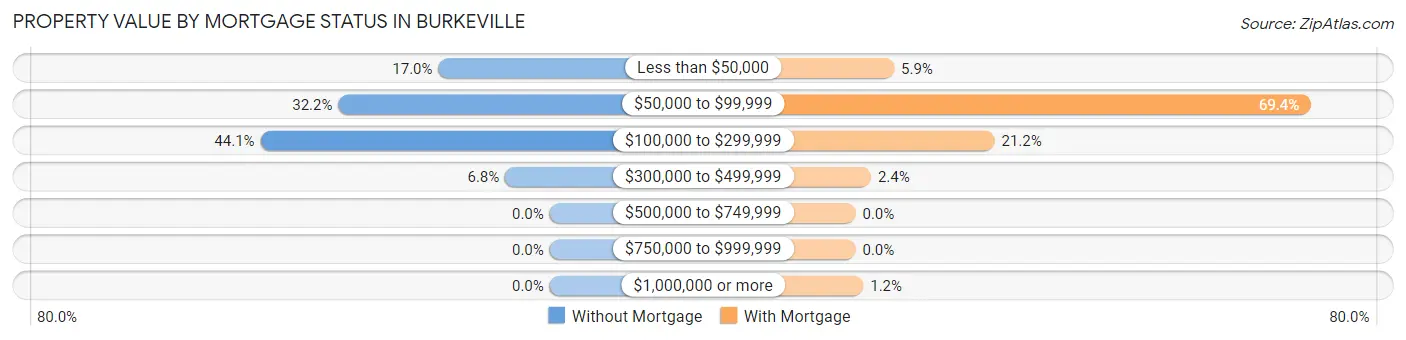
| Property Value | Without Mortgage | With Mortgage |
| Less than $50,000 | 10 (17.0%) | 5 (5.9%) |
| $50,000 to $99,999 | 19 (32.2%) | 59 (69.4%) |
| $100,000 to $299,999 | 26 (44.1%) | 18 (21.2%) |
| $300,000 to $499,999 | 4 (6.8%) | 2 (2.4%) |
| $500,000 to $749,999 | 0 (0.0%) | 0 (0.0%) |
| $750,000 to $999,999 | 0 (0.0%) | 0 (0.0%) |
| $1,000,000 or more | 0 (0.0%) | 1 (1.2%) |
| Total | 59 (100.0%) | 85 (100.0%) |
Household Income by Mortgage Status in Burkeville
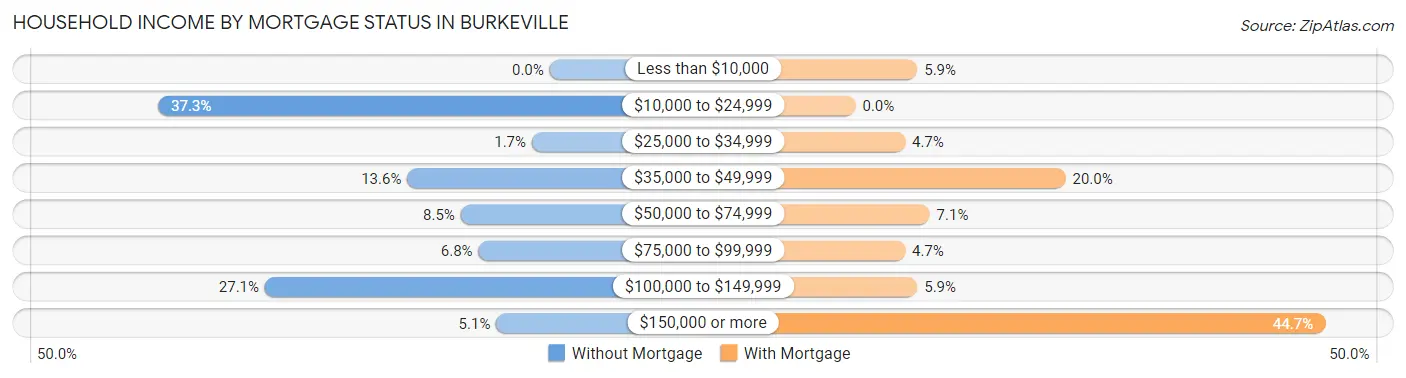
| Household Income | Without Mortgage | With Mortgage |
| Less than $10,000 | 0 (0.0%) | 5 (5.9%) |
| $10,000 to $24,999 | 22 (37.3%) | 0 (0.0%) |
| $25,000 to $34,999 | 1 (1.7%) | 4 (4.7%) |
| $35,000 to $49,999 | 8 (13.6%) | 17 (20.0%) |
| $50,000 to $74,999 | 5 (8.5%) | 6 (7.1%) |
| $75,000 to $99,999 | 4 (6.8%) | 4 (4.7%) |
| $100,000 to $149,999 | 16 (27.1%) | 5 (5.9%) |
| $150,000 or more | 3 (5.1%) | 38 (44.7%) |
| Total | 59 (100.0%) | 85 (100.0%) |
Property Value to Household Income Ratio in Burkeville
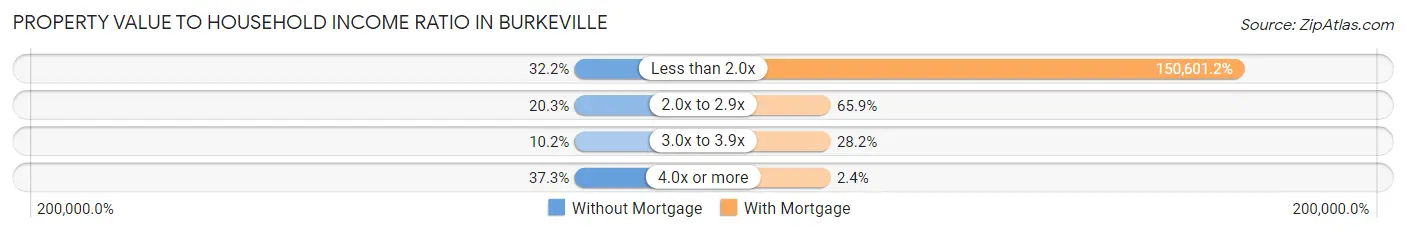
| Value-to-Income Ratio | Without Mortgage | With Mortgage |
| Less than 2.0x | 19 (32.2%) | 128,011 (150,601.2%) |
| 2.0x to 2.9x | 12 (20.3%) | 56 (65.9%) |
| 3.0x to 3.9x | 6 (10.2%) | 24 (28.2%) |
| 4.0x or more | 22 (37.3%) | 2 (2.4%) |
| Total | 59 (100.0%) | 85 (100.0%) |
Real Estate Taxes by Mortgage Status in Burkeville
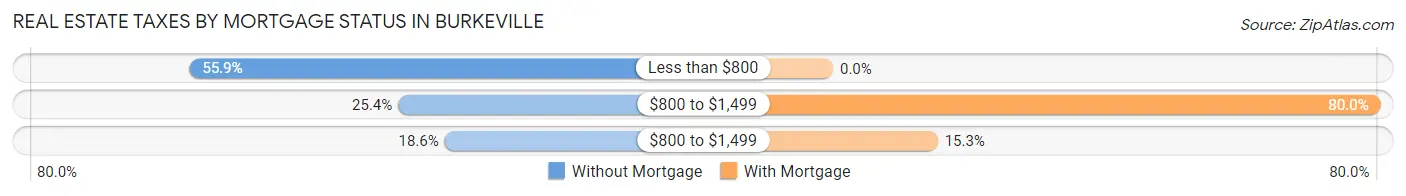
| Property Taxes | Without Mortgage | With Mortgage |
| Less than $800 | 33 (55.9%) | 0 (0.0%) |
| $800 to $1,499 | 15 (25.4%) | 68 (80.0%) |
| $800 to $1,499 | 11 (18.6%) | 13 (15.3%) |
| Total | 59 (100.0%) | 85 (100.0%) |
Health & Disability in Burkeville
Health Insurance Coverage by Age in Burkeville
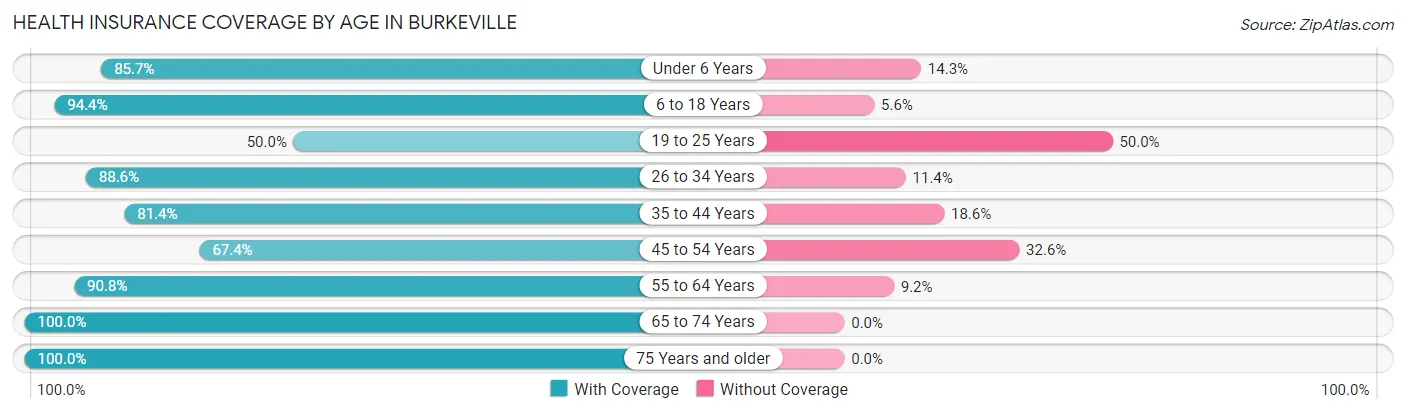
| Age Bracket | With Coverage | Without Coverage |
| Under 6 Years | 36 (85.7%) | 6 (14.3%) |
| 6 to 18 Years | 85 (94.4%) | 5 (5.6%) |
| 19 to 25 Years | 16 (50.0%) | 16 (50.0%) |
| 26 to 34 Years | 62 (88.6%) | 8 (11.4%) |
| 35 to 44 Years | 35 (81.4%) | 8 (18.6%) |
| 45 to 54 Years | 31 (67.4%) | 15 (32.6%) |
| 55 to 64 Years | 59 (90.8%) | 6 (9.2%) |
| 65 to 74 Years | 67 (100.0%) | 0 (0.0%) |
| 75 Years and older | 30 (100.0%) | 0 (0.0%) |
| Total | 421 (86.8%) | 64 (13.2%) |
Health Insurance Coverage by Citizenship Status in Burkeville
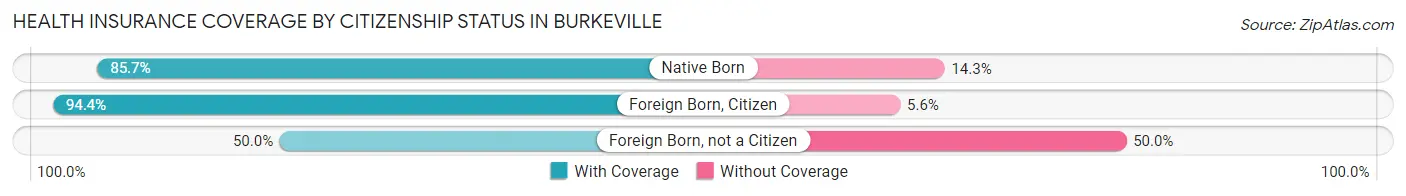
| Citizenship Status | With Coverage | Without Coverage |
| Native Born | 36 (85.7%) | 6 (14.3%) |
| Foreign Born, Citizen | 85 (94.4%) | 5 (5.6%) |
| Foreign Born, not a Citizen | 16 (50.0%) | 16 (50.0%) |
Health Insurance Coverage by Household Income in Burkeville
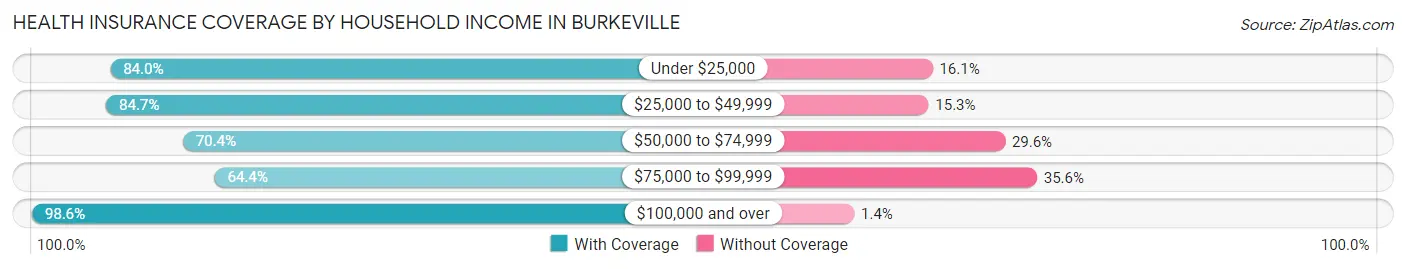
| Household Income | With Coverage | Without Coverage |
| Under $25,000 | 68 (84.0%) | 13 (16.1%) |
| $25,000 to $49,999 | 61 (84.7%) | 11 (15.3%) |
| $50,000 to $74,999 | 38 (70.4%) | 16 (29.6%) |
| $75,000 to $99,999 | 38 (64.4%) | 21 (35.6%) |
| $100,000 and over | 216 (98.6%) | 3 (1.4%) |
Public vs Private Health Insurance Coverage by Age in Burkeville
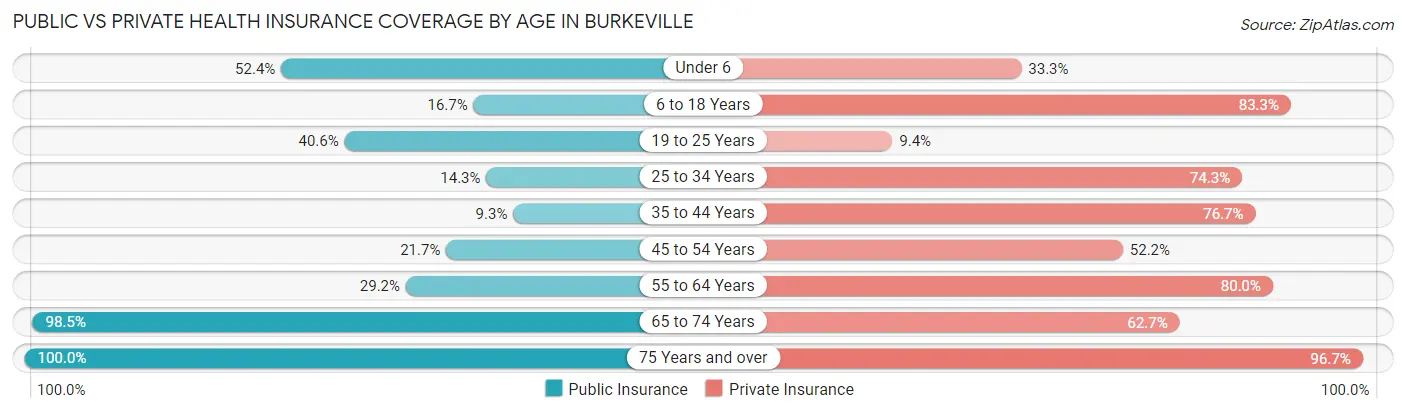
| Age Bracket | Public Insurance | Private Insurance |
| Under 6 | 22 (52.4%) | 14 (33.3%) |
| 6 to 18 Years | 15 (16.7%) | 75 (83.3%) |
| 19 to 25 Years | 13 (40.6%) | 3 (9.4%) |
| 25 to 34 Years | 10 (14.3%) | 52 (74.3%) |
| 35 to 44 Years | 4 (9.3%) | 33 (76.7%) |
| 45 to 54 Years | 10 (21.7%) | 24 (52.2%) |
| 55 to 64 Years | 19 (29.2%) | 52 (80.0%) |
| 65 to 74 Years | 66 (98.5%) | 42 (62.7%) |
| 75 Years and over | 30 (100.0%) | 29 (96.7%) |
| Total | 189 (39.0%) | 324 (66.8%) |
Disability Status by Sex by Age in Burkeville
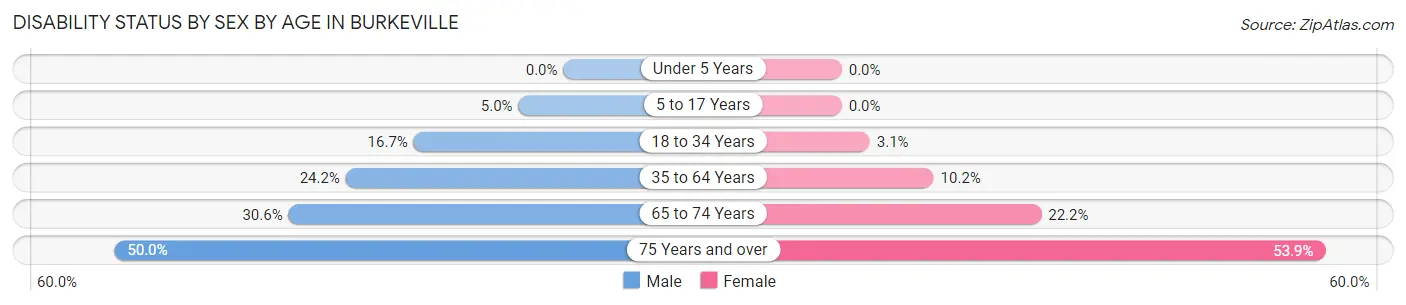
| Age Bracket | Male | Female |
| Under 5 Years | 0 (0.0%) | 0 (0.0%) |
| 5 to 17 Years | 2 (5.0%) | 0 (0.0%) |
| 18 to 34 Years | 8 (16.7%) | 2 (3.1%) |
| 35 to 64 Years | 16 (24.2%) | 9 (10.2%) |
| 65 to 74 Years | 15 (30.6%) | 4 (22.2%) |
| 75 Years and over | 2 (50.0%) | 14 (53.8%) |
Disability Class by Sex by Age in Burkeville
Disability Class: Hearing Difficulty
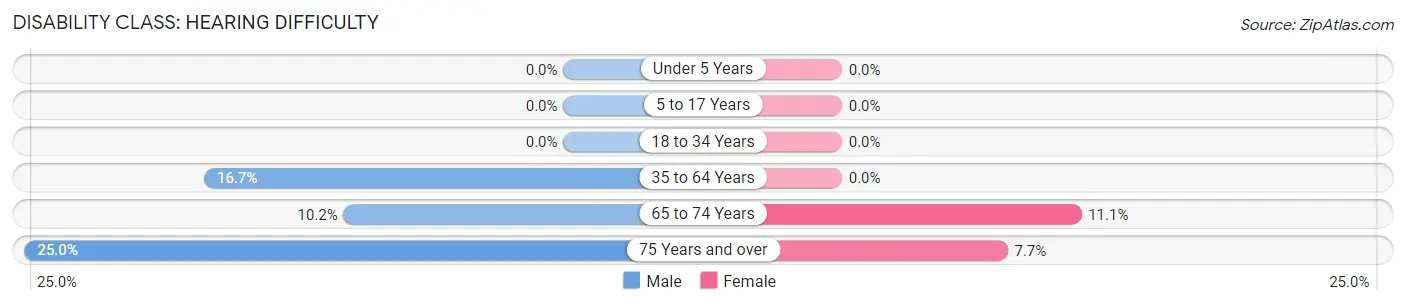
| Age Bracket | Male | Female |
| Under 5 Years | 0 (0.0%) | 0 (0.0%) |
| 5 to 17 Years | 0 (0.0%) | 0 (0.0%) |
| 18 to 34 Years | 0 (0.0%) | 0 (0.0%) |
| 35 to 64 Years | 11 (16.7%) | 0 (0.0%) |
| 65 to 74 Years | 5 (10.2%) | 2 (11.1%) |
| 75 Years and over | 1 (25.0%) | 2 (7.7%) |
Disability Class: Vision Difficulty
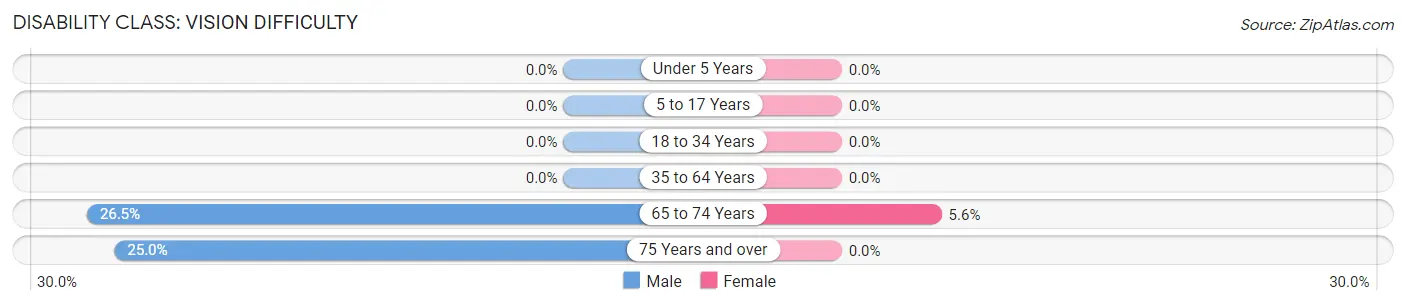
| Age Bracket | Male | Female |
| Under 5 Years | 0 (0.0%) | 0 (0.0%) |
| 5 to 17 Years | 0 (0.0%) | 0 (0.0%) |
| 18 to 34 Years | 0 (0.0%) | 0 (0.0%) |
| 35 to 64 Years | 0 (0.0%) | 0 (0.0%) |
| 65 to 74 Years | 13 (26.5%) | 1 (5.6%) |
| 75 Years and over | 1 (25.0%) | 0 (0.0%) |
Disability Class: Cognitive Difficulty
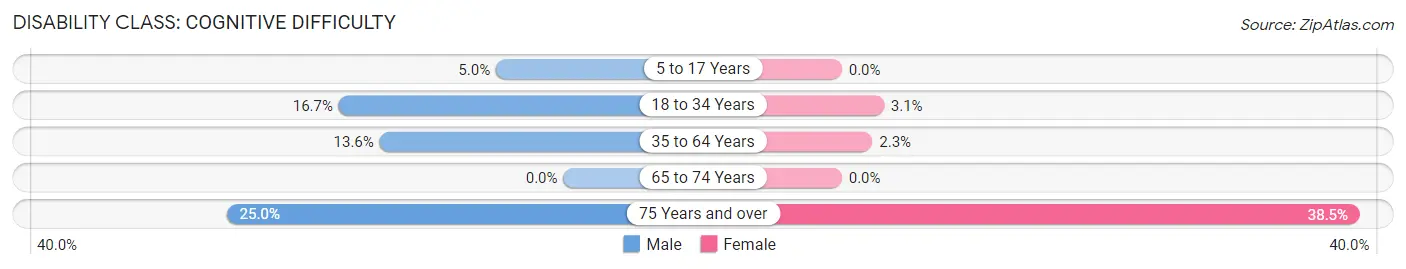
| Age Bracket | Male | Female |
| 5 to 17 Years | 2 (5.0%) | 0 (0.0%) |
| 18 to 34 Years | 8 (16.7%) | 2 (3.1%) |
| 35 to 64 Years | 9 (13.6%) | 2 (2.3%) |
| 65 to 74 Years | 0 (0.0%) | 0 (0.0%) |
| 75 Years and over | 1 (25.0%) | 10 (38.5%) |
Disability Class: Ambulatory Difficulty
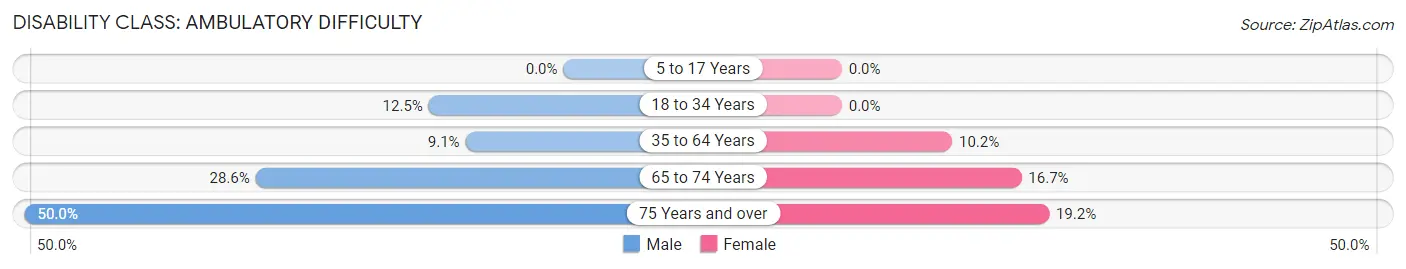
| Age Bracket | Male | Female |
| 5 to 17 Years | 0 (0.0%) | 0 (0.0%) |
| 18 to 34 Years | 6 (12.5%) | 0 (0.0%) |
| 35 to 64 Years | 6 (9.1%) | 9 (10.2%) |
| 65 to 74 Years | 14 (28.6%) | 3 (16.7%) |
| 75 Years and over | 2 (50.0%) | 5 (19.2%) |
Disability Class: Self-Care Difficulty
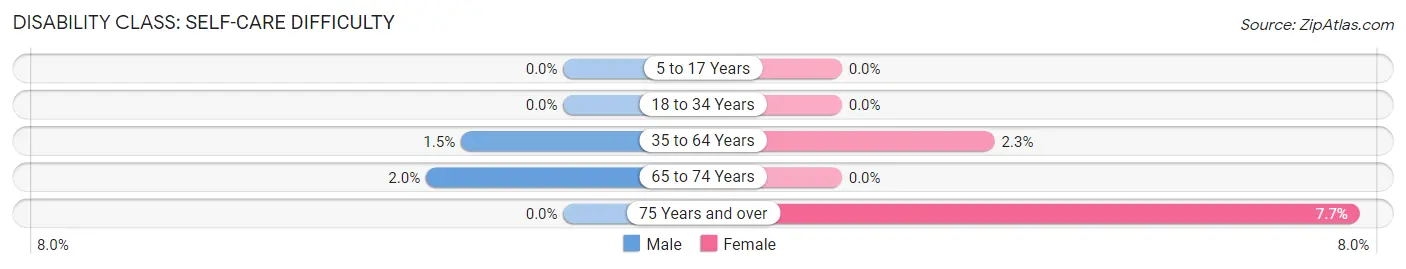
| Age Bracket | Male | Female |
| 5 to 17 Years | 0 (0.0%) | 0 (0.0%) |
| 18 to 34 Years | 0 (0.0%) | 0 (0.0%) |
| 35 to 64 Years | 1 (1.5%) | 2 (2.3%) |
| 65 to 74 Years | 1 (2.0%) | 0 (0.0%) |
| 75 Years and over | 0 (0.0%) | 2 (7.7%) |
Technology Access in Burkeville
Computing Device Access in Burkeville
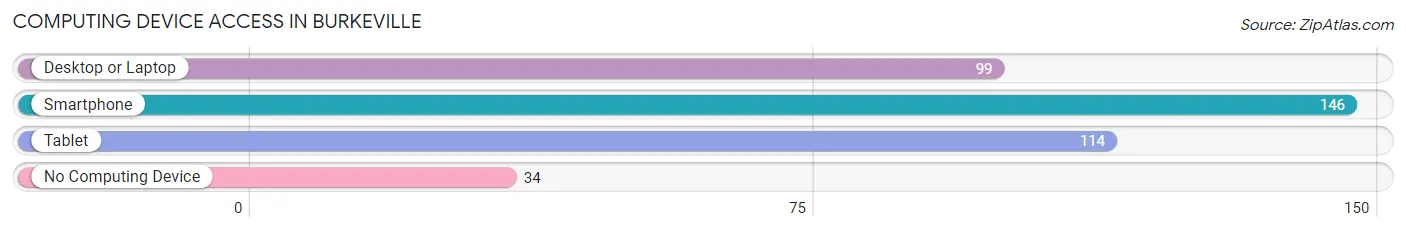
| Device Type | # Households | % Households |
| Desktop or Laptop | 99 | 51.8% |
| Smartphone | 146 | 76.4% |
| Tablet | 114 | 59.7% |
| No Computing Device | 34 | 17.8% |
| Total | 191 | 100.0% |
Internet Access in Burkeville
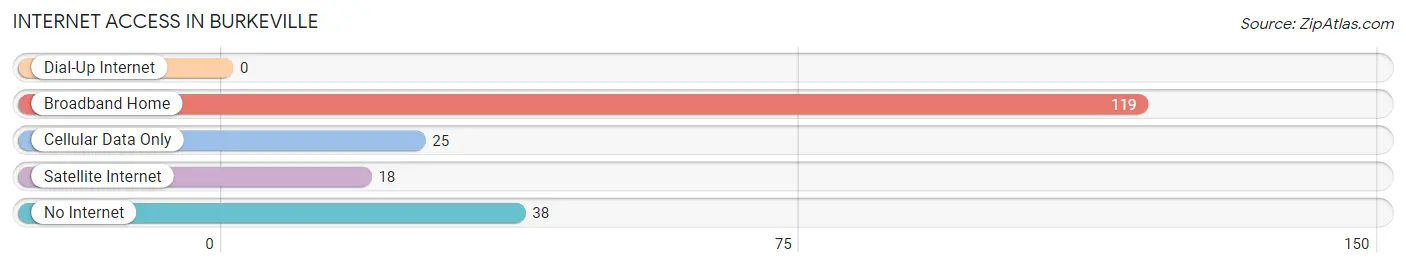
| Internet Type | # Households | % Households |
| Dial-Up Internet | 0 | 0.0% |
| Broadband Home | 119 | 62.3% |
| Cellular Data Only | 25 | 13.1% |
| Satellite Internet | 18 | 9.4% |
| No Internet | 38 | 19.9% |
| Total | 191 | 100.0% |
Burkeville Summary
Burkeville is a small town located in Nottoway County, Virginia. It is situated on the banks of the Appomattox River, approximately halfway between Richmond and Petersburg. The town was founded in 1832 and named after Edmund Burke, an Irish statesman and philosopher. Burkeville is a rural community with a population of 1,717 as of the 2010 census.
History
Burkeville was founded in 1832 by William Burke, a local landowner. The town was named after Edmund Burke, an Irish statesman and philosopher. Burkeville was incorporated in 1872 and was the first town in Nottoway County to be incorporated.
The town was a major stop on the Southside Railroad, which connected Petersburg and Richmond. The railroad was a major factor in the growth of Burkeville, as it allowed for the transportation of goods and people. The railroad also allowed for the development of the town's economy, as it provided access to markets in both Richmond and Petersburg.
The town was also home to a number of Confederate soldiers during the Civil War. The town was the site of a skirmish between Union and Confederate forces in 1864.
Geography
Burkeville is located in Nottoway County, Virginia. It is situated on the banks of the Appomattox River, approximately halfway between Richmond and Petersburg. The town is located in the Piedmont region of Virginia, which is characterized by rolling hills and fertile soil.
The town has a total area of 1.2 square miles, all of which is land. The town is located in a humid subtropical climate zone, with hot, humid summers and mild winters.
Economy
Burkeville's economy is largely based on agriculture. The town is home to a number of farms, which produce a variety of crops, including corn, soybeans, wheat, and hay. The town is also home to a number of small businesses, including restaurants, retail stores, and service providers.
The town is also home to a number of manufacturing companies, including a furniture factory and a plastics factory. The town is also home to a number of trucking companies, which provide transportation services to the surrounding area.
Demographics
As of the 2010 census, Burkeville had a population of 1,717. The racial makeup of the town was 79.2% White, 17.7% African American, 0.3% Native American, 0.2% Asian, 0.1% Pacific Islander, 0.7% from other races, and 1.9% from two or more races. Hispanic or Latino of any race were 1.7% of the population.
The median income for a household in Burkeville was $35,938, and the median income for a family was $41,250. The per capita income for the town was $17,845. About 15.2% of families and 17.7% of the population were below the poverty line, including 25.2% of those under age 18 and 11.2% of those age 65 or over.
Common Questions
What is Per Capita Income in Burkeville?
Per Capita income in Burkeville is $32,130.
What is the Median Family Income in Burkeville?
Median Family Income in Burkeville is $84,583.
What is the Median Household income in Burkeville?
Median Household Income in Burkeville is $68,036.
What is Income or Wage Gap in Burkeville?
Income or Wage Gap in Burkeville is 54.9%.
Women in Burkeville earn 45.1 cents for every dollar earned by a man.
What is Inequality or Gini Index in Burkeville?
Inequality or Gini Index in Burkeville is 0.41.
What is the Total Population of Burkeville?
Total Population of Burkeville is 485.
What is the Total Male Population of Burkeville?
Total Male Population of Burkeville is 220.
What is the Total Female Population of Burkeville?
Total Female Population of Burkeville is 265.
What is the Ratio of Males per 100 Females in Burkeville?
There are 83.02 Males per 100 Females in Burkeville.
What is the Ratio of Females per 100 Males in Burkeville?
There are 120.45 Females per 100 Males in Burkeville.
What is the Median Population Age in Burkeville?
Median Population Age in Burkeville is 36.8 Years.
What is the Average Family Size in Burkeville
Average Family Size in Burkeville is 2.8 People.
What is the Average Household Size in Burkeville
Average Household Size in Burkeville is 2.5 People.
How Large is the Labor Force in Burkeville?
There are 226 People in the Labor Forcein in Burkeville.
What is the Percentage of People in the Labor Force in Burkeville?
61.1% of People are in the Labor Force in Burkeville.
What is the Unemployment Rate in Burkeville?
Unemployment Rate in Burkeville is 0.4%.