Zip Codes with the Highest Percentage of Population with a Degree in Social Sciences in Acton, MA
RELATED REPORTS & OPTIONS
Social Sciences
Acton
Compare Zip Codes
Map of Zip Codes with the Highest Percentage of Population with a Degree in Social Sciences in Acton
8.5%
17.7%
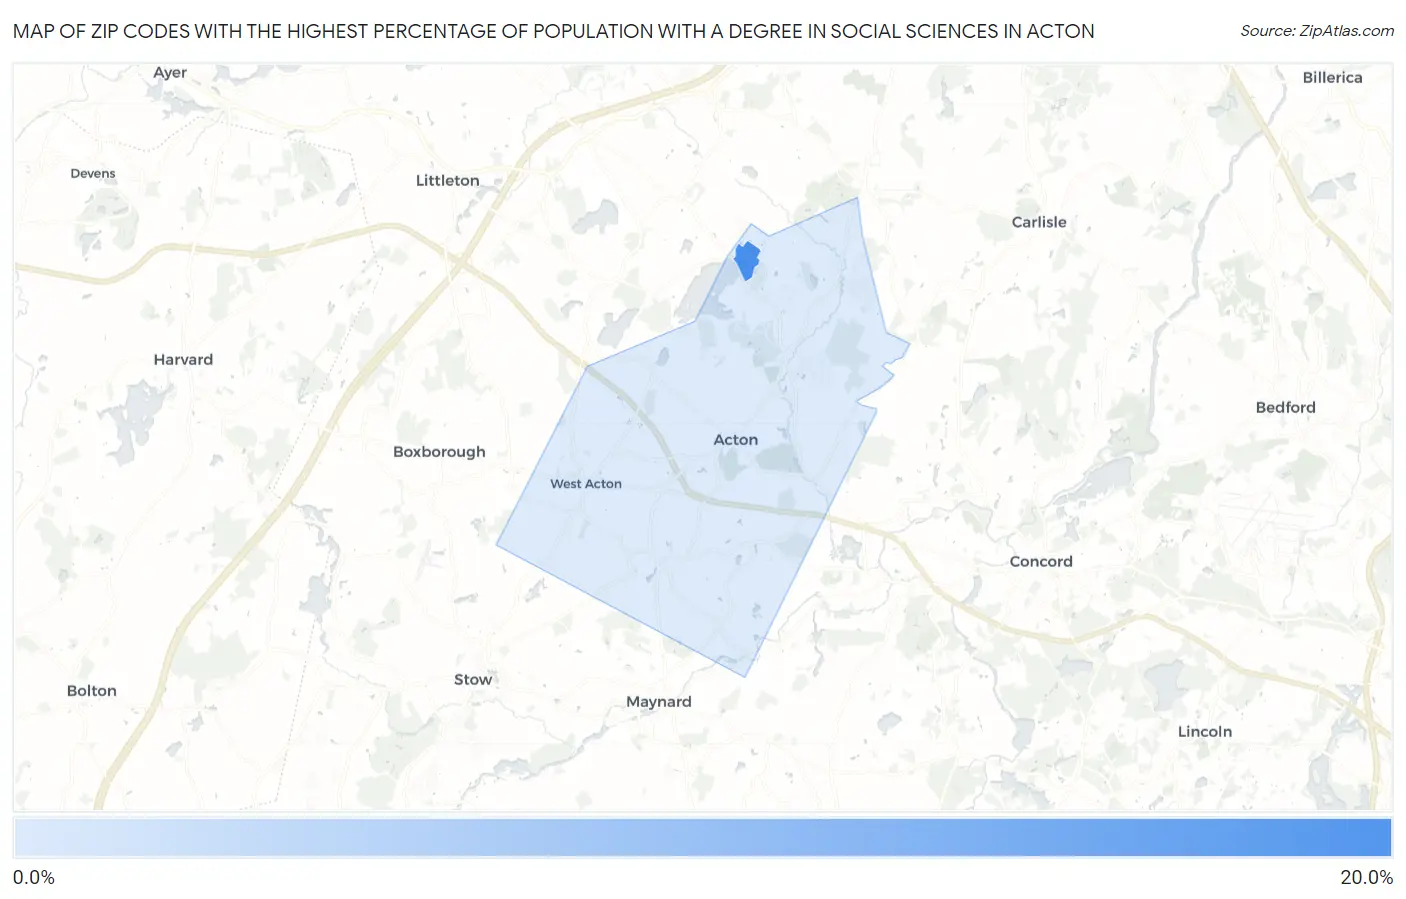
Zip Codes with the Highest Percentage of Population with a Degree in Social Sciences in Acton, MA
| Zip Code | % Graduates | vs State | vs National | |
| 1. | 01718 | 17.7% | 10.2%(+7.47)#35 | 8.1%(+9.61)#1,295 |
| 2. | 01720 | 8.5% | 10.2%(-1.75)#303 | 8.1%(+0.392)#7,882 |
1
Common Questions
What are the Top Zip Codes with the Highest Percentage of Population with a Degree in Social Sciences in Acton, MA?
Top Zip Codes with the Highest Percentage of Population with a Degree in Social Sciences in Acton, MA are:
What zip code has the Highest Percentage of Population with a Degree in Social Sciences in Acton, MA?
01718 has the Highest Percentage of Population with a Degree in Social Sciences in Acton, MA with 17.7%.
What is the Percentage of Population with a Degree in Social Sciences in Massachusetts?
Percentage of Population with a Degree in Social Sciences in Massachusetts is 10.2%.
What is the Percentage of Population with a Degree in Social Sciences in the United States?
Percentage of Population with a Degree in Social Sciences in the United States is 8.1%.