Cities with the Highest Percentage of Population Enrolled in University in South Carolina
RELATED REPORTS & OPTIONS
University
South Carolina
Compare Cities
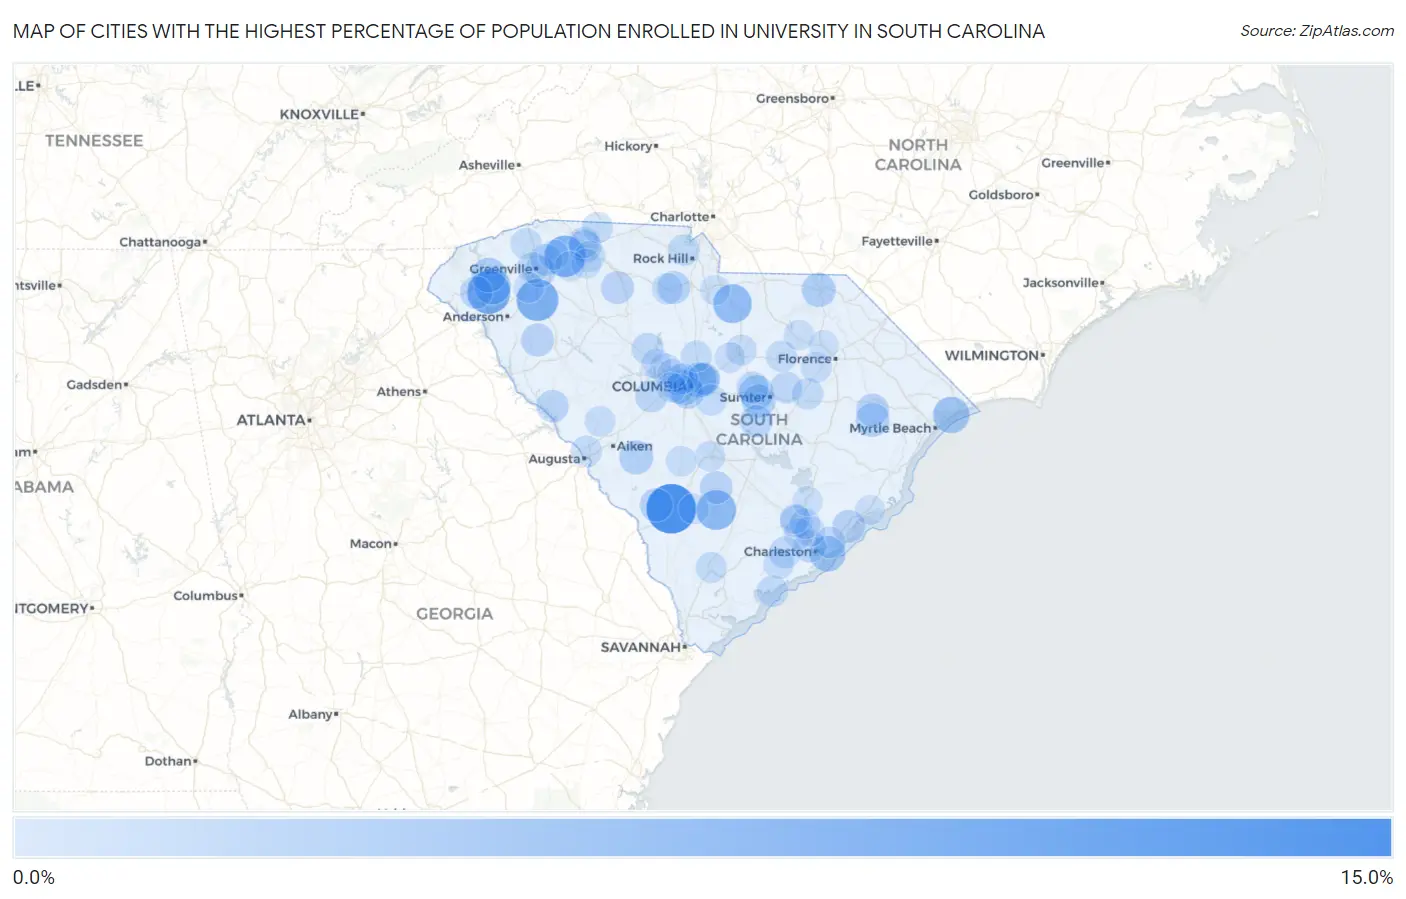
Map of Cities with the Highest Percentage of Population Enrolled in University in South Carolina
0.0%
15.0%
Cities with the Highest Percentage of Population Enrolled in University in South Carolina
| City | % in University | vs State | vs National | |
| 1. | Ulmer | 13.0% | 1.2%(+11.9)#1 | 1.4%(+11.6)#90 |
| 2. | Olympia | 9.6% | 1.2%(+8.45)#2 | 1.4%(+8.22)#170 |
| 3. | Clemson | 8.9% | 1.2%(+7.75)#3 | 1.4%(+7.51)#194 |
| 4. | Arthurtown | 8.8% | 1.2%(+7.61)#4 | 1.4%(+7.38)#200 |
| 5. | Ware Place | 8.3% | 1.2%(+7.16)#5 | 1.4%(+6.93)#215 |
| 6. | Drayton | 8.3% | 1.2%(+7.13)#6 | 1.4%(+6.90)#216 |
| 7. | Duncan | 7.9% | 1.2%(+6.73)#7 | 1.4%(+6.50)#242 |
| 8. | Floydale | 7.2% | 1.2%(+6.02)#8 | 1.4%(+5.79)#289 |
| 9. | Newtown | 7.0% | 1.2%(+5.85)#9 | 1.4%(+5.61)#304 |
| 10. | Smoaks | 6.9% | 1.2%(+5.72)#10 | 1.4%(+5.49)#311 |
| 11. | Heath Springs | 6.4% | 1.2%(+5.19)#11 | 1.4%(+4.96)#347 |
| 12. | Briarcliffe Acres | 5.0% | 1.2%(+3.85)#12 | 1.4%(+3.62)#533 |
| 13. | Central | 5.0% | 1.2%(+3.81)#13 | 1.4%(+3.58)#548 |
| 14. | Gillisonville | 4.7% | 1.2%(+3.53)#14 | 1.4%(+3.29)#614 |
| 15. | Sullivan S Island | 4.7% | 1.2%(+3.52)#15 | 1.4%(+3.29)#615 |
| 16. | North Santee | 4.5% | 1.2%(+3.29)#16 | 1.4%(+3.06)#690 |
| 17. | West Columbia | 4.3% | 1.2%(+3.13)#17 | 1.4%(+2.89)#740 |
| 18. | Forest Acres | 4.1% | 1.2%(+2.88)#18 | 1.4%(+2.65)#812 |
| 19. | Six Mile | 3.9% | 1.2%(+2.75)#19 | 1.4%(+2.52)#860 |
| 20. | Cherryvale | 3.9% | 1.2%(+2.70)#20 | 1.4%(+2.47)#881 |
| 21. | Hilltop | 3.8% | 1.2%(+2.58)#21 | 1.4%(+2.35)#937 |
| 22. | Cheraw | 3.6% | 1.2%(+2.43)#22 | 1.4%(+2.20)#1,033 |
| 23. | Windsor | 3.5% | 1.2%(+2.30)#23 | 1.4%(+2.06)#1,123 |
| 24. | Hemingway | 3.4% | 1.2%(+2.24)#24 | 1.4%(+2.01)#1,162 |
| 25. | Cane Savannah | 3.3% | 1.2%(+2.08)#25 | 1.4%(+1.85)#1,264 |
| 26. | Kline | 3.1% | 1.2%(+1.92)#26 | 1.4%(+1.68)#1,395 |
| 27. | Columbia | 3.1% | 1.2%(+1.89)#27 | 1.4%(+1.66)#1,419 |
| 28. | Eureka Mill | 3.0% | 1.2%(+1.80)#28 | 1.4%(+1.57)#1,499 |
| 29. | Due West | 3.0% | 1.2%(+1.78)#29 | 1.4%(+1.55)#1,518 |
| 30. | Buffalo | 2.9% | 1.2%(+1.76)#30 | 1.4%(+1.53)#1,546 |
| 31. | Branchville | 2.9% | 1.2%(+1.70)#31 | 1.4%(+1.47)#1,604 |
| 32. | Valley Falls | 2.9% | 1.2%(+1.70)#32 | 1.4%(+1.47)#1,607 |
| 33. | Awendaw | 2.8% | 1.2%(+1.65)#33 | 1.4%(+1.42)#1,646 |
| 34. | Johnsonville | 2.8% | 1.2%(+1.63)#34 | 1.4%(+1.40)#1,679 |
| 35. | Pinewood | 2.7% | 1.2%(+1.52)#35 | 1.4%(+1.29)#1,832 |
| 36. | Cayce | 2.6% | 1.2%(+1.47)#36 | 1.4%(+1.24)#1,896 |
| 37. | Utica | 2.6% | 1.2%(+1.46)#37 | 1.4%(+1.23)#1,912 |
| 38. | Plum Branch | 2.6% | 1.2%(+1.45)#38 | 1.4%(+1.22)#1,922 |
| 39. | Woodfield | 2.6% | 1.2%(+1.44)#39 | 1.4%(+1.21)#1,949 |
| 40. | Ben Avon | 2.6% | 1.2%(+1.39)#40 | 1.4%(+1.16)#2,020 |
| 41. | Ladson | 2.6% | 1.2%(+1.39)#41 | 1.4%(+1.15)#2,029 |
| 42. | Charleston | 2.5% | 1.2%(+1.31)#42 | 1.4%(+1.08)#2,149 |
| 43. | Gilbert | 2.4% | 1.2%(+1.23)#43 | 1.4%(+0.995)#2,296 |
| 44. | Greenville | 2.3% | 1.2%(+1.16)#44 | 1.4%(+0.929)#2,416 |
| 45. | Oakland | 2.3% | 1.2%(+1.15)#45 | 1.4%(+0.923)#2,425 |
| 46. | Ravenel | 2.3% | 1.2%(+1.14)#46 | 1.4%(+0.914)#2,446 |
| 47. | Taylors | 2.3% | 1.2%(+1.12)#47 | 1.4%(+0.893)#2,481 |
| 48. | Mayesville | 2.3% | 1.2%(+1.08)#48 | 1.4%(+0.848)#2,579 |
| 49. | Pomaria | 2.2% | 1.2%(+1.02)#49 | 1.4%(+0.790)#2,705 |
| 50. | Newport | 2.1% | 1.2%(+0.949)#50 | 1.4%(+0.718)#2,854 |
| 51. | Shiloh | 2.1% | 1.2%(+0.928)#51 | 1.4%(+0.697)#2,897 |
| 52. | Mount Pleasant | 2.1% | 1.2%(+0.928)#52 | 1.4%(+0.697)#2,899 |
| 53. | Seven Oaks | 2.1% | 1.2%(+0.927)#53 | 1.4%(+0.696)#2,902 |
| 54. | Edisto Beach | 2.0% | 1.2%(+0.859)#54 | 1.4%(+0.628)#3,081 |
| 55. | Daviston | 2.0% | 1.2%(+0.856)#55 | 1.4%(+0.625)#3,095 |
| 56. | Gayle Mill | 2.0% | 1.2%(+0.806)#56 | 1.4%(+0.575)#3,246 |
| 57. | Blythewood | 2.0% | 1.2%(+0.797)#57 | 1.4%(+0.566)#3,282 |
| 58. | North Augusta | 2.0% | 1.2%(+0.784)#58 | 1.4%(+0.553)#3,316 |
| 59. | Boiling Springs | 1.9% | 1.2%(+0.771)#59 | 1.4%(+0.541)#3,378 |
| 60. | Hopkins | 1.9% | 1.2%(+0.768)#60 | 1.4%(+0.537)#3,388 |
| 61. | Slater Marietta | 1.9% | 1.2%(+0.765)#61 | 1.4%(+0.534)#3,392 |
| 62. | Bishopville | 1.9% | 1.2%(+0.752)#62 | 1.4%(+0.521)#3,435 |
| 63. | Chesnee | 1.9% | 1.2%(+0.733)#63 | 1.4%(+0.502)#3,505 |
| 64. | Yemassee | 1.9% | 1.2%(+0.692)#64 | 1.4%(+0.461)#3,653 |
| 65. | City View | 1.8% | 1.2%(+0.641)#65 | 1.4%(+0.410)#3,833 |
| 66. | Lake Murray Of Richland | 1.8% | 1.2%(+0.621)#66 | 1.4%(+0.390)#3,921 |
| 67. | Camden | 1.7% | 1.2%(+0.563)#67 | 1.4%(+0.332)#4,140 |
| 68. | Spartanburg | 1.7% | 1.2%(+0.553)#68 | 1.4%(+0.322)#4,172 |
| 69. | Seabrook | 1.7% | 1.2%(+0.512)#69 | 1.4%(+0.281)#4,332 |
| 70. | Timmonsville | 1.7% | 1.2%(+0.509)#70 | 1.4%(+0.279)#4,342 |
| 71. | Hanahan | 1.7% | 1.2%(+0.481)#71 | 1.4%(+0.250)#4,470 |
| 72. | Orangeburg | 1.6% | 1.2%(+0.447)#72 | 1.4%(+0.216)#4,617 |
| 73. | Norway | 1.6% | 1.2%(+0.441)#73 | 1.4%(+0.210)#4,640 |
| 74. | Trenton | 1.6% | 1.2%(+0.441)#74 | 1.4%(+0.210)#4,641 |
| 75. | Meggett | 1.6% | 1.2%(+0.428)#75 | 1.4%(+0.198)#4,692 |
| 76. | St Andrews | 1.6% | 1.2%(+0.418)#76 | 1.4%(+0.187)#4,738 |
| 77. | Pimlico | 1.6% | 1.2%(+0.416)#77 | 1.4%(+0.185)#4,743 |
| 78. | Piedmont | 1.6% | 1.2%(+0.397)#78 | 1.4%(+0.166)#4,829 |
| 79. | Ehrhardt | 1.6% | 1.2%(+0.385)#79 | 1.4%(+0.155)#4,885 |
| 80. | Elliott | 1.6% | 1.2%(+0.373)#80 | 1.4%(+0.142)#4,945 |
| 81. | Sandy Springs | 1.5% | 1.2%(+0.335)#81 | 1.4%(+0.104)#5,144 |
| 82. | Lugoff | 1.5% | 1.2%(+0.305)#82 | 1.4%(+0.074)#5,312 |
| 83. | North Charleston | 1.5% | 1.2%(+0.304)#83 | 1.4%(+0.073)#5,318 |
| 84. | Goose Creek | 1.5% | 1.2%(+0.294)#84 | 1.4%(+0.063)#5,374 |
| 85. | Chapin | 1.5% | 1.2%(+0.293)#85 | 1.4%(+0.062)#5,381 |
| 86. | Helena | 1.4% | 1.2%(+0.269)#86 | 1.4%(+0.038)#5,514 |
| 87. | Capitol View | 1.4% | 1.2%(+0.248)#87 | 1.4%(+0.017)#5,639 |
| 88. | Hartsville | 1.4% | 1.2%(+0.246)#88 | 1.4%(+0.015)#5,645 |
| 89. | Camp Croft | 1.4% | 1.2%(+0.204)#89 | 1.4%(-0.027)#5,900 |
| 90. | Oak Grove | 1.4% | 1.2%(+0.183)#90 | 1.4%(-0.048)#6,018 |
| 91. | Greer | 1.4% | 1.2%(+0.178)#91 | 1.4%(-0.053)#6,047 |
| 92. | Irmo | 1.3% | 1.2%(+0.162)#92 | 1.4%(-0.069)#6,148 |
| 93. | Roebuck | 1.3% | 1.2%(+0.156)#93 | 1.4%(-0.075)#6,196 |
| 94. | Lexington | 1.3% | 1.2%(+0.154)#94 | 1.4%(-0.077)#6,207 |
| 95. | Reidville | 1.3% | 1.2%(+0.148)#95 | 1.4%(-0.083)#6,250 |
| 96. | Darlington | 1.3% | 1.2%(+0.145)#96 | 1.4%(-0.086)#6,270 |
| 97. | Sangaree | 1.3% | 1.2%(+0.138)#97 | 1.4%(-0.092)#6,320 |
| 98. | Mcclellanville | 1.3% | 1.2%(+0.137)#98 | 1.4%(-0.094)#6,330 |
| 99. | Moncks Corner | 1.3% | 1.2%(+0.136)#99 | 1.4%(-0.095)#6,339 |
| 100. | Irwin | 1.3% | 1.2%(+0.135)#100 | 1.4%(-0.096)#6,344 |
Common Questions
What are the Top 10 Cities with the Highest Percentage of Population Enrolled in University in South Carolina?
Top 10 Cities with the Highest Percentage of Population Enrolled in University in South Carolina are:
#1
13.0%
#2
8.9%
#3
8.3%
#4
7.9%
#5
6.9%
#6
6.4%
#7
5.0%
#8
5.0%
#9
4.7%
#10
4.3%
What city has the Highest Percentage of Population Enrolled in University in South Carolina?
Ulmer has the Highest Percentage of Population Enrolled in University in South Carolina with 13.0%.
What is the Percentage of Population Enrolled in University in the State of South Carolina?
Percentage of Population Enrolled in University in South Carolina is 1.2%.
What is the Percentage of Population Enrolled in University in the United States?
Percentage of Population Enrolled in University in the United States is 1.4%.