Cities with the Highest Inequality / Gini Index in Kentucky
RELATED REPORTS & OPTIONS
Highest Inequality / Gini Index
Kentucky
Compare Cities
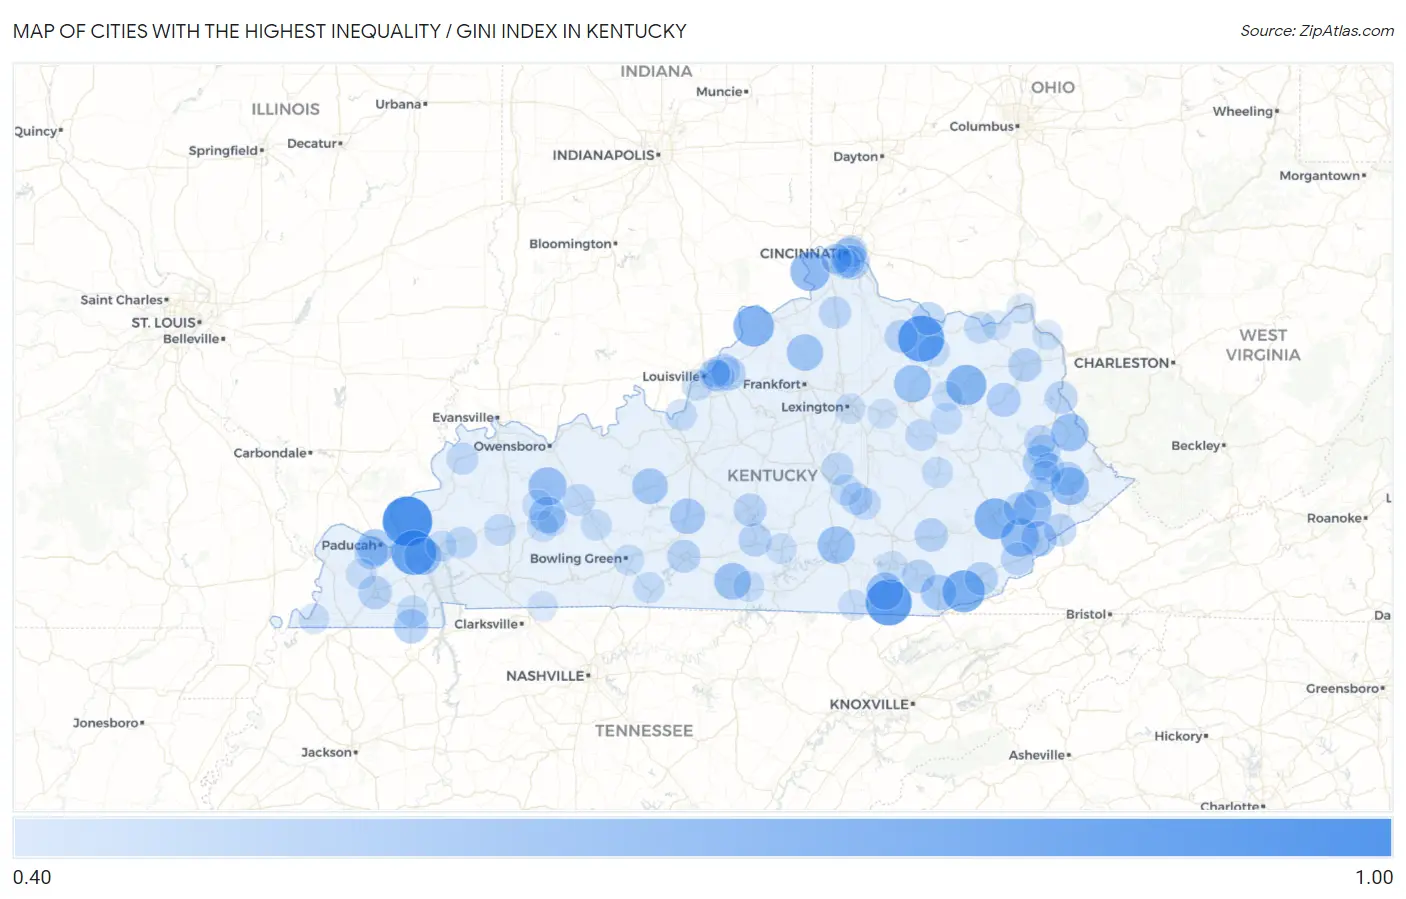
Map of Cities with the Highest Inequality / Gini Index in Kentucky
0.00
1.00
Cities with the Highest Inequality / Gini Index in Kentucky
| City | Inequality / Gini Index | vs State | vs National | |
| 1. | Burna | 0.80 | 0.48(+0.325)#1 | 0.48(+0.319)#7 |
| 2. | Mays Lick | 0.74 | 0.48(+0.264)#2 | 0.48(+0.258)#28 |
| 3. | Pleasant View | 0.74 | 0.48(+0.264)#3 | 0.48(+0.257)#29 |
| 4. | Gilbertsville | 0.72 | 0.48(+0.244)#4 | 0.48(+0.238)#47 |
| 5. | Pathfork | 0.68 | 0.48(+0.201)#5 | 0.48(+0.195)#98 |
| 6. | Hazard | 0.66 | 0.48(+0.180)#6 | 0.48(+0.174)#143 |
| 7. | Bedford | 0.65 | 0.48(+0.176)#7 | 0.48(+0.170)#155 |
| 8. | Morehead | 0.65 | 0.48(+0.171)#8 | 0.48(+0.164)#170 |
| 9. | Belleview | 0.63 | 0.48(+0.156)#9 | 0.48(+0.150)#213 |
| 10. | Van Lear | 0.61 | 0.48(+0.137)#10 | 0.48(+0.131)#309 |
| 11. | Blackey | 0.61 | 0.48(+0.137)#11 | 0.48(+0.131)#310 |
| 12. | Pippa Passes | 0.61 | 0.48(+0.135)#12 | 0.48(+0.129)#322 |
| 13. | Livermore | 0.61 | 0.48(+0.132)#13 | 0.48(+0.126)#348 |
| 14. | Pikeville | 0.61 | 0.48(+0.131)#14 | 0.48(+0.125)#359 |
| 15. | Inez | 0.60 | 0.48(+0.125)#15 | 0.48(+0.119)#399 |
| 16. | Sharpsburg | 0.60 | 0.48(+0.121)#16 | 0.48(+0.115)#441 |
| 17. | Somerset | 0.60 | 0.48(+0.120)#17 | 0.48(+0.114)#448 |
| 18. | Grand Rivers | 0.60 | 0.48(+0.120)#18 | 0.48(+0.113)#454 |
| 19. | Williamsburg | 0.60 | 0.48(+0.119)#19 | 0.48(+0.113)#458 |
| 20. | Marrowbone | 0.59 | 0.48(+0.112)#20 | 0.48(+0.106)#527 |
| 21. | Paducah | 0.59 | 0.48(+0.109)#21 | 0.48(+0.103)#557 |
| 22. | Central City | 0.58 | 0.48(+0.107)#22 | 0.48(+0.101)#573 |
| 23. | Monterey | 0.58 | 0.48(+0.106)#23 | 0.48(+0.100)#586 |
| 24. | Clarkson | 0.57 | 0.48(+0.096)#24 | 0.48(+0.090)#725 |
| 25. | Whitesburg | 0.57 | 0.48(+0.093)#25 | 0.48(+0.087)#768 |
| 26. | Pineville | 0.57 | 0.48(+0.093)#26 | 0.48(+0.087)#769 |
| 27. | Munfordville | 0.57 | 0.48(+0.091)#27 | 0.48(+0.085)#796 |
| 28. | Prestonsburg | 0.55 | 0.48(+0.078)#28 | 0.48(+0.072)#1,028 |
| 29. | Newport | 0.55 | 0.48(+0.073)#29 | 0.48(+0.067)#1,137 |
| 30. | Hazel | 0.55 | 0.48(+0.072)#30 | 0.48(+0.066)#1,160 |
| 31. | Highland Heights | 0.55 | 0.48(+0.069)#31 | 0.48(+0.063)#1,234 |
| 32. | Sandy Hook | 0.54 | 0.48(+0.068)#32 | 0.48(+0.062)#1,278 |
| 33. | Coal Run Village | 0.54 | 0.48(+0.065)#33 | 0.48(+0.059)#1,346 |
| 34. | Anchorage | 0.54 | 0.48(+0.062)#34 | 0.48(+0.056)#1,435 |
| 35. | Grayson | 0.54 | 0.48(+0.060)#35 | 0.48(+0.054)#1,465 |
| 36. | Maysville | 0.54 | 0.48(+0.059)#36 | 0.48(+0.053)#1,502 |
| 37. | Barbourville | 0.54 | 0.48(+0.059)#37 | 0.48(+0.053)#1,508 |
| 38. | Manchester | 0.54 | 0.48(+0.059)#38 | 0.48(+0.053)#1,511 |
| 39. | Mayfield | 0.54 | 0.48(+0.059)#39 | 0.48(+0.053)#1,515 |
| 40. | Harlan | 0.53 | 0.48(+0.057)#40 | 0.48(+0.051)#1,572 |
| 41. | Massac | 0.53 | 0.48(+0.056)#41 | 0.48(+0.050)#1,591 |
| 42. | Mount Olivet | 0.53 | 0.48(+0.055)#42 | 0.48(+0.049)#1,616 |
| 43. | Auxier | 0.53 | 0.48(+0.055)#43 | 0.48(+0.049)#1,629 |
| 44. | Glasgow | 0.53 | 0.48(+0.054)#44 | 0.48(+0.048)#1,639 |
| 45. | Columbia | 0.53 | 0.48(+0.054)#45 | 0.48(+0.048)#1,673 |
| 46. | Campbellsville | 0.53 | 0.48(+0.052)#46 | 0.48(+0.046)#1,740 |
| 47. | Hindman | 0.53 | 0.48(+0.050)#47 | 0.48(+0.044)#1,796 |
| 48. | Cumberland | 0.53 | 0.48(+0.050)#48 | 0.48(+0.044)#1,798 |
| 49. | Louisa | 0.53 | 0.48(+0.049)#49 | 0.48(+0.043)#1,850 |
| 50. | Ten Broeck | 0.53 | 0.48(+0.048)#50 | 0.48(+0.042)#1,886 |
| 51. | Jenkins | 0.52 | 0.48(+0.045)#51 | 0.48(+0.039)#1,993 |
| 52. | Wilder | 0.52 | 0.48(+0.042)#52 | 0.48(+0.036)#2,144 |
| 53. | Dry Ridge | 0.52 | 0.48(+0.040)#53 | 0.48(+0.034)#2,202 |
| 54. | Beaver Dam | 0.52 | 0.48(+0.040)#54 | 0.48(+0.034)#2,230 |
| 55. | Lancaster | 0.52 | 0.48(+0.040)#55 | 0.48(+0.033)#2,245 |
| 56. | Brodhead | 0.51 | 0.48(+0.038)#56 | 0.48(+0.032)#2,334 |
| 57. | Paintsville | 0.51 | 0.48(+0.035)#57 | 0.48(+0.029)#2,449 |
| 58. | Beechwood Village | 0.51 | 0.48(+0.035)#58 | 0.48(+0.029)#2,457 |
| 59. | Dayton | 0.51 | 0.48(+0.035)#59 | 0.48(+0.029)#2,466 |
| 60. | Mount Vernon | 0.51 | 0.48(+0.034)#60 | 0.48(+0.028)#2,498 |
| 61. | Stanton | 0.51 | 0.48(+0.033)#61 | 0.48(+0.027)#2,534 |
| 62. | Allen | 0.51 | 0.48(+0.033)#62 | 0.48(+0.027)#2,546 |
| 63. | Morganfield | 0.51 | 0.48(+0.032)#63 | 0.48(+0.026)#2,590 |
| 64. | Princeton | 0.51 | 0.48(+0.032)#64 | 0.48(+0.026)#2,601 |
| 65. | Vanceburg | 0.51 | 0.48(+0.032)#65 | 0.48(+0.026)#2,603 |
| 66. | St Charles | 0.51 | 0.48(+0.030)#66 | 0.48(+0.024)#2,688 |
| 67. | Brownsboro Village | 0.51 | 0.48(+0.029)#67 | 0.48(+0.023)#2,750 |
| 68. | Murray | 0.51 | 0.48(+0.028)#68 | 0.48(+0.022)#2,816 |
| 69. | Greenville | 0.50 | 0.48(+0.027)#69 | 0.48(+0.021)#2,866 |
| 70. | Flemingsburg | 0.50 | 0.48(+0.026)#70 | 0.48(+0.020)#2,960 |
| 71. | West Point | 0.50 | 0.48(+0.025)#71 | 0.48(+0.019)#2,972 |
| 72. | Frenchburg | 0.50 | 0.48(+0.025)#72 | 0.48(+0.019)#2,977 |
| 73. | Martin | 0.50 | 0.48(+0.025)#73 | 0.48(+0.019)#2,985 |
| 74. | Scottsville | 0.50 | 0.48(+0.025)#74 | 0.48(+0.018)#3,013 |
| 75. | Crab Orchard | 0.50 | 0.48(+0.024)#75 | 0.48(+0.018)#3,053 |
| 76. | Morgantown | 0.50 | 0.48(+0.022)#76 | 0.48(+0.016)#3,141 |
| 77. | Crescent Springs | 0.50 | 0.48(+0.022)#77 | 0.48(+0.016)#3,182 |
| 78. | Beattyville | 0.50 | 0.48(+0.022)#78 | 0.48(+0.016)#3,183 |
| 79. | Burkesville | 0.50 | 0.48(+0.022)#79 | 0.48(+0.015)#3,191 |
| 80. | Eddyville | 0.50 | 0.48(+0.021)#80 | 0.48(+0.015)#3,204 |
| 81. | Shively | 0.50 | 0.48(+0.021)#81 | 0.48(+0.015)#3,224 |
| 82. | Bowling Green | 0.50 | 0.48(+0.021)#82 | 0.48(+0.014)#3,240 |
| 83. | Wayland | 0.50 | 0.48(+0.019)#83 | 0.48(+0.013)#3,340 |
| 84. | Russell Springs | 0.49 | 0.48(+0.018)#84 | 0.48(+0.012)#3,421 |
| 85. | Lowes | 0.49 | 0.48(+0.018)#85 | 0.48(+0.012)#3,429 |
| 86. | Pine Knot | 0.49 | 0.48(+0.017)#86 | 0.48(+0.011)#3,462 |
| 87. | Bremen | 0.49 | 0.48(+0.017)#87 | 0.48(+0.011)#3,482 |
| 88. | Corbin | 0.49 | 0.48(+0.016)#88 | 0.48(+0.010)#3,558 |
| 89. | Salt Lick | 0.49 | 0.48(+0.013)#89 | 0.48(+0.007)#3,717 |
| 90. | Lexington | 0.49 | 0.48(+0.013)#90 | 0.48(+0.007)#3,718 |
| 91. | Covington | 0.49 | 0.48(+0.012)#91 | 0.48(+0.006)#3,825 |
| 92. | Hickman | 0.49 | 0.48(+0.011)#92 | 0.48(+0.005)#3,873 |
| 93. | Villa Hills | 0.49 | 0.48(+0.010)#93 | 0.48(+0.004)#3,960 |
| 94. | Raceland | 0.49 | 0.48(+0.010)#94 | 0.48(+0.004)#4,005 |
| 95. | Indian Hills | 0.49 | 0.48(+0.009)#95 | 0.48(+0.003)#4,070 |
| 96. | Guthrie | 0.48 | 0.48(+0.008)#96 | 0.48(+0.001)#4,199 |
| 97. | South Shore | 0.48 | 0.48(+0.007)#97 | 0.48(+0.001)#4,244 |
| 98. | Cleaton | 0.48 | 0.48(+0.007)#98 | 0.48(+0.001)#4,250 |
| 99. | Winchester | 0.48 | 0.48(+0.006)#99 | 0.48(-0.000)#4,331 |
| 100. | Garrison | 0.48 | 0.48(+0.005)#100 | 0.48(-0.001)#4,417 |
Common Questions
What are the Top 10 Cities with the Highest Inequality / Gini Index in Kentucky?
Top 10 Cities with the Highest Inequality / Gini Index in Kentucky are:
#1
0.80
#2
0.74
#3
0.74
#4
0.72
#5
0.68
#6
0.66
#7
0.65
#8
0.65
#9
0.63
#10
0.61
What city has the Highest Inequality / Gini Index in Kentucky?
Burna has the Highest Inequality / Gini Index in Kentucky with 0.80.
What is the Inequality / Gini Index in the State of Kentucky?
Inequality / Gini Index in Kentucky is 0.48.
What is the Inequality / Gini Index in the United States?
Inequality / Gini Index in the United States is 0.48.