Cities with the Highest Inequality / Gini Index in Delaware
RELATED REPORTS & OPTIONS
Highest Inequality / Gini Index
Delaware
Compare Cities
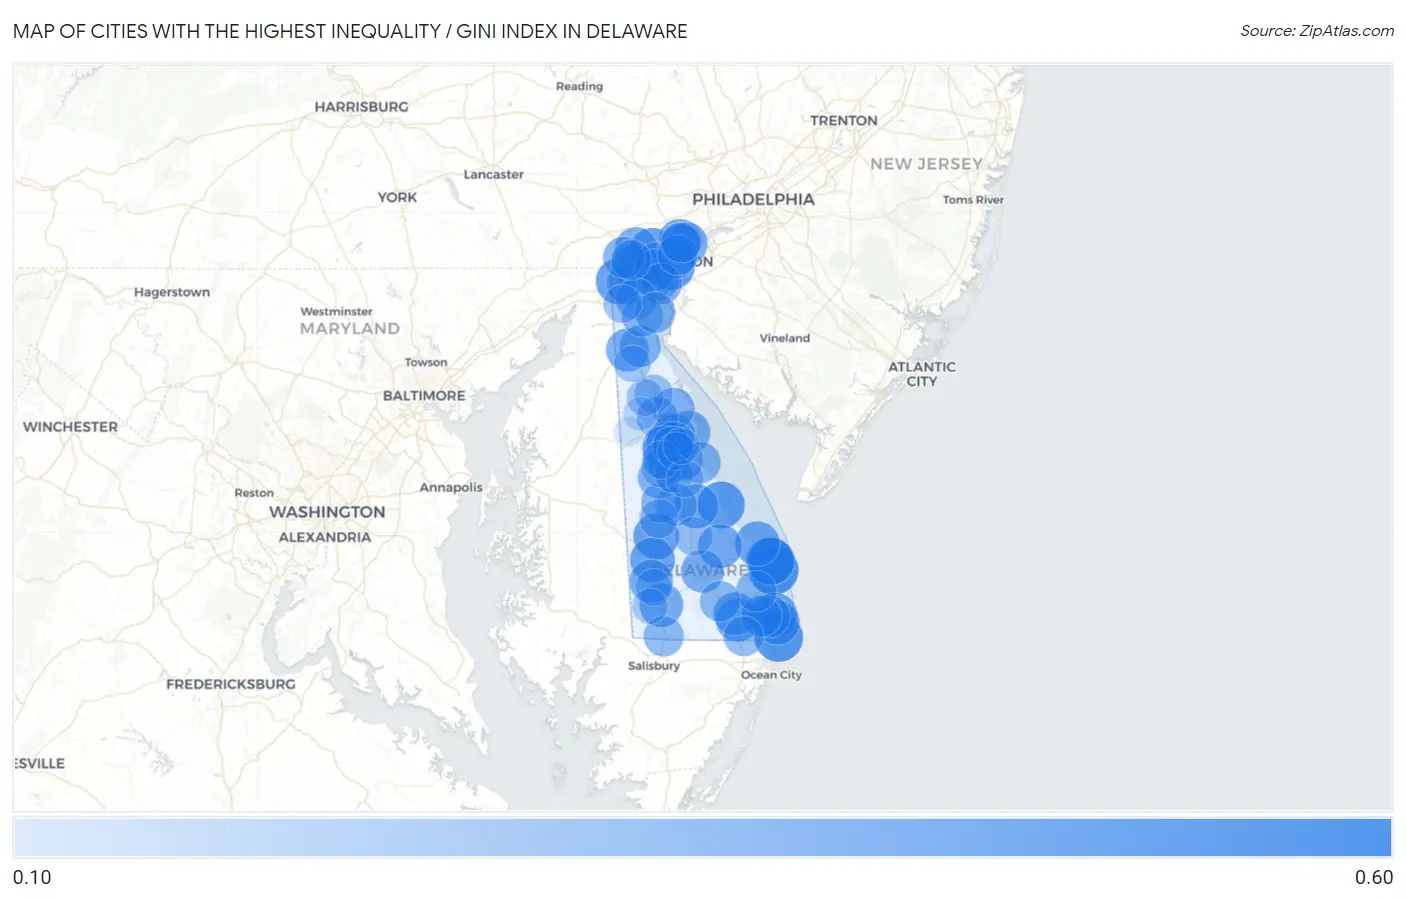
Map of Cities with the Highest Inequality / Gini Index in Delaware
0.00
0.60
Cities with the Highest Inequality / Gini Index in Delaware
| City | Inequality / Gini Index | vs State | vs National | |
| 1. | Dewey Beach | 0.56 | 0.45(+0.106)#1 | 0.48(+0.074)#994 |
| 2. | Fenwick Island | 0.54 | 0.45(+0.088)#2 | 0.48(+0.056)#1,436 |
| 3. | Rehoboth Beach | 0.52 | 0.45(+0.068)#3 | 0.48(+0.036)#2,127 |
| 4. | Wilmington | 0.51 | 0.45(+0.059)#4 | 0.48(+0.027)#2,532 |
| 5. | Slaughter Beach | 0.51 | 0.45(+0.055)#5 | 0.48(+0.023)#2,749 |
| 6. | Henlopen Acres | 0.51 | 0.45(+0.055)#6 | 0.48(+0.023)#2,752 |
| 7. | Greenville | 0.49 | 0.45(+0.044)#7 | 0.48(+0.012)#3,411 |
| 8. | Newark | 0.48 | 0.45(+0.032)#8 | 0.48(+0.000)#4,288 |
| 9. | Greenwood | 0.48 | 0.45(+0.029)#9 | 0.48(-0.004)#4,636 |
| 10. | Bridgeville | 0.46 | 0.45(+0.014)#10 | 0.48(-0.019)#6,114 |
| 11. | Lewes | 0.46 | 0.45(+0.008)#11 | 0.48(-0.024)#6,727 |
| 12. | Bethany Beach | 0.46 | 0.45(+0.005)#12 | 0.48(-0.027)#7,075 |
| 13. | South Bethany | 0.45 | 0.45(+0.003)#13 | 0.48(-0.029)#7,390 |
| 14. | Milford | 0.45 | 0.45(-0.001)#14 | 0.48(-0.033)#7,838 |
| 15. | Arden | 0.45 | 0.45(-0.001)#15 | 0.48(-0.033)#7,934 |
| 16. | Milton | 0.45 | 0.45(-0.006)#16 | 0.48(-0.038)#8,498 |
| 17. | Laurel | 0.44 | 0.45(-0.008)#17 | 0.48(-0.040)#8,898 |
| 18. | Little Creek | 0.43 | 0.45(-0.016)#18 | 0.48(-0.048)#10,014 |
| 19. | Seaford | 0.43 | 0.45(-0.018)#19 | 0.48(-0.050)#10,270 |
| 20. | Frankford | 0.43 | 0.45(-0.018)#20 | 0.48(-0.050)#10,352 |
| 21. | Dover | 0.43 | 0.45(-0.025)#21 | 0.48(-0.057)#11,319 |
| 22. | Pike Creek Valley | 0.43 | 0.45(-0.025)#22 | 0.48(-0.057)#11,335 |
| 23. | Hockessin | 0.42 | 0.45(-0.026)#23 | 0.48(-0.058)#11,546 |
| 24. | Claymont | 0.42 | 0.45(-0.026)#24 | 0.48(-0.058)#11,548 |
| 25. | Elsmere | 0.42 | 0.45(-0.028)#25 | 0.48(-0.060)#11,797 |
| 26. | Middletown | 0.42 | 0.45(-0.028)#26 | 0.48(-0.060)#11,830 |
| 27. | Dagsboro | 0.42 | 0.45(-0.029)#27 | 0.48(-0.061)#12,106 |
| 28. | Georgetown | 0.42 | 0.45(-0.029)#28 | 0.48(-0.062)#12,120 |
| 29. | Ocean View | 0.42 | 0.45(-0.033)#29 | 0.48(-0.065)#12,681 |
| 30. | Lincoln | 0.41 | 0.45(-0.036)#30 | 0.48(-0.069)#13,268 |
| 31. | Woodside East | 0.41 | 0.45(-0.036)#31 | 0.48(-0.069)#13,280 |
| 32. | Brookside | 0.41 | 0.45(-0.038)#32 | 0.48(-0.070)#13,565 |
| 33. | Wilmington Manor | 0.41 | 0.45(-0.040)#33 | 0.48(-0.072)#13,809 |
| 34. | Edgemoor | 0.40 | 0.45(-0.046)#34 | 0.48(-0.079)#15,023 |
| 35. | Camden | 0.40 | 0.45(-0.049)#35 | 0.48(-0.081)#15,528 |
| 36. | Leipsic | 0.40 | 0.45(-0.050)#36 | 0.48(-0.082)#15,695 |
| 37. | Rodney Village | 0.40 | 0.45(-0.051)#37 | 0.48(-0.084)#15,915 |
| 38. | Odessa | 0.40 | 0.45(-0.052)#38 | 0.48(-0.084)#16,077 |
| 39. | Newport | 0.40 | 0.45(-0.053)#39 | 0.48(-0.086)#16,264 |
| 40. | Felton | 0.40 | 0.45(-0.055)#40 | 0.48(-0.087)#16,498 |
| 41. | Bowers | 0.40 | 0.45(-0.055)#41 | 0.48(-0.088)#16,603 |
| 42. | Cheswold | 0.39 | 0.45(-0.057)#42 | 0.48(-0.089)#16,848 |
| 43. | Magnolia | 0.39 | 0.45(-0.057)#43 | 0.48(-0.089)#16,876 |
| 44. | Kent Acres | 0.39 | 0.45(-0.057)#44 | 0.48(-0.089)#16,883 |
| 45. | Houston | 0.39 | 0.45(-0.059)#45 | 0.48(-0.091)#17,196 |
| 46. | North Star | 0.39 | 0.45(-0.059)#46 | 0.48(-0.091)#17,231 |
| 47. | New Castle | 0.39 | 0.45(-0.059)#47 | 0.48(-0.092)#17,270 |
| 48. | Bear | 0.38 | 0.45(-0.067)#48 | 0.48(-0.099)#18,475 |
| 49. | St Georges | 0.38 | 0.45(-0.068)#49 | 0.48(-0.100)#18,710 |
| 50. | Millville | 0.38 | 0.45(-0.068)#50 | 0.48(-0.100)#18,751 |
| 51. | Long Neck | 0.38 | 0.45(-0.072)#51 | 0.48(-0.104)#19,394 |
| 52. | Delaware City | 0.38 | 0.45(-0.073)#52 | 0.48(-0.105)#19,458 |
| 53. | Ardencroft | 0.38 | 0.45(-0.074)#53 | 0.48(-0.106)#19,651 |
| 54. | Wyoming | 0.37 | 0.45(-0.076)#54 | 0.48(-0.108)#20,011 |
| 55. | Harrington | 0.37 | 0.45(-0.079)#55 | 0.48(-0.111)#20,424 |
| 56. | Millsboro | 0.37 | 0.45(-0.080)#56 | 0.48(-0.113)#20,710 |
| 57. | Bellefonte | 0.37 | 0.45(-0.082)#57 | 0.48(-0.114)#20,906 |
| 58. | Delmar | 0.37 | 0.45(-0.082)#58 | 0.48(-0.114)#20,978 |
| 59. | Pike Creek | 0.37 | 0.45(-0.084)#59 | 0.48(-0.116)#21,275 |
| 60. | Ardentown | 0.36 | 0.45(-0.087)#60 | 0.48(-0.119)#21,698 |
| 61. | Viola | 0.36 | 0.45(-0.087)#61 | 0.48(-0.119)#21,701 |
| 62. | Selbyville | 0.36 | 0.45(-0.089)#62 | 0.48(-0.121)#21,889 |
| 63. | Highland Acres | 0.36 | 0.45(-0.093)#63 | 0.48(-0.125)#22,446 |
| 64. | Farmington | 0.34 | 0.45(-0.107)#64 | 0.48(-0.139)#24,131 |
| 65. | Ellendale | 0.33 | 0.45(-0.117)#65 | 0.48(-0.149)#25,010 |
| 66. | Riverview | 0.33 | 0.45(-0.117)#66 | 0.48(-0.149)#25,014 |
| 67. | Smyrna | 0.33 | 0.45(-0.120)#67 | 0.48(-0.152)#25,324 |
| 68. | Woodside | 0.32 | 0.45(-0.127)#68 | 0.48(-0.159)#25,899 |
| 69. | Glasgow | 0.32 | 0.45(-0.128)#69 | 0.48(-0.160)#25,991 |
| 70. | Rising Sun Lebanon | 0.32 | 0.45(-0.134)#70 | 0.48(-0.167)#26,450 |
| 71. | Frederica | 0.31 | 0.45(-0.140)#71 | 0.48(-0.172)#26,787 |
| 72. | Clayton | 0.30 | 0.45(-0.147)#72 | 0.48(-0.179)#27,191 |
| 73. | Blades | 0.30 | 0.45(-0.148)#73 | 0.48(-0.180)#27,302 |
| 74. | Townsend | 0.29 | 0.45(-0.156)#74 | 0.48(-0.188)#27,657 |
| 75. | Dover Base Housing | 0.29 | 0.45(-0.162)#75 | 0.48(-0.195)#27,944 |
| 76. | Bethel | 0.28 | 0.45(-0.175)#76 | 0.48(-0.207)#28,447 |
| 77. | Kenton | 0.23 | 0.45(-0.218)#77 | 0.48(-0.250)#29,465 |
| 78. | Port Penn | 0.21 | 0.45(-0.241)#78 | 0.48(-0.274)#29,820 |
| 79. | Hartly | 0.17 | 0.45(-0.285)#79 | 0.48(-0.317)#30,283 |
1
Common Questions
What are the Top 10 Cities with the Highest Inequality / Gini Index in Delaware?
Top 10 Cities with the Highest Inequality / Gini Index in Delaware are:
#1
0.56
#2
0.54
#3
0.52
#4
0.51
#5
0.51
#6
0.51
#7
0.49
#8
0.48
#9
0.48
#10
0.46
What city has the Highest Inequality / Gini Index in Delaware?
Dewey Beach has the Highest Inequality / Gini Index in Delaware with 0.56.
What is the Inequality / Gini Index in the State of Delaware?
Inequality / Gini Index in Delaware is 0.45.
What is the Inequality / Gini Index in the United States?
Inequality / Gini Index in the United States is 0.48.