Middleburg borough, PA Map & Demographics
Middleburg borough Overview
$33,341
PER CAPITA INCOME
$73,125
AVG FAMILY INCOME
$56,339
AVG HOUSEHOLD INCOME
25.2%
WAGE / INCOME GAP [ % ]
74.8¢/ $1
WAGE / INCOME GAP [ $ ]
0.42
INEQUALITY / GINI INDEX
1,329
TOTAL POPULATION
685
MALE POPULATION
644
FEMALE POPULATION
106.37
MALES / 100 FEMALES
94.01
FEMALES / 100 MALES
39.1
MEDIAN AGE
3.4
AVG FAMILY SIZE
2.3
AVG HOUSEHOLD SIZE
719
LABOR FORCE [ PEOPLE ]
67.8%
PERCENT IN LABOR FORCE
2.6%
UNEMPLOYMENT RATE
Income in Middleburg borough
Income Overview in Middleburg borough
Per Capita Income in Middleburg borough is $33,341, while median incomes of families and households are $73,125 and $56,339 respectively.
| Characteristic | Number | Measure |
| Per Capita Income | 1,329 | $33,341 |
| Median Family Income | 273 | $73,125 |
| Mean Family Income | 273 | $88,348 |
| Median Household Income | 567 | $56,339 |
| Mean Household Income | 567 | $72,144 |
| Income Deficit | 273 | $0 |
| Wage / Income Gap (%) | 1,329 | 25.22% |
| Wage / Income Gap ($) | 1,329 | 74.78¢ per $1 |
| Gini / Inequality Index | 1,329 | 0.42 |
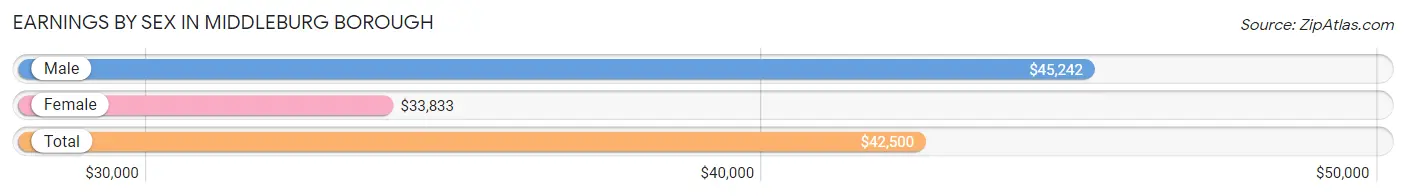
Earnings by Sex in Middleburg borough
Average Earnings in Middleburg borough are $42,500, $45,242 for men and $33,833 for women, a difference of 25.2%.
| Sex | Number | Average Earnings |
| Male | 436 (58.6%) | $45,242 |
| Female | 308 (41.4%) | $33,833 |
| Total | 744 (100.0%) | $42,500 |
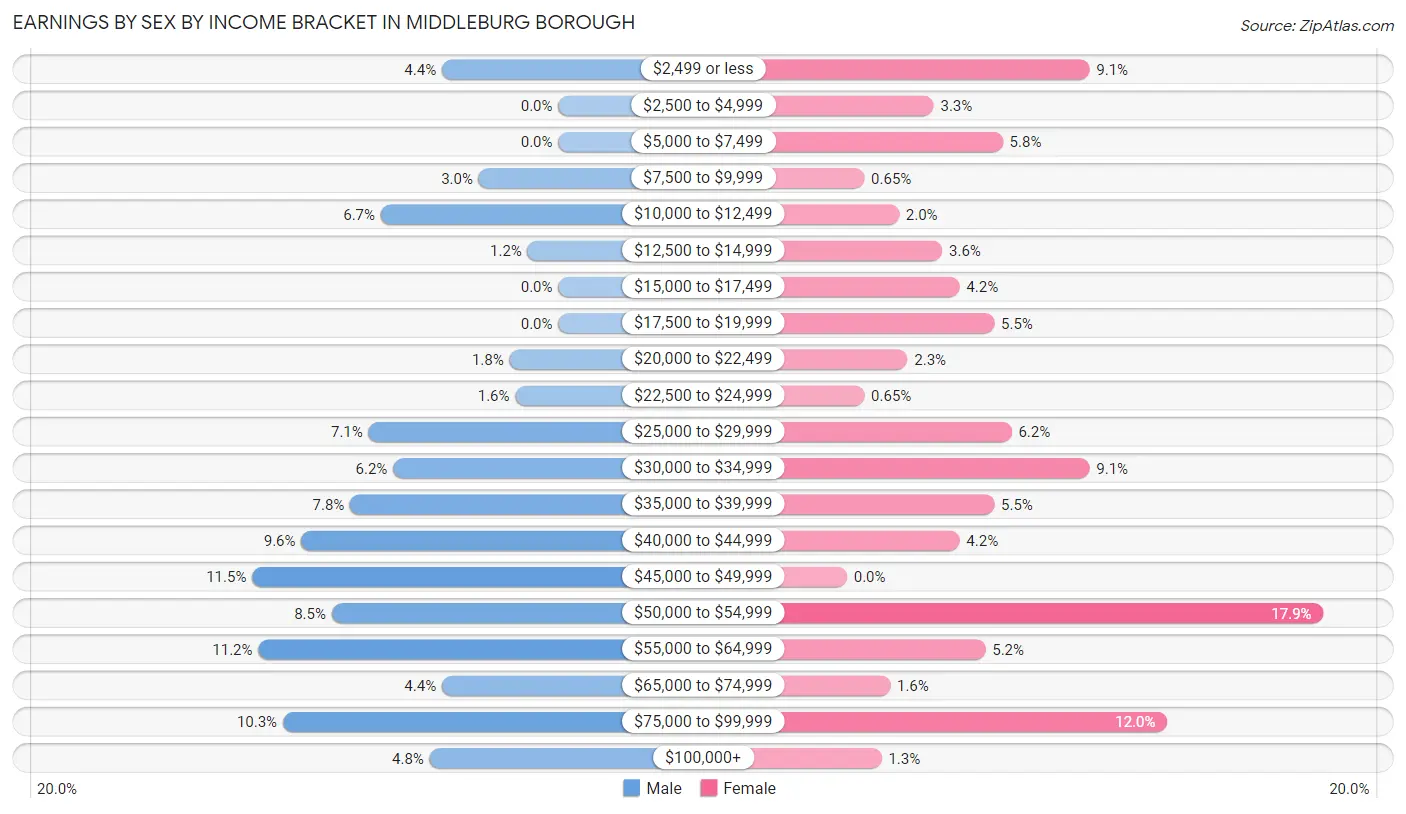
Earnings by Sex by Income Bracket in Middleburg borough
The most common earnings brackets in Middleburg borough are $45,000 to $49,999 for men (50 | 11.5%) and $50,000 to $54,999 for women (55 | 17.9%).
| Income | Male | Female |
| $2,499 or less | 19 (4.4%) | 28 (9.1%) |
| $2,500 to $4,999 | 0 (0.0%) | 10 (3.3%) |
| $5,000 to $7,499 | 0 (0.0%) | 18 (5.8%) |
| $7,500 to $9,999 | 13 (3.0%) | 2 (0.6%) |
| $10,000 to $12,499 | 29 (6.7%) | 6 (1.9%) |
| $12,500 to $14,999 | 5 (1.1%) | 11 (3.6%) |
| $15,000 to $17,499 | 0 (0.0%) | 13 (4.2%) |
| $17,500 to $19,999 | 0 (0.0%) | 17 (5.5%) |
| $20,000 to $22,499 | 8 (1.8%) | 7 (2.3%) |
| $22,500 to $24,999 | 7 (1.6%) | 2 (0.6%) |
| $25,000 to $29,999 | 31 (7.1%) | 19 (6.2%) |
| $30,000 to $34,999 | 27 (6.2%) | 28 (9.1%) |
| $35,000 to $39,999 | 34 (7.8%) | 17 (5.5%) |
| $40,000 to $44,999 | 42 (9.6%) | 13 (4.2%) |
| $45,000 to $49,999 | 50 (11.5%) | 0 (0.0%) |
| $50,000 to $54,999 | 37 (8.5%) | 55 (17.9%) |
| $55,000 to $64,999 | 49 (11.2%) | 16 (5.2%) |
| $65,000 to $74,999 | 19 (4.4%) | 5 (1.6%) |
| $75,000 to $99,999 | 45 (10.3%) | 37 (12.0%) |
| $100,000+ | 21 (4.8%) | 4 (1.3%) |
| Total | 436 (100.0%) | 308 (100.0%) |
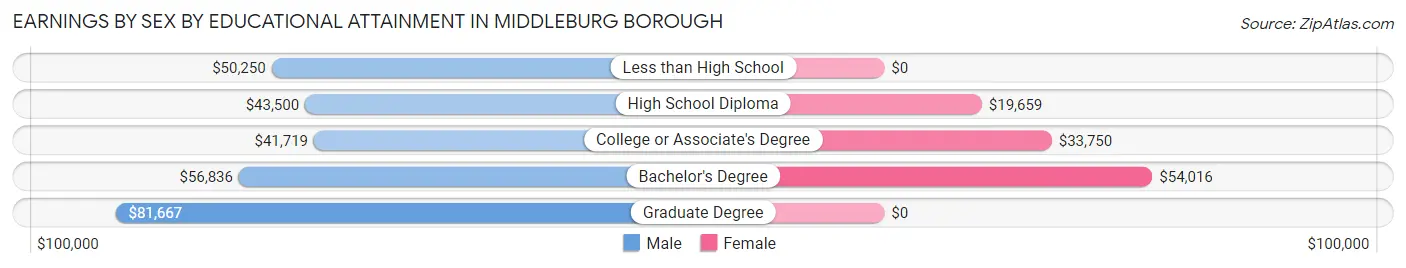
Earnings by Sex by Educational Attainment in Middleburg borough
Average earnings in Middleburg borough are $47,697 for men and $37,031 for women, a difference of 22.4%. Men with an educational attainment of graduate degree enjoy the highest average annual earnings of $81,667, while those with college or associate's degree education earn the least with $41,719. Women with an educational attainment of bachelor's degree earn the most with the average annual earnings of $54,016, while those with high school diploma education have the smallest earnings of $19,659.
| Educational Attainment | Male Income | Female Income |
| Less than High School | $50,250 | $0 |
| High School Diploma | $43,500 | $19,659 |
| College or Associate's Degree | $41,719 | $33,750 |
| Bachelor's Degree | $56,836 | $54,016 |
| Graduate Degree | $81,667 | $0 |
| Total | $47,697 | $37,031 |
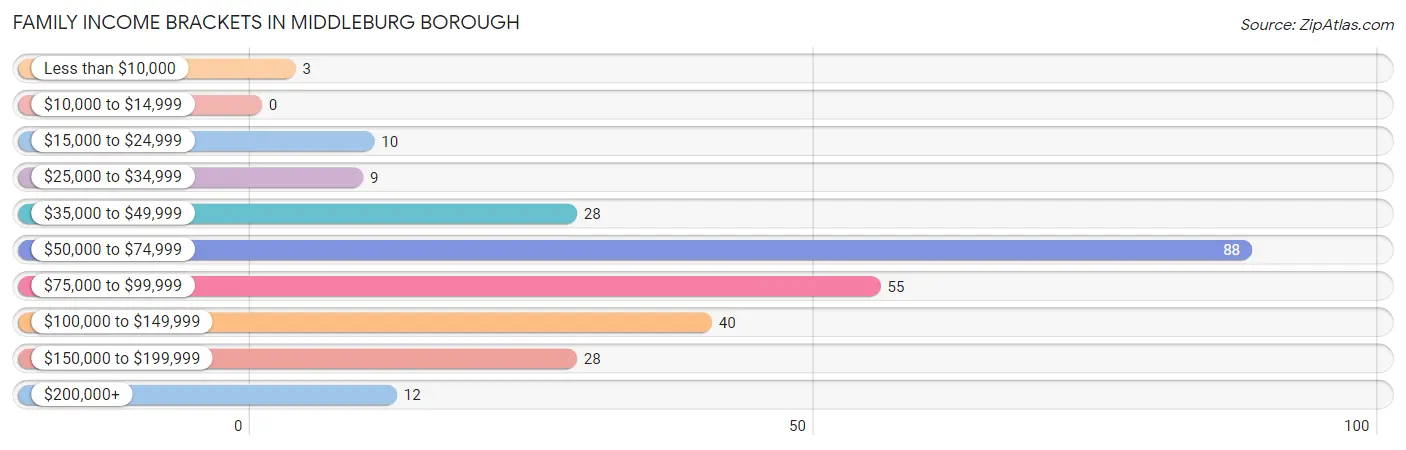
Family Income in Middleburg borough
Family Income Brackets in Middleburg borough
According to the Middleburg borough family income data, there are 88 families falling into the $50,000 to $74,999 income range, which is the most common income bracket and makes up 32.2% of all families.
| Income Bracket | # Families | % Families |
| Less than $10,000 | 3 | 1.1% |
| $10,000 to $14,999 | 0 | 0.0% |
| $15,000 to $24,999 | 10 | 3.7% |
| $25,000 to $34,999 | 9 | 3.3% |
| $35,000 to $49,999 | 28 | 10.3% |
| $50,000 to $74,999 | 88 | 32.2% |
| $75,000 to $99,999 | 55 | 20.1% |
| $100,000 to $149,999 | 40 | 14.7% |
| $150,000 to $199,999 | 28 | 10.3% |
| $200,000+ | 12 | 4.4% |
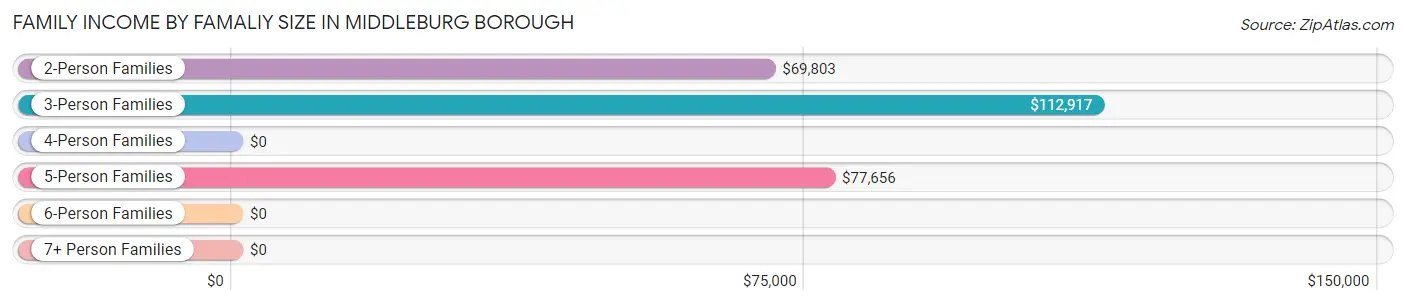
Family Income by Famaliy Size in Middleburg borough
3-person families (61 | 22.3%) account for the highest median family income in Middleburg borough with $112,917 per family, while 3-person families (61 | 22.3%) have the highest median income of $37,639 per family member.
| Income Bracket | # Families | Median Income |
| 2-Person Families | 129 (47.2%) | $69,803 |
| 3-Person Families | 61 (22.3%) | $112,917 |
| 4-Person Families | 29 (10.6%) | $0 |
| 5-Person Families | 37 (13.6%) | $77,656 |
| 6-Person Families | 12 (4.4%) | $0 |
| 7+ Person Families | 5 (1.8%) | $0 |
| Total | 273 (100.0%) | $73,125 |
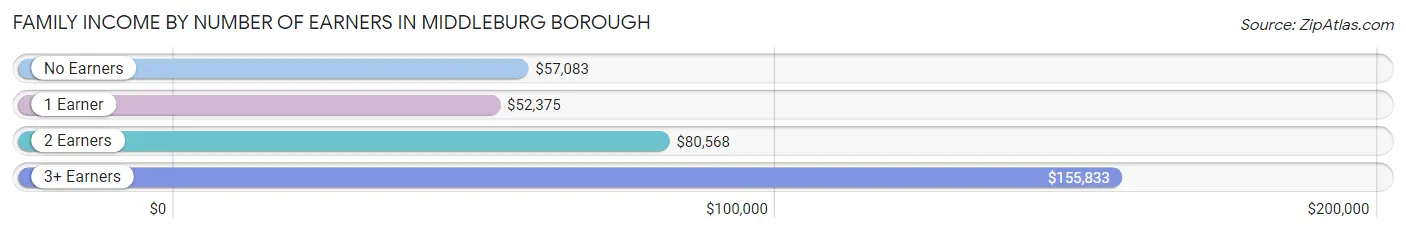
Family Income by Number of Earners in Middleburg borough
The median family income in Middleburg borough is $73,125, with families comprising 3+ earners (48) having the highest median family income of $155,833, while families with 1 earner (93) have the lowest median family income of $52,375, accounting for 17.6% and 34.1% of families, respectively.
| Number of Earners | # Families | Median Income |
| No Earners | 25 (9.2%) | $57,083 |
| 1 Earner | 93 (34.1%) | $52,375 |
| 2 Earners | 107 (39.2%) | $80,568 |
| 3+ Earners | 48 (17.6%) | $155,833 |
| Total | 273 (100.0%) | $73,125 |
Household Income in Middleburg borough
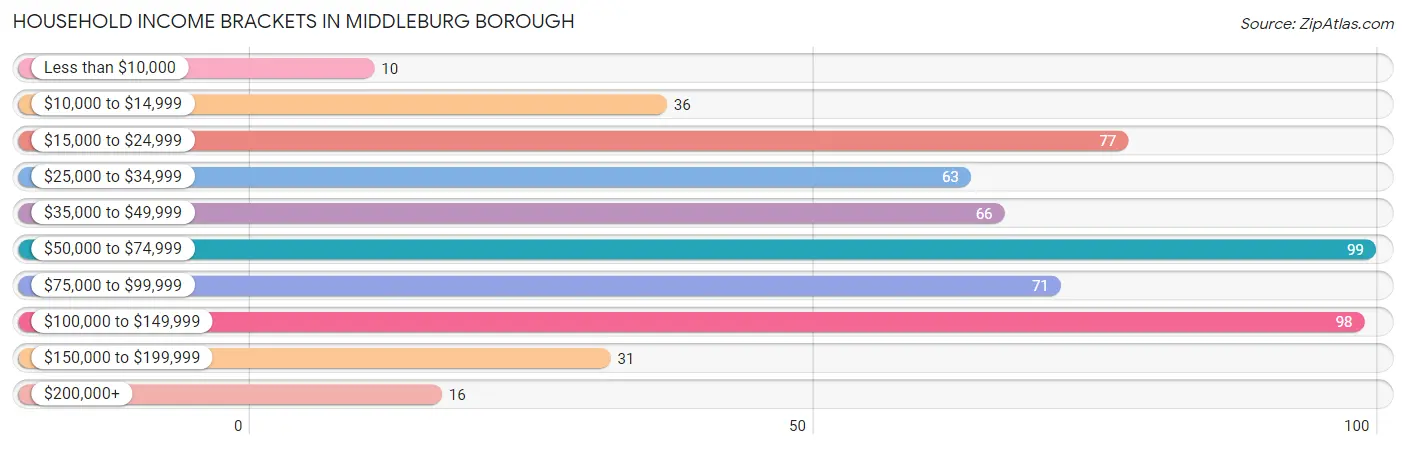
Household Income Brackets in Middleburg borough
With 99 households falling in the category, the $50,000 to $74,999 income range is the most frequent in Middleburg borough, accounting for 17.5% of all households. In contrast, only 10 households (1.8%) fall into the less than $10,000 income bracket, making it the least populous group.
| Income Bracket | # Households | % Households |
| Less than $10,000 | 10 | 1.8% |
| $10,000 to $14,999 | 36 | 6.3% |
| $15,000 to $24,999 | 77 | 13.6% |
| $25,000 to $34,999 | 63 | 11.1% |
| $35,000 to $49,999 | 66 | 11.6% |
| $50,000 to $74,999 | 99 | 17.5% |
| $75,000 to $99,999 | 71 | 12.5% |
| $100,000 to $149,999 | 98 | 17.3% |
| $150,000 to $199,999 | 31 | 5.5% |
| $200,000+ | 16 | 2.8% |
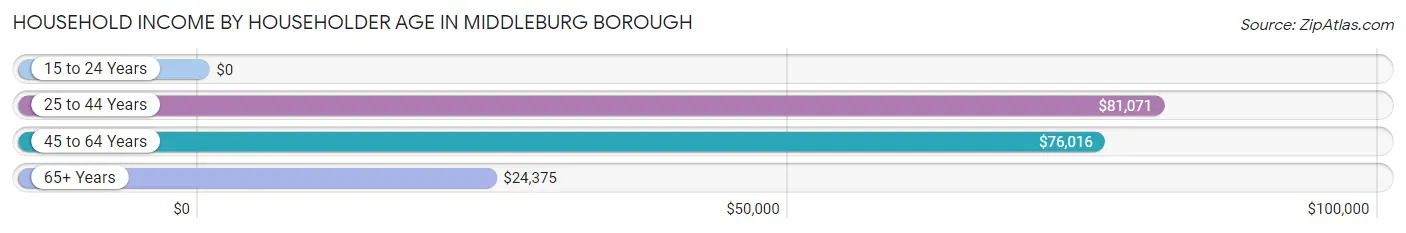
Household Income by Householder Age in Middleburg borough
The median household income in Middleburg borough is $56,339, with the highest median household income of $81,071 found in the 25 to 44 years age bracket for the primary householder. A total of 154 households (27.2%) fall into this category. Meanwhile, the 15 to 24 years age bracket for the primary householder has the lowest median household income of $0, with 15 households (2.6%) in this group.
| Income Bracket | # Households | Median Income |
| 15 to 24 Years | 15 (2.6%) | $0 |
| 25 to 44 Years | 154 (27.2%) | $81,071 |
| 45 to 64 Years | 213 (37.6%) | $76,016 |
| 65+ Years | 185 (32.6%) | $24,375 |
| Total | 567 (100.0%) | $56,339 |
Poverty in Middleburg borough
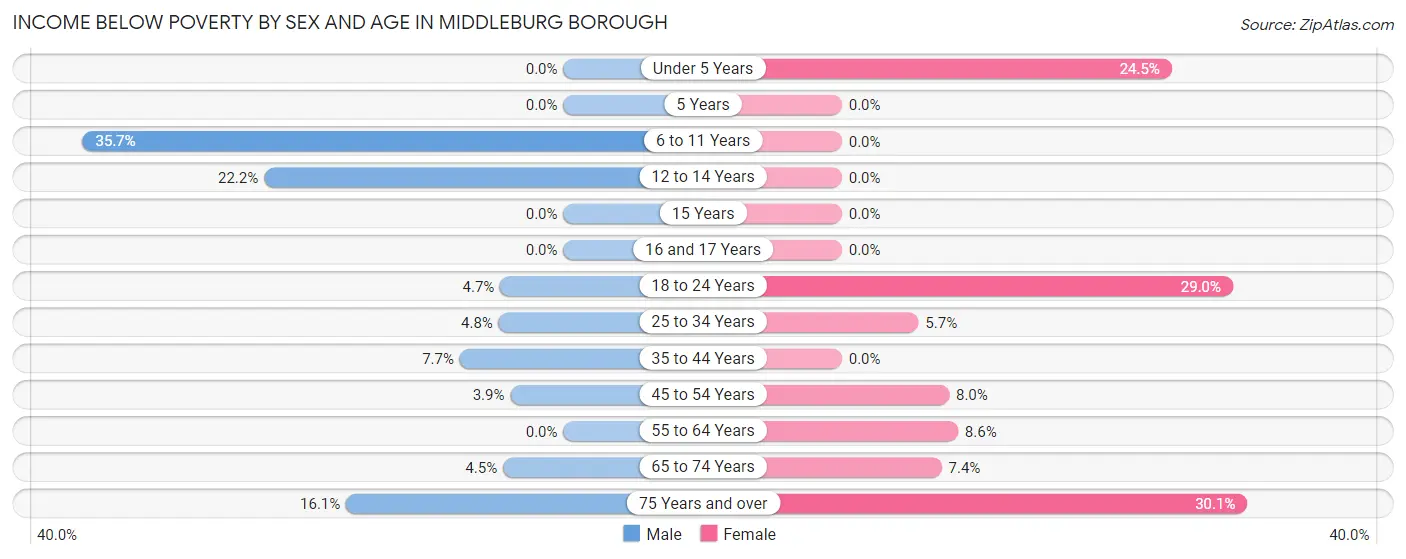
Income Below Poverty by Sex and Age in Middleburg borough
With 8.8% poverty level for males and 12.0% for females among the residents of Middleburg borough, 6 to 11 year old males and 75 year old and over females are the most vulnerable to poverty, with 30 males (35.7%) and 31 females (30.1%) in their respective age groups living below the poverty level.
| Age Bracket | Male | Female |
| Under 5 Years | 0 (0.0%) | 12 (24.5%) |
| 5 Years | 0 (0.0%) | 0 (0.0%) |
| 6 to 11 Years | 30 (35.7%) | 0 (0.0%) |
| 12 to 14 Years | 4 (22.2%) | 0 (0.0%) |
| 15 Years | 0 (0.0%) | 0 (0.0%) |
| 16 and 17 Years | 0 (0.0%) | 0 (0.0%) |
| 18 to 24 Years | 3 (4.7%) | 9 (29.0%) |
| 25 to 34 Years | 6 (4.8%) | 7 (5.7%) |
| 35 to 44 Years | 4 (7.7%) | 0 (0.0%) |
| 45 to 54 Years | 5 (3.9%) | 9 (8.0%) |
| 55 to 64 Years | 0 (0.0%) | 5 (8.6%) |
| 65 to 74 Years | 3 (4.5%) | 4 (7.4%) |
| 75 Years and over | 5 (16.1%) | 31 (30.1%) |
| Total | 60 (8.8%) | 77 (12.0%) |
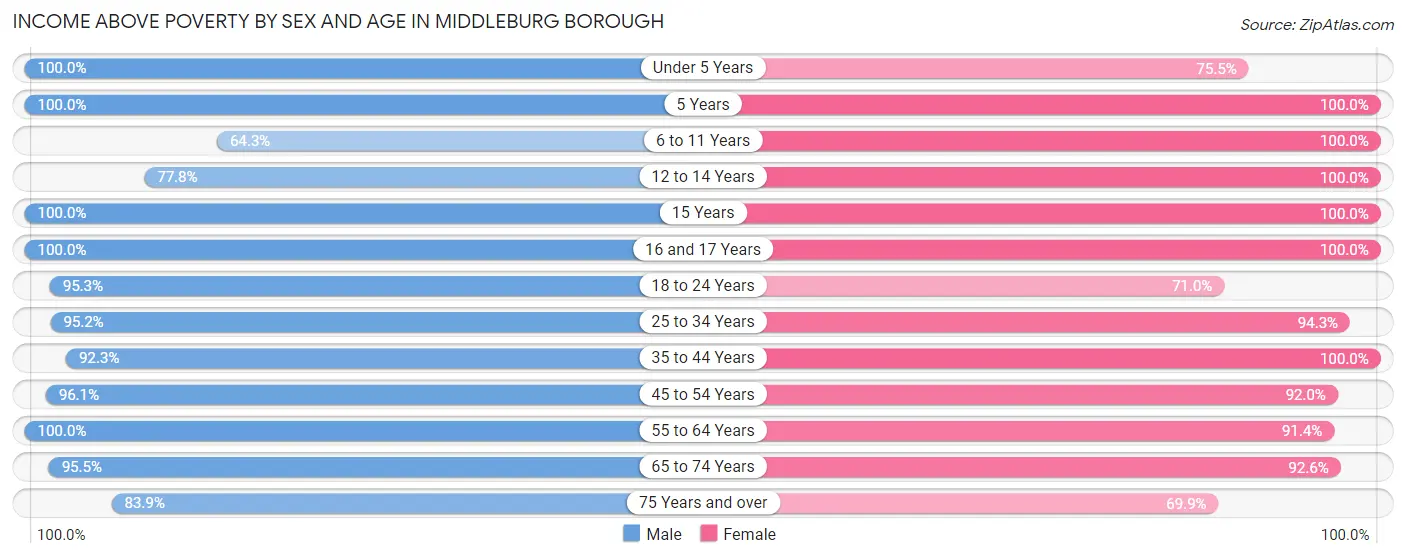
Income Above Poverty by Sex and Age in Middleburg borough
According to the poverty statistics in Middleburg borough, males aged under 5 years and females aged 5 years are the age groups that are most secure financially, with 100.0% of males and 100.0% of females in these age groups living above the poverty line.
| Age Bracket | Male | Female |
| Under 5 Years | 20 (100.0%) | 37 (75.5%) |
| 5 Years | 8 (100.0%) | 14 (100.0%) |
| 6 to 11 Years | 54 (64.3%) | 65 (100.0%) |
| 12 to 14 Years | 14 (77.8%) | 4 (100.0%) |
| 15 Years | 2 (100.0%) | 5 (100.0%) |
| 16 and 17 Years | 17 (100.0%) | 4 (100.0%) |
| 18 to 24 Years | 61 (95.3%) | 22 (71.0%) |
| 25 to 34 Years | 119 (95.2%) | 116 (94.3%) |
| 35 to 44 Years | 48 (92.3%) | 21 (100.0%) |
| 45 to 54 Years | 122 (96.1%) | 104 (92.0%) |
| 55 to 64 Years | 70 (100.0%) | 53 (91.4%) |
| 65 to 74 Years | 64 (95.5%) | 50 (92.6%) |
| 75 Years and over | 26 (83.9%) | 72 (69.9%) |
| Total | 625 (91.2%) | 567 (88.0%) |
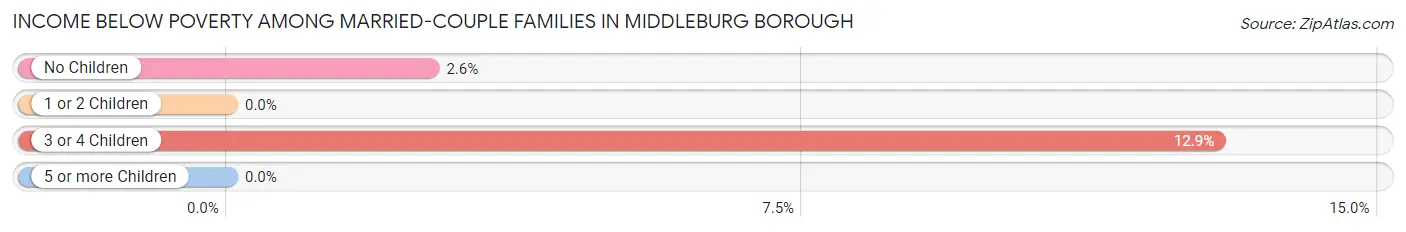
Income Below Poverty Among Married-Couple Families in Middleburg borough
The poverty statistics for married-couple families in Middleburg borough show that 3.5% or 7 of the total 200 families live below the poverty line. Families with 3 or 4 children have the highest poverty rate of 12.9%, comprising of 4 families. On the other hand, families with 1 or 2 children have the lowest poverty rate of 0.0%, which includes 0 families.
| Children | Above Poverty | Below Poverty |
| No Children | 111 (97.4%) | 3 (2.6%) |
| 1 or 2 Children | 50 (100.0%) | 0 (0.0%) |
| 3 or 4 Children | 27 (87.1%) | 4 (12.9%) |
| 5 or more Children | 5 (100.0%) | 0 (0.0%) |
| Total | 193 (96.5%) | 7 (3.5%) |
Income Below Poverty Among Single-Parent Households in Middleburg borough
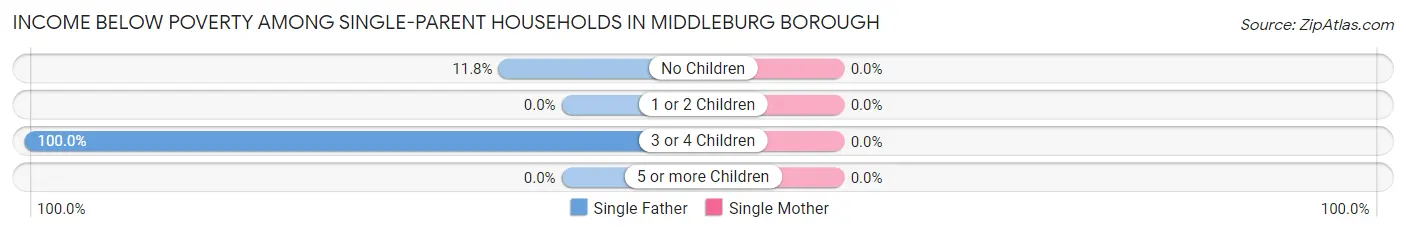
| Children | Single Father | Single Mother |
| No Children | 2 (11.8%) | 0 (0.0%) |
| 1 or 2 Children | 0 (0.0%) | 0 (0.0%) |
| 3 or 4 Children | 4 (100.0%) | 0 (0.0%) |
| 5 or more Children | 0 (0.0%) | 0 (0.0%) |
| Total | 6 (14.3%) | 0 (0.0%) |
Income Below Poverty Among Married-Couple vs Single-Parent Households in Middleburg borough
The poverty data for Middleburg borough shows that 7 of the married-couple family households (3.5%) and 6 of the single-parent households (8.2%) are living below the poverty level. Within the married-couple family households, those with 3 or 4 children have the highest poverty rate, with 4 households (12.9%) falling below the poverty line. Among the single-parent households, those with 3 or 4 children have the highest poverty rate, with 4 household (100.0%) living below poverty.
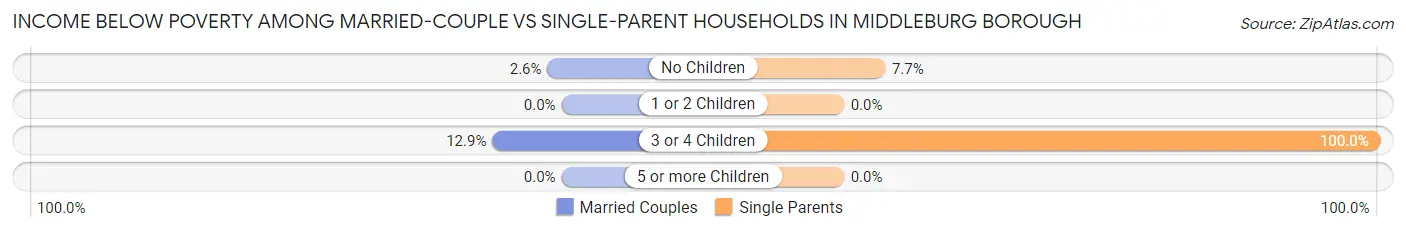
| Children | Married-Couple Families | Single-Parent Households |
| No Children | 3 (2.6%) | 2 (7.7%) |
| 1 or 2 Children | 0 (0.0%) | 0 (0.0%) |
| 3 or 4 Children | 4 (12.9%) | 4 (100.0%) |
| 5 or more Children | 0 (0.0%) | 0 (0.0%) |
| Total | 7 (3.5%) | 6 (8.2%) |
Race in Middleburg borough
The most populous races in Middleburg borough are White / Caucasian (1,267 | 95.3%), Two or more Races (51 | 3.8%), and Hispanic or Latino (19 | 1.4%).
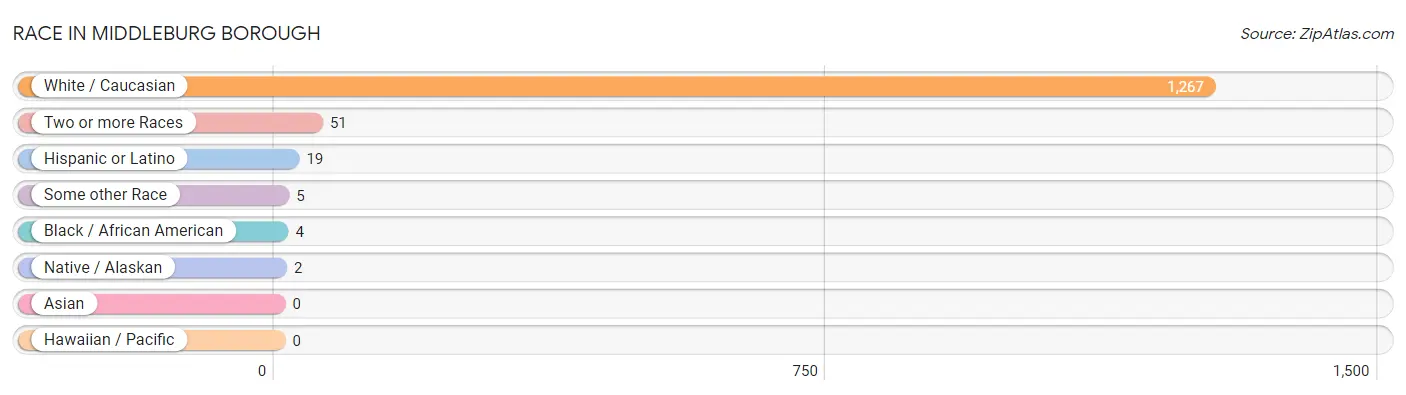
| Race | # Population | % Population |
| Asian | 0 | 0.0% |
| Black / African American | 4 | 0.3% |
| Hawaiian / Pacific | 0 | 0.0% |
| Hispanic or Latino | 19 | 1.4% |
| Native / Alaskan | 2 | 0.2% |
| White / Caucasian | 1,267 | 95.3% |
| Two or more Races | 51 | 3.8% |
| Some other Race | 5 | 0.4% |
| Total | 1,329 | 100.0% |
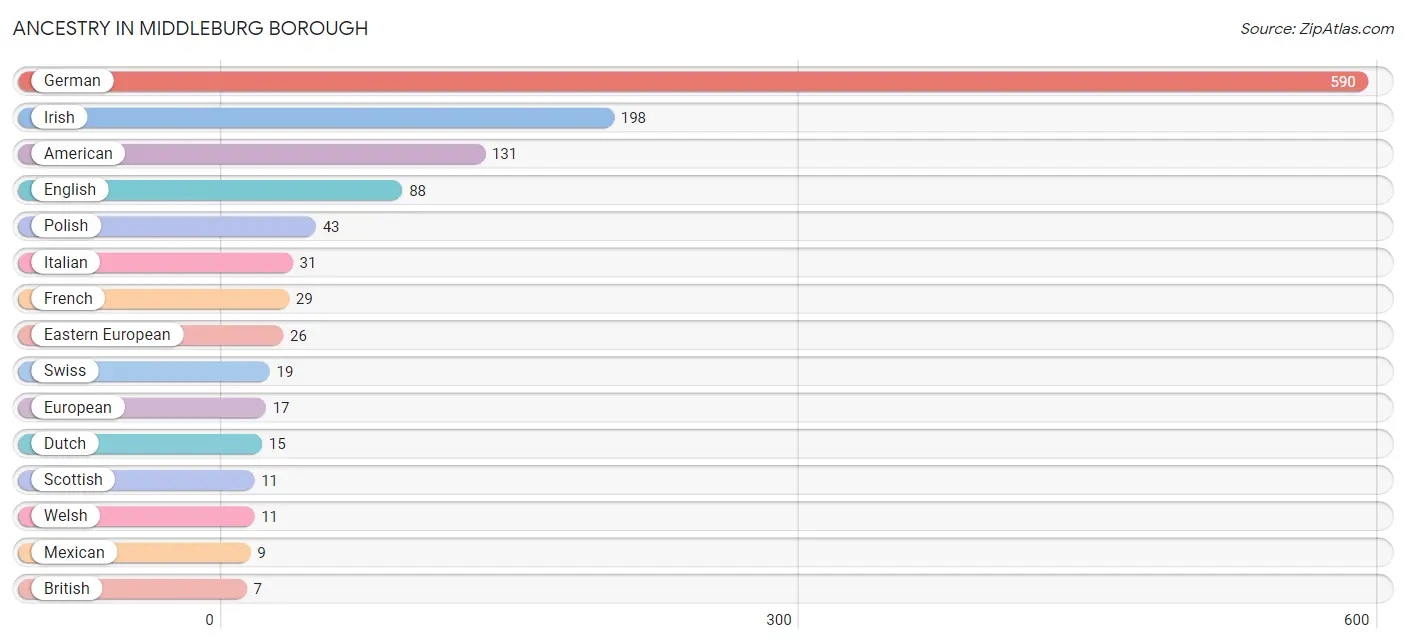
Ancestry in Middleburg borough
The most populous ancestries reported in Middleburg borough are German (590 | 44.4%), Irish (198 | 14.9%), American (131 | 9.9%), English (88 | 6.6%), and Polish (43 | 3.2%), together accounting for 79.0% of all Middleburg borough residents.
| Ancestry | # Population | % Population |
| American | 131 | 9.9% |
| Austrian | 5 | 0.4% |
| British | 7 | 0.5% |
| Canadian | 1 | 0.1% |
| Carpatho Rusyn | 3 | 0.2% |
| Cherokee | 3 | 0.2% |
| Cuban | 2 | 0.2% |
| Czech | 4 | 0.3% |
| Czechoslovakian | 5 | 0.4% |
| Danish | 4 | 0.3% |
| Delaware | 1 | 0.1% |
| Dutch | 15 | 1.1% |
| Eastern European | 26 | 2.0% |
| English | 88 | 6.6% |
| European | 17 | 1.3% |
| French | 29 | 2.2% |
| German | 590 | 44.4% |
| Hungarian | 3 | 0.2% |
| Irish | 198 | 14.9% |
| Italian | 31 | 2.3% |
| Mexican | 9 | 0.7% |
| Navajo | 5 | 0.4% |
| Pennsylvania German | 7 | 0.5% |
| Polish | 43 | 3.2% |
| Puerto Rican | 6 | 0.4% |
| Russian | 5 | 0.4% |
| Scottish | 11 | 0.8% |
| Slavic | 2 | 0.2% |
| Swedish | 1 | 0.1% |
| Swiss | 19 | 1.4% |
| Ukrainian | 2 | 0.2% |
| Welsh | 11 | 0.8% | View All 32 Rows |
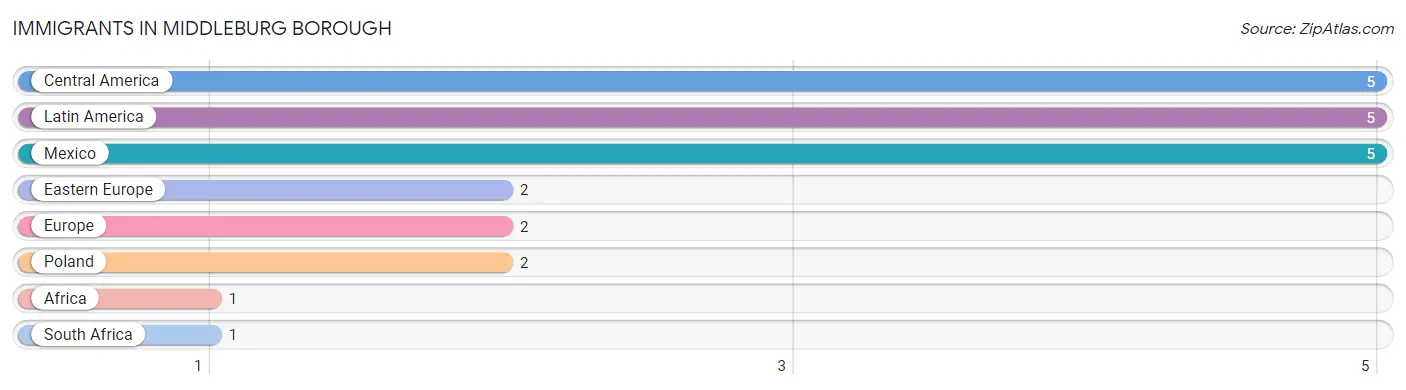
Immigrants in Middleburg borough
The most numerous immigrant groups reported in Middleburg borough came from Central America (5 | 0.4%), Latin America (5 | 0.4%), Mexico (5 | 0.4%), Eastern Europe (2 | 0.2%), and Europe (2 | 0.2%), together accounting for 1.4% of all Middleburg borough residents.
| Immigration Origin | # Population | % Population |
| Africa | 1 | 0.1% |
| Central America | 5 | 0.4% |
| Eastern Europe | 2 | 0.2% |
| Europe | 2 | 0.2% |
| Latin America | 5 | 0.4% |
| Mexico | 5 | 0.4% |
| Poland | 2 | 0.2% |
| South Africa | 1 | 0.1% | View All 8 Rows |
Sex and Age in Middleburg borough
Sex and Age in Middleburg borough
The most populous age groups in Middleburg borough are 50 to 54 Years (69 | 10.1%) for men and 25 to 29 Years (75 | 11.7%) for women.
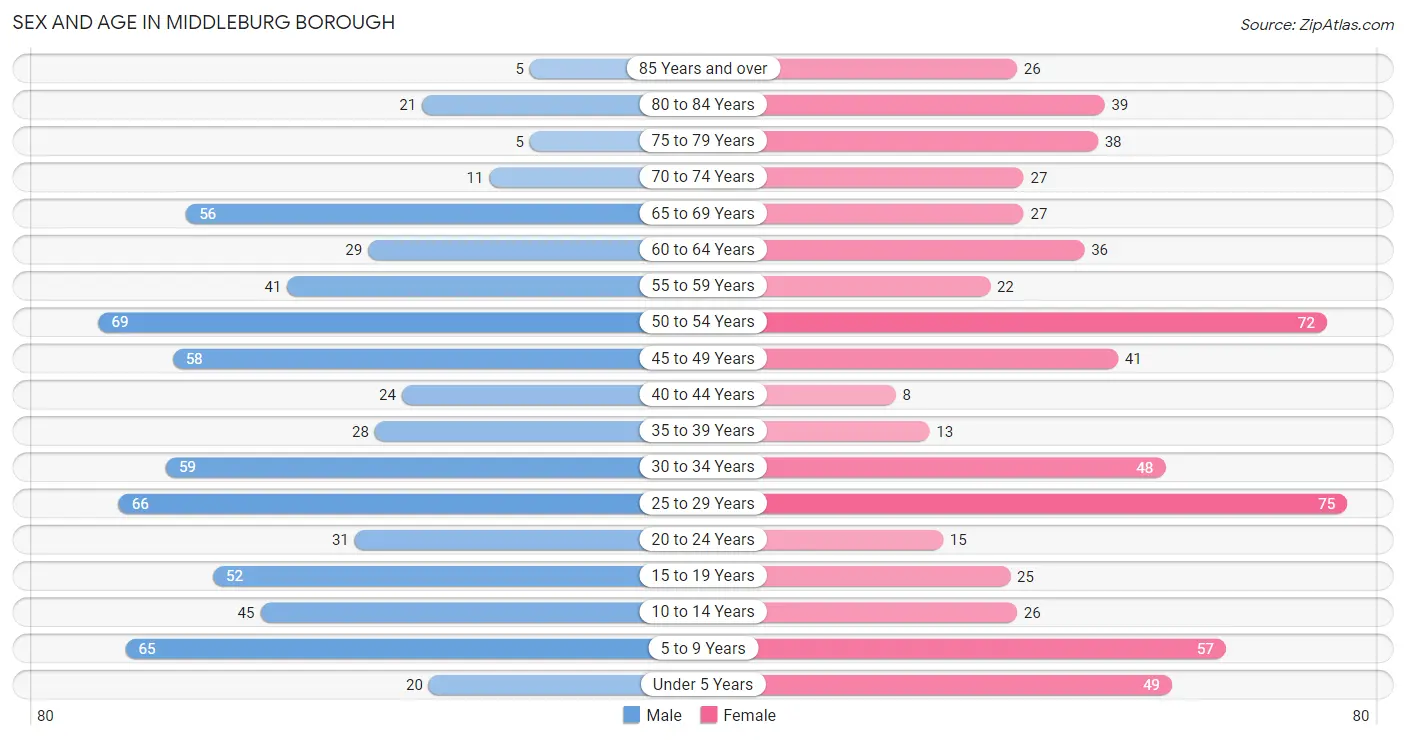
| Age Bracket | Male | Female |
| Under 5 Years | 20 (2.9%) | 49 (7.6%) |
| 5 to 9 Years | 65 (9.5%) | 57 (8.8%) |
| 10 to 14 Years | 45 (6.6%) | 26 (4.0%) |
| 15 to 19 Years | 52 (7.6%) | 25 (3.9%) |
| 20 to 24 Years | 31 (4.5%) | 15 (2.3%) |
| 25 to 29 Years | 66 (9.6%) | 75 (11.7%) |
| 30 to 34 Years | 59 (8.6%) | 48 (7.4%) |
| 35 to 39 Years | 28 (4.1%) | 13 (2.0%) |
| 40 to 44 Years | 24 (3.5%) | 8 (1.2%) |
| 45 to 49 Years | 58 (8.5%) | 41 (6.4%) |
| 50 to 54 Years | 69 (10.1%) | 72 (11.2%) |
| 55 to 59 Years | 41 (6.0%) | 22 (3.4%) |
| 60 to 64 Years | 29 (4.2%) | 36 (5.6%) |
| 65 to 69 Years | 56 (8.2%) | 27 (4.2%) |
| 70 to 74 Years | 11 (1.6%) | 27 (4.2%) |
| 75 to 79 Years | 5 (0.7%) | 38 (5.9%) |
| 80 to 84 Years | 21 (3.1%) | 39 (6.1%) |
| 85 Years and over | 5 (0.7%) | 26 (4.0%) |
| Total | 685 (100.0%) | 644 (100.0%) |
Families and Households in Middleburg borough
Median Family Size in Middleburg borough
The median family size in Middleburg borough is 3.44 persons per family, with married-couple families (200 | 73.3%) accounting for the largest median family size of 3.66 persons per family. On the other hand, single female/mother families (31 | 11.4%) represent the smallest median family size with 2.23 persons per family.
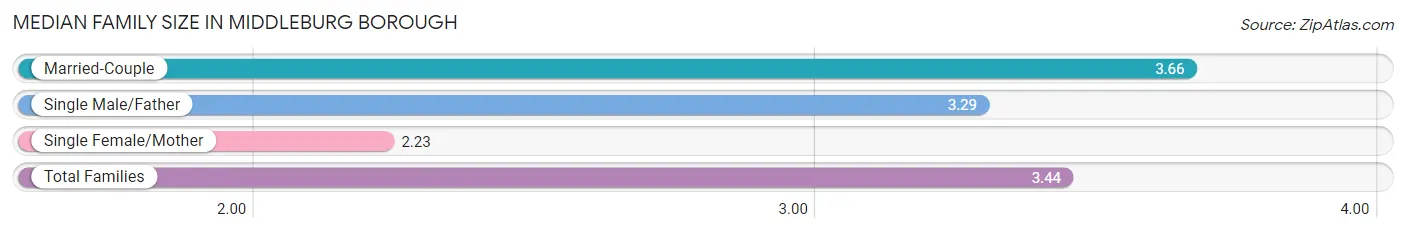
| Family Type | # Families | Family Size |
| Married-Couple | 200 (73.3%) | 3.66 |
| Single Male/Father | 42 (15.4%) | 3.29 |
| Single Female/Mother | 31 (11.4%) | 2.23 |
| Total Families | 273 (100.0%) | 3.44 |
Median Household Size in Middleburg borough
The median household size in Middleburg borough is 2.32 persons per household, with married-couple households (200 | 35.3%) accounting for the largest median household size of 3.66 persons per household. non-family households (294 | 51.8%) represent the smallest median household size with 1.25 persons per household.
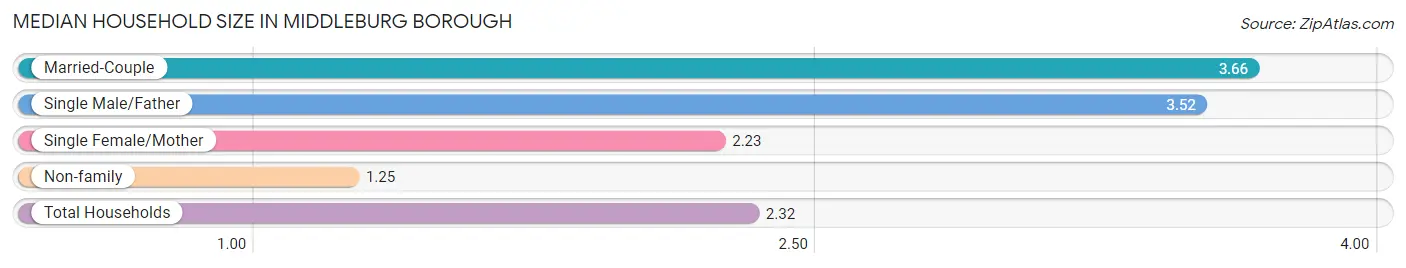
| Household Type | # Households | Household Size |
| Married-Couple | 200 (35.3%) | 3.66 |
| Single Male/Father | 42 (7.4%) | 3.52 |
| Single Female/Mother | 31 (5.5%) | 2.23 |
| Non-family | 294 (51.8%) | 1.25 |
| Total Households | 567 (100.0%) | 2.32 |
Household Size by Marriage Status in Middleburg borough
Out of a total of 567 households in Middleburg borough, 273 (48.1%) are family households, while 294 (51.8%) are nonfamily households. The most numerous type of family households are 2-person households, comprising 119, and the most common type of nonfamily households are 1-person households, comprising 212.
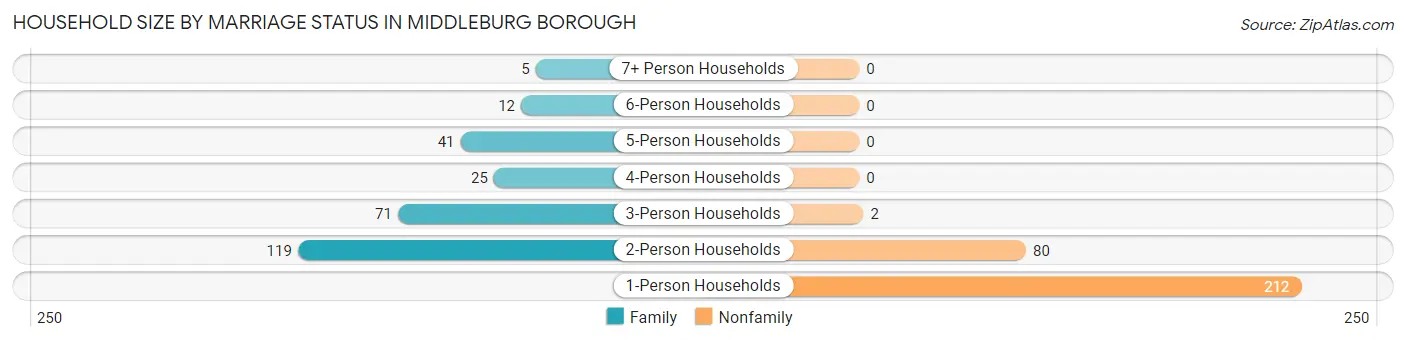
| Household Size | Family Households | Nonfamily Households |
| 1-Person Households | - | 212 (37.4%) |
| 2-Person Households | 119 (21.0%) | 80 (14.1%) |
| 3-Person Households | 71 (12.5%) | 2 (0.4%) |
| 4-Person Households | 25 (4.4%) | 0 (0.0%) |
| 5-Person Households | 41 (7.2%) | 0 (0.0%) |
| 6-Person Households | 12 (2.1%) | 0 (0.0%) |
| 7+ Person Households | 5 (0.9%) | 0 (0.0%) |
| Total | 273 (48.1%) | 294 (51.8%) |
Female Fertility in Middleburg borough
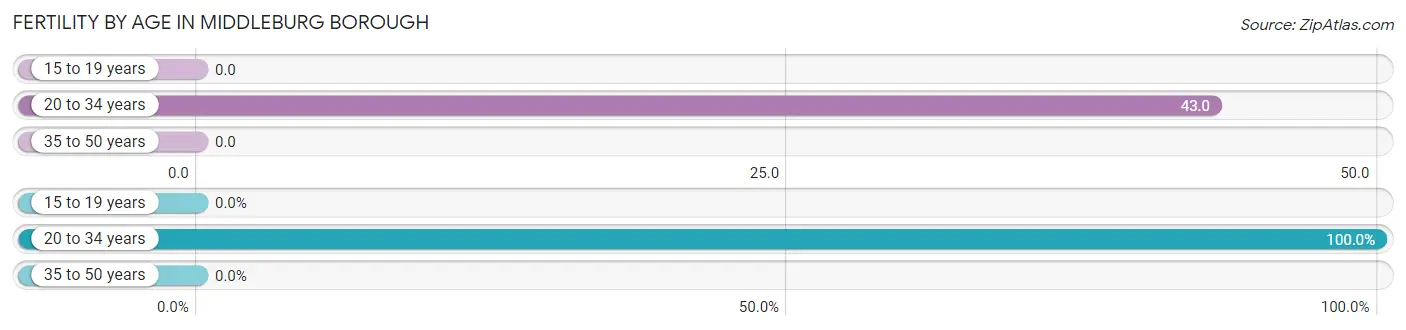
Fertility by Age in Middleburg borough
Average fertility rate in Middleburg borough is 24.0 births per 1,000 women. Women in the age bracket of 20 to 34 years have the highest fertility rate with 43.0 births per 1,000 women. Women in the age bracket of 20 to 34 years acount for 100.0% of all women with births.
| Age Bracket | Women with Births | Births / 1,000 Women |
| 15 to 19 years | 0 (0.0%) | 0.0 |
| 20 to 34 years | 6 (100.0%) | 43.0 |
| 35 to 50 years | 0 (0.0%) | 0.0 |
| Total | 6 (100.0%) | 24.0 |
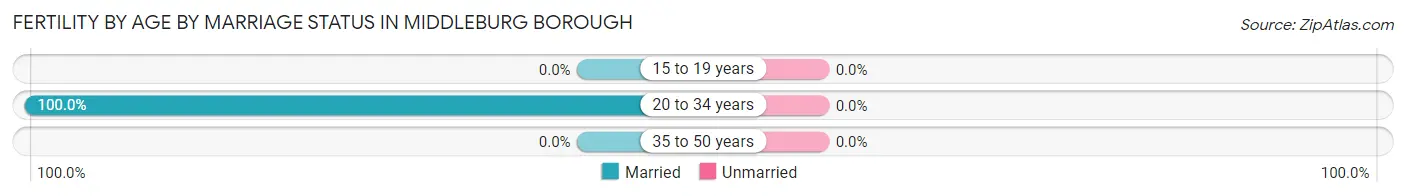
Fertility by Age by Marriage Status in Middleburg borough
| Age Bracket | Married | Unmarried |
| 15 to 19 years | 0 (0.0%) | 0 (0.0%) |
| 20 to 34 years | 6 (100.0%) | 0 (0.0%) |
| 35 to 50 years | 0 (0.0%) | 0 (0.0%) |
| Total | 6 (100.0%) | 0 (0.0%) |
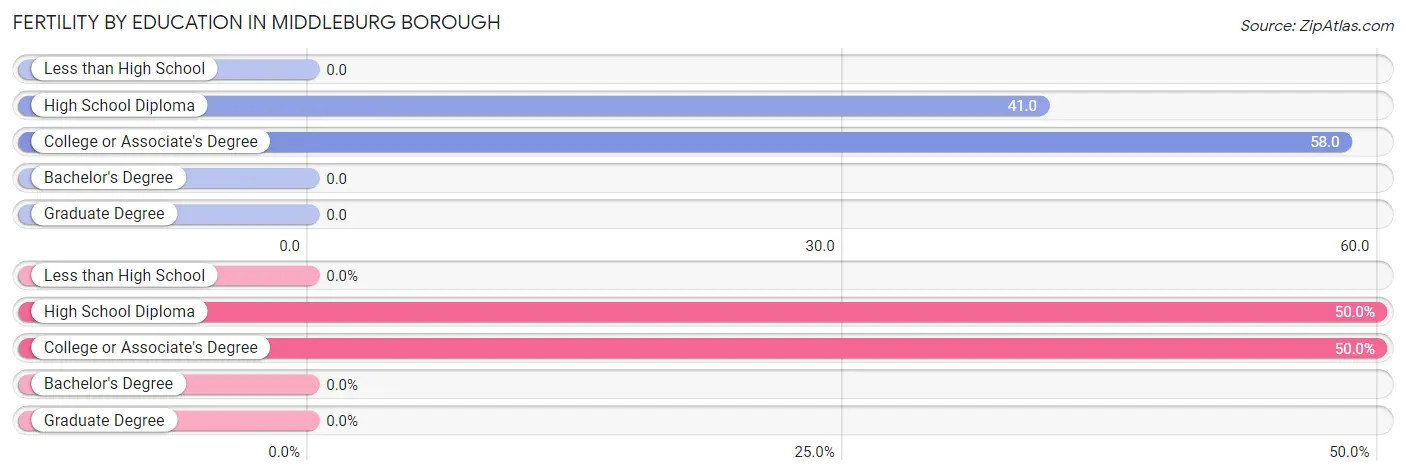
Fertility by Education in Middleburg borough
| Educational Attainment | Women with Births | Births / 1,000 Women |
| Less than High School | 0 (0.0%) | 0.0 |
| High School Diploma | 3 (50.0%) | 41.0 |
| College or Associate's Degree | 3 (50.0%) | 58.0 |
| Bachelor's Degree | 0 (0.0%) | 0.0 |
| Graduate Degree | 0 (0.0%) | 0.0 |
| Total | 6 (100.0%) | 24.0 |
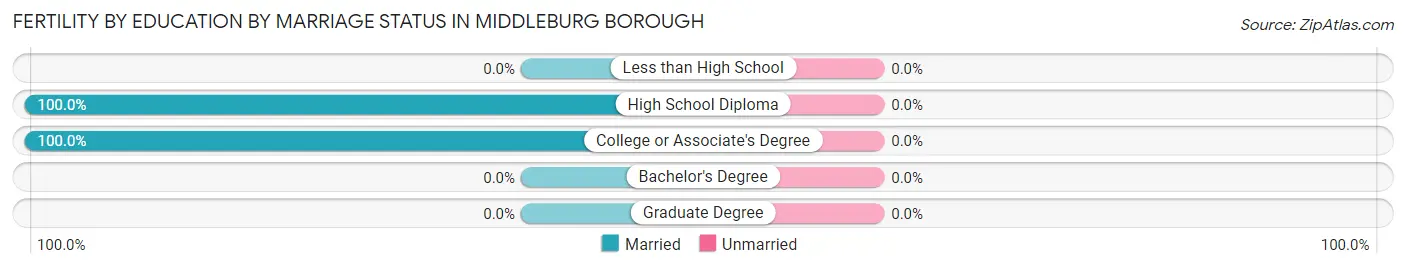
Fertility by Education by Marriage Status in Middleburg borough
| Educational Attainment | Married | Unmarried |
| Less than High School | 0 (0.0%) | 0 (0.0%) |
| High School Diploma | 3 (100.0%) | 0 (0.0%) |
| College or Associate's Degree | 3 (100.0%) | 0 (0.0%) |
| Bachelor's Degree | 0 (0.0%) | 0 (0.0%) |
| Graduate Degree | 0 (0.0%) | 0 (0.0%) |
| Total | 6 (100.0%) | 0 (0.0%) |
Employment Characteristics in Middleburg borough
Employment by Class of Employer in Middleburg borough
Among the 689 employed individuals in Middleburg borough, private company employees (411 | 59.7%), not-for-profit organizations (99 | 14.4%), and local government employees (75 | 10.9%) make up the most common classes of employment.
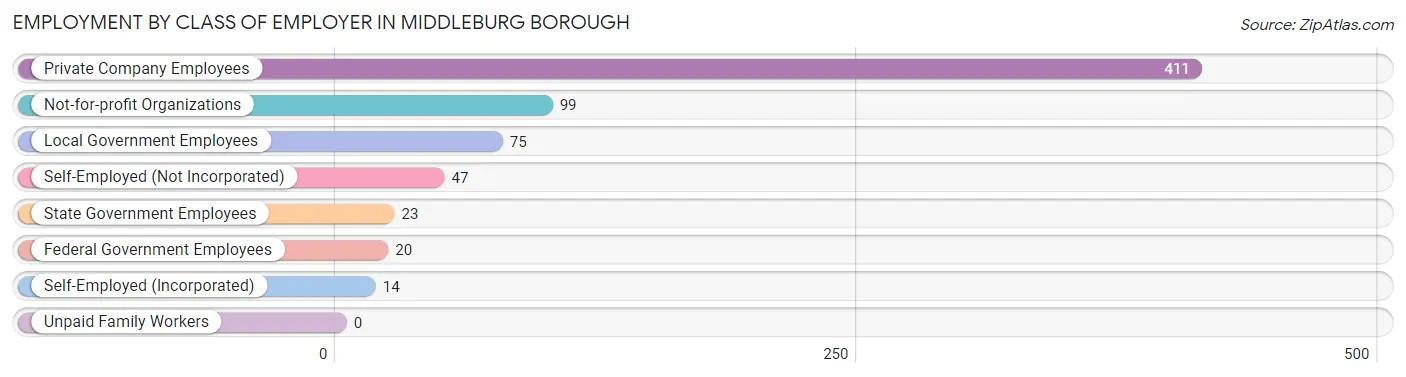
| Employer Class | # Employees | % Employees |
| Private Company Employees | 411 | 59.7% |
| Self-Employed (Incorporated) | 14 | 2.0% |
| Self-Employed (Not Incorporated) | 47 | 6.8% |
| Not-for-profit Organizations | 99 | 14.4% |
| Local Government Employees | 75 | 10.9% |
| State Government Employees | 23 | 3.3% |
| Federal Government Employees | 20 | 2.9% |
| Unpaid Family Workers | 0 | 0.0% |
| Total | 689 | 100.0% |
Employment Status by Age in Middleburg borough
According to the labor force statistics for Middleburg borough, out of the total population over 16 years of age (1,060), 67.8% or 719 individuals are in the labor force, with 2.6% or 19 of them unemployed. The age group with the highest labor force participation rate is 35 to 44 years, with 100.0% or 73 individuals in the labor force. Within the labor force, the 35 to 44 years age range has the highest percentage of unemployed individuals, with 17.8% or 13 of them being unemployed.
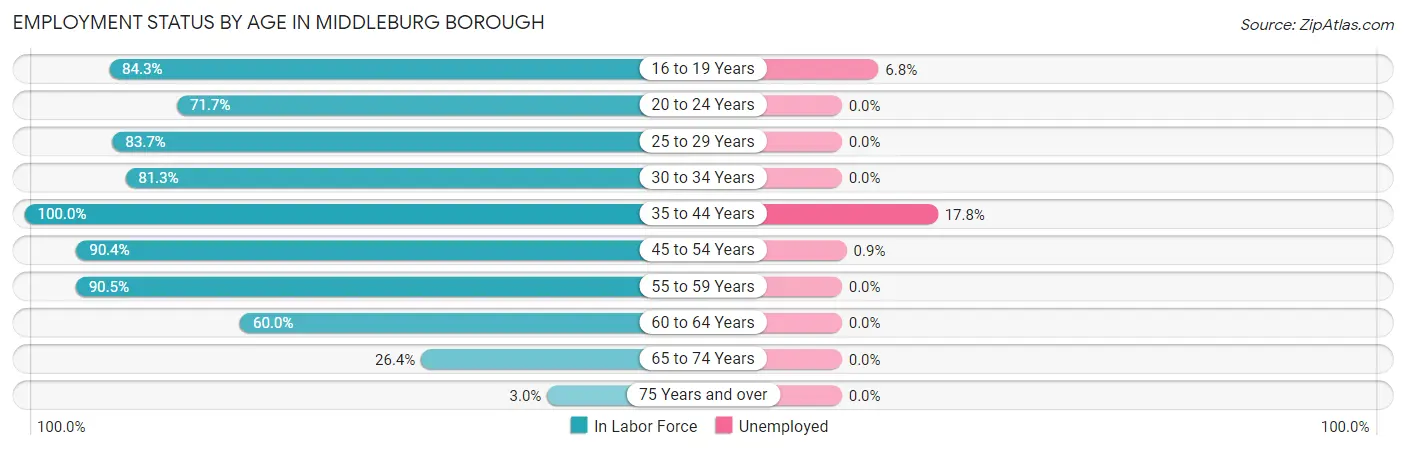
| Age Bracket | In Labor Force | Unemployed |
| 16 to 19 Years | 59 (84.3%) | 4 (6.8%) |
| 20 to 24 Years | 33 (71.7%) | 0 (0.0%) |
| 25 to 29 Years | 118 (83.7%) | 0 (0.0%) |
| 30 to 34 Years | 87 (81.3%) | 0 (0.0%) |
| 35 to 44 Years | 73 (100.0%) | 13 (17.8%) |
| 45 to 54 Years | 217 (90.4%) | 2 (0.9%) |
| 55 to 59 Years | 57 (90.5%) | 0 (0.0%) |
| 60 to 64 Years | 39 (60.0%) | 0 (0.0%) |
| 65 to 74 Years | 32 (26.4%) | 0 (0.0%) |
| 75 Years and over | 4 (3.0%) | 0 (0.0%) |
| Total | 719 (67.8%) | 19 (2.6%) |
Employment Status by Educational Attainment in Middleburg borough
According to labor force statistics for Middleburg borough, 85.8% of individuals (591) out of the total population between 25 and 64 years of age (689) are in the labor force, with 2.5% or 15 of them being unemployed. The group with the highest labor force participation rate are those with the educational attainment of bachelor's degree or higher, with 96.2% or 202 individuals in the labor force. Within the labor force, individuals with less than high school education have the highest percentage of unemployment, with 16.7% or 9 of them being unemployed.
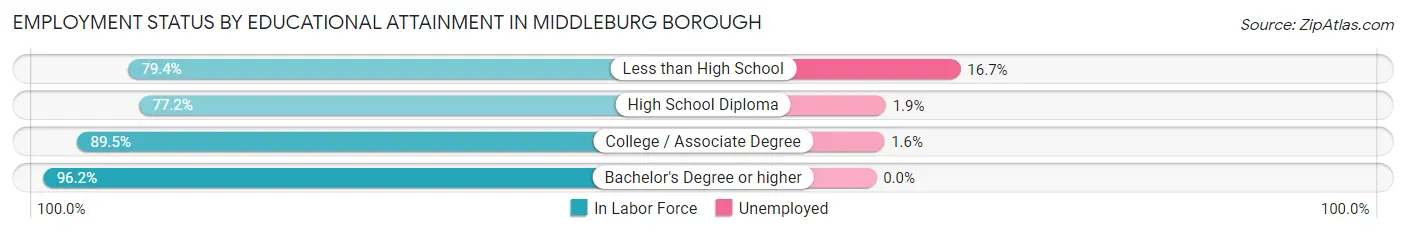
| Educational Attainment | In Labor Force | Unemployed |
| Less than High School | 54 (79.4%) | 11 (16.7%) |
| High School Diploma | 207 (77.2%) | 5 (1.9%) |
| College / Associate Degree | 128 (89.5%) | 2 (1.6%) |
| Bachelor's Degree or higher | 202 (96.2%) | 0 (0.0%) |
| Total | 591 (85.8%) | 17 (2.5%) |
Employment Occupations by Sex in Middleburg borough
Management, Business, Science and Arts Occupations
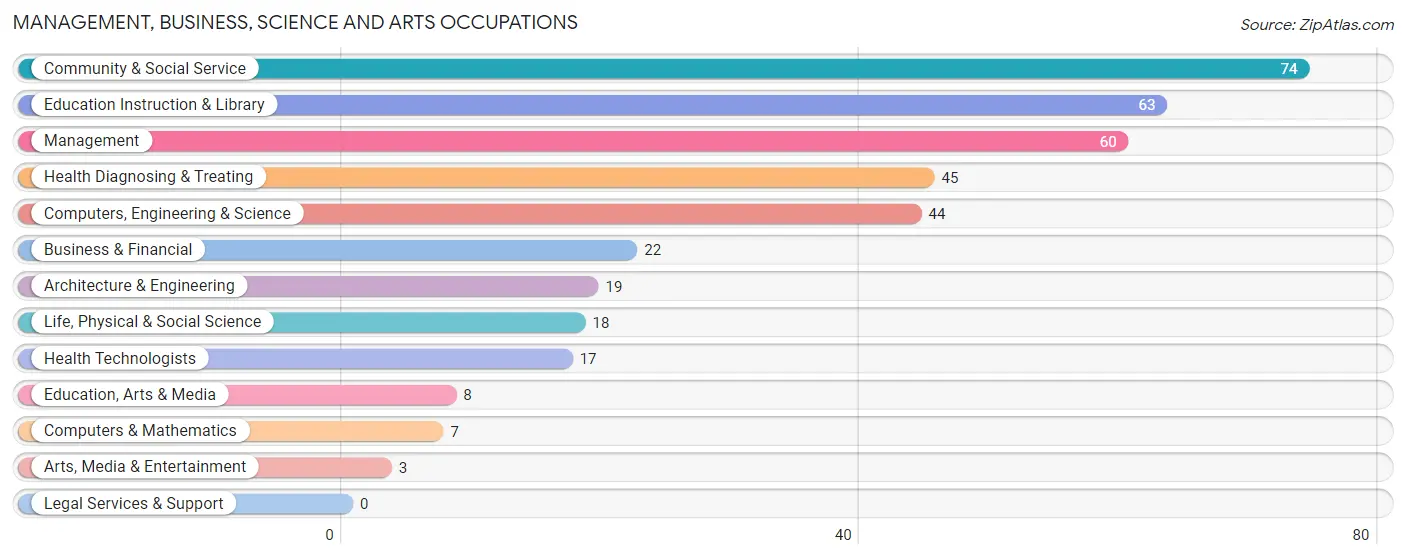
The most common Management, Business, Science and Arts occupations in Middleburg borough are Community & Social Service (74 | 10.8%), Education Instruction & Library (63 | 9.2%), Management (60 | 8.7%), Health Diagnosing & Treating (45 | 6.6%), and Computers, Engineering & Science (44 | 6.4%).
Management, Business, Science and Arts Occupations by Sex
Within the Management, Business, Science and Arts occupations in Middleburg borough, the most male-oriented occupations are Computers & Mathematics (100.0%), Architecture & Engineering (100.0%), and Arts, Media & Entertainment (100.0%), while the most female-oriented occupations are Life, Physical & Social Science (100.0%), Education Instruction & Library (93.6%), and Community & Social Service (86.5%).
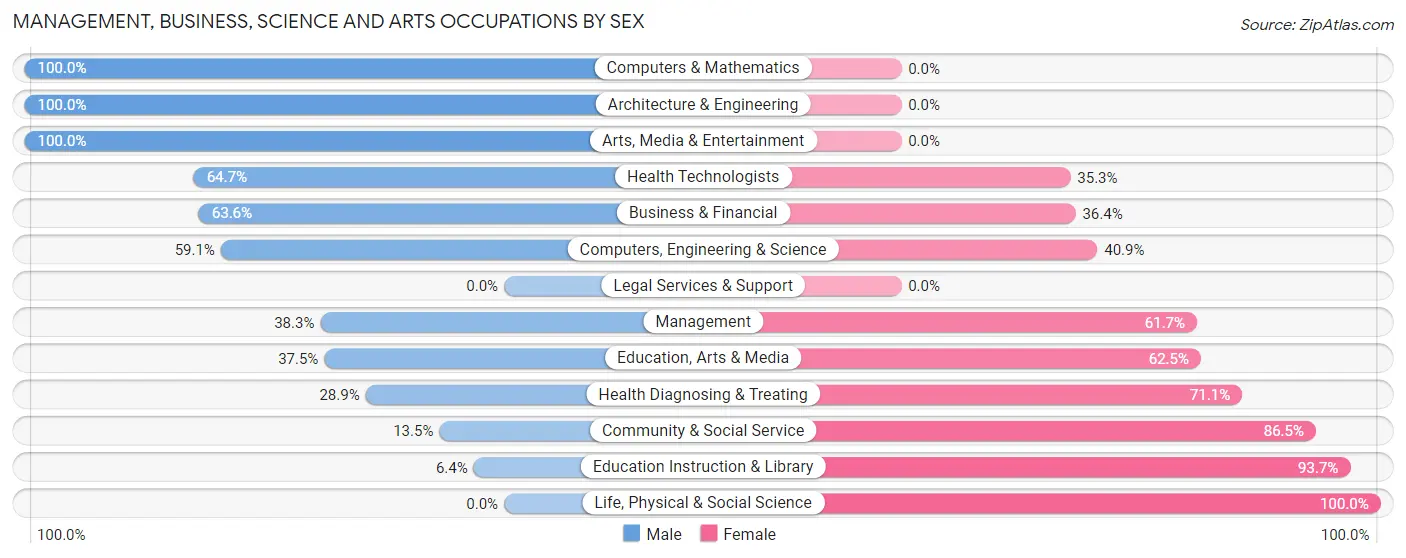
| Occupation | Male | Female |
| Management | 23 (38.3%) | 37 (61.7%) |
| Business & Financial | 14 (63.6%) | 8 (36.4%) |
| Computers, Engineering & Science | 26 (59.1%) | 18 (40.9%) |
| Computers & Mathematics | 7 (100.0%) | 0 (0.0%) |
| Architecture & Engineering | 19 (100.0%) | 0 (0.0%) |
| Life, Physical & Social Science | 0 (0.0%) | 18 (100.0%) |
| Community & Social Service | 10 (13.5%) | 64 (86.5%) |
| Education, Arts & Media | 3 (37.5%) | 5 (62.5%) |
| Legal Services & Support | 0 (0.0%) | 0 (0.0%) |
| Education Instruction & Library | 4 (6.4%) | 59 (93.6%) |
| Arts, Media & Entertainment | 3 (100.0%) | 0 (0.0%) |
| Health Diagnosing & Treating | 13 (28.9%) | 32 (71.1%) |
| Health Technologists | 11 (64.7%) | 6 (35.3%) |
| Total (Category) | 86 (35.1%) | 159 (64.9%) |
| Total (Overall) | 394 (57.4%) | 292 (42.6%) |
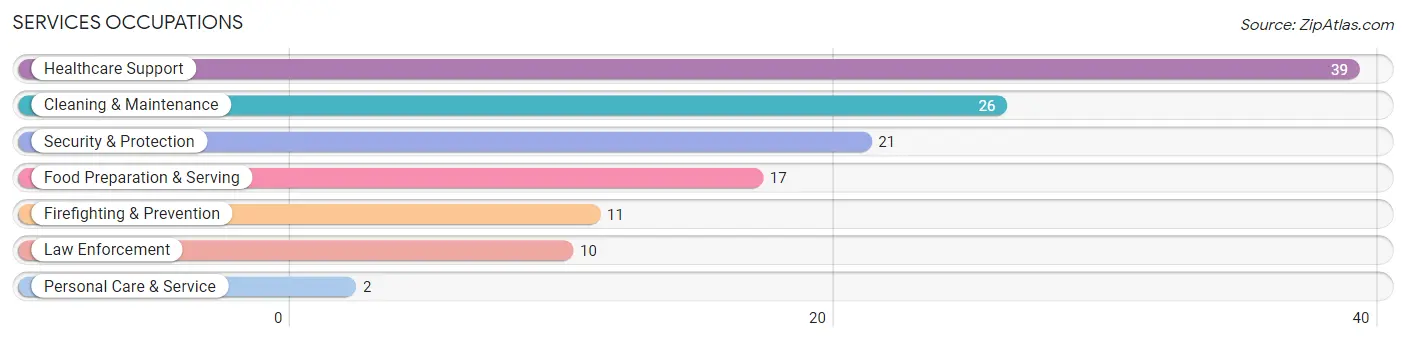
Services Occupations
The most common Services occupations in Middleburg borough are Healthcare Support (39 | 5.7%), Cleaning & Maintenance (26 | 3.8%), Security & Protection (21 | 3.1%), Food Preparation & Serving (17 | 2.5%), and Firefighting & Prevention (11 | 1.6%).
Services Occupations by Sex
Within the Services occupations in Middleburg borough, the most male-oriented occupations are Security & Protection (100.0%), Firefighting & Prevention (100.0%), and Law Enforcement (100.0%), while the most female-oriented occupations are Healthcare Support (69.2%), Cleaning & Maintenance (57.7%), and Food Preparation & Serving (23.5%).
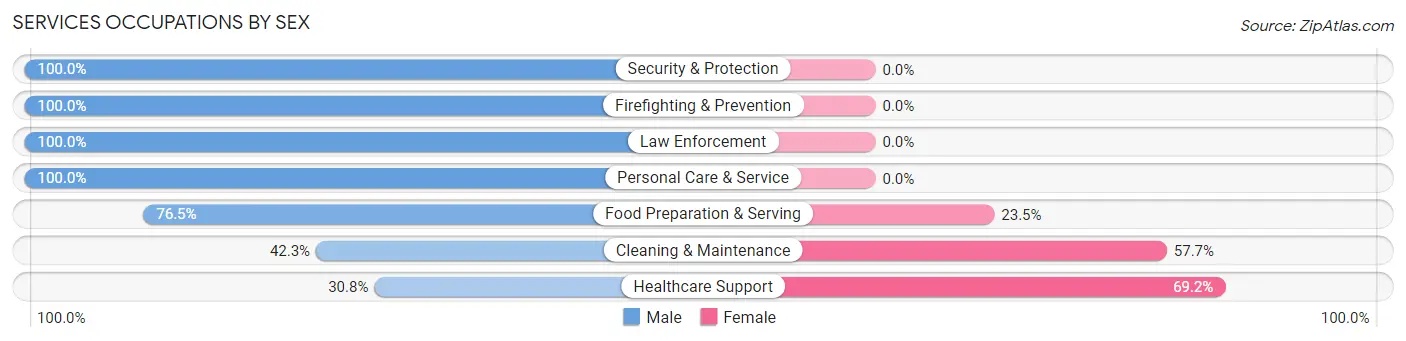
| Occupation | Male | Female |
| Healthcare Support | 12 (30.8%) | 27 (69.2%) |
| Security & Protection | 21 (100.0%) | 0 (0.0%) |
| Firefighting & Prevention | 11 (100.0%) | 0 (0.0%) |
| Law Enforcement | 10 (100.0%) | 0 (0.0%) |
| Food Preparation & Serving | 13 (76.5%) | 4 (23.5%) |
| Cleaning & Maintenance | 11 (42.3%) | 15 (57.7%) |
| Personal Care & Service | 2 (100.0%) | 0 (0.0%) |
| Total (Category) | 59 (56.2%) | 46 (43.8%) |
| Total (Overall) | 394 (57.4%) | 292 (42.6%) |
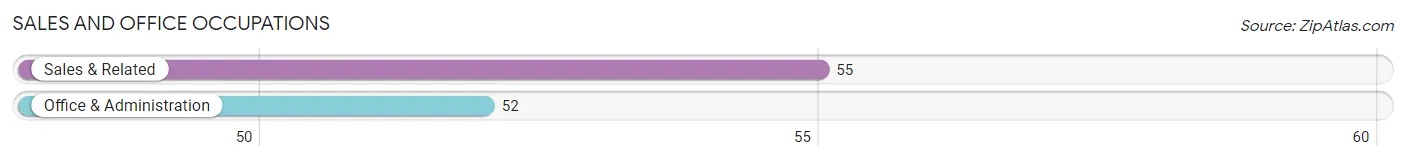
Sales and Office Occupations
The most common Sales and Office occupations in Middleburg borough are Sales & Related (55 | 8.0%), and Office & Administration (52 | 7.6%).
Sales and Office Occupations by Sex

| Occupation | Male | Female |
| Sales & Related | 28 (50.9%) | 27 (49.1%) |
| Office & Administration | 22 (42.3%) | 30 (57.7%) |
| Total (Category) | 50 (46.7%) | 57 (53.3%) |
| Total (Overall) | 394 (57.4%) | 292 (42.6%) |
Natural Resources, Construction and Maintenance Occupations
The most common Natural Resources, Construction and Maintenance occupations in Middleburg borough are Construction & Extraction (69 | 10.1%), and Installation, Maintenance & Repair (13 | 1.9%).
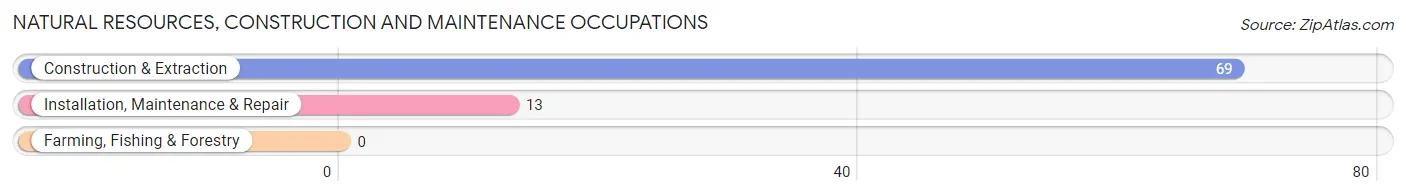
Natural Resources, Construction and Maintenance Occupations by Sex

| Occupation | Male | Female |
| Farming, Fishing & Forestry | 0 (0.0%) | 0 (0.0%) |
| Construction & Extraction | 67 (97.1%) | 2 (2.9%) |
| Installation, Maintenance & Repair | 13 (100.0%) | 0 (0.0%) |
| Total (Category) | 80 (97.6%) | 2 (2.4%) |
| Total (Overall) | 394 (57.4%) | 292 (42.6%) |
Production, Transportation and Moving Occupations
The most common Production, Transportation and Moving occupations in Middleburg borough are Production (78 | 11.4%), Material Moving (56 | 8.2%), and Transportation (13 | 1.9%).
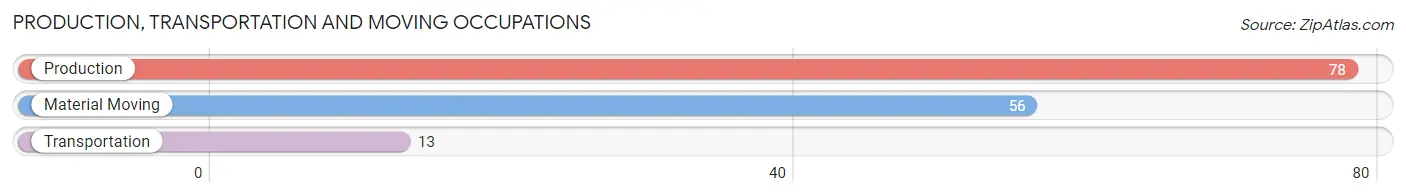
Production, Transportation and Moving Occupations by Sex
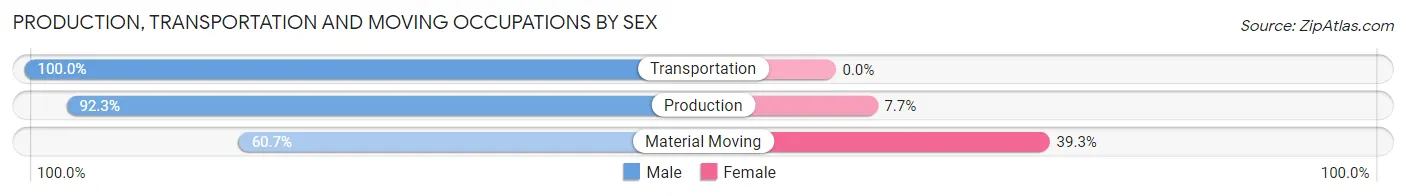
| Occupation | Male | Female |
| Production | 72 (92.3%) | 6 (7.7%) |
| Transportation | 13 (100.0%) | 0 (0.0%) |
| Material Moving | 34 (60.7%) | 22 (39.3%) |
| Total (Category) | 119 (80.9%) | 28 (19.1%) |
| Total (Overall) | 394 (57.4%) | 292 (42.6%) |
Employment Industries by Sex in Middleburg borough
Employment Industries in Middleburg borough
The major employment industries in Middleburg borough include Manufacturing (160 | 23.3%), Health Care & Social Assistance (126 | 18.4%), Construction (92 | 13.4%), Educational Services (83 | 12.1%), and Retail Trade (53 | 7.7%).
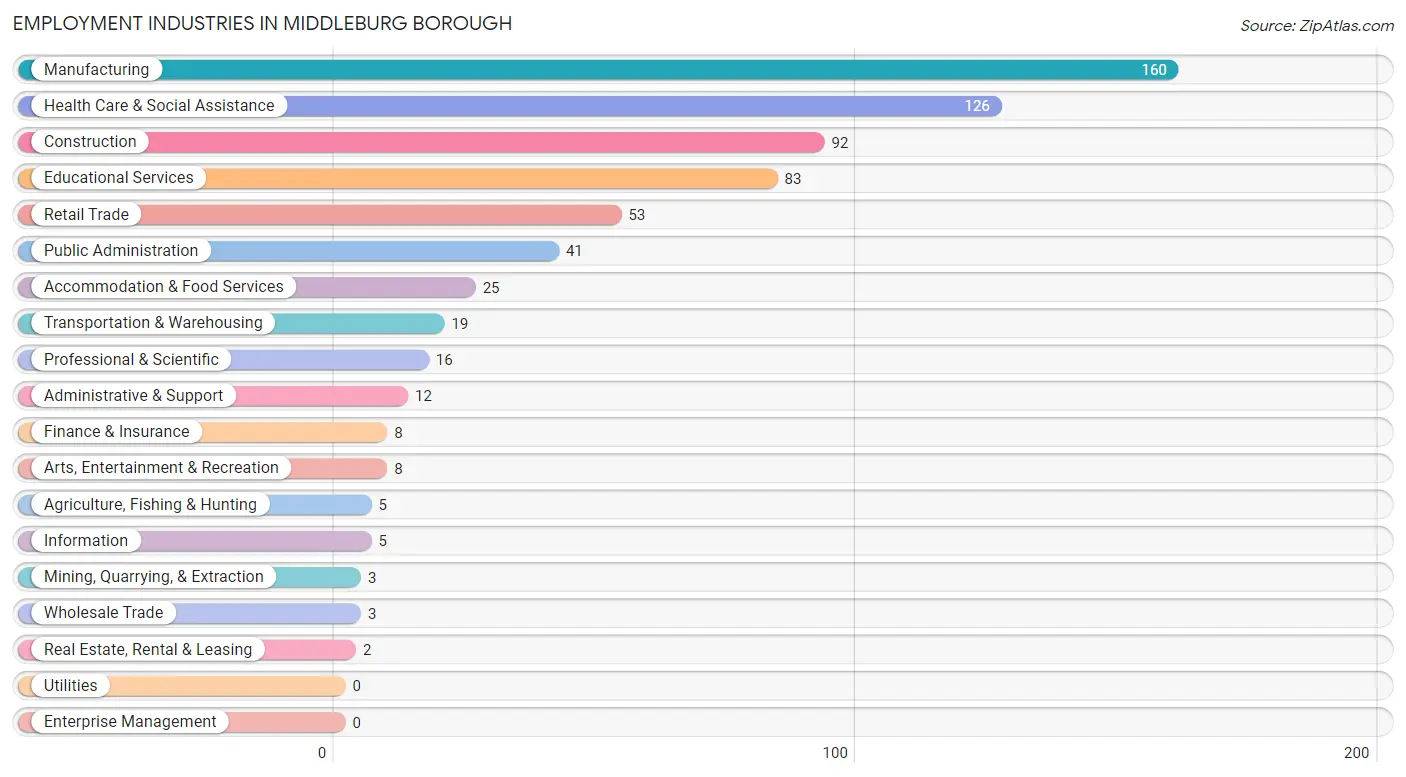
Employment Industries by Sex in Middleburg borough
The Middleburg borough industries that see more men than women are Agriculture, Fishing & Hunting (100.0%), Mining, Quarrying, & Extraction (100.0%), and Wholesale Trade (100.0%), whereas the industries that tend to have a higher number of women are Real Estate, Rental & Leasing (100.0%), Educational Services (91.6%), and Health Care & Social Assistance (81.8%).
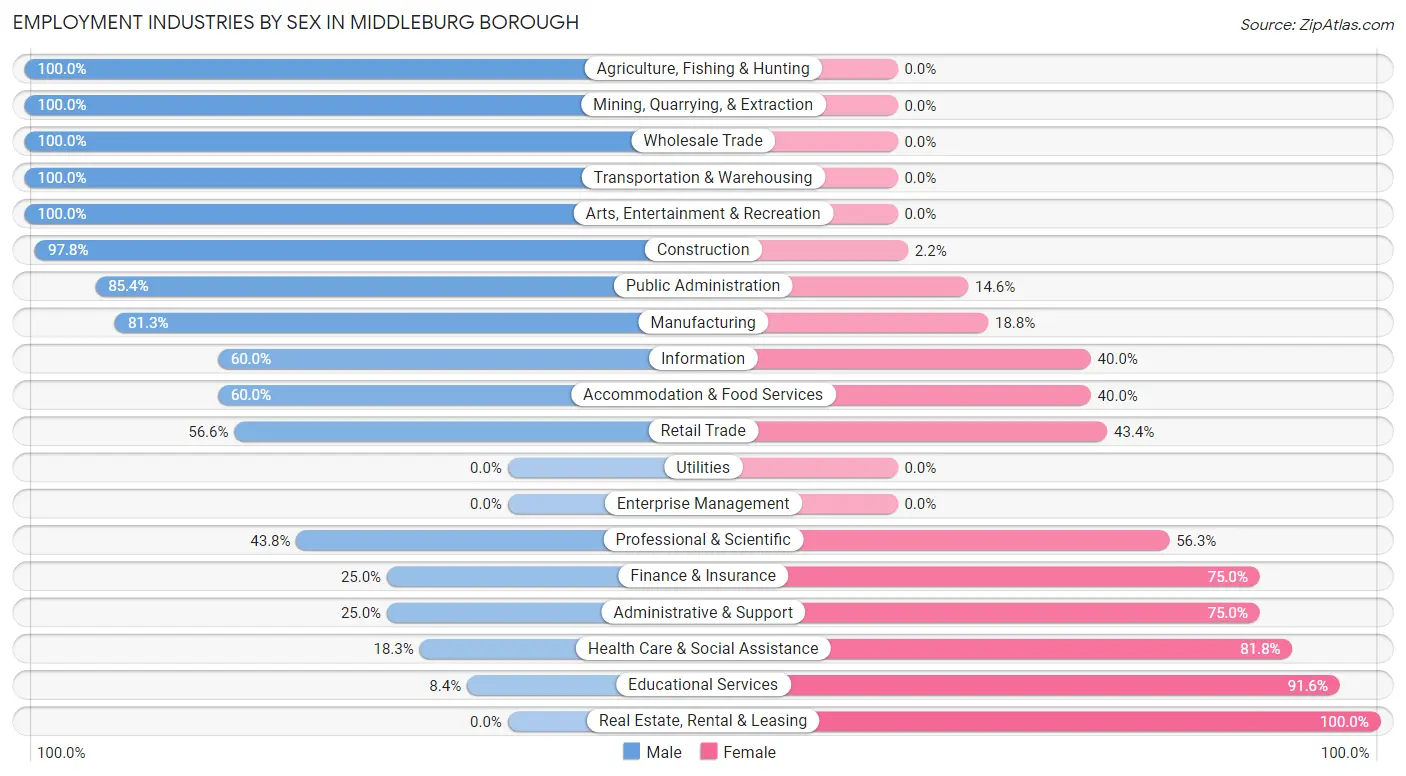
| Industry | Male | Female |
| Agriculture, Fishing & Hunting | 5 (100.0%) | 0 (0.0%) |
| Mining, Quarrying, & Extraction | 3 (100.0%) | 0 (0.0%) |
| Construction | 90 (97.8%) | 2 (2.2%) |
| Manufacturing | 130 (81.2%) | 30 (18.8%) |
| Wholesale Trade | 3 (100.0%) | 0 (0.0%) |
| Retail Trade | 30 (56.6%) | 23 (43.4%) |
| Transportation & Warehousing | 19 (100.0%) | 0 (0.0%) |
| Utilities | 0 (0.0%) | 0 (0.0%) |
| Information | 3 (60.0%) | 2 (40.0%) |
| Finance & Insurance | 2 (25.0%) | 6 (75.0%) |
| Real Estate, Rental & Leasing | 0 (0.0%) | 2 (100.0%) |
| Professional & Scientific | 7 (43.8%) | 9 (56.2%) |
| Enterprise Management | 0 (0.0%) | 0 (0.0%) |
| Administrative & Support | 3 (25.0%) | 9 (75.0%) |
| Educational Services | 7 (8.4%) | 76 (91.6%) |
| Health Care & Social Assistance | 23 (18.2%) | 103 (81.8%) |
| Arts, Entertainment & Recreation | 8 (100.0%) | 0 (0.0%) |
| Accommodation & Food Services | 15 (60.0%) | 10 (40.0%) |
| Public Administration | 35 (85.4%) | 6 (14.6%) |
| Total | 394 (57.4%) | 292 (42.6%) |
Education in Middleburg borough
School Enrollment in Middleburg borough
The most common levels of schooling among the 313 students in Middleburg borough are elementary school (106 | 33.9%), graduate / professional (65 | 20.8%), and high school (52 | 16.6%).
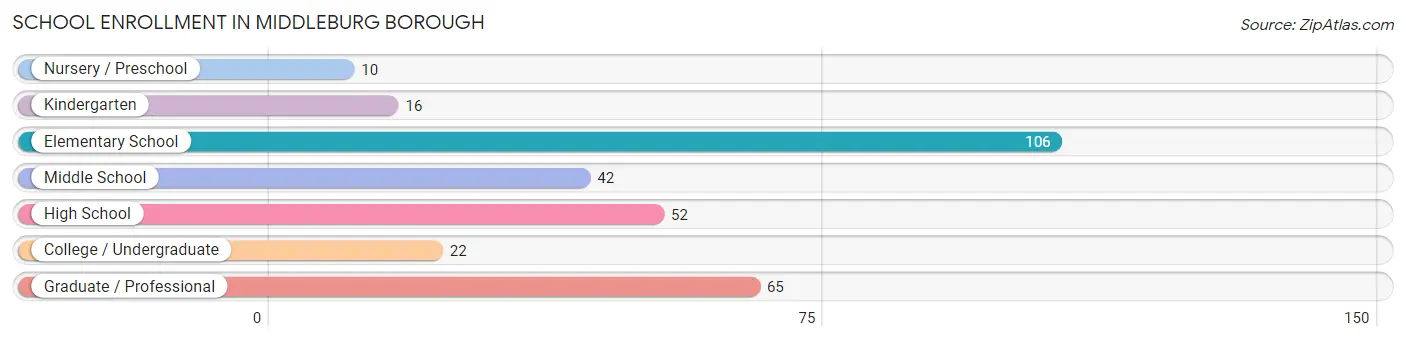
| School Level | # Students | % Students |
| Nursery / Preschool | 10 | 3.2% |
| Kindergarten | 16 | 5.1% |
| Elementary School | 106 | 33.9% |
| Middle School | 42 | 13.4% |
| High School | 52 | 16.6% |
| College / Undergraduate | 22 | 7.0% |
| Graduate / Professional | 65 | 20.8% |
| Total | 313 | 100.0% |
School Enrollment by Age by Funding Source in Middleburg borough
Out of a total of 313 students who are enrolled in schools in Middleburg borough, 52 (16.6%) attend a private institution, while the remaining 261 (83.4%) are enrolled in public schools. The age group of 35 years and over has the highest likelihood of being enrolled in private schools, with 16 (61.5% in the age bracket) enrolled. Conversely, the age group of 3 to 4 year olds has the lowest likelihood of being enrolled in a private school, with 3 (100.0% in the age bracket) attending a public institution.
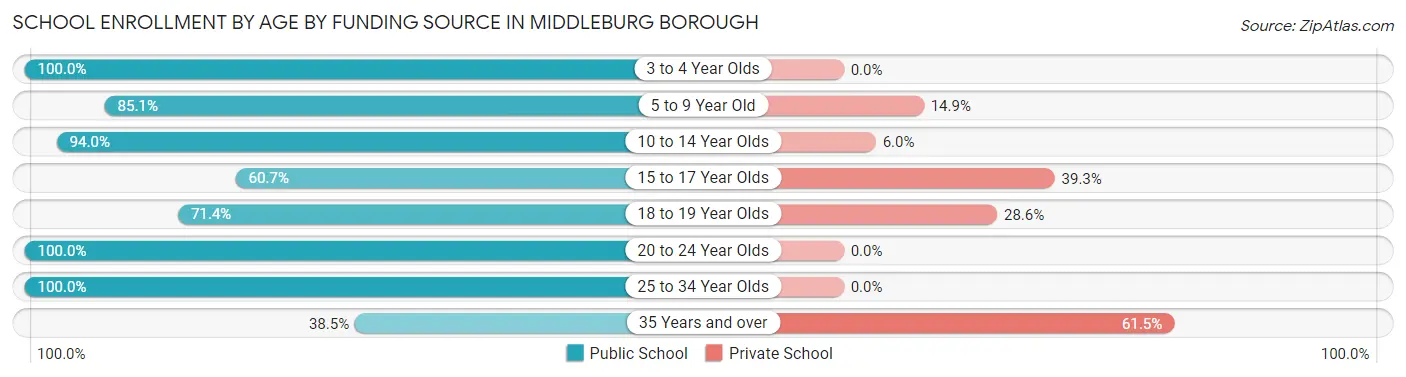
| Age Bracket | Public School | Private School |
| 3 to 4 Year Olds | 3 (100.0%) | 0 (0.0%) |
| 5 to 9 Year Old | 97 (85.1%) | 17 (14.9%) |
| 10 to 14 Year Olds | 63 (94.0%) | 4 (6.0%) |
| 15 to 17 Year Olds | 17 (60.7%) | 11 (39.3%) |
| 18 to 19 Year Olds | 10 (71.4%) | 4 (28.6%) |
| 20 to 24 Year Olds | 10 (100.0%) | 0 (0.0%) |
| 25 to 34 Year Olds | 51 (100.0%) | 0 (0.0%) |
| 35 Years and over | 10 (38.5%) | 16 (61.5%) |
| Total | 261 (83.4%) | 52 (16.6%) |
Educational Attainment by Field of Study in Middleburg borough
Education (74 | 30.4%), science & technology (36 | 14.8%), arts & humanities (36 | 14.8%), computers & mathematics (26 | 10.7%), and business (18 | 7.4%) are the most common fields of study among 243 individuals in Middleburg borough who have obtained a bachelor's degree or higher.
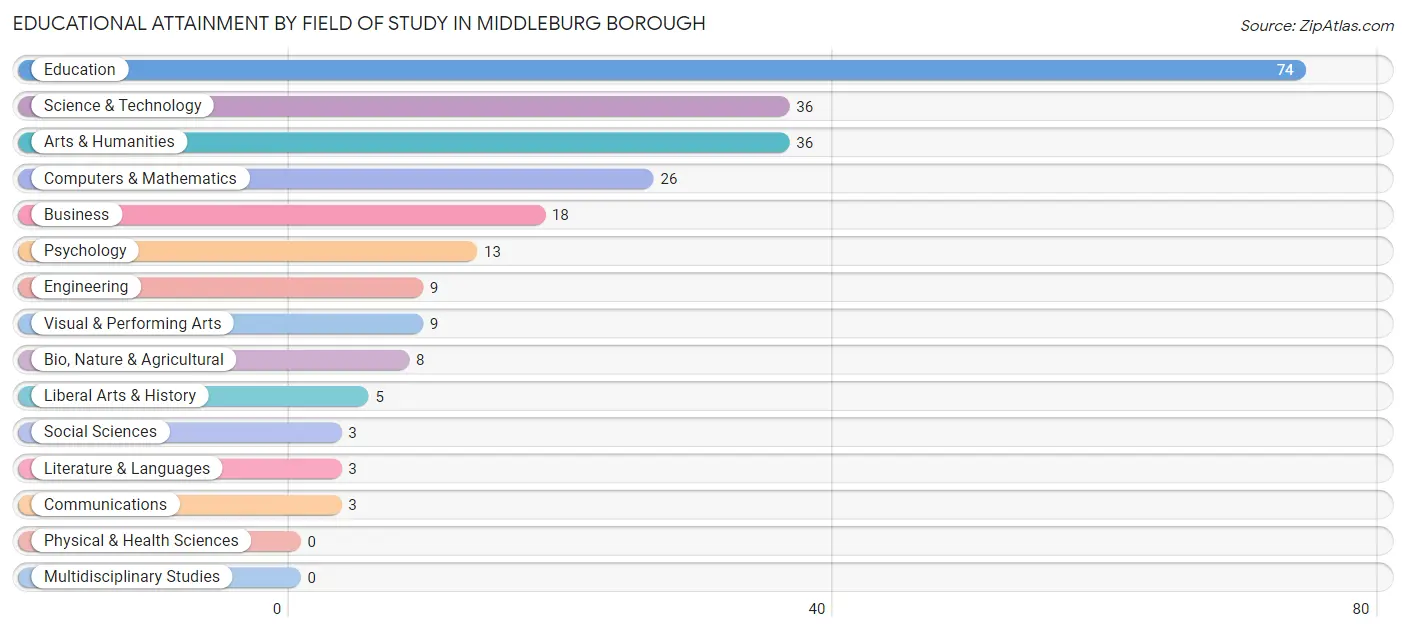
| Field of Study | # Graduates | % Graduates |
| Computers & Mathematics | 26 | 10.7% |
| Bio, Nature & Agricultural | 8 | 3.3% |
| Physical & Health Sciences | 0 | 0.0% |
| Psychology | 13 | 5.3% |
| Social Sciences | 3 | 1.2% |
| Engineering | 9 | 3.7% |
| Multidisciplinary Studies | 0 | 0.0% |
| Science & Technology | 36 | 14.8% |
| Business | 18 | 7.4% |
| Education | 74 | 30.4% |
| Literature & Languages | 3 | 1.2% |
| Liberal Arts & History | 5 | 2.1% |
| Visual & Performing Arts | 9 | 3.7% |
| Communications | 3 | 1.2% |
| Arts & Humanities | 36 | 14.8% |
| Total | 243 | 100.0% |
Transportation & Commute in Middleburg borough
Vehicle Availability by Sex in Middleburg borough
The most prevalent vehicle ownership categories in Middleburg borough are males with 2 vehicles (157, accounting for 39.6%) and females with 2 vehicles (134, making up 55.1%).
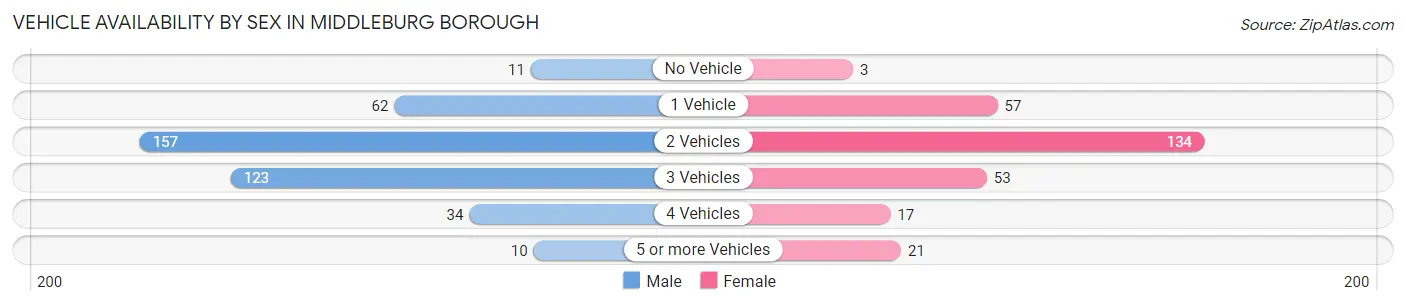
| Vehicles Available | Male | Female |
| No Vehicle | 11 (2.8%) | 3 (1.1%) |
| 1 Vehicle | 62 (15.6%) | 57 (20.0%) |
| 2 Vehicles | 157 (39.6%) | 134 (47.0%) |
| 3 Vehicles | 123 (31.0%) | 53 (18.6%) |
| 4 Vehicles | 34 (8.6%) | 17 (6.0%) |
| 5 or more Vehicles | 10 (2.5%) | 21 (7.4%) |
| Total | 397 (100.0%) | 285 (100.0%) |
Commute Time in Middleburg borough
The most frequently occuring commute durations in Middleburg borough are 15 to 19 minutes (133 commuters, 20.7%), 10 to 14 minutes (108 commuters, 16.8%), and 5 to 9 minutes (104 commuters, 16.2%).
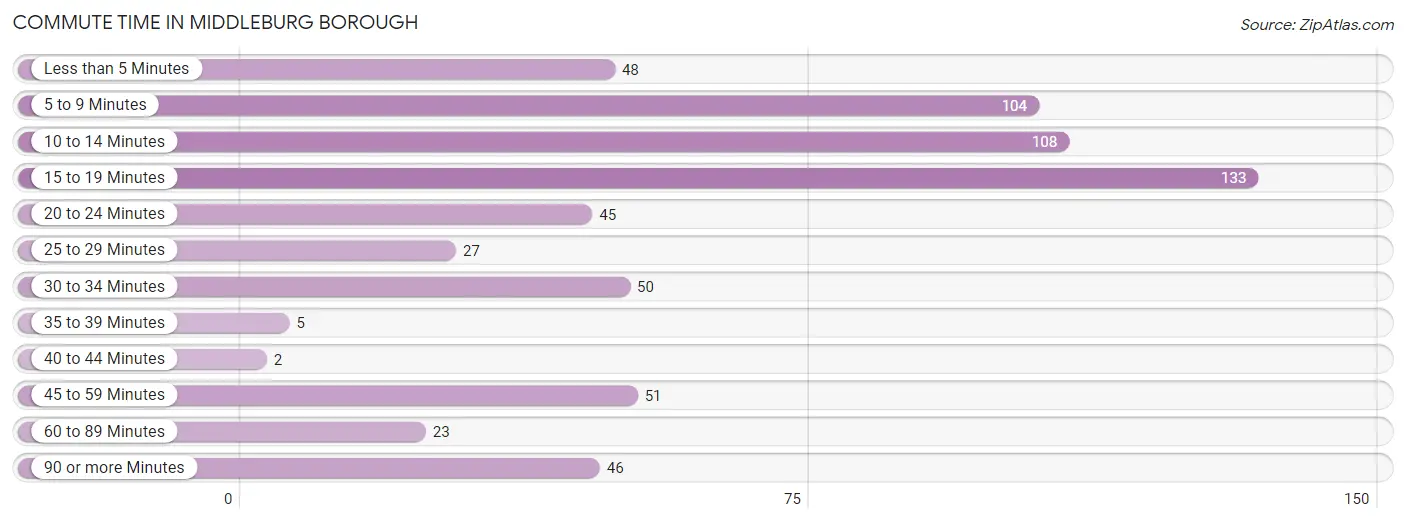
| Commute Time | # Commuters | % Commuters |
| Less than 5 Minutes | 48 | 7.5% |
| 5 to 9 Minutes | 104 | 16.2% |
| 10 to 14 Minutes | 108 | 16.8% |
| 15 to 19 Minutes | 133 | 20.7% |
| 20 to 24 Minutes | 45 | 7.0% |
| 25 to 29 Minutes | 27 | 4.2% |
| 30 to 34 Minutes | 50 | 7.8% |
| 35 to 39 Minutes | 5 | 0.8% |
| 40 to 44 Minutes | 2 | 0.3% |
| 45 to 59 Minutes | 51 | 7.9% |
| 60 to 89 Minutes | 23 | 3.6% |
| 90 or more Minutes | 46 | 7.2% |
Commute Time by Sex in Middleburg borough
The most common commute times in Middleburg borough are 5 to 9 minutes (78 commuters, 20.2%) for males and 15 to 19 minutes (96 commuters, 37.5%) for females.
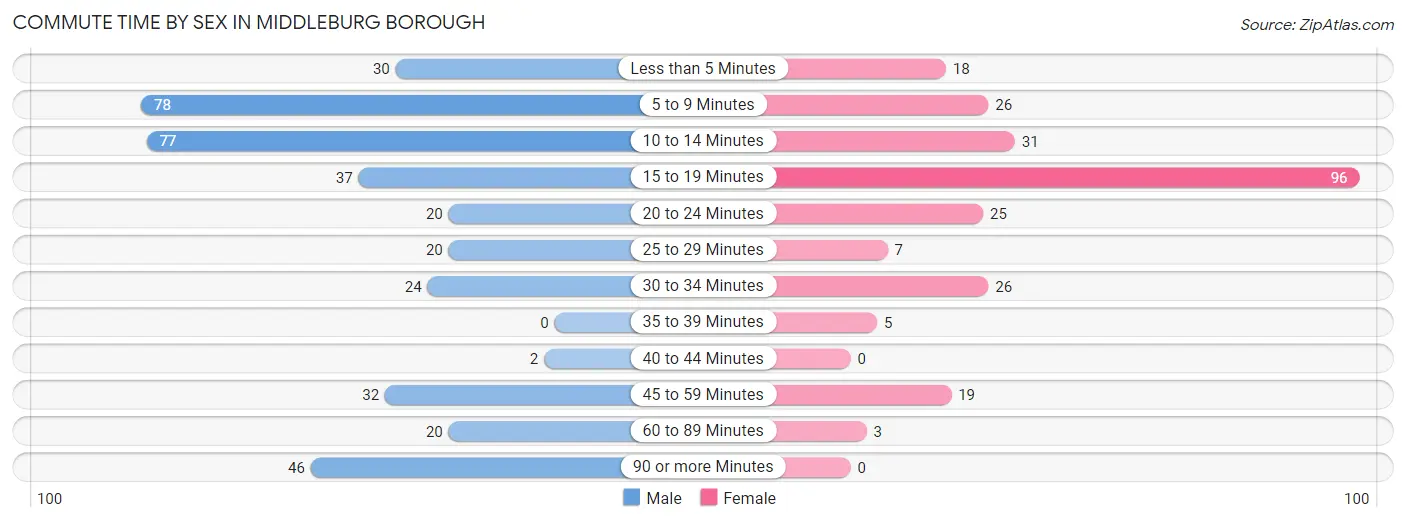
| Commute Time | Male | Female |
| Less than 5 Minutes | 30 (7.8%) | 18 (7.0%) |
| 5 to 9 Minutes | 78 (20.2%) | 26 (10.2%) |
| 10 to 14 Minutes | 77 (20.0%) | 31 (12.1%) |
| 15 to 19 Minutes | 37 (9.6%) | 96 (37.5%) |
| 20 to 24 Minutes | 20 (5.2%) | 25 (9.8%) |
| 25 to 29 Minutes | 20 (5.2%) | 7 (2.7%) |
| 30 to 34 Minutes | 24 (6.2%) | 26 (10.2%) |
| 35 to 39 Minutes | 0 (0.0%) | 5 (1.9%) |
| 40 to 44 Minutes | 2 (0.5%) | 0 (0.0%) |
| 45 to 59 Minutes | 32 (8.3%) | 19 (7.4%) |
| 60 to 89 Minutes | 20 (5.2%) | 3 (1.2%) |
| 90 or more Minutes | 46 (11.9%) | 0 (0.0%) |
Time of Departure to Work by Sex in Middleburg borough
The most frequent times of departure to work in Middleburg borough are 5:30 AM to 5:59 AM (91, 23.6%) for males and 7:00 AM to 7:29 AM (91, 35.5%) for females.
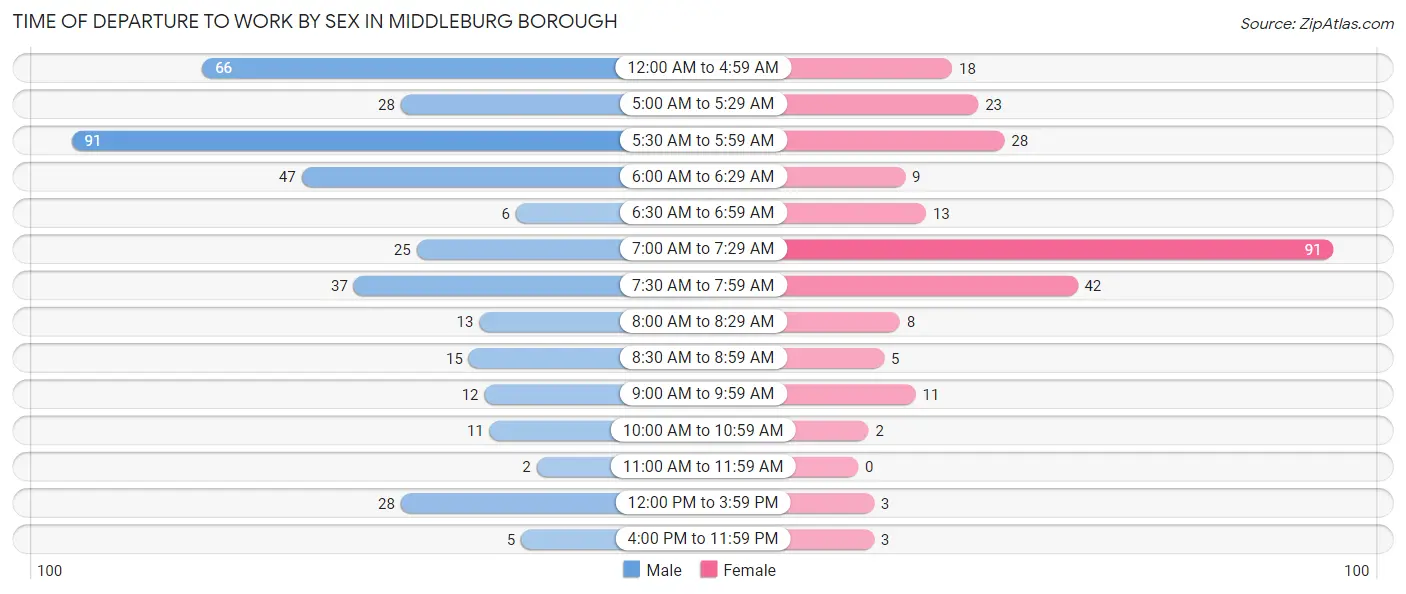
| Time of Departure | Male | Female |
| 12:00 AM to 4:59 AM | 66 (17.1%) | 18 (7.0%) |
| 5:00 AM to 5:29 AM | 28 (7.2%) | 23 (9.0%) |
| 5:30 AM to 5:59 AM | 91 (23.6%) | 28 (10.9%) |
| 6:00 AM to 6:29 AM | 47 (12.2%) | 9 (3.5%) |
| 6:30 AM to 6:59 AM | 6 (1.5%) | 13 (5.1%) |
| 7:00 AM to 7:29 AM | 25 (6.5%) | 91 (35.5%) |
| 7:30 AM to 7:59 AM | 37 (9.6%) | 42 (16.4%) |
| 8:00 AM to 8:29 AM | 13 (3.4%) | 8 (3.1%) |
| 8:30 AM to 8:59 AM | 15 (3.9%) | 5 (1.9%) |
| 9:00 AM to 9:59 AM | 12 (3.1%) | 11 (4.3%) |
| 10:00 AM to 10:59 AM | 11 (2.9%) | 2 (0.8%) |
| 11:00 AM to 11:59 AM | 2 (0.5%) | 0 (0.0%) |
| 12:00 PM to 3:59 PM | 28 (7.2%) | 3 (1.2%) |
| 4:00 PM to 11:59 PM | 5 (1.3%) | 3 (1.2%) |
| Total | 386 (100.0%) | 256 (100.0%) |
Housing Occupancy in Middleburg borough
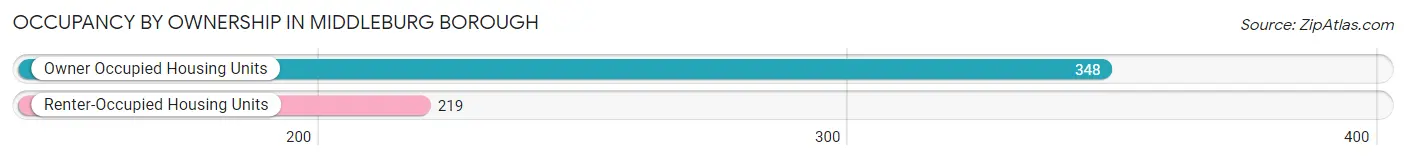
Occupancy by Ownership in Middleburg borough
Of the total 567 dwellings in Middleburg borough, owner-occupied units account for 348 (61.4%), while renter-occupied units make up 219 (38.6%).
| Occupancy | # Housing Units | % Housing Units |
| Owner Occupied Housing Units | 348 | 61.4% |
| Renter-Occupied Housing Units | 219 | 38.6% |
| Total Occupied Housing Units | 567 | 100.0% |
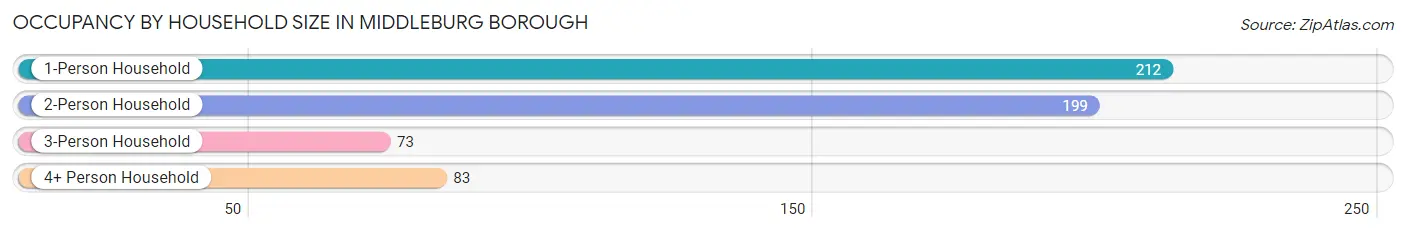
Occupancy by Household Size in Middleburg borough
| Household Size | # Housing Units | % Housing Units |
| 1-Person Household | 212 | 37.4% |
| 2-Person Household | 199 | 35.1% |
| 3-Person Household | 73 | 12.9% |
| 4+ Person Household | 83 | 14.6% |
| Total Housing Units | 567 | 100.0% |
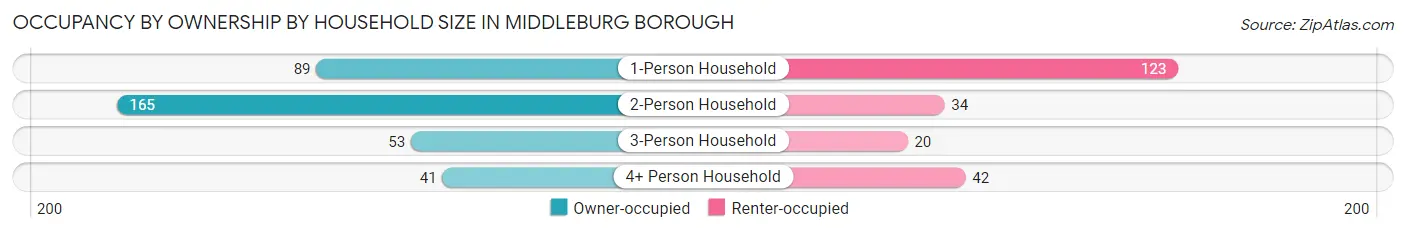
Occupancy by Ownership by Household Size in Middleburg borough
| Household Size | Owner-occupied | Renter-occupied |
| 1-Person Household | 89 (42.0%) | 123 (58.0%) |
| 2-Person Household | 165 (82.9%) | 34 (17.1%) |
| 3-Person Household | 53 (72.6%) | 20 (27.4%) |
| 4+ Person Household | 41 (49.4%) | 42 (50.6%) |
| Total Housing Units | 348 (61.4%) | 219 (38.6%) |
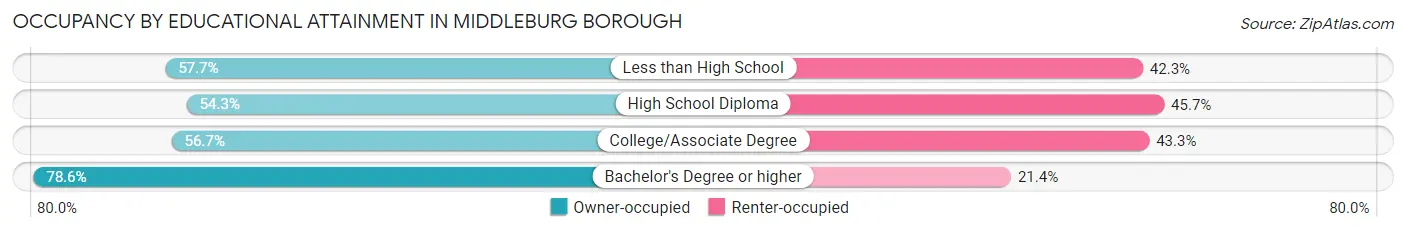
Occupancy by Educational Attainment in Middleburg borough
| Household Size | Owner-occupied | Renter-occupied |
| Less than High School | 30 (57.7%) | 22 (42.3%) |
| High School Diploma | 132 (54.3%) | 111 (45.7%) |
| College/Associate Degree | 72 (56.7%) | 55 (43.3%) |
| Bachelor's Degree or higher | 114 (78.6%) | 31 (21.4%) |
Occupancy by Age of Householder in Middleburg borough
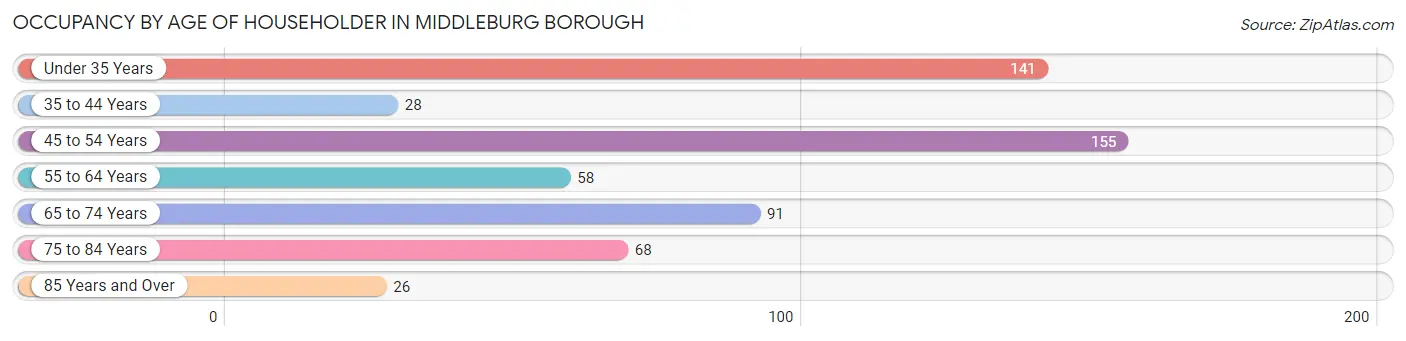
| Age Bracket | # Households | % Households |
| Under 35 Years | 141 | 24.9% |
| 35 to 44 Years | 28 | 4.9% |
| 45 to 54 Years | 155 | 27.3% |
| 55 to 64 Years | 58 | 10.2% |
| 65 to 74 Years | 91 | 16.1% |
| 75 to 84 Years | 68 | 12.0% |
| 85 Years and Over | 26 | 4.6% |
| Total | 567 | 100.0% |
Housing Finances in Middleburg borough
Median Income by Occupancy in Middleburg borough
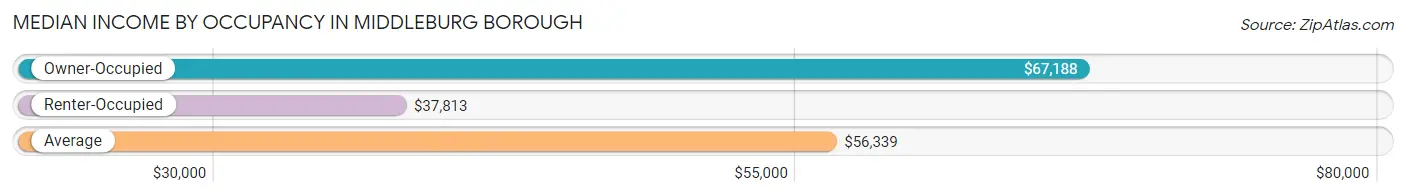
| Occupancy Type | # Households | Median Income |
| Owner-Occupied | 348 (61.4%) | $67,188 |
| Renter-Occupied | 219 (38.6%) | $37,813 |
| Average | 567 (100.0%) | $56,339 |
Occupancy by Householder Income Bracket in Middleburg borough
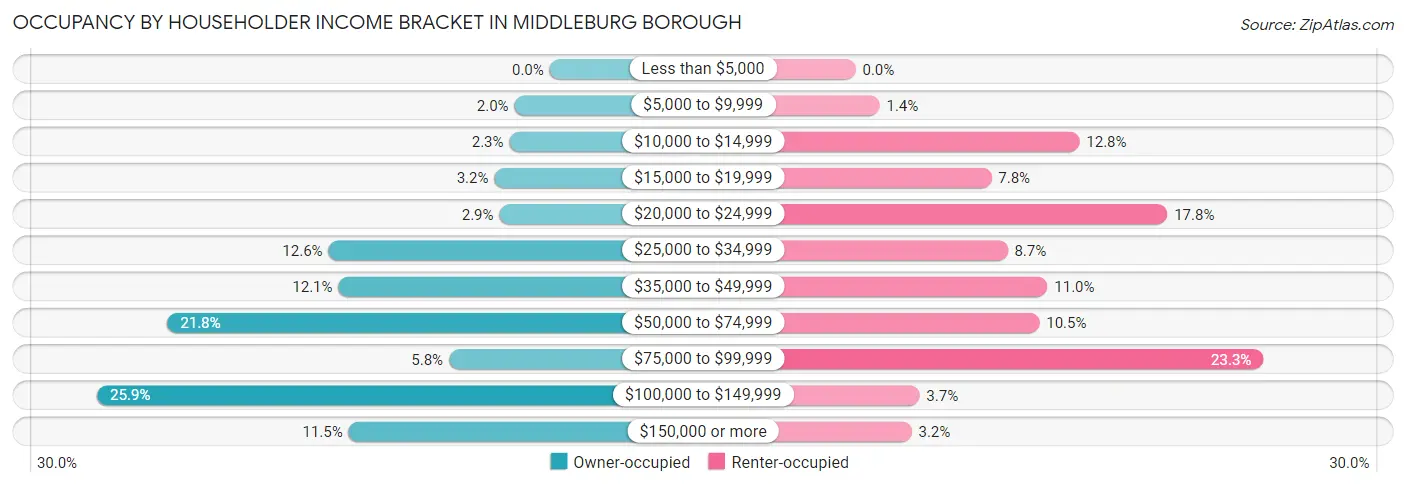
| Income Bracket | Owner-occupied | Renter-occupied |
| Less than $5,000 | 0 (0.0%) | 0 (0.0%) |
| $5,000 to $9,999 | 7 (2.0%) | 3 (1.4%) |
| $10,000 to $14,999 | 8 (2.3%) | 28 (12.8%) |
| $15,000 to $19,999 | 11 (3.2%) | 17 (7.8%) |
| $20,000 to $24,999 | 10 (2.9%) | 39 (17.8%) |
| $25,000 to $34,999 | 44 (12.6%) | 19 (8.7%) |
| $35,000 to $49,999 | 42 (12.1%) | 24 (11.0%) |
| $50,000 to $74,999 | 76 (21.8%) | 23 (10.5%) |
| $75,000 to $99,999 | 20 (5.8%) | 51 (23.3%) |
| $100,000 to $149,999 | 90 (25.9%) | 8 (3.6%) |
| $150,000 or more | 40 (11.5%) | 7 (3.2%) |
| Total | 348 (100.0%) | 219 (100.0%) |
Monthly Housing Cost Tiers in Middleburg borough
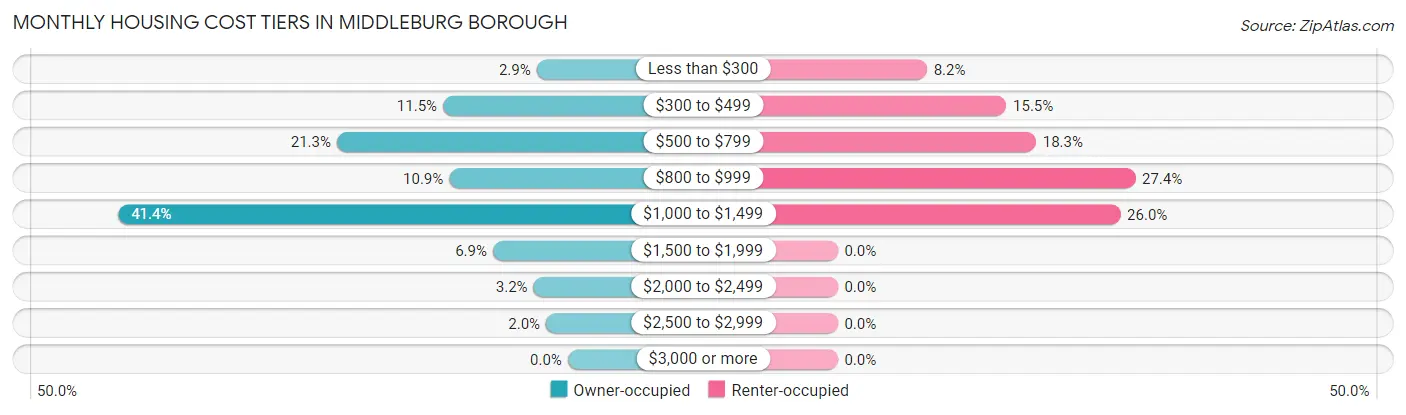
| Monthly Cost | Owner-occupied | Renter-occupied |
| Less than $300 | 10 (2.9%) | 18 (8.2%) |
| $300 to $499 | 40 (11.5%) | 34 (15.5%) |
| $500 to $799 | 74 (21.3%) | 40 (18.3%) |
| $800 to $999 | 38 (10.9%) | 60 (27.4%) |
| $1,000 to $1,499 | 144 (41.4%) | 57 (26.0%) |
| $1,500 to $1,999 | 24 (6.9%) | 0 (0.0%) |
| $2,000 to $2,499 | 11 (3.2%) | 0 (0.0%) |
| $2,500 to $2,999 | 7 (2.0%) | 0 (0.0%) |
| $3,000 or more | 0 (0.0%) | 0 (0.0%) |
| Total | 348 (100.0%) | 219 (100.0%) |
Physical Housing Characteristics in Middleburg borough
Housing Structures in Middleburg borough
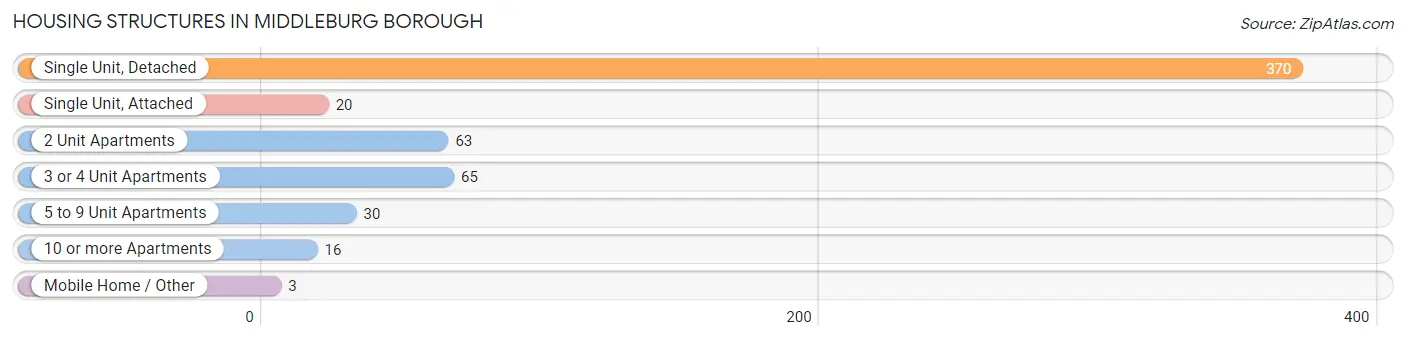
| Structure Type | # Housing Units | % Housing Units |
| Single Unit, Detached | 370 | 65.3% |
| Single Unit, Attached | 20 | 3.5% |
| 2 Unit Apartments | 63 | 11.1% |
| 3 or 4 Unit Apartments | 65 | 11.5% |
| 5 to 9 Unit Apartments | 30 | 5.3% |
| 10 or more Apartments | 16 | 2.8% |
| Mobile Home / Other | 3 | 0.5% |
| Total | 567 | 100.0% |
Housing Structures by Occupancy in Middleburg borough
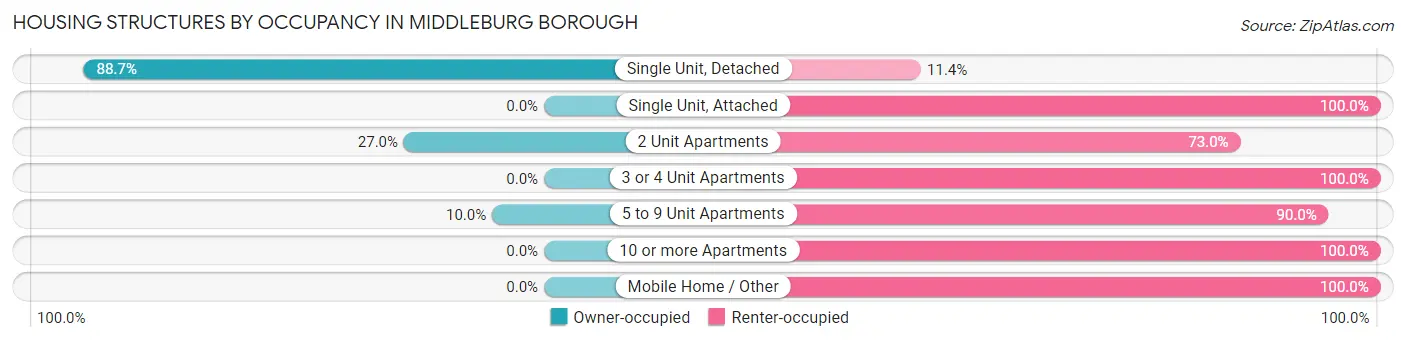
| Structure Type | Owner-occupied | Renter-occupied |
| Single Unit, Detached | 328 (88.6%) | 42 (11.4%) |
| Single Unit, Attached | 0 (0.0%) | 20 (100.0%) |
| 2 Unit Apartments | 17 (27.0%) | 46 (73.0%) |
| 3 or 4 Unit Apartments | 0 (0.0%) | 65 (100.0%) |
| 5 to 9 Unit Apartments | 3 (10.0%) | 27 (90.0%) |
| 10 or more Apartments | 0 (0.0%) | 16 (100.0%) |
| Mobile Home / Other | 0 (0.0%) | 3 (100.0%) |
| Total | 348 (61.4%) | 219 (38.6%) |
Housing Structures by Number of Rooms in Middleburg borough
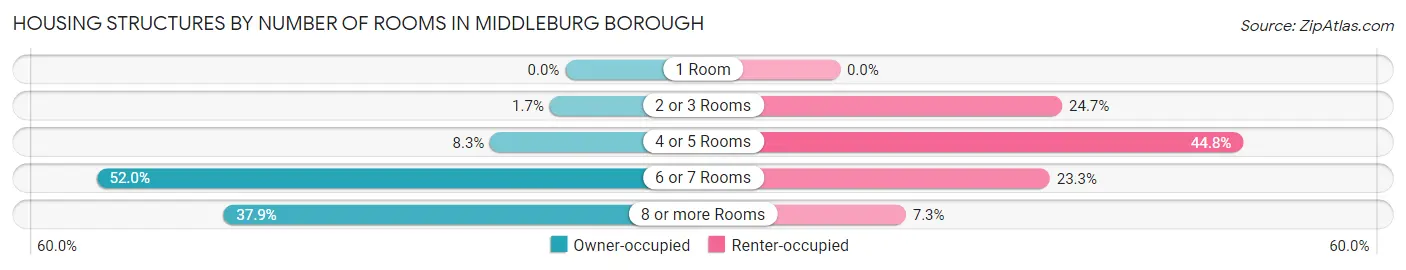
| Number of Rooms | Owner-occupied | Renter-occupied |
| 1 Room | 0 (0.0%) | 0 (0.0%) |
| 2 or 3 Rooms | 6 (1.7%) | 54 (24.7%) |
| 4 or 5 Rooms | 29 (8.3%) | 98 (44.8%) |
| 6 or 7 Rooms | 181 (52.0%) | 51 (23.3%) |
| 8 or more Rooms | 132 (37.9%) | 16 (7.3%) |
| Total | 348 (100.0%) | 219 (100.0%) |
Housing Structure by Heating Type in Middleburg borough
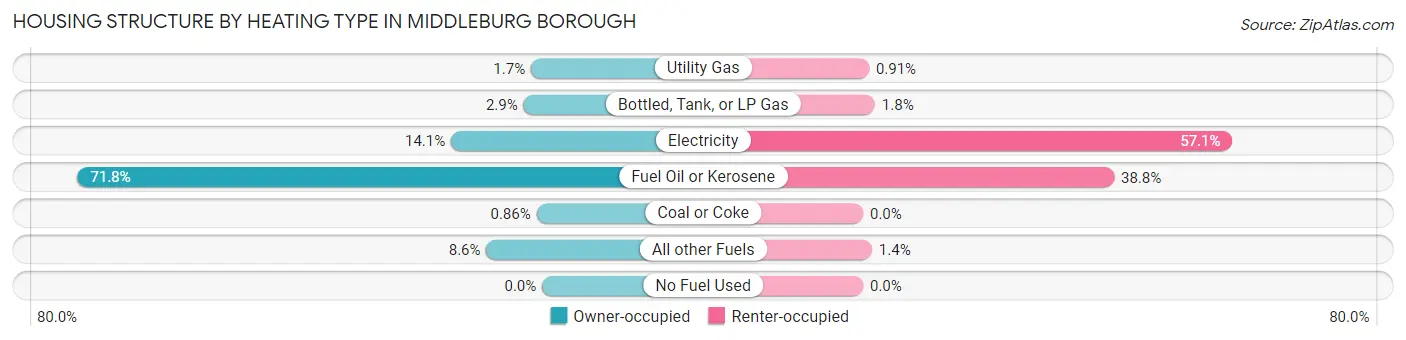
| Heating Type | Owner-occupied | Renter-occupied |
| Utility Gas | 6 (1.7%) | 2 (0.9%) |
| Bottled, Tank, or LP Gas | 10 (2.9%) | 4 (1.8%) |
| Electricity | 49 (14.1%) | 125 (57.1%) |
| Fuel Oil or Kerosene | 250 (71.8%) | 85 (38.8%) |
| Coal or Coke | 3 (0.9%) | 0 (0.0%) |
| All other Fuels | 30 (8.6%) | 3 (1.4%) |
| No Fuel Used | 0 (0.0%) | 0 (0.0%) |
| Total | 348 (100.0%) | 219 (100.0%) |
Household Vehicle Usage in Middleburg borough
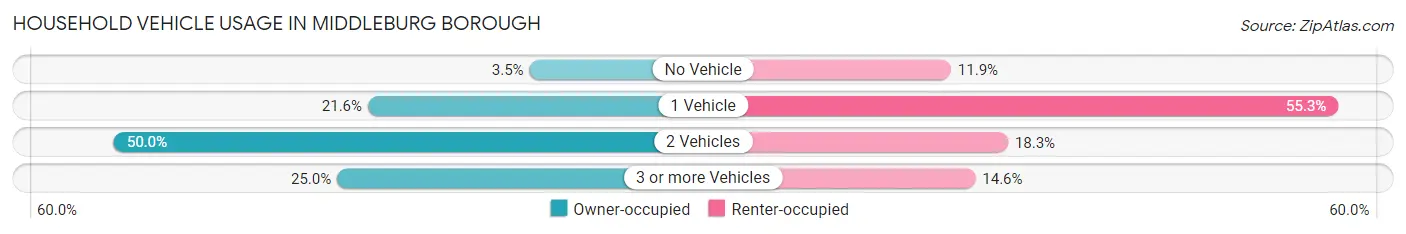
| Vehicles per Household | Owner-occupied | Renter-occupied |
| No Vehicle | 12 (3.5%) | 26 (11.9%) |
| 1 Vehicle | 75 (21.5%) | 121 (55.2%) |
| 2 Vehicles | 174 (50.0%) | 40 (18.3%) |
| 3 or more Vehicles | 87 (25.0%) | 32 (14.6%) |
| Total | 348 (100.0%) | 219 (100.0%) |
Real Estate & Mortgages in Middleburg borough
Real Estate and Mortgage Overview in Middleburg borough
| Characteristic | Without Mortgage | With Mortgage |
| Housing Units | 119 | 229 |
| Median Property Value | $169,100 | $149,500 |
| Median Household Income | $42,250 | $28 |
| Monthly Housing Costs | $559 | $0 |
| Real Estate Taxes | $2,163 | $8 |
Property Value by Mortgage Status in Middleburg borough
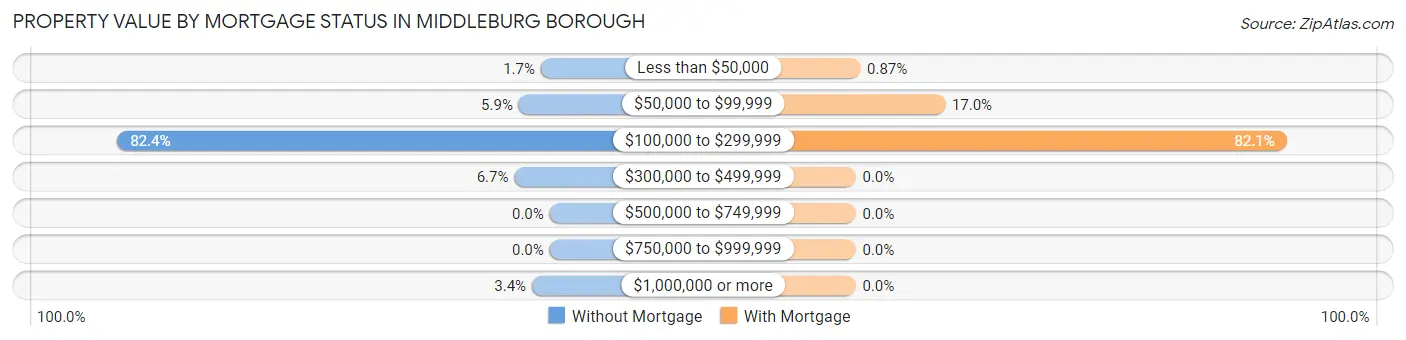
| Property Value | Without Mortgage | With Mortgage |
| Less than $50,000 | 2 (1.7%) | 2 (0.9%) |
| $50,000 to $99,999 | 7 (5.9%) | 39 (17.0%) |
| $100,000 to $299,999 | 98 (82.4%) | 188 (82.1%) |
| $300,000 to $499,999 | 8 (6.7%) | 0 (0.0%) |
| $500,000 to $749,999 | 0 (0.0%) | 0 (0.0%) |
| $750,000 to $999,999 | 0 (0.0%) | 0 (0.0%) |
| $1,000,000 or more | 4 (3.4%) | 0 (0.0%) |
| Total | 119 (100.0%) | 229 (100.0%) |
Household Income by Mortgage Status in Middleburg borough
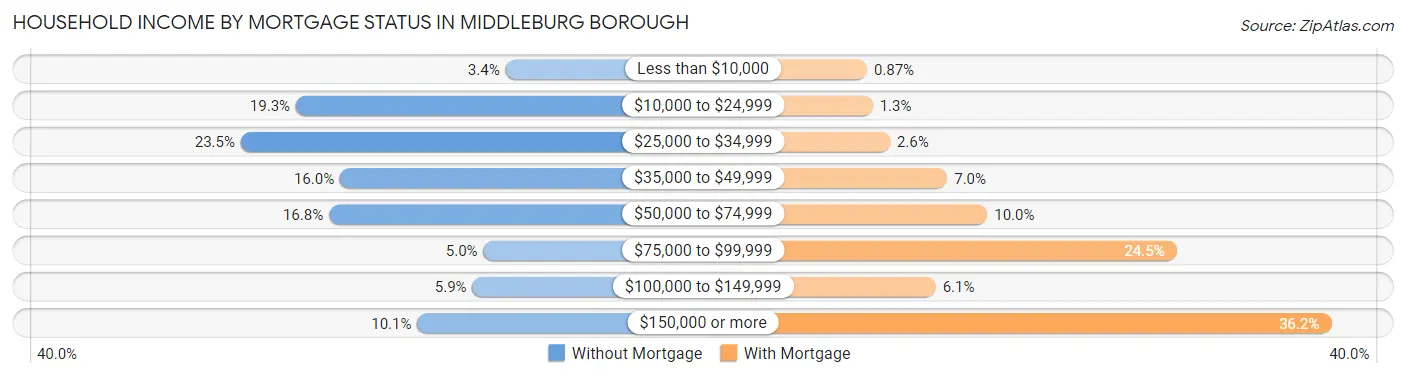
| Household Income | Without Mortgage | With Mortgage |
| Less than $10,000 | 4 (3.4%) | 2 (0.9%) |
| $10,000 to $24,999 | 23 (19.3%) | 3 (1.3%) |
| $25,000 to $34,999 | 28 (23.5%) | 6 (2.6%) |
| $35,000 to $49,999 | 19 (16.0%) | 16 (7.0%) |
| $50,000 to $74,999 | 20 (16.8%) | 23 (10.0%) |
| $75,000 to $99,999 | 6 (5.0%) | 56 (24.4%) |
| $100,000 to $149,999 | 7 (5.9%) | 14 (6.1%) |
| $150,000 or more | 12 (10.1%) | 83 (36.2%) |
| Total | 119 (100.0%) | 229 (100.0%) |
Property Value to Household Income Ratio in Middleburg borough
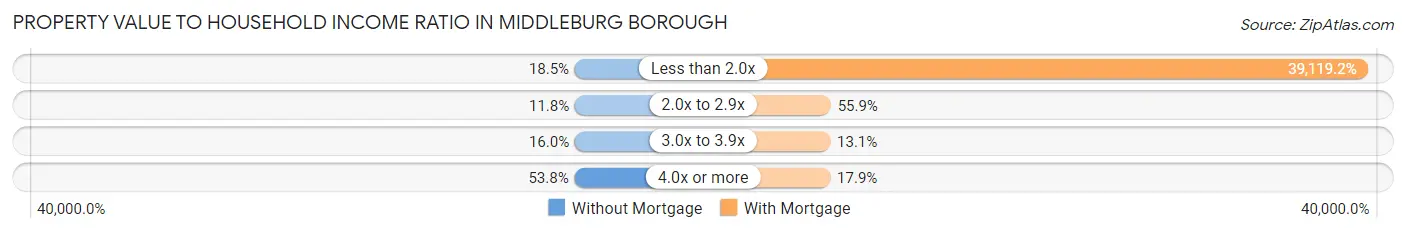
| Value-to-Income Ratio | Without Mortgage | With Mortgage |
| Less than 2.0x | 22 (18.5%) | 89,583 (39,119.2%) |
| 2.0x to 2.9x | 14 (11.8%) | 128 (55.9%) |
| 3.0x to 3.9x | 19 (16.0%) | 30 (13.1%) |
| 4.0x or more | 64 (53.8%) | 41 (17.9%) |
| Total | 119 (100.0%) | 229 (100.0%) |
Real Estate Taxes by Mortgage Status in Middleburg borough
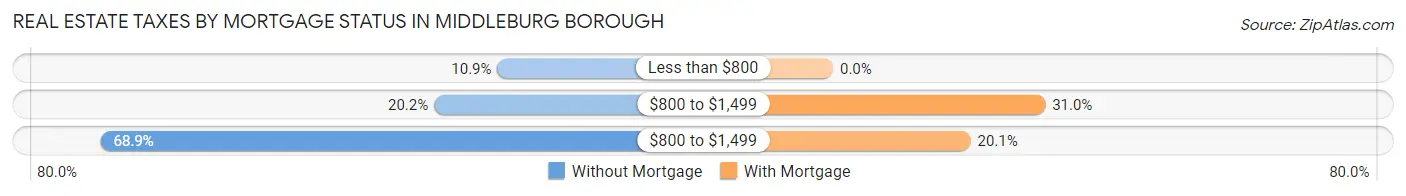
| Property Taxes | Without Mortgage | With Mortgage |
| Less than $800 | 13 (10.9%) | 0 (0.0%) |
| $800 to $1,499 | 24 (20.2%) | 71 (31.0%) |
| $800 to $1,499 | 82 (68.9%) | 46 (20.1%) |
| Total | 119 (100.0%) | 229 (100.0%) |
Health & Disability in Middleburg borough
Health Insurance Coverage by Age in Middleburg borough
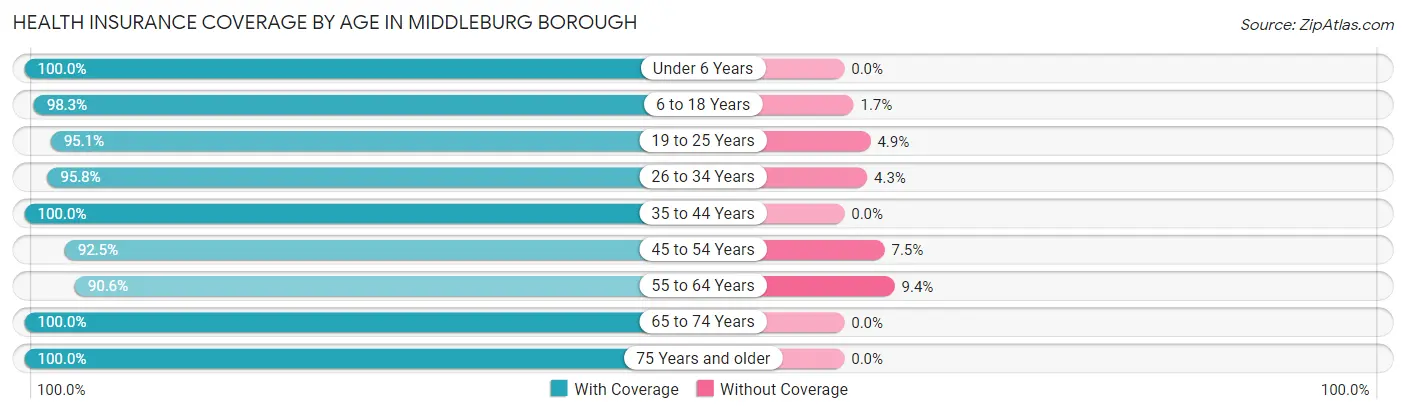
| Age Bracket | With Coverage | Without Coverage |
| Under 6 Years | 91 (100.0%) | 0 (0.0%) |
| 6 to 18 Years | 229 (98.3%) | 4 (1.7%) |
| 19 to 25 Years | 78 (95.1%) | 4 (4.9%) |
| 26 to 34 Years | 203 (95.8%) | 9 (4.3%) |
| 35 to 44 Years | 73 (100.0%) | 0 (0.0%) |
| 45 to 54 Years | 222 (92.5%) | 18 (7.5%) |
| 55 to 64 Years | 116 (90.6%) | 12 (9.4%) |
| 65 to 74 Years | 121 (100.0%) | 0 (0.0%) |
| 75 Years and older | 134 (100.0%) | 0 (0.0%) |
| Total | 1,267 (96.4%) | 47 (3.6%) |
Health Insurance Coverage by Citizenship Status in Middleburg borough
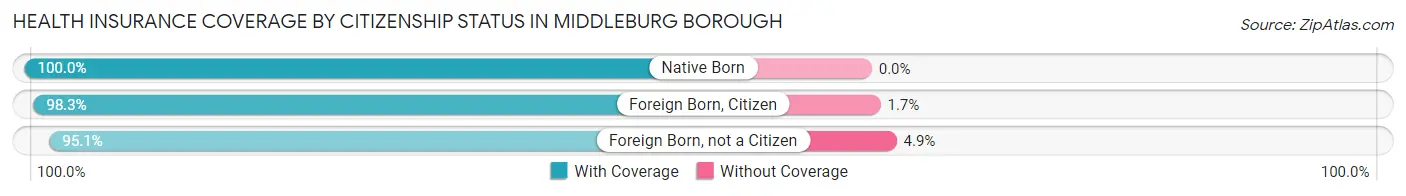
| Citizenship Status | With Coverage | Without Coverage |
| Native Born | 91 (100.0%) | 0 (0.0%) |
| Foreign Born, Citizen | 229 (98.3%) | 4 (1.7%) |
| Foreign Born, not a Citizen | 78 (95.1%) | 4 (4.9%) |
Health Insurance Coverage by Household Income in Middleburg borough
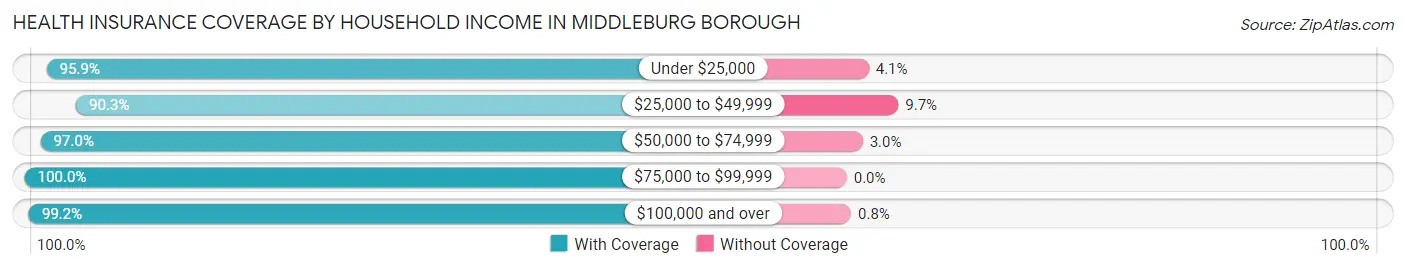
| Household Income | With Coverage | Without Coverage |
| Under $25,000 | 163 (95.9%) | 7 (4.1%) |
| $25,000 to $49,999 | 215 (90.3%) | 23 (9.7%) |
| $50,000 to $74,999 | 326 (97.0%) | 10 (3.0%) |
| $75,000 to $99,999 | 179 (100.0%) | 0 (0.0%) |
| $100,000 and over | 374 (99.2%) | 3 (0.8%) |
Public vs Private Health Insurance Coverage by Age in Middleburg borough
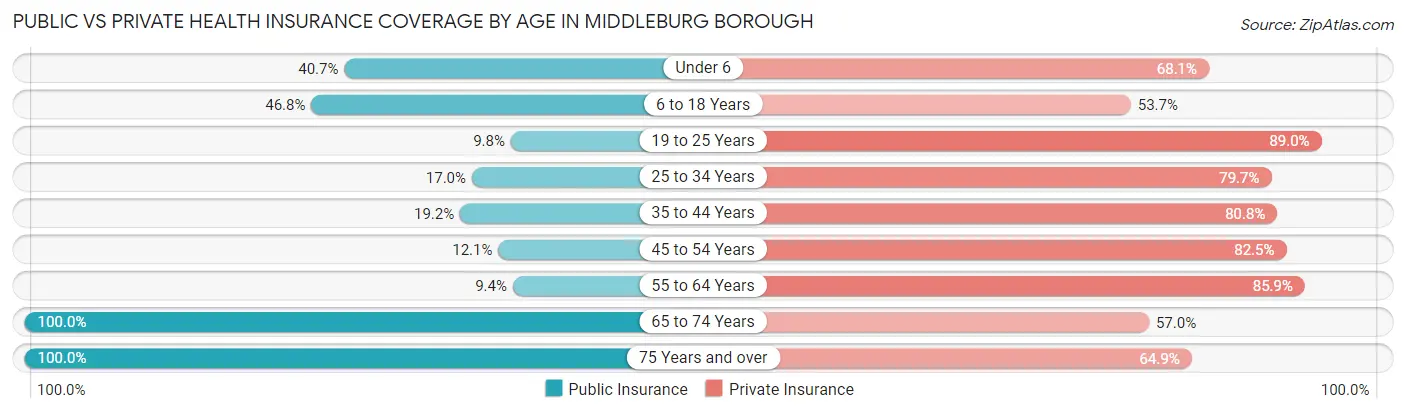
| Age Bracket | Public Insurance | Private Insurance |
| Under 6 | 37 (40.7%) | 62 (68.1%) |
| 6 to 18 Years | 109 (46.8%) | 125 (53.6%) |
| 19 to 25 Years | 8 (9.8%) | 73 (89.0%) |
| 25 to 34 Years | 36 (17.0%) | 169 (79.7%) |
| 35 to 44 Years | 14 (19.2%) | 59 (80.8%) |
| 45 to 54 Years | 29 (12.1%) | 198 (82.5%) |
| 55 to 64 Years | 12 (9.4%) | 110 (85.9%) |
| 65 to 74 Years | 121 (100.0%) | 69 (57.0%) |
| 75 Years and over | 134 (100.0%) | 87 (64.9%) |
| Total | 500 (38.1%) | 952 (72.5%) |
Disability Status by Sex by Age in Middleburg borough
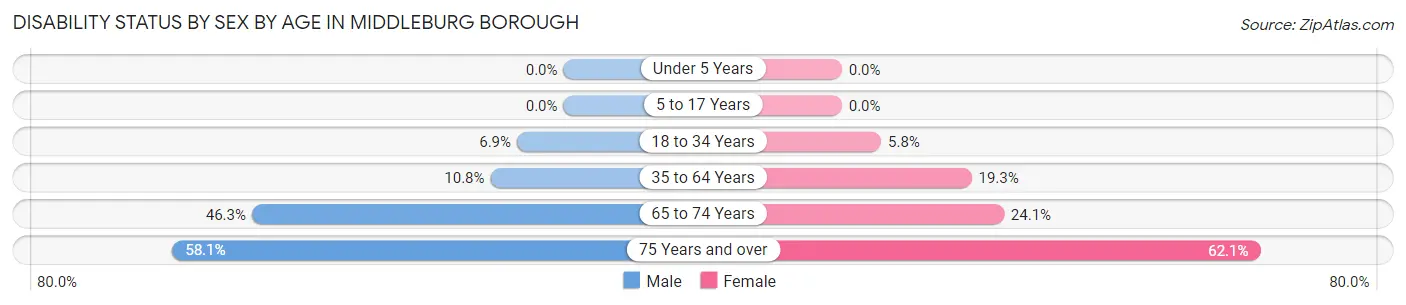
| Age Bracket | Male | Female |
| Under 5 Years | 0 (0.0%) | 0 (0.0%) |
| 5 to 17 Years | 0 (0.0%) | 0 (0.0%) |
| 18 to 34 Years | 12 (6.9%) | 9 (5.8%) |
| 35 to 64 Years | 27 (10.8%) | 37 (19.3%) |
| 65 to 74 Years | 31 (46.3%) | 13 (24.1%) |
| 75 Years and over | 18 (58.1%) | 64 (62.1%) |
Disability Class by Sex by Age in Middleburg borough
Disability Class: Hearing Difficulty
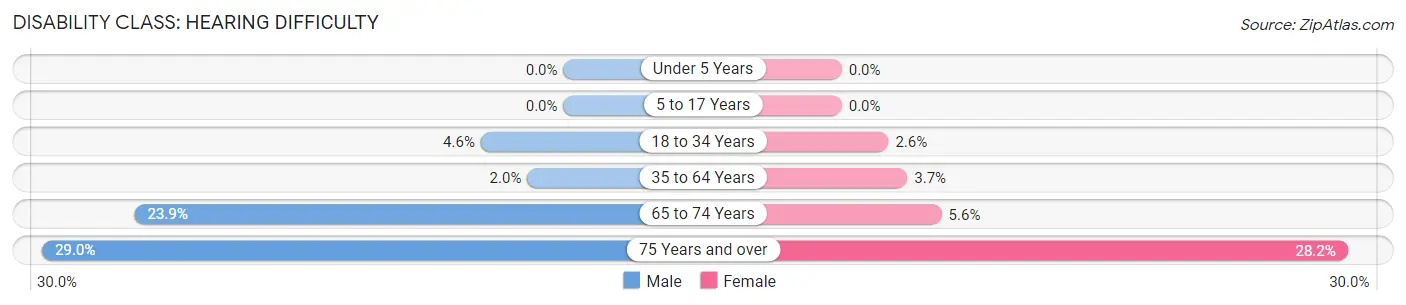
| Age Bracket | Male | Female |
| Under 5 Years | 0 (0.0%) | 0 (0.0%) |
| 5 to 17 Years | 0 (0.0%) | 0 (0.0%) |
| 18 to 34 Years | 8 (4.6%) | 4 (2.6%) |
| 35 to 64 Years | 5 (2.0%) | 7 (3.6%) |
| 65 to 74 Years | 16 (23.9%) | 3 (5.6%) |
| 75 Years and over | 9 (29.0%) | 29 (28.2%) |
Disability Class: Vision Difficulty
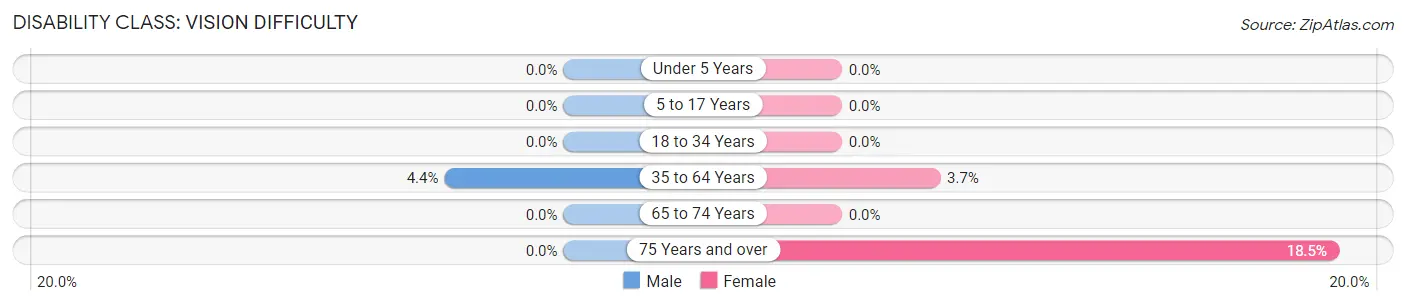
| Age Bracket | Male | Female |
| Under 5 Years | 0 (0.0%) | 0 (0.0%) |
| 5 to 17 Years | 0 (0.0%) | 0 (0.0%) |
| 18 to 34 Years | 0 (0.0%) | 0 (0.0%) |
| 35 to 64 Years | 11 (4.4%) | 7 (3.6%) |
| 65 to 74 Years | 0 (0.0%) | 0 (0.0%) |
| 75 Years and over | 0 (0.0%) | 19 (18.4%) |
Disability Class: Cognitive Difficulty
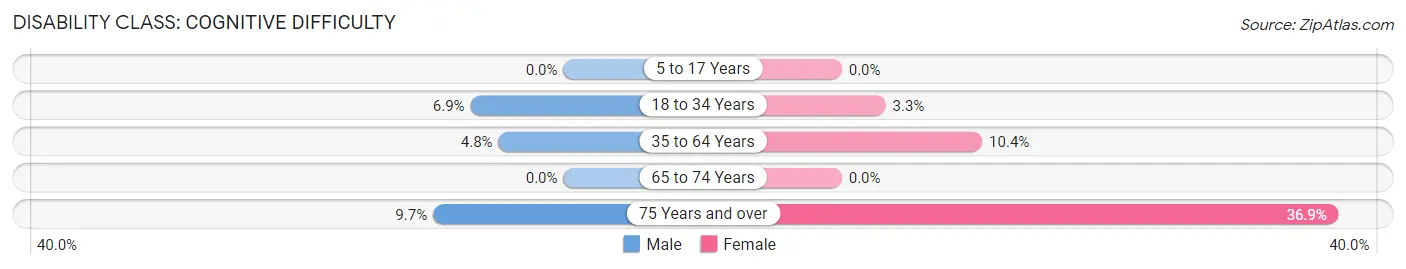
| Age Bracket | Male | Female |
| 5 to 17 Years | 0 (0.0%) | 0 (0.0%) |
| 18 to 34 Years | 12 (6.9%) | 5 (3.3%) |
| 35 to 64 Years | 12 (4.8%) | 20 (10.4%) |
| 65 to 74 Years | 0 (0.0%) | 0 (0.0%) |
| 75 Years and over | 3 (9.7%) | 38 (36.9%) |
Disability Class: Ambulatory Difficulty
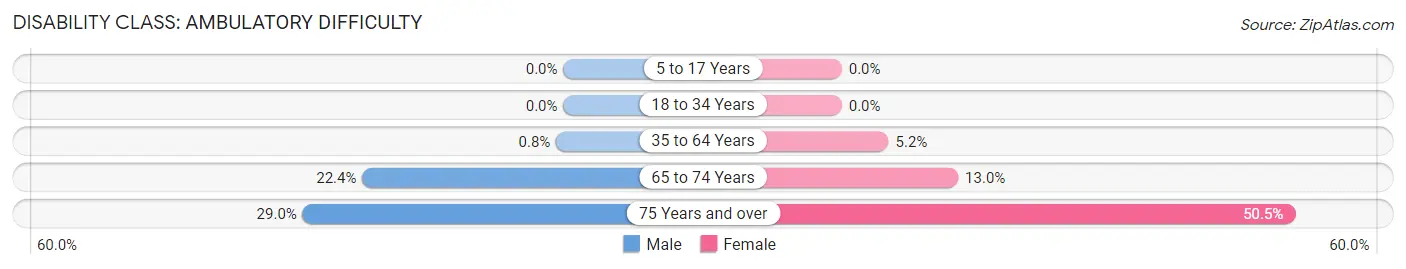
| Age Bracket | Male | Female |
| 5 to 17 Years | 0 (0.0%) | 0 (0.0%) |
| 18 to 34 Years | 0 (0.0%) | 0 (0.0%) |
| 35 to 64 Years | 2 (0.8%) | 10 (5.2%) |
| 65 to 74 Years | 15 (22.4%) | 7 (13.0%) |
| 75 Years and over | 9 (29.0%) | 52 (50.5%) |
Disability Class: Self-Care Difficulty
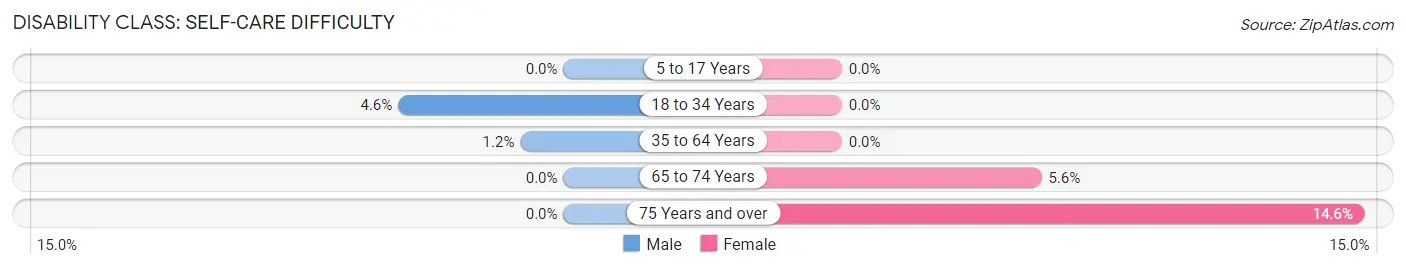
| Age Bracket | Male | Female |
| 5 to 17 Years | 0 (0.0%) | 0 (0.0%) |
| 18 to 34 Years | 8 (4.6%) | 0 (0.0%) |
| 35 to 64 Years | 3 (1.2%) | 0 (0.0%) |
| 65 to 74 Years | 0 (0.0%) | 3 (5.6%) |
| 75 Years and over | 0 (0.0%) | 15 (14.6%) |
Technology Access in Middleburg borough
Computing Device Access in Middleburg borough
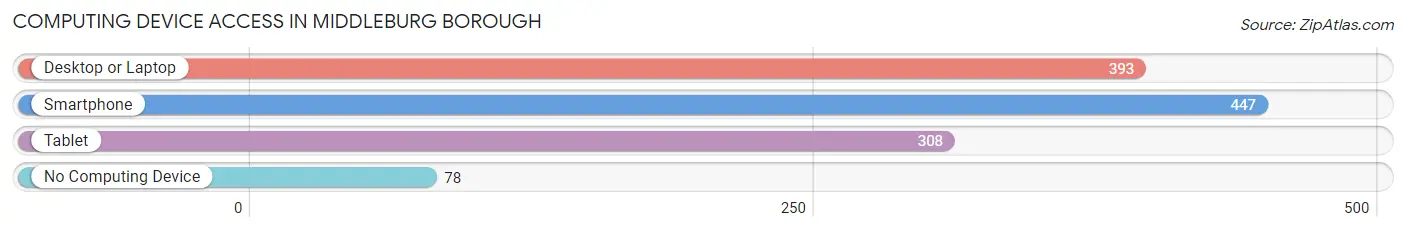
| Device Type | # Households | % Households |
| Desktop or Laptop | 393 | 69.3% |
| Smartphone | 447 | 78.8% |
| Tablet | 308 | 54.3% |
| No Computing Device | 78 | 13.8% |
| Total | 567 | 100.0% |
Internet Access in Middleburg borough
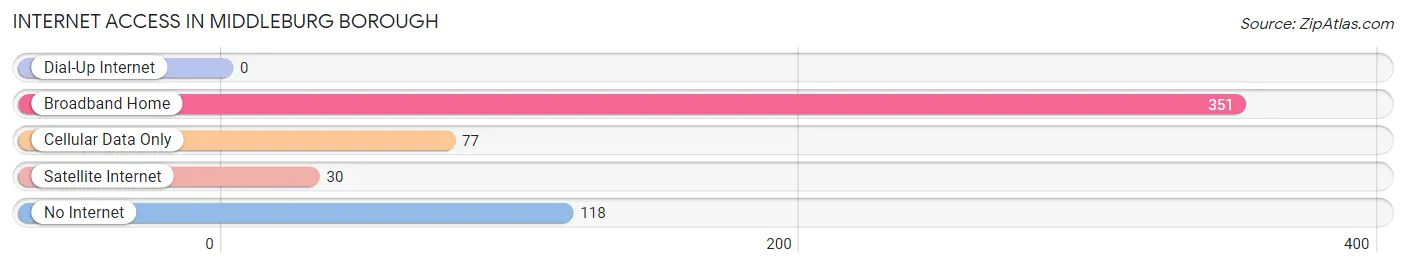
| Internet Type | # Households | % Households |
| Dial-Up Internet | 0 | 0.0% |
| Broadband Home | 351 | 61.9% |
| Cellular Data Only | 77 | 13.6% |
| Satellite Internet | 30 | 5.3% |
| No Internet | 118 | 20.8% |
| Total | 567 | 100.0% |
Middleburg borough Summary
Introduction
Middleburg Borough is a small borough located in Snyder County, Pennsylvania. It is situated in the Susquehanna Valley, approximately 10 miles south of Selinsgrove and 15 miles north of Lewisburg. The borough is home to a population of 1,717 people, according to the 2010 census. The borough is known for its historic buildings, quaint downtown, and its proximity to the Susquehanna River.
History
Middleburg Borough was founded in 1797 by a group of settlers from the German Reformed Church. The settlers named the town after the Middle Creek, which runs through the area. The town was officially incorporated in 1845.
In the early 19th century, Middleburg was a thriving agricultural community. The town was home to several mills, including a grist mill, a saw mill, and a woolen mill. The town also had a tannery, a blacksmith shop, and a general store.
In the late 19th century, the town began to decline as the railroad bypassed it. The town was further impacted by the Great Depression and World War II. However, in the 1950s, the town began to experience a resurgence as people began to move back to the area.
Geography
Middleburg Borough is located in Snyder County, Pennsylvania. It is situated in the Susquehanna Valley, approximately 10 miles south of Selinsgrove and 15 miles north of Lewisburg. The borough is bordered by Middle Creek to the north, the Susquehanna River to the east, and the Middle Creek Valley to the south.
The borough has a total area of 0.7 square miles, all of which is land. The borough is located at an elevation of 545 feet above sea level.
Economy
The economy of Middleburg Borough is largely based on agriculture and tourism. The borough is home to several farms, including dairy farms, beef farms, and vegetable farms. The borough is also home to several wineries and breweries.
The borough is also home to several small businesses, including restaurants, antique shops, and gift shops. The borough is also home to several bed and breakfasts, which attract tourists from all over the region.
Demographics
According to the 2010 census, the population of Middleburg Borough was 1,717. The racial makeup of the borough was 97.3% White, 0.9% African American, 0.2% Native American, 0.3% Asian, 0.1% Pacific Islander, 0.3% from other races, and 0.9% from two or more races. Hispanic or Latino of any race were 1.2% of the population.
The median household income in the borough was $41,250, and the median family income was $50,000. The per capita income for the borough was $20,945. About 8.3% of families and 10.2% of the population were below the poverty line, including 14.3% of those under age 18 and 8.2% of those age 65 or over.
Conclusion
Middleburg Borough is a small borough located in Snyder County, Pennsylvania. It is situated in the Susquehanna Valley, approximately 10 miles south of Selinsgrove and 15 miles north of Lewisburg. The borough is home to a population of 1,717 people, according to the 2010 census. The borough is known for its historic buildings, quaint downtown, and its proximity to the Susquehanna River. The economy of Middleburg Borough is largely based on agriculture and tourism. The racial makeup of the borough was 97.3% White, 0.9% African American, 0.2% Native American, 0.3% Asian, 0.1% Pacific Islander, 0.3% from other races, and 0.9% from two or more races. The median household income in the borough was $41,250, and the median family income was $50,000.
Common Questions
What is Per Capita Income in Middleburg borough?
Per Capita income in Middleburg borough is $33,341.
What is the Median Family Income in Middleburg borough?
Median Family Income in Middleburg borough is $73,125.
What is the Median Household income in Middleburg borough?
Median Household Income in Middleburg borough is $56,339.
What is Income or Wage Gap in Middleburg borough?
Income or Wage Gap in Middleburg borough is 25.2%.
Women in Middleburg borough earn 74.8 cents for every dollar earned by a man.
What is Inequality or Gini Index in Middleburg borough?
Inequality or Gini Index in Middleburg borough is 0.42.
What is the Total Population of Middleburg borough?
Total Population of Middleburg borough is 1,329.
What is the Total Male Population of Middleburg borough?
Total Male Population of Middleburg borough is 685.
What is the Total Female Population of Middleburg borough?
Total Female Population of Middleburg borough is 644.
What is the Ratio of Males per 100 Females in Middleburg borough?
There are 106.37 Males per 100 Females in Middleburg borough.
What is the Ratio of Females per 100 Males in Middleburg borough?
There are 94.01 Females per 100 Males in Middleburg borough.
What is the Median Population Age in Middleburg borough?
Median Population Age in Middleburg borough is 39.1 Years.
What is the Average Family Size in Middleburg borough
Average Family Size in Middleburg borough is 3.4 People.
What is the Average Household Size in Middleburg borough
Average Household Size in Middleburg borough is 2.3 People.
How Large is the Labor Force in Middleburg borough?
There are 719 People in the Labor Forcein in Middleburg borough.
What is the Percentage of People in the Labor Force in Middleburg borough?
67.8% of People are in the Labor Force in Middleburg borough.
What is the Unemployment Rate in Middleburg borough?
Unemployment Rate in Middleburg borough is 2.6%.