Zip Codes with the Highest Poverty Level Among Children Under the Age of 5 in Ohio
RELATED REPORTS & OPTIONS
Highest Poverty | Child 0-5
Ohio
Compare Zip Codes
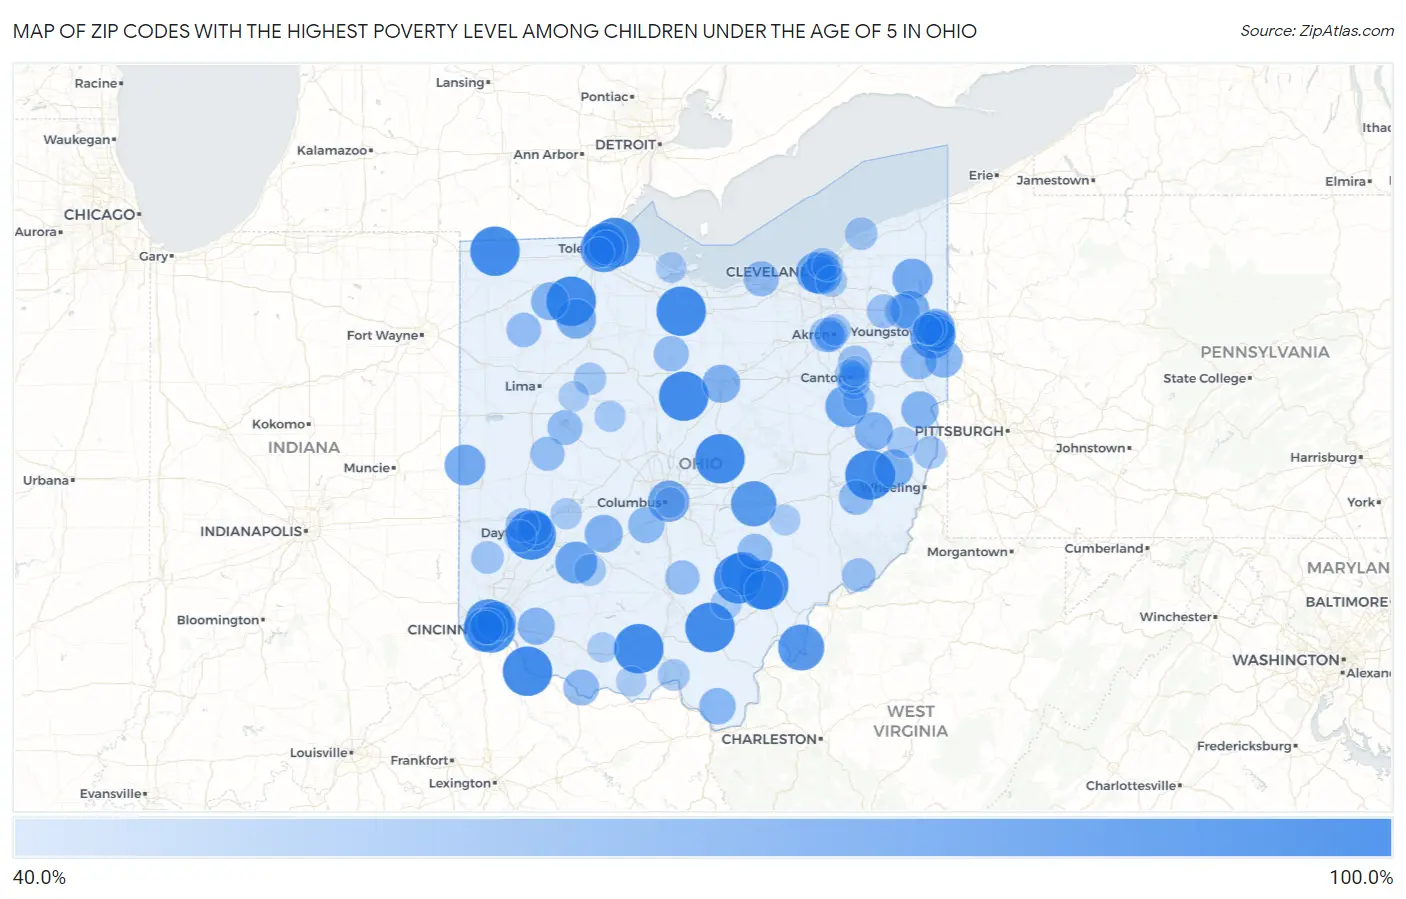
Map of Zip Codes with the Highest Poverty Level Among Children Under the Age of 5 in Ohio
40.0%
100.0%
Zip Codes with the Highest Poverty Level Among Children Under the Age of 5 in Ohio
| Zip Code | Child Poverty | vs State | vs National | |
| 1. | 45719 | 100.0% | 20.7%(+79.3)#1 | 18.1%(+81.9)#107 |
| 2. | 43983 | 100.0% | 20.7%(+79.3)#2 | 18.1%(+81.9)#221 |
| 3. | 45671 | 100.0% | 20.7%(+79.3)#3 | 18.1%(+81.9)#258 |
| 4. | 43158 | 100.0% | 20.7%(+79.3)#4 | 18.1%(+81.9)#279 |
| 5. | 45621 | 100.0% | 20.7%(+79.3)#5 | 18.1%(+81.9)#314 |
| 6. | 45469 | 100.0% | 20.7%(+79.3)#6 | 18.1%(+81.9)#407 |
| 7. | 43027 | 100.0% | 20.7%(+79.3)#7 | 18.1%(+81.9)#412 |
| 8. | 43531 | 100.0% | 20.7%(+79.3)#8 | 18.1%(+81.9)#422 |
| 9. | 43541 | 100.0% | 20.7%(+79.3)#9 | 18.1%(+81.9)#427 |
| 10. | 44828 | 100.0% | 20.7%(+79.3)#10 | 18.1%(+81.9)#430 |
| 11. | 43434 | 100.0% | 20.7%(+79.3)#11 | 18.1%(+81.9)#488 |
| 12. | 43325 | 100.0% | 20.7%(+79.3)#12 | 18.1%(+81.9)#523 |
| 13. | 45156 | 100.0% | 20.7%(+79.3)#13 | 18.1%(+81.9)#540 |
| 14. | 45203 | 95.5% | 20.7%(+74.9)#14 | 18.1%(+77.5)#575 |
| 15. | 43604 | 93.0% | 20.7%(+72.3)#15 | 18.1%(+74.9)#600 |
| 16. | 45225 | 92.6% | 20.7%(+71.9)#16 | 18.1%(+74.5)#606 |
| 17. | 45770 | 90.8% | 20.7%(+70.1)#17 | 18.1%(+72.7)#628 |
| 18. | 43740 | 88.9% | 20.7%(+68.2)#18 | 18.1%(+70.8)#647 |
| 19. | 44507 | 86.9% | 20.7%(+66.3)#19 | 18.1%(+68.9)#675 |
| 20. | 43608 | 85.7% | 20.7%(+65.1)#20 | 18.1%(+67.7)#690 |
| 21. | 45204 | 84.6% | 20.7%(+64.0)#21 | 18.1%(+66.6)#713 |
| 22. | 43127 | 84.4% | 20.7%(+63.7)#22 | 18.1%(+66.3)#724 |
| 23. | 44502 | 82.4% | 20.7%(+61.7)#23 | 18.1%(+64.3)#759 |
| 24. | 45164 | 80.0% | 20.7%(+59.3)#24 | 18.1%(+61.9)#820 |
| 25. | 44697 | 80.0% | 20.7%(+59.3)#25 | 18.1%(+61.9)#822 |
| 26. | 44104 | 78.3% | 20.7%(+57.6)#26 | 18.1%(+60.2)#863 |
| 27. | 43203 | 78.2% | 20.7%(+57.5)#27 | 18.1%(+60.1)#865 |
| 28. | 45390 | 76.9% | 20.7%(+56.3)#28 | 18.1%(+58.9)#899 |
| 29. | 44115 | 76.7% | 20.7%(+56.0)#29 | 18.1%(+58.6)#909 |
| 30. | 44450 | 75.8% | 20.7%(+55.1)#30 | 18.1%(+57.7)#933 |
| 31. | 43529 | 74.3% | 20.7%(+53.6)#31 | 18.1%(+56.2)#996 |
| 32. | 45229 | 73.3% | 20.7%(+52.6)#32 | 18.1%(+55.2)#1,040 |
| 33. | 45780 | 72.6% | 20.7%(+52.0)#33 | 18.1%(+54.6)#1,061 |
| 34. | 44485 | 72.0% | 20.7%(+51.3)#34 | 18.1%(+53.9)#1,091 |
| 35. | 43981 | 71.4% | 20.7%(+50.8)#35 | 18.1%(+53.4)#1,102 |
| 36. | 45403 | 70.1% | 20.7%(+49.5)#36 | 18.1%(+52.1)#1,142 |
| 37. | 44695 | 70.0% | 20.7%(+49.3)#37 | 18.1%(+51.9)#1,144 |
| 38. | 44902 | 69.9% | 20.7%(+49.3)#38 | 18.1%(+51.9)#1,151 |
| 39. | 43153 | 69.8% | 20.7%(+49.1)#39 | 18.1%(+51.7)#1,156 |
| 40. | 43535 | 69.2% | 20.7%(+48.6)#40 | 18.1%(+51.2)#1,182 |
| 41. | 44454 | 69.2% | 20.7%(+48.6)#41 | 18.1%(+51.2)#1,183 |
| 42. | 44506 | 68.8% | 20.7%(+48.1)#42 | 18.1%(+50.7)#1,201 |
| 43. | 43930 | 68.4% | 20.7%(+47.8)#43 | 18.1%(+50.4)#1,213 |
| 44. | 44127 | 68.2% | 20.7%(+47.5)#44 | 18.1%(+50.1)#1,221 |
| 45. | 44505 | 68.2% | 20.7%(+47.5)#45 | 18.1%(+50.1)#1,222 |
| 46. | 45160 | 67.4% | 20.7%(+46.8)#46 | 18.1%(+49.4)#1,258 |
| 47. | 45645 | 65.7% | 20.7%(+45.0)#47 | 18.1%(+47.6)#1,356 |
| 48. | 44490 | 65.2% | 20.7%(+44.5)#48 | 18.1%(+47.2)#1,372 |
| 49. | 45214 | 65.0% | 20.7%(+44.4)#49 | 18.1%(+47.0)#1,379 |
| 50. | 43126 | 65.0% | 20.7%(+44.3)#50 | 18.1%(+46.9)#1,381 |
| 51. | 45101 | 64.3% | 20.7%(+43.6)#51 | 18.1%(+46.2)#1,424 |
| 52. | 44052 | 62.6% | 20.7%(+41.9)#52 | 18.1%(+44.5)#1,520 |
| 53. | 44825 | 62.5% | 20.7%(+41.8)#53 | 18.1%(+44.4)#1,536 |
| 54. | 43348 | 62.0% | 20.7%(+41.4)#54 | 18.1%(+44.0)#1,556 |
| 55. | 43782 | 61.9% | 20.7%(+41.2)#55 | 18.1%(+43.8)#1,565 |
| 56. | 43773 | 61.5% | 20.7%(+40.9)#56 | 18.1%(+43.5)#1,587 |
| 57. | 44430 | 61.2% | 20.7%(+40.5)#57 | 18.1%(+43.1)#1,615 |
| 58. | 45831 | 60.8% | 20.7%(+40.1)#58 | 18.1%(+42.7)#1,635 |
| 59. | 45644 | 60.3% | 20.7%(+39.6)#59 | 18.1%(+42.2)#1,660 |
| 60. | 43605 | 60.1% | 20.7%(+39.5)#60 | 18.1%(+42.1)#1,664 |
| 61. | 45353 | 60.0% | 20.7%(+39.3)#61 | 18.1%(+41.9)#1,705 |
| 62. | 44320 | 59.9% | 20.7%(+39.2)#62 | 18.1%(+41.9)#1,708 |
| 63. | 44405 | 59.6% | 20.7%(+38.9)#63 | 18.1%(+41.5)#1,720 |
| 64. | 44652 | 59.3% | 20.7%(+38.6)#64 | 18.1%(+41.2)#1,749 |
| 65. | 45404 | 59.2% | 20.7%(+38.6)#65 | 18.1%(+41.2)#1,753 |
| 66. | 45416 | 59.0% | 20.7%(+38.3)#66 | 18.1%(+40.9)#1,770 |
| 67. | 45205 | 59.0% | 20.7%(+38.3)#67 | 18.1%(+40.9)#1,771 |
| 68. | 44288 | 58.8% | 20.7%(+38.1)#68 | 18.1%(+40.7)#1,784 |
| 69. | 45773 | 58.5% | 20.7%(+37.9)#69 | 18.1%(+40.5)#1,792 |
| 70. | 44510 | 57.3% | 20.7%(+36.6)#70 | 18.1%(+39.3)#1,876 |
| 71. | 44707 | 56.8% | 20.7%(+36.1)#71 | 18.1%(+38.7)#1,925 |
| 72. | 45070 | 56.2% | 20.7%(+35.6)#72 | 18.1%(+38.2)#1,971 |
| 73. | 45417 | 56.2% | 20.7%(+35.5)#73 | 18.1%(+38.1)#1,974 |
| 74. | 43938 | 56.1% | 20.7%(+35.5)#74 | 18.1%(+38.1)#1,978 |
| 75. | 44302 | 55.9% | 20.7%(+35.2)#75 | 18.1%(+37.9)#1,995 |
| 76. | 44045 | 55.6% | 20.7%(+34.9)#76 | 18.1%(+37.5)#2,032 |
| 77. | 45836 | 55.4% | 20.7%(+34.7)#77 | 18.1%(+37.3)#2,051 |
| 78. | 44643 | 54.4% | 20.7%(+33.8)#78 | 18.1%(+36.4)#2,110 |
| 79. | 45169 | 54.2% | 20.7%(+33.5)#79 | 18.1%(+36.1)#2,130 |
| 80. | 44704 | 54.0% | 20.7%(+33.3)#80 | 18.1%(+35.9)#2,143 |
| 81. | 44108 | 53.8% | 20.7%(+33.2)#81 | 18.1%(+35.8)#2,159 |
| 82. | 45662 | 53.8% | 20.7%(+33.1)#82 | 18.1%(+35.7)#2,167 |
| 83. | 44307 | 53.4% | 20.7%(+32.7)#83 | 18.1%(+35.3)#2,202 |
| 84. | 44310 | 53.3% | 20.7%(+32.7)#84 | 18.1%(+35.3)#2,208 |
| 85. | 43976 | 53.3% | 20.7%(+32.7)#85 | 18.1%(+35.3)#2,216 |
| 86. | 44128 | 52.7% | 20.7%(+32.1)#86 | 18.1%(+34.7)#2,276 |
| 87. | 45506 | 52.4% | 20.7%(+31.7)#87 | 18.1%(+34.3)#2,307 |
| 88. | 43340 | 52.2% | 20.7%(+31.5)#88 | 18.1%(+34.1)#2,326 |
| 89. | 45651 | 51.9% | 20.7%(+31.2)#89 | 18.1%(+33.8)#2,354 |
| 90. | 44703 | 51.8% | 20.7%(+31.1)#90 | 18.1%(+33.7)#2,360 |
| 91. | 43609 | 51.1% | 20.7%(+30.4)#91 | 18.1%(+33.0)#2,421 |
| 92. | 43771 | 51.0% | 20.7%(+30.3)#92 | 18.1%(+32.9)#2,429 |
| 93. | 43205 | 50.8% | 20.7%(+30.1)#93 | 18.1%(+32.7)#2,442 |
| 94. | 43452 | 50.6% | 20.7%(+29.9)#94 | 18.1%(+32.6)#2,467 |
| 95. | 45812 | 50.6% | 20.7%(+29.9)#95 | 18.1%(+32.5)#2,476 |
| 96. | 44705 | 50.3% | 20.7%(+29.6)#96 | 18.1%(+32.2)#2,500 |
| 97. | 44112 | 50.0% | 20.7%(+29.4)#97 | 18.1%(+32.0)#2,516 |
| 98. | 44509 | 50.0% | 20.7%(+29.3)#98 | 18.1%(+31.9)#2,519 |
| 99. | 45679 | 50.0% | 20.7%(+29.3)#99 | 18.1%(+31.9)#2,524 |
| 100. | 45616 | 50.0% | 20.7%(+29.3)#100 | 18.1%(+31.9)#2,534 |
Common Questions
What are the Top 10 Zip Codes with the Highest Poverty Level Among Children Under the Age of 5 in Ohio?
Top 10 Zip Codes with the Highest Poverty Level Among Children Under the Age of 5 in Ohio are:
What zip code has the Highest Poverty Level Among Children Under the Age of 5 in Ohio?
45719 has the Highest Poverty Level Among Children Under the Age of 5 in Ohio with 100.0%.
What is the Poverty Level Among Children Under the Age of 5 in the State of Ohio?
Poverty Level Among Children Under the Age of 5 in Ohio is 20.7%.
What is the Poverty Level Among Children Under the Age of 5 in the United States?
Poverty Level Among Children Under the Age of 5 in the United States is 18.1%.