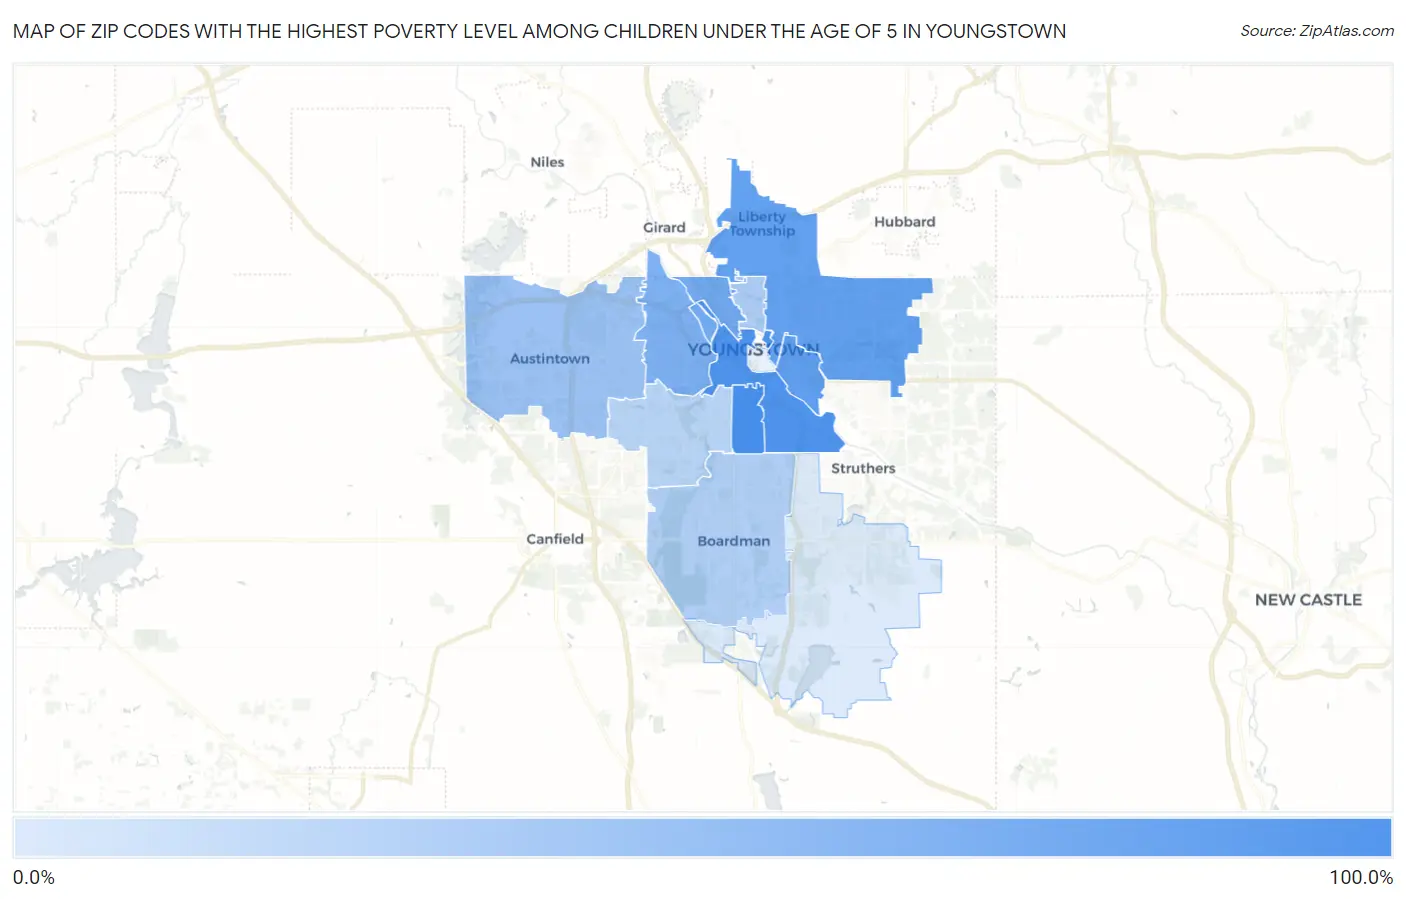
Zip Codes with the Highest Poverty Level Among Children Under the Age of 5 in Youngstown, OH
RELATED REPORTS & OPTIONS
Highest Poverty | Child 0-5
Youngstown
Compare Zip Codes
Map of Zip Codes with the Highest Poverty Level Among Children Under the Age of 5 in Youngstown
4.1%
86.9%
Zip Codes with the Highest Poverty Level Among Children Under the Age of 5 in Youngstown, OH
| Zip Code | Child Poverty | vs State | vs National | |
| 1. | 44507 | 86.9% | 20.7%(+66.3)#19 | 18.1%(+68.9)#675 |
| 2. | 44502 | 82.4% | 20.7%(+61.7)#23 | 18.1%(+64.3)#759 |
| 3. | 44506 | 68.8% | 20.7%(+48.1)#42 | 18.1%(+50.7)#1,201 |
| 4. | 44505 | 68.2% | 20.7%(+47.5)#45 | 18.1%(+50.1)#1,222 |
| 5. | 44510 | 57.3% | 20.7%(+36.6)#70 | 18.1%(+39.3)#1,876 |
| 6. | 44509 | 50.0% | 20.7%(+29.3)#98 | 18.1%(+31.9)#2,519 |
| 7. | 44515 | 34.7% | 20.7%(+14.1)#222 | 18.1%(+16.7)#5,133 |
| 8. | 44504 | 25.3% | 20.7%(+4.67)#332 | 18.1%(+7.27)#7,869 |
| 9. | 44512 | 23.6% | 20.7%(+2.96)#354 | 18.1%(+5.56)#8,522 |
| 10. | 44511 | 19.1% | 20.7%(-1.52)#430 | 18.1%(+1.08)#10,441 |
| 11. | 44514 | 4.1% | 20.7%(-16.5)#777 | 18.1%(-13.9)#19,386 |
1
Common Questions
What are the Top 10 Zip Codes with the Highest Poverty Level Among Children Under the Age of 5 in Youngstown, OH?
Top 10 Zip Codes with the Highest Poverty Level Among Children Under the Age of 5 in Youngstown, OH are:
What zip code has the Highest Poverty Level Among Children Under the Age of 5 in Youngstown, OH?
44507 has the Highest Poverty Level Among Children Under the Age of 5 in Youngstown, OH with 86.9%.
What is the Poverty Level Among Children Under the Age of 5 in Youngstown, OH?
Poverty Level Among Children Under the Age of 5 in Youngstown is 63.7%.
What is the Poverty Level Among Children Under the Age of 5 in Ohio?
Poverty Level Among Children Under the Age of 5 in Ohio is 20.7%.
What is the Poverty Level Among Children Under the Age of 5 in the United States?
Poverty Level Among Children Under the Age of 5 in the United States is 18.1%.