Westville, IL Map & Demographics
Westville Map
Westville Overview
$27,623
PER CAPITA INCOME
$67,961
AVG FAMILY INCOME
$54,766
AVG HOUSEHOLD INCOME
38.9%
WAGE / INCOME GAP [ % ]
61.1¢/ $1
WAGE / INCOME GAP [ $ ]
0.36
INEQUALITY / GINI INDEX
3,470
TOTAL POPULATION
1,580
MALE POPULATION
1,890
FEMALE POPULATION
83.60
MALES / 100 FEMALES
119.62
FEMALES / 100 MALES
37.2
MEDIAN AGE
3.1
AVG FAMILY SIZE
2.5
AVG HOUSEHOLD SIZE
1,526
LABOR FORCE [ PEOPLE ]
58.7%
PERCENT IN LABOR FORCE
4.0%
UNEMPLOYMENT RATE
Westville Zip Codes
Westville Area Codes
Income in Westville
Income Overview in Westville
Per Capita Income in Westville is $27,623, while median incomes of families and households are $67,961 and $54,766 respectively.
| Characteristic | Number | Measure |
| Per Capita Income | 3,470 | $27,623 |
| Median Family Income | 901 | $67,961 |
| Mean Family Income | 901 | $78,773 |
| Median Household Income | 1,414 | $54,766 |
| Mean Household Income | 1,414 | $66,129 |
| Income Deficit | 901 | $0 |
| Wage / Income Gap (%) | 3,470 | 38.89% |
| Wage / Income Gap ($) | 3,470 | 61.11¢ per $1 |
| Gini / Inequality Index | 3,470 | 0.36 |
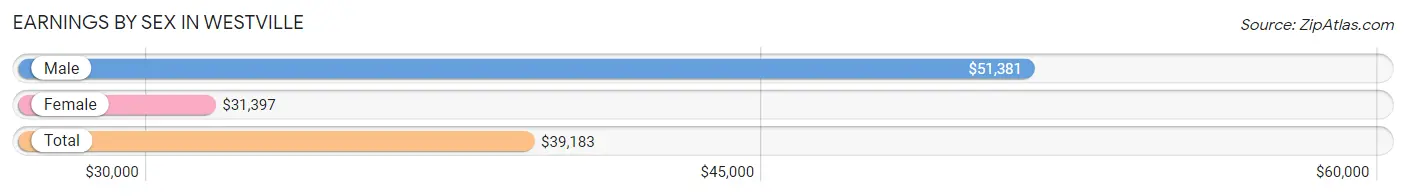
Earnings by Sex in Westville
Average Earnings in Westville are $39,183, $51,381 for men and $31,397 for women, a difference of 38.9%.
| Sex | Number | Average Earnings |
| Male | 840 (50.9%) | $51,381 |
| Female | 810 (49.1%) | $31,397 |
| Total | 1,650 (100.0%) | $39,183 |
Earnings by Sex by Income Bracket in Westville
The most common earnings brackets in Westville are $75,000 to $99,999 for men (126 | 15.0%) and $25,000 to $29,999 for women (110 | 13.6%).
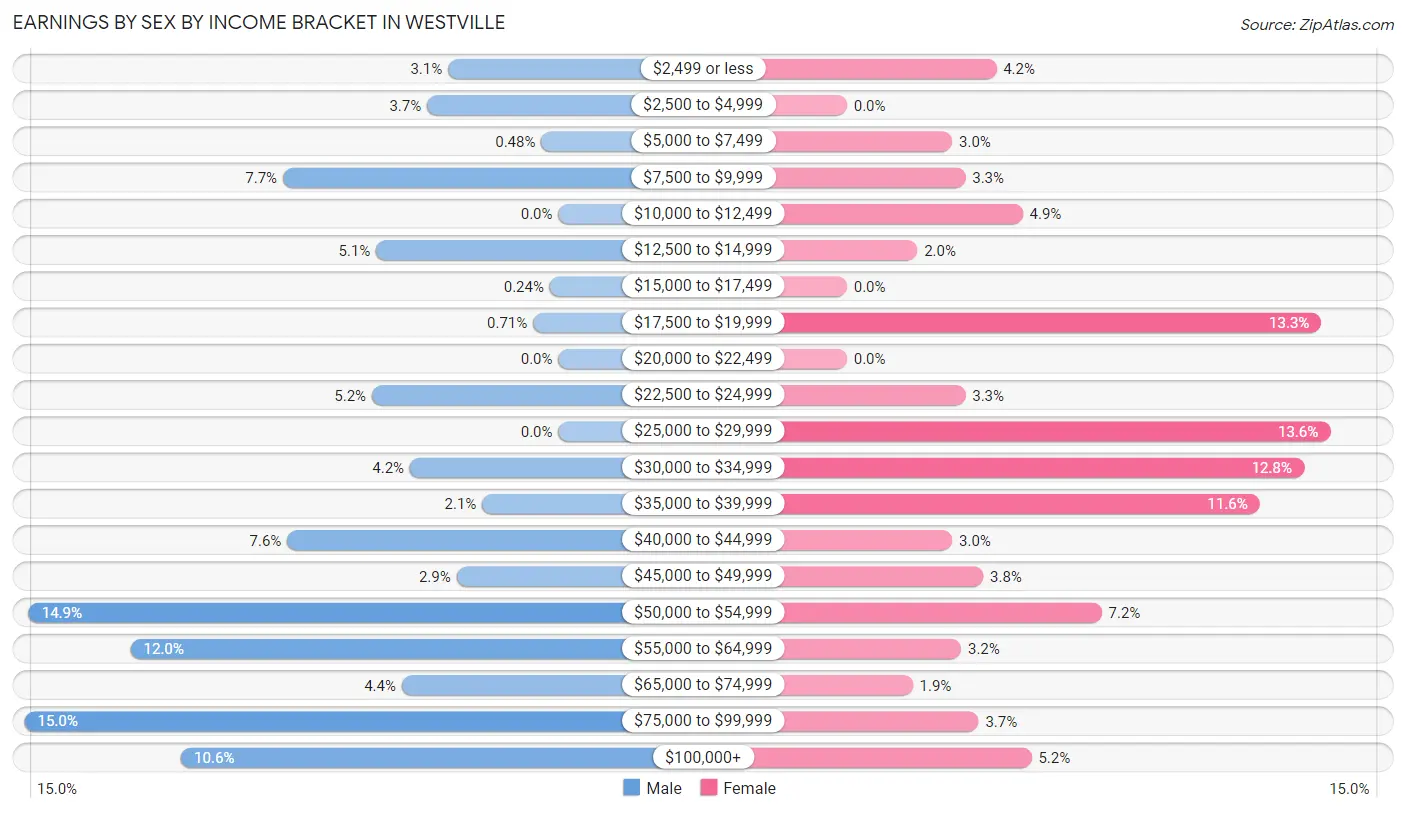
| Income | Male | Female |
| $2,499 or less | 26 (3.1%) | 34 (4.2%) |
| $2,500 to $4,999 | 31 (3.7%) | 0 (0.0%) |
| $5,000 to $7,499 | 4 (0.5%) | 24 (3.0%) |
| $7,500 to $9,999 | 65 (7.7%) | 27 (3.3%) |
| $10,000 to $12,499 | 0 (0.0%) | 40 (4.9%) |
| $12,500 to $14,999 | 43 (5.1%) | 16 (2.0%) |
| $15,000 to $17,499 | 2 (0.2%) | 0 (0.0%) |
| $17,500 to $19,999 | 6 (0.7%) | 108 (13.3%) |
| $20,000 to $22,499 | 0 (0.0%) | 0 (0.0%) |
| $22,500 to $24,999 | 44 (5.2%) | 27 (3.3%) |
| $25,000 to $29,999 | 0 (0.0%) | 110 (13.6%) |
| $30,000 to $34,999 | 35 (4.2%) | 104 (12.8%) |
| $35,000 to $39,999 | 18 (2.1%) | 94 (11.6%) |
| $40,000 to $44,999 | 64 (7.6%) | 24 (3.0%) |
| $45,000 to $49,999 | 24 (2.9%) | 31 (3.8%) |
| $50,000 to $54,999 | 125 (14.9%) | 58 (7.2%) |
| $55,000 to $64,999 | 101 (12.0%) | 26 (3.2%) |
| $65,000 to $74,999 | 37 (4.4%) | 15 (1.8%) |
| $75,000 to $99,999 | 126 (15.0%) | 30 (3.7%) |
| $100,000+ | 89 (10.6%) | 42 (5.2%) |
| Total | 840 (100.0%) | 810 (100.0%) |
Earnings by Sex by Educational Attainment in Westville
Average earnings in Westville are $51,857 for men and $33,018 for women, a difference of 36.3%. Men with an educational attainment of bachelor's degree enjoy the highest average annual earnings of $62,250, while those with high school diploma education earn the least with $42,462. Women with an educational attainment of bachelor's degree earn the most with the average annual earnings of $48,068, while those with high school diploma education have the smallest earnings of $27,406.
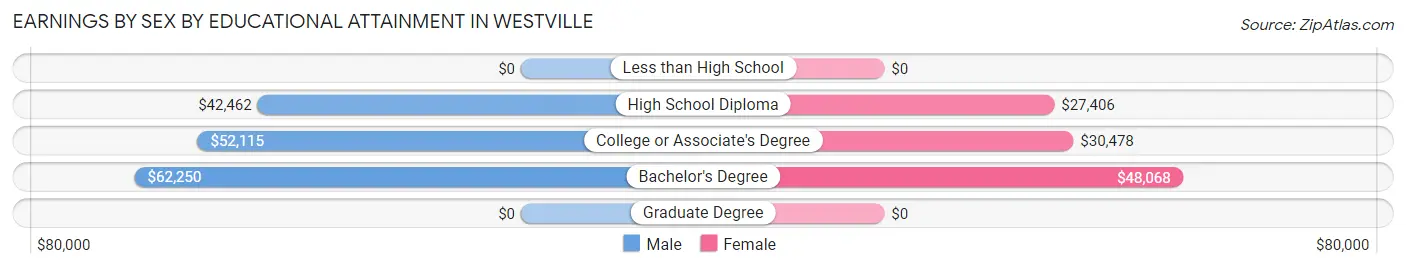
| Educational Attainment | Male Income | Female Income |
| Less than High School | - | - |
| High School Diploma | $42,462 | $27,406 |
| College or Associate's Degree | $52,115 | $30,478 |
| Bachelor's Degree | $62,250 | $48,068 |
| Graduate Degree | - | - |
| Total | $51,857 | $33,018 |
Family Income in Westville
Family Income Brackets in Westville
According to the Westville family income data, there are 180 families falling into the $100,000 to $149,999 income range, which is the most common income bracket and makes up 20.0% of all families.
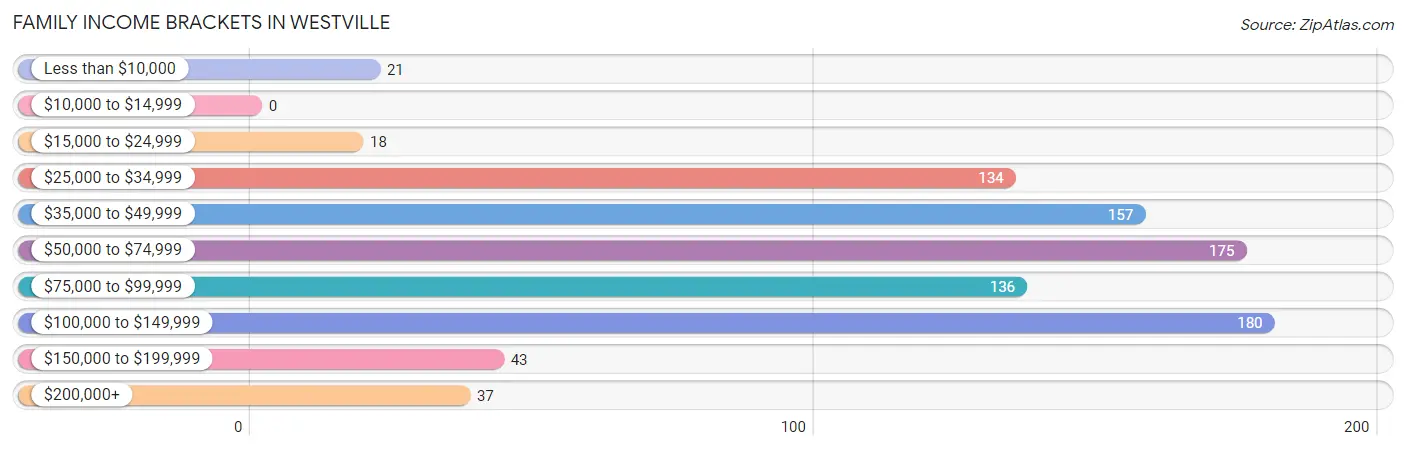
| Income Bracket | # Families | % Families |
| Less than $10,000 | 21 | 2.3% |
| $10,000 to $14,999 | 0 | 0.0% |
| $15,000 to $24,999 | 18 | 2.0% |
| $25,000 to $34,999 | 134 | 14.9% |
| $35,000 to $49,999 | 157 | 17.4% |
| $50,000 to $74,999 | 175 | 19.4% |
| $75,000 to $99,999 | 136 | 15.1% |
| $100,000 to $149,999 | 180 | 20.0% |
| $150,000 to $199,999 | 43 | 4.8% |
| $200,000+ | 37 | 4.1% |
Family Income by Famaliy Size in Westville
6-person families (49 | 5.4%) account for the highest median family income in Westville with $160,699 per family, while 2-person families (392 | 43.5%) have the highest median income of $35,384 per family member.
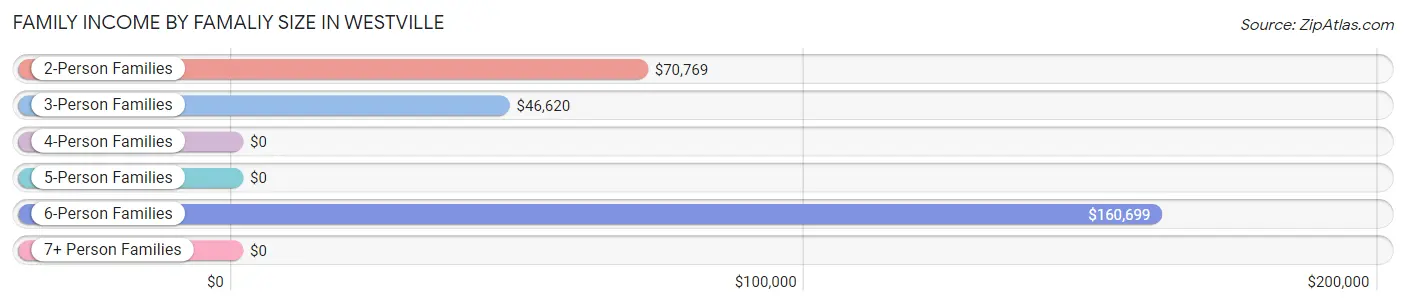
| Income Bracket | # Families | Median Income |
| 2-Person Families | 392 (43.5%) | $70,769 |
| 3-Person Families | 257 (28.5%) | $46,620 |
| 4-Person Families | 156 (17.3%) | $0 |
| 5-Person Families | 47 (5.2%) | $0 |
| 6-Person Families | 49 (5.4%) | $160,699 |
| 7+ Person Families | 0 (0.0%) | $0 |
| Total | 901 (100.0%) | $67,961 |
Family Income by Number of Earners in Westville
The median family income in Westville is $67,961, with families comprising 2 earners (472) having the highest median family income of $107,700, while families with no earners (123) have the lowest median family income of $43,264, accounting for 52.4% and 13.7% of families, respectively.
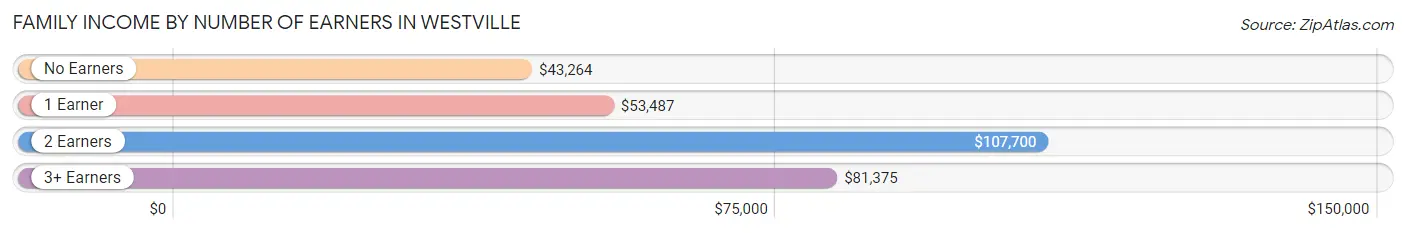
| Number of Earners | # Families | Median Income |
| No Earners | 123 (13.7%) | $43,264 |
| 1 Earner | 279 (31.0%) | $53,487 |
| 2 Earners | 472 (52.4%) | $107,700 |
| 3+ Earners | 27 (3.0%) | $81,375 |
| Total | 901 (100.0%) | $67,961 |
Household Income in Westville
Household Income Brackets in Westville
With 356 households falling in the category, the $50,000 to $74,999 income range is the most frequent in Westville, accounting for 25.2% of all households. In contrast, only 37 households (2.6%) fall into the $200,000+ income bracket, making it the least populous group.
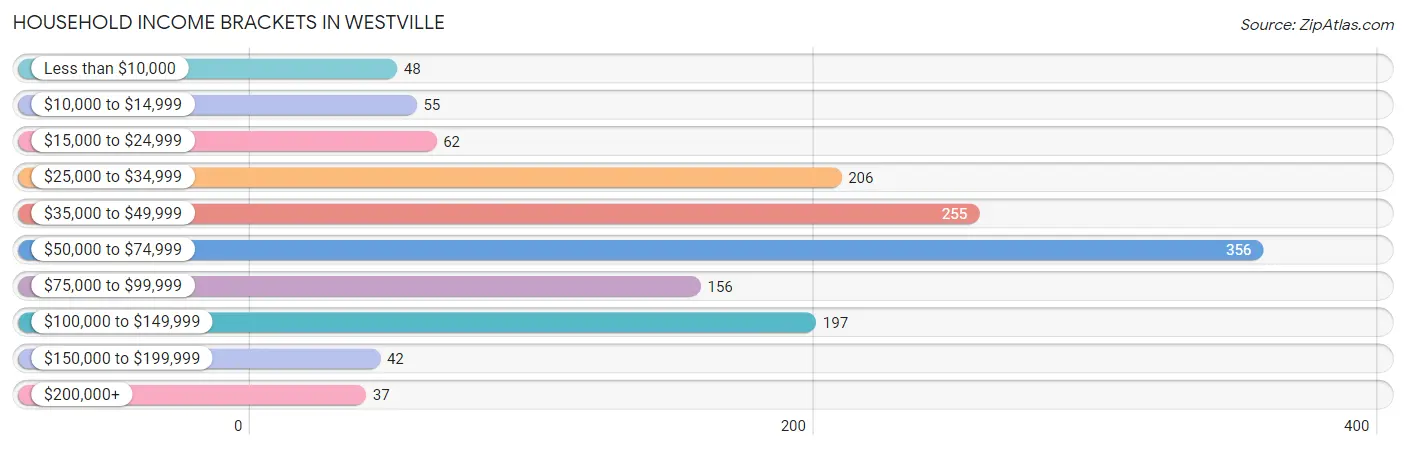
| Income Bracket | # Households | % Households |
| Less than $10,000 | 48 | 3.4% |
| $10,000 to $14,999 | 55 | 3.9% |
| $15,000 to $24,999 | 62 | 4.4% |
| $25,000 to $34,999 | 206 | 14.6% |
| $35,000 to $49,999 | 255 | 18.0% |
| $50,000 to $74,999 | 356 | 25.2% |
| $75,000 to $99,999 | 156 | 11.0% |
| $100,000 to $149,999 | 197 | 13.9% |
| $150,000 to $199,999 | 42 | 3.0% |
| $200,000+ | 37 | 2.6% |
Household Income by Householder Age in Westville
The median household income in Westville is $54,766, with the highest median household income of $63,469 found in the 25 to 44 years age bracket for the primary householder. A total of 527 households (37.3%) fall into this category. Meanwhile, the 15 to 24 years age bracket for the primary householder has the lowest median household income of $0, with 14 households (1.0%) in this group.
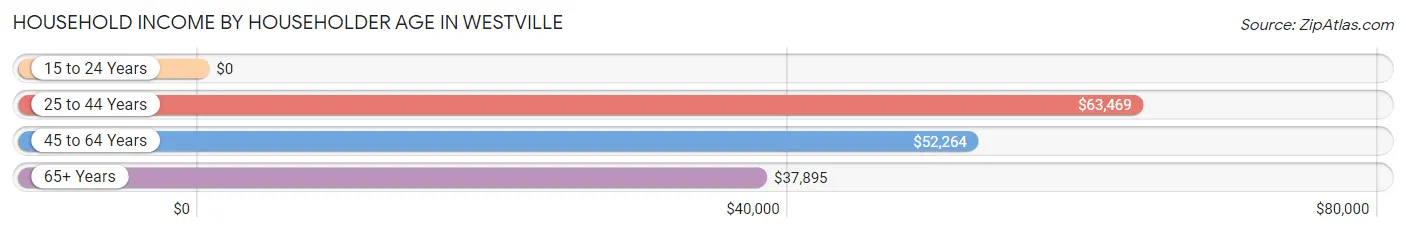
| Income Bracket | # Households | Median Income |
| 15 to 24 Years | 14 (1.0%) | $0 |
| 25 to 44 Years | 527 (37.3%) | $63,469 |
| 45 to 64 Years | 487 (34.4%) | $52,264 |
| 65+ Years | 386 (27.3%) | $37,895 |
| Total | 1,414 (100.0%) | $54,766 |
Poverty in Westville
Income Below Poverty by Sex and Age in Westville
With 10.7% poverty level for males and 5.0% for females among the residents of Westville, 18 to 24 year old males and 15 year old females are the most vulnerable to poverty, with 36 males (40.5%) and 19 females (65.5%) in their respective age groups living below the poverty level.
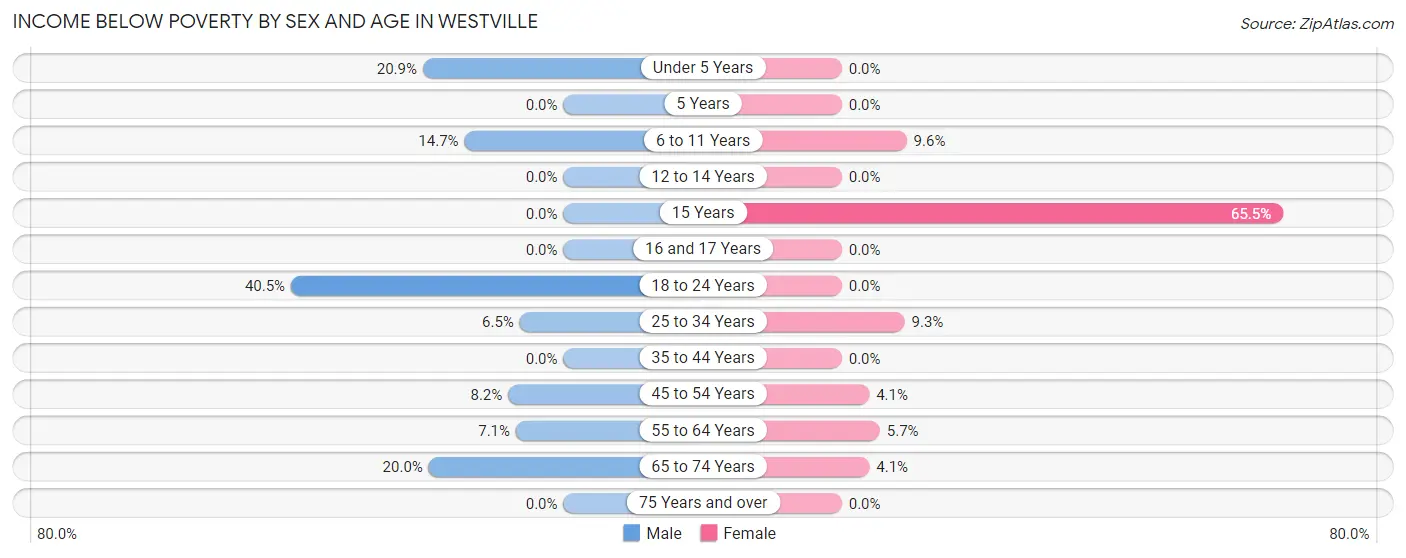
| Age Bracket | Male | Female |
| Under 5 Years | 24 (20.9%) | 0 (0.0%) |
| 5 Years | 0 (0.0%) | 0 (0.0%) |
| 6 to 11 Years | 21 (14.7%) | 21 (9.6%) |
| 12 to 14 Years | 0 (0.0%) | 0 (0.0%) |
| 15 Years | 0 (0.0%) | 19 (65.5%) |
| 16 and 17 Years | 0 (0.0%) | 0 (0.0%) |
| 18 to 24 Years | 36 (40.5%) | 0 (0.0%) |
| 25 to 34 Years | 15 (6.5%) | 21 (9.3%) |
| 35 to 44 Years | 0 (0.0%) | 0 (0.0%) |
| 45 to 54 Years | 15 (8.2%) | 9 (4.1%) |
| 55 to 64 Years | 11 (7.0%) | 16 (5.7%) |
| 65 to 74 Years | 40 (20.0%) | 7 (4.1%) |
| 75 Years and over | 0 (0.0%) | 0 (0.0%) |
| Total | 162 (10.7%) | 93 (5.0%) |
Income Above Poverty by Sex and Age in Westville
According to the poverty statistics in Westville, males aged 12 to 14 years and females aged under 5 years are the age groups that are most secure financially, with 100.0% of males and 100.0% of females in these age groups living above the poverty line.
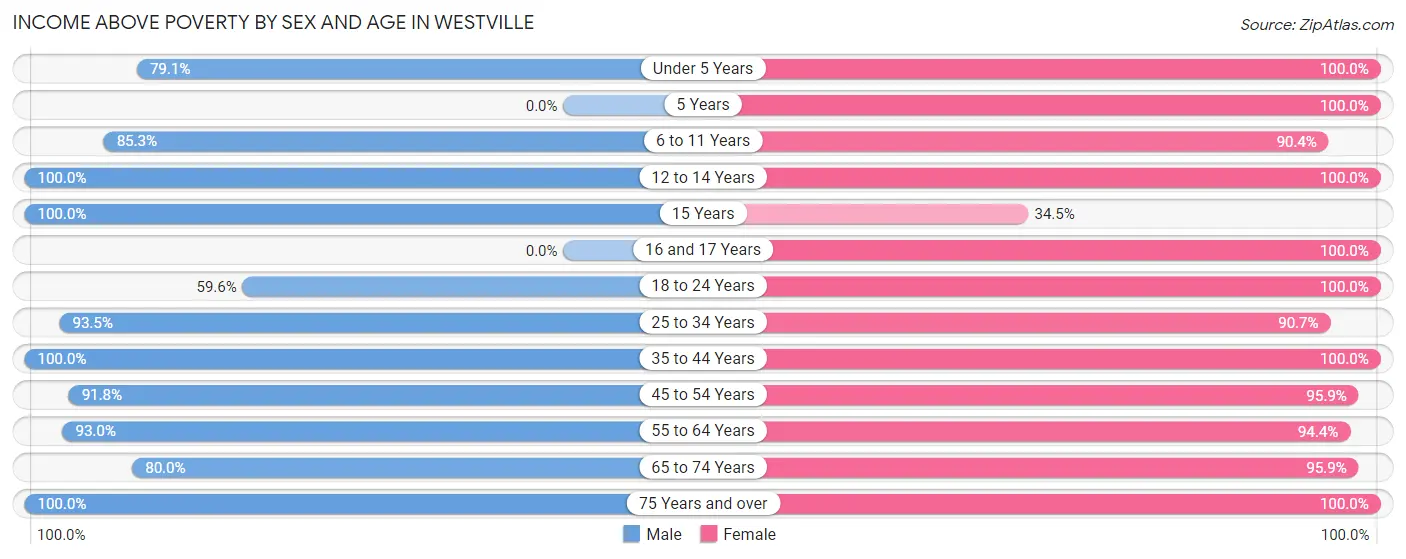
| Age Bracket | Male | Female |
| Under 5 Years | 91 (79.1%) | 115 (100.0%) |
| 5 Years | 0 (0.0%) | 31 (100.0%) |
| 6 to 11 Years | 122 (85.3%) | 197 (90.4%) |
| 12 to 14 Years | 70 (100.0%) | 37 (100.0%) |
| 15 Years | 10 (100.0%) | 10 (34.5%) |
| 16 and 17 Years | 0 (0.0%) | 91 (100.0%) |
| 18 to 24 Years | 53 (59.6%) | 101 (100.0%) |
| 25 to 34 Years | 216 (93.5%) | 204 (90.7%) |
| 35 to 44 Years | 258 (100.0%) | 213 (100.0%) |
| 45 to 54 Years | 168 (91.8%) | 212 (95.9%) |
| 55 to 64 Years | 145 (92.9%) | 267 (94.4%) |
| 65 to 74 Years | 160 (80.0%) | 164 (95.9%) |
| 75 Years and over | 56 (100.0%) | 121 (100.0%) |
| Total | 1,349 (89.3%) | 1,763 (95.0%) |
Income Below Poverty Among Married-Couple Families in Westville
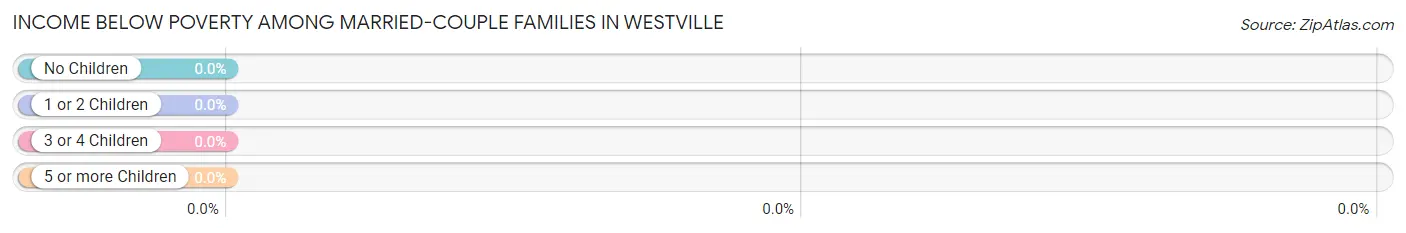
| Children | Above Poverty | Below Poverty |
| No Children | 320 (100.0%) | 0 (0.0%) |
| 1 or 2 Children | 290 (100.0%) | 0 (0.0%) |
| 3 or 4 Children | 39 (100.0%) | 0 (0.0%) |
| 5 or more Children | 0 (0.0%) | 0 (0.0%) |
| Total | 649 (100.0%) | 0 (0.0%) |
Income Below Poverty Among Single-Parent Households in Westville
According to the poverty data in Westville, 37.5% or 21 single-father households and 10.7% or 21 single-mother households are living below the poverty line. Among single-father households, those with 1 or 2 children have the highest poverty rate, with 21 households (42.0%) experiencing poverty. Likewise, among single-mother households, those with 3 or 4 children have the highest poverty rate, with 21 households (47.7%) falling below the poverty line.
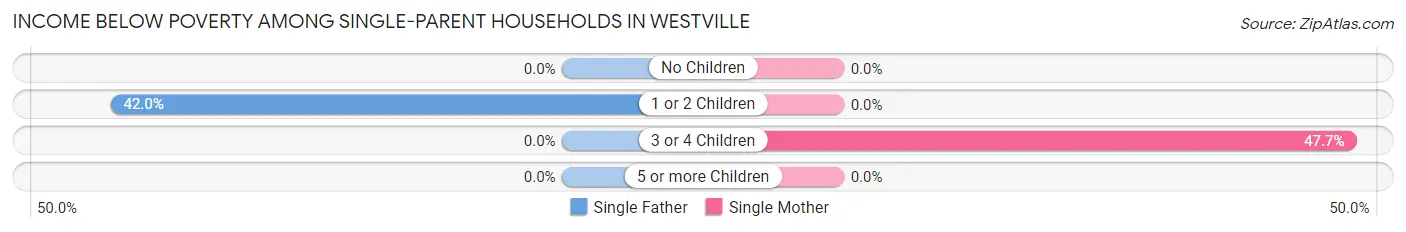
| Children | Single Father | Single Mother |
| No Children | 0 (0.0%) | 0 (0.0%) |
| 1 or 2 Children | 21 (42.0%) | 0 (0.0%) |
| 3 or 4 Children | 0 (0.0%) | 21 (47.7%) |
| 5 or more Children | 0 (0.0%) | 0 (0.0%) |
| Total | 21 (37.5%) | 21 (10.7%) |
Income Below Poverty Among Married-Couple vs Single-Parent Households in Westville
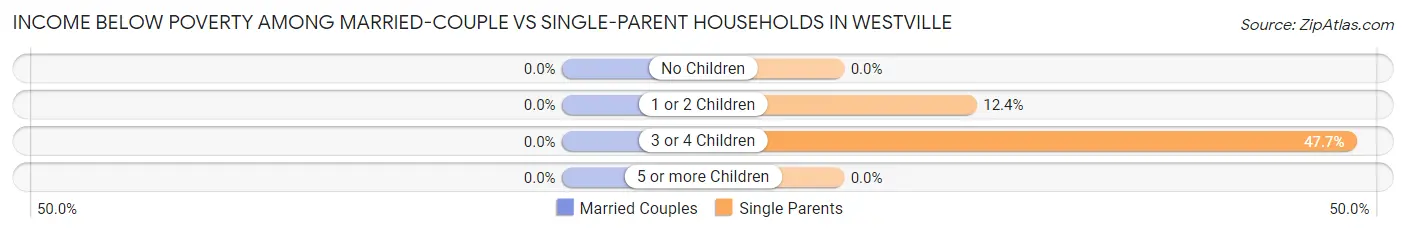
| Children | Married-Couple Families | Single-Parent Households |
| No Children | 0 (0.0%) | 0 (0.0%) |
| 1 or 2 Children | 0 (0.0%) | 21 (12.3%) |
| 3 or 4 Children | 0 (0.0%) | 21 (47.7%) |
| 5 or more Children | 0 (0.0%) | 0 (0.0%) |
| Total | 0 (0.0%) | 42 (16.7%) |
Race in Westville
The most populous races in Westville are White / Caucasian (3,397 | 97.9%), Two or more Races (52 | 1.5%), and Hispanic or Latino (41 | 1.2%).
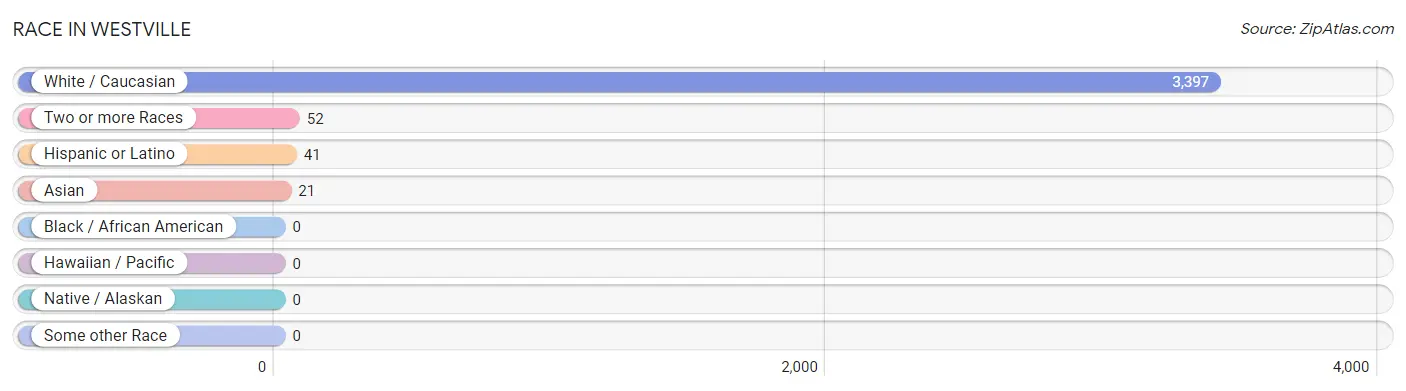
| Race | # Population | % Population |
| Asian | 21 | 0.6% |
| Black / African American | 0 | 0.0% |
| Hawaiian / Pacific | 0 | 0.0% |
| Hispanic or Latino | 41 | 1.2% |
| Native / Alaskan | 0 | 0.0% |
| White / Caucasian | 3,397 | 97.9% |
| Two or more Races | 52 | 1.5% |
| Some other Race | 0 | 0.0% |
| Total | 3,470 | 100.0% |
Ancestry in Westville
The most populous ancestries reported in Westville are German (591 | 17.0%), English (241 | 7.0%), Irish (182 | 5.2%), American (141 | 4.1%), and Italian (135 | 3.9%), together accounting for 37.2% of all Westville residents.
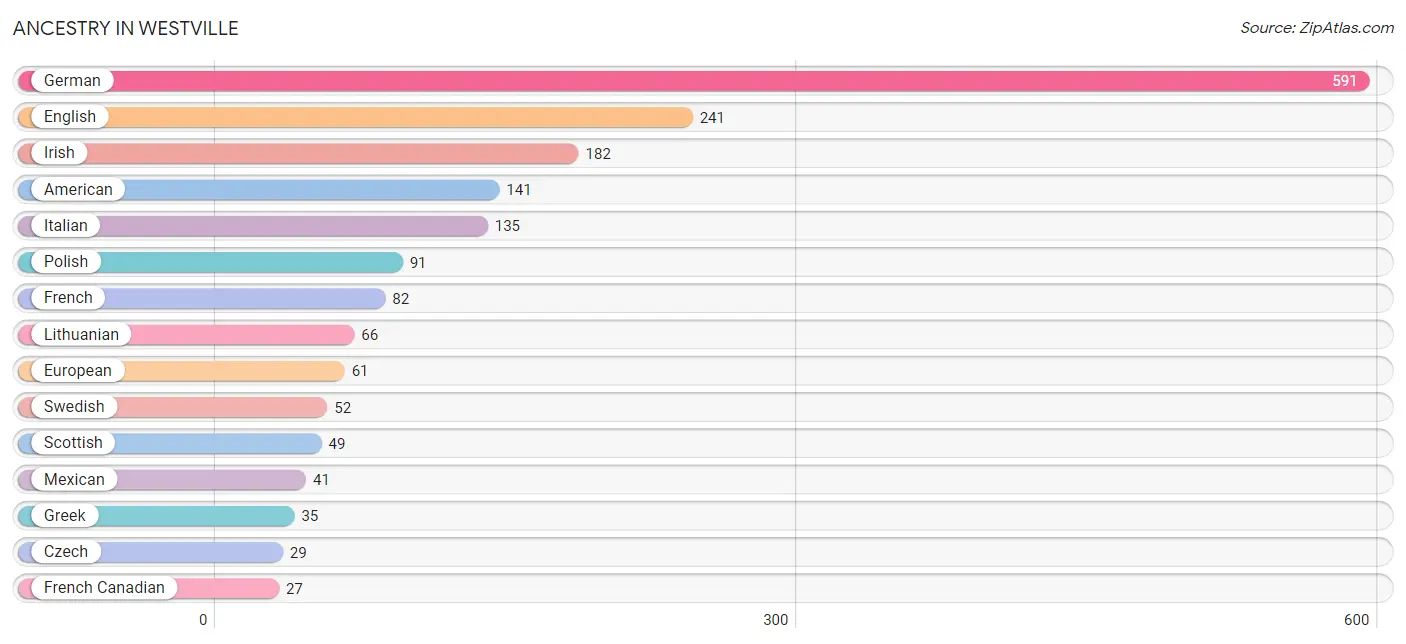
| Ancestry | # Population | % Population |
| American | 141 | 4.1% |
| Belgian | 23 | 0.7% |
| Czech | 29 | 0.8% |
| Czechoslovakian | 19 | 0.5% |
| Dutch | 13 | 0.4% |
| English | 241 | 7.0% |
| European | 61 | 1.8% |
| French | 82 | 2.4% |
| French Canadian | 27 | 0.8% |
| German | 591 | 17.0% |
| Greek | 35 | 1.0% |
| Indian (Asian) | 6 | 0.2% |
| Irish | 182 | 5.2% |
| Italian | 135 | 3.9% |
| Lithuanian | 66 | 1.9% |
| Mexican | 41 | 1.2% |
| Polish | 91 | 2.6% |
| Russian | 24 | 0.7% |
| Scotch-Irish | 5 | 0.1% |
| Scottish | 49 | 1.4% |
| Slovak | 10 | 0.3% |
| Swedish | 52 | 1.5% |
| Swiss | 11 | 0.3% |
| Thai | 15 | 0.4% |
| Ukrainian | 6 | 0.2% |
| Yugoslavian | 11 | 0.3% | View All 26 Rows |
Immigrants in Westville
The most numerous immigrant groups reported in Westville came from Asia (21 | 0.6%), Europe (21 | 0.6%), Germany (21 | 0.6%), Western Europe (21 | 0.6%), and India (15 | 0.4%), together accounting for 2.9% of all Westville residents.
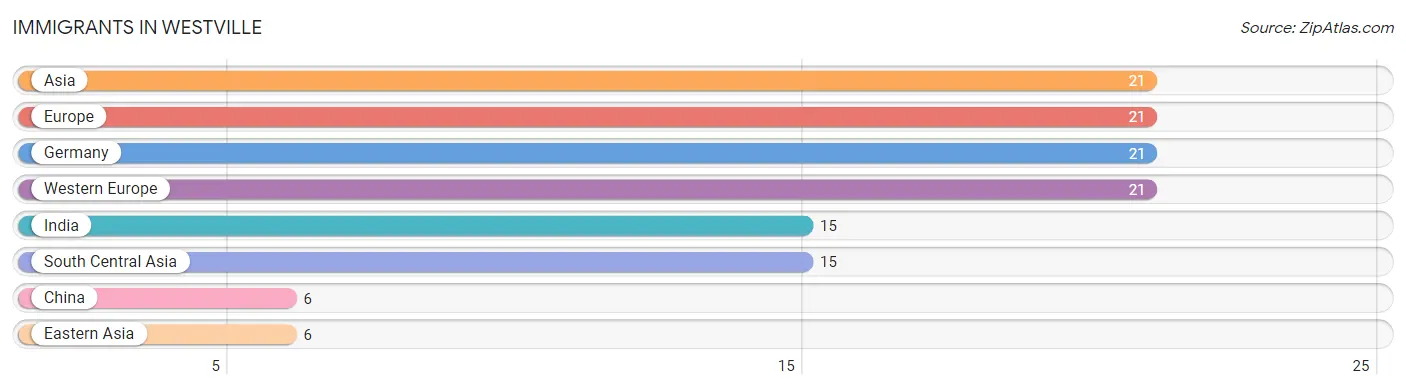
| Immigration Origin | # Population | % Population |
| Asia | 21 | 0.6% |
| China | 6 | 0.2% |
| Eastern Asia | 6 | 0.2% |
| Europe | 21 | 0.6% |
| Germany | 21 | 0.6% |
| India | 15 | 0.4% |
| South Central Asia | 15 | 0.4% |
| Western Europe | 21 | 0.6% | View All 8 Rows |
Sex and Age in Westville
Sex and Age in Westville
The most populous age groups in Westville are 25 to 29 Years (174 | 11.0%) for men and 60 to 64 Years (180 | 9.5%) for women.
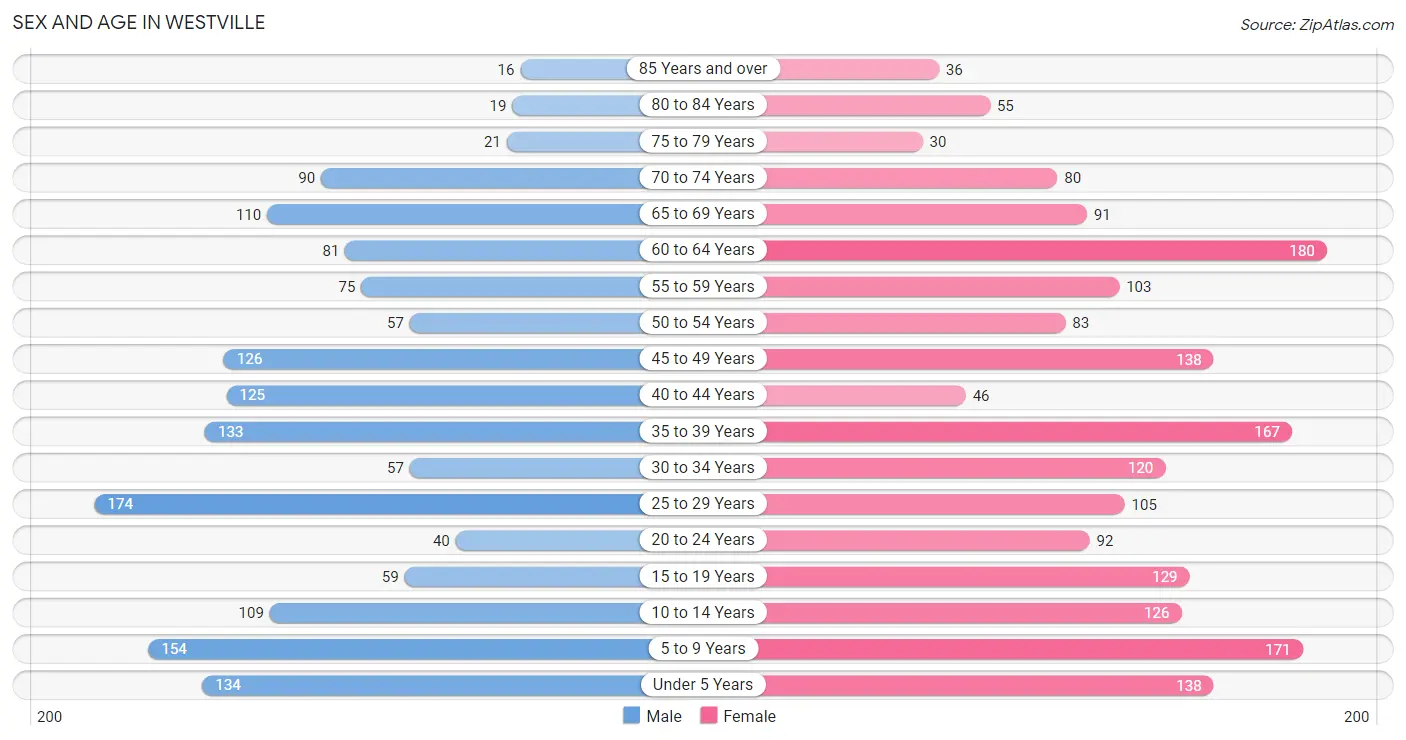
| Age Bracket | Male | Female |
| Under 5 Years | 134 (8.5%) | 138 (7.3%) |
| 5 to 9 Years | 154 (9.8%) | 171 (9.0%) |
| 10 to 14 Years | 109 (6.9%) | 126 (6.7%) |
| 15 to 19 Years | 59 (3.7%) | 129 (6.8%) |
| 20 to 24 Years | 40 (2.5%) | 92 (4.9%) |
| 25 to 29 Years | 174 (11.0%) | 105 (5.6%) |
| 30 to 34 Years | 57 (3.6%) | 120 (6.4%) |
| 35 to 39 Years | 133 (8.4%) | 167 (8.8%) |
| 40 to 44 Years | 125 (7.9%) | 46 (2.4%) |
| 45 to 49 Years | 126 (8.0%) | 138 (7.3%) |
| 50 to 54 Years | 57 (3.6%) | 83 (4.4%) |
| 55 to 59 Years | 75 (4.8%) | 103 (5.4%) |
| 60 to 64 Years | 81 (5.1%) | 180 (9.5%) |
| 65 to 69 Years | 110 (7.0%) | 91 (4.8%) |
| 70 to 74 Years | 90 (5.7%) | 80 (4.2%) |
| 75 to 79 Years | 21 (1.3%) | 30 (1.6%) |
| 80 to 84 Years | 19 (1.2%) | 55 (2.9%) |
| 85 Years and over | 16 (1.0%) | 36 (1.9%) |
| Total | 1,580 (100.0%) | 1,890 (100.0%) |
Families and Households in Westville
Median Family Size in Westville
The median family size in Westville is 3.09 persons per family, with single female/mother families (196 | 21.7%) accounting for the largest median family size of 3.6 persons per family. On the other hand, single male/father families (56 | 6.2%) represent the smallest median family size with 2.41 persons per family.
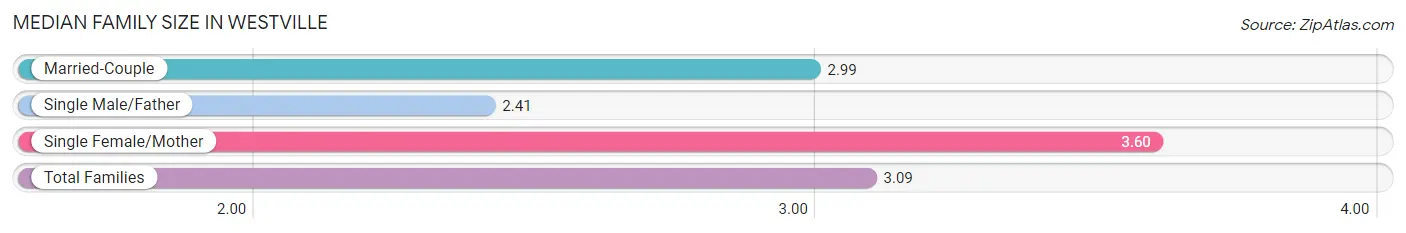
| Family Type | # Families | Family Size |
| Married-Couple | 649 (72.0%) | 2.99 |
| Single Male/Father | 56 (6.2%) | 2.41 |
| Single Female/Mother | 196 (21.7%) | 3.60 |
| Total Families | 901 (100.0%) | 3.09 |
Median Household Size in Westville
The median household size in Westville is 2.45 persons per household, with single female/mother households (196 | 13.9%) accounting for the largest median household size of 4.11 persons per household. non-family households (513 | 36.3%) represent the smallest median household size with 1.10 persons per household.
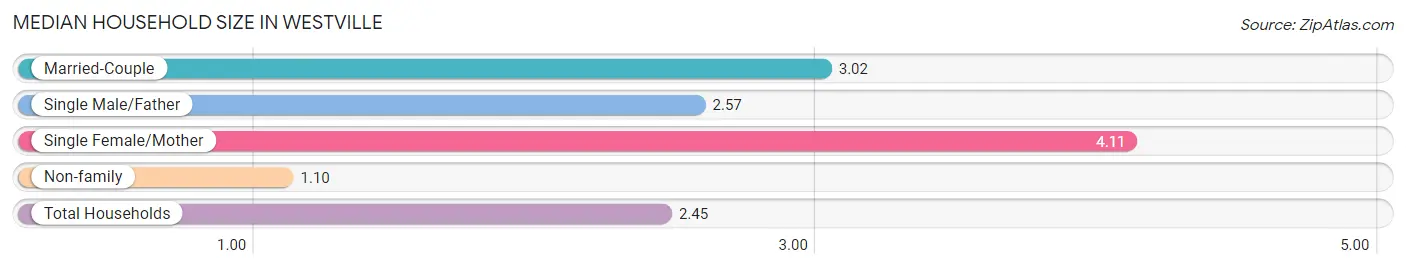
| Household Type | # Households | Household Size |
| Married-Couple | 649 (45.9%) | 3.02 |
| Single Male/Father | 56 (4.0%) | 2.57 |
| Single Female/Mother | 196 (13.9%) | 4.11 |
| Non-family | 513 (36.3%) | 1.10 |
| Total Households | 1,414 (100.0%) | 2.45 |
Household Size by Marriage Status in Westville
Out of a total of 1,414 households in Westville, 901 (63.7%) are family households, while 513 (36.3%) are nonfamily households. The most numerous type of family households are 2-person households, comprising 386, and the most common type of nonfamily households are 1-person households, comprising 487.
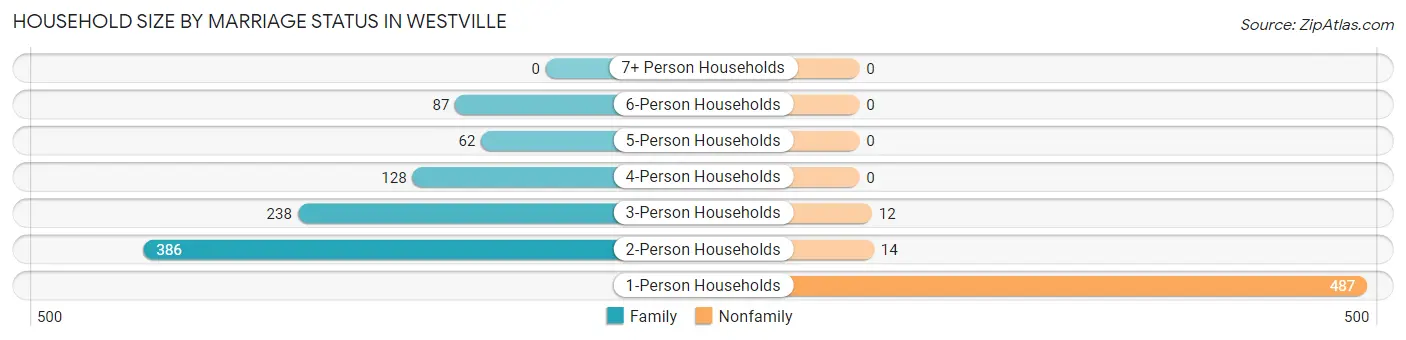
| Household Size | Family Households | Nonfamily Households |
| 1-Person Households | - | 487 (34.4%) |
| 2-Person Households | 386 (27.3%) | 14 (1.0%) |
| 3-Person Households | 238 (16.8%) | 12 (0.9%) |
| 4-Person Households | 128 (9.0%) | 0 (0.0%) |
| 5-Person Households | 62 (4.4%) | 0 (0.0%) |
| 6-Person Households | 87 (6.1%) | 0 (0.0%) |
| 7+ Person Households | 0 (0.0%) | 0 (0.0%) |
| Total | 901 (63.7%) | 513 (36.3%) |
Female Fertility in Westville
Fertility by Age in Westville
Average fertility rate in Westville is 90.0 births per 1,000 women. Women in the age bracket of 20 to 34 years have the highest fertility rate with 227.0 births per 1,000 women. Women in the age bracket of 20 to 34 years acount for 100.0% of all women with births.
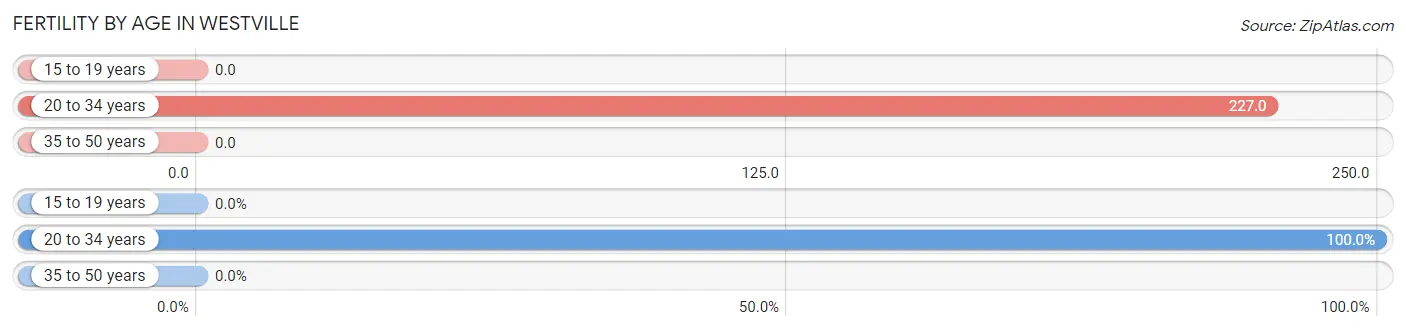
| Age Bracket | Women with Births | Births / 1,000 Women |
| 15 to 19 years | 0 (0.0%) | 0.0 |
| 20 to 34 years | 72 (100.0%) | 227.0 |
| 35 to 50 years | 0 (0.0%) | 0.0 |
| Total | 72 (100.0%) | 90.0 |
Fertility by Age by Marriage Status in Westville
40.3% of women with births (72) in Westville are married. The highest percentage of unmarried women with births falls into 20 to 34 years age bracket with 59.7% of them unmarried at the time of birth, while the lowest percentage of unmarried women with births belong to 20 to 34 years age bracket with 59.7% of them unmarried.
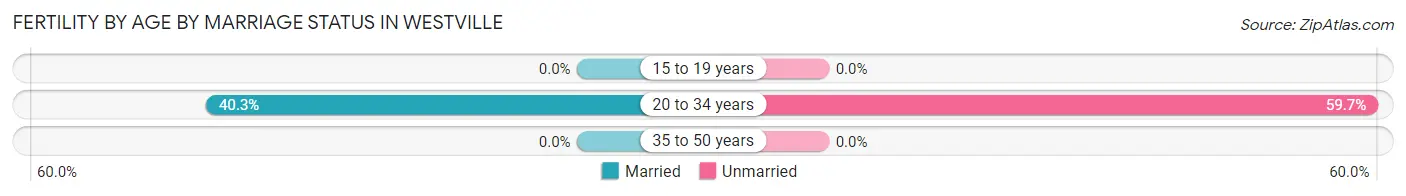
| Age Bracket | Married | Unmarried |
| 15 to 19 years | 0 (0.0%) | 0 (0.0%) |
| 20 to 34 years | 29 (40.3%) | 43 (59.7%) |
| 35 to 50 years | 0 (0.0%) | 0 (0.0%) |
| Total | 29 (40.3%) | 43 (59.7%) |
Fertility by Education in Westville
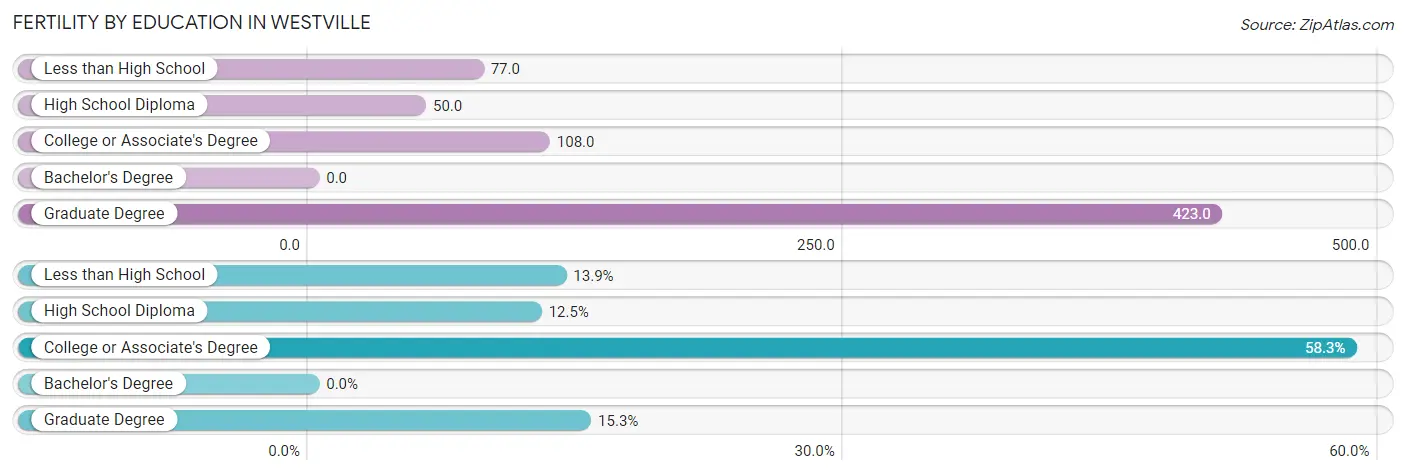
| Educational Attainment | Women with Births | Births / 1,000 Women |
| Less than High School | 10 (13.9%) | 77.0 |
| High School Diploma | 9 (12.5%) | 50.0 |
| College or Associate's Degree | 42 (58.3%) | 108.0 |
| Bachelor's Degree | 0 (0.0%) | 0.0 |
| Graduate Degree | 11 (15.3%) | 423.0 |
| Total | 72 (100.0%) | 90.0 |
Fertility by Education by Marriage Status in Westville
59.7% of women with births in Westville are unmarried. Women with the educational attainment of less than high school are most likely to be married with 100.0% of them married at childbirth, while women with the educational attainment of high school diploma are least likely to be married with 100.0% of them unmarried at childbirth.
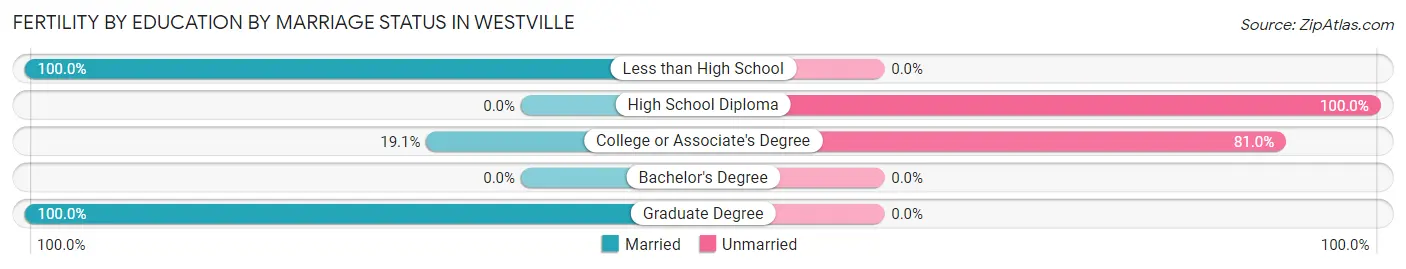
| Educational Attainment | Married | Unmarried |
| Less than High School | 10 (100.0%) | 0 (0.0%) |
| High School Diploma | 0 (0.0%) | 9 (100.0%) |
| College or Associate's Degree | 8 (19.1%) | 34 (80.9%) |
| Bachelor's Degree | 0 (0.0%) | 0 (0.0%) |
| Graduate Degree | 11 (100.0%) | 0 (0.0%) |
| Total | 29 (40.3%) | 43 (59.7%) |
Employment Characteristics in Westville
Employment by Class of Employer in Westville
Among the 1,419 employed individuals in Westville, private company employees (916 | 64.5%), not-for-profit organizations (164 | 11.6%), and local government employees (128 | 9.0%) make up the most common classes of employment.
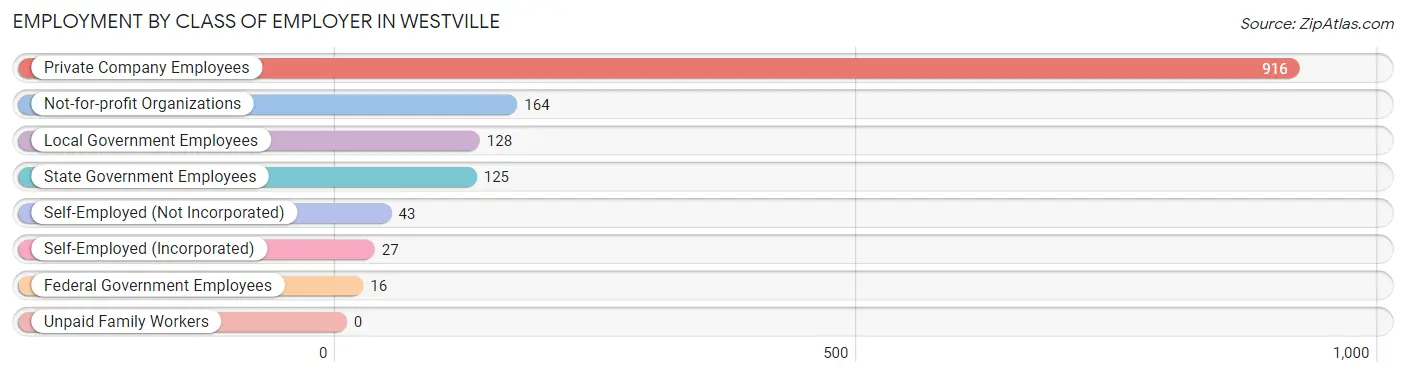
| Employer Class | # Employees | % Employees |
| Private Company Employees | 916 | 64.5% |
| Self-Employed (Incorporated) | 27 | 1.9% |
| Self-Employed (Not Incorporated) | 43 | 3.0% |
| Not-for-profit Organizations | 164 | 11.6% |
| Local Government Employees | 128 | 9.0% |
| State Government Employees | 125 | 8.8% |
| Federal Government Employees | 16 | 1.1% |
| Unpaid Family Workers | 0 | 0.0% |
| Total | 1,419 | 100.0% |
Employment Status by Age in Westville
According to the labor force statistics for Westville, out of the total population over 16 years of age (2,599), 58.7% or 1,526 individuals are in the labor force, with 4.0% or 61 of them unemployed. The age group with the highest labor force participation rate is 35 to 44 years, with 100.0% or 471 individuals in the labor force. Within the labor force, the 25 to 29 years age range has the highest percentage of unemployed individuals, with 9.8% or 23 of them being unemployed.
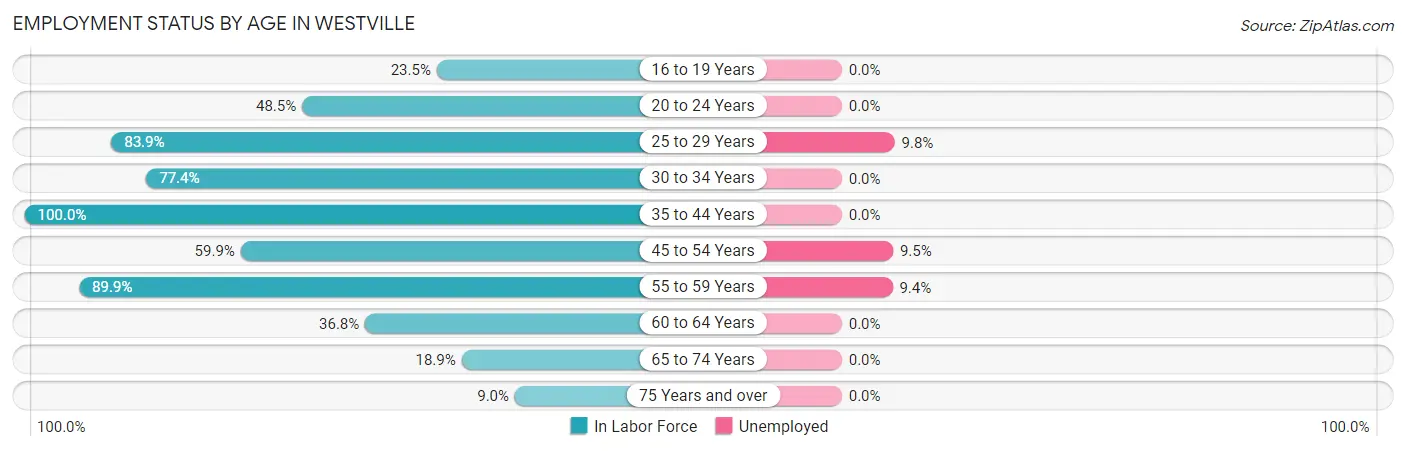
| Age Bracket | In Labor Force | Unemployed |
| 16 to 19 Years | 35 (23.5%) | 0 (0.0%) |
| 20 to 24 Years | 64 (48.5%) | 0 (0.0%) |
| 25 to 29 Years | 234 (83.9%) | 23 (9.8%) |
| 30 to 34 Years | 137 (77.4%) | 0 (0.0%) |
| 35 to 44 Years | 471 (100.0%) | 0 (0.0%) |
| 45 to 54 Years | 242 (59.9%) | 23 (9.5%) |
| 55 to 59 Years | 160 (89.9%) | 15 (9.4%) |
| 60 to 64 Years | 96 (36.8%) | 0 (0.0%) |
| 65 to 74 Years | 70 (18.9%) | 0 (0.0%) |
| 75 Years and over | 16 (9.0%) | 0 (0.0%) |
| Total | 1,526 (58.7%) | 61 (4.0%) |
Employment Status by Educational Attainment in Westville
According to labor force statistics for Westville, 75.7% of individuals (1,340) out of the total population between 25 and 64 years of age (1,770) are in the labor force, with 4.6% or 62 of them being unemployed. The group with the highest labor force participation rate are those with the educational attainment of bachelor's degree or higher, with 94.9% or 314 individuals in the labor force. Within the labor force, individuals with high school diploma education have the highest percentage of unemployment, with 5.5% or 27 of them being unemployed.
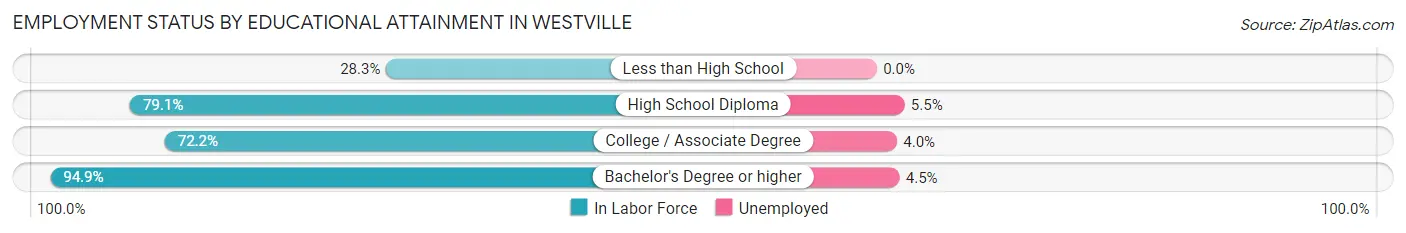
| Educational Attainment | In Labor Force | Unemployed |
| Less than High School | 36 (28.3%) | 0 (0.0%) |
| High School Diploma | 491 (79.1%) | 34 (5.5%) |
| College / Associate Degree | 499 (72.2%) | 28 (4.0%) |
| Bachelor's Degree or higher | 314 (94.9%) | 15 (4.5%) |
| Total | 1,340 (75.7%) | 81 (4.6%) |
Employment Occupations by Sex in Westville
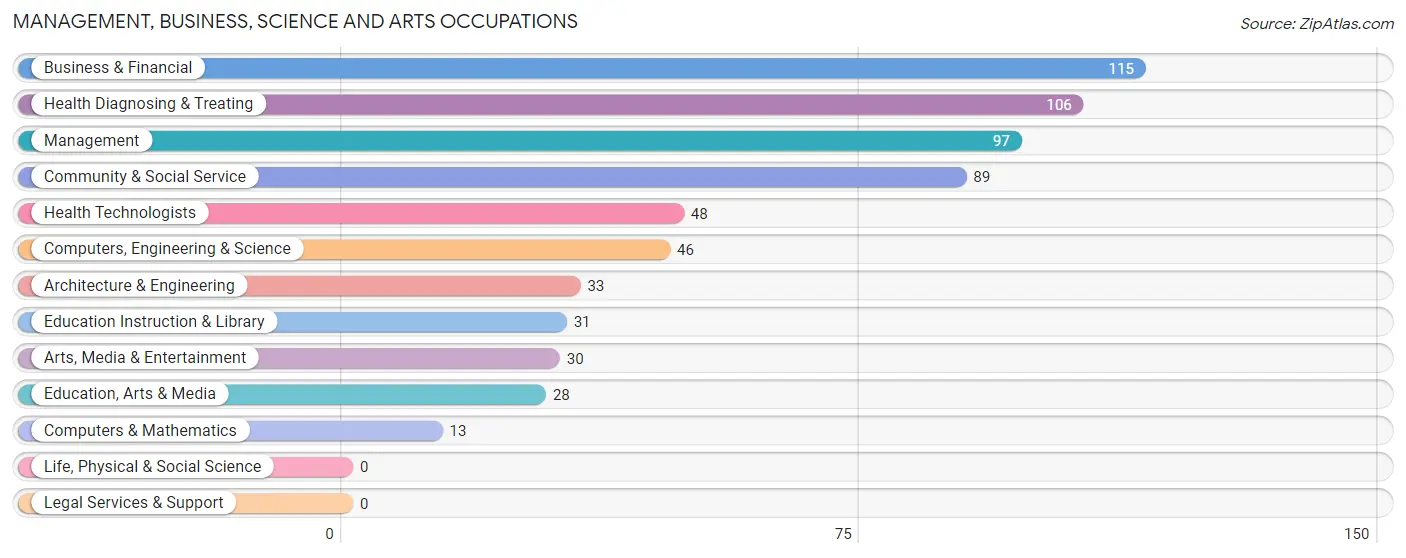
Management, Business, Science and Arts Occupations
The most common Management, Business, Science and Arts occupations in Westville are Business & Financial (115 | 7.9%), Health Diagnosing & Treating (106 | 7.2%), Management (97 | 6.6%), Community & Social Service (89 | 6.1%), and Health Technologists (48 | 3.3%).
Management, Business, Science and Arts Occupations by Sex
Within the Management, Business, Science and Arts occupations in Westville, the most male-oriented occupations are Computers, Engineering & Science (100.0%), Computers & Mathematics (100.0%), and Architecture & Engineering (100.0%), while the most female-oriented occupations are Education Instruction & Library (100.0%), Health Technologists (100.0%), and Business & Financial (96.5%).
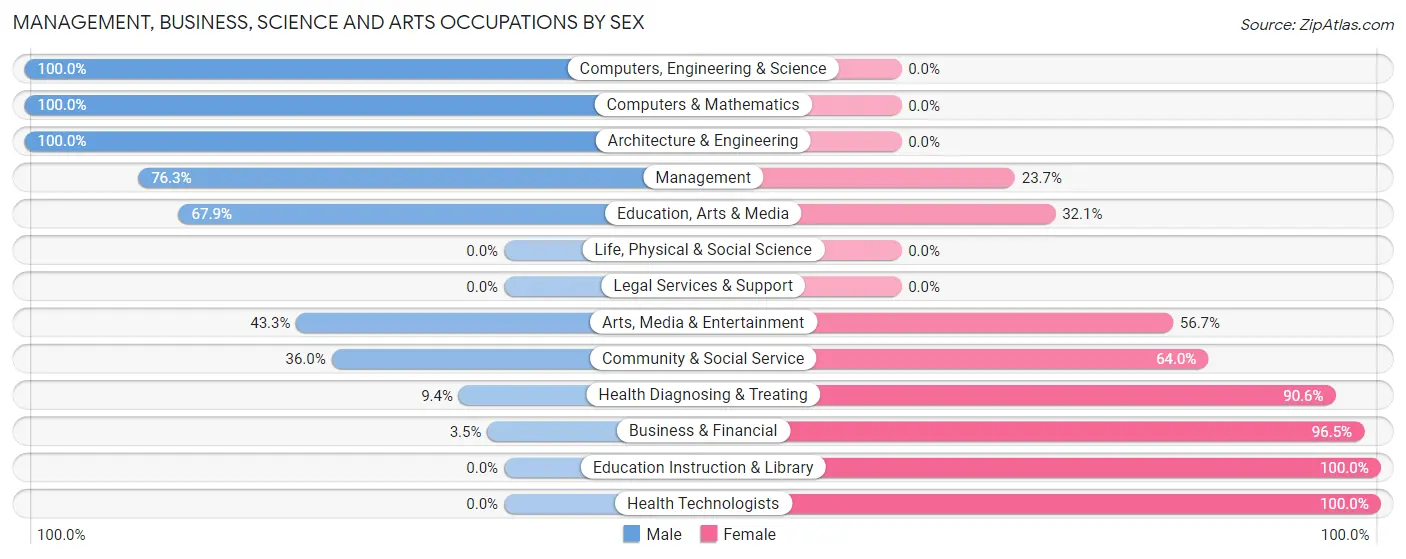
| Occupation | Male | Female |
| Management | 74 (76.3%) | 23 (23.7%) |
| Business & Financial | 4 (3.5%) | 111 (96.5%) |
| Computers, Engineering & Science | 46 (100.0%) | 0 (0.0%) |
| Computers & Mathematics | 13 (100.0%) | 0 (0.0%) |
| Architecture & Engineering | 33 (100.0%) | 0 (0.0%) |
| Life, Physical & Social Science | 0 (0.0%) | 0 (0.0%) |
| Community & Social Service | 32 (36.0%) | 57 (64.0%) |
| Education, Arts & Media | 19 (67.9%) | 9 (32.1%) |
| Legal Services & Support | 0 (0.0%) | 0 (0.0%) |
| Education Instruction & Library | 0 (0.0%) | 31 (100.0%) |
| Arts, Media & Entertainment | 13 (43.3%) | 17 (56.7%) |
| Health Diagnosing & Treating | 10 (9.4%) | 96 (90.6%) |
| Health Technologists | 0 (0.0%) | 48 (100.0%) |
| Total (Category) | 166 (36.6%) | 287 (63.4%) |
| Total (Overall) | 746 (51.0%) | 718 (49.0%) |
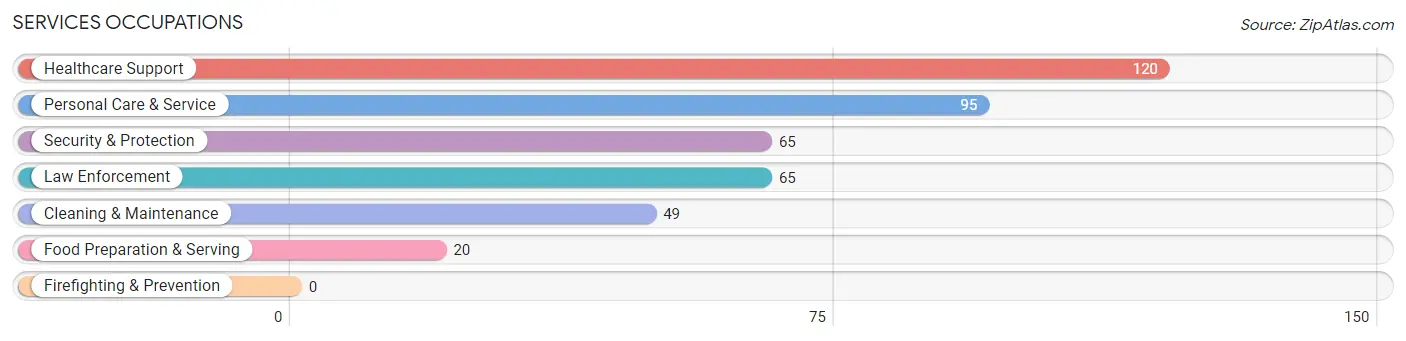
Services Occupations
The most common Services occupations in Westville are Healthcare Support (120 | 8.2%), Personal Care & Service (95 | 6.5%), Security & Protection (65 | 4.4%), Law Enforcement (65 | 4.4%), and Cleaning & Maintenance (49 | 3.4%).
Services Occupations by Sex
Within the Services occupations in Westville, the most male-oriented occupations are Cleaning & Maintenance (100.0%), Security & Protection (83.1%), and Law Enforcement (83.1%), while the most female-oriented occupations are Food Preparation & Serving (100.0%), Personal Care & Service (100.0%), and Healthcare Support (64.2%).
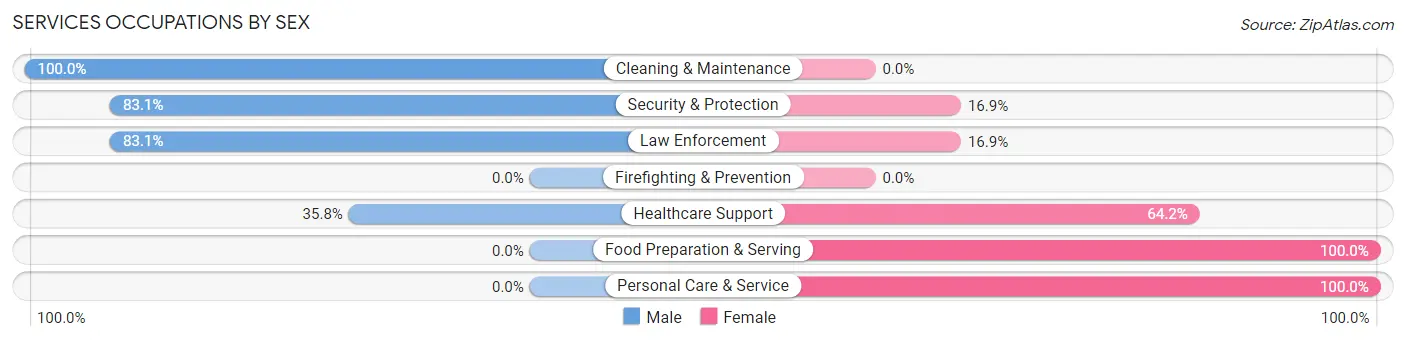
| Occupation | Male | Female |
| Healthcare Support | 43 (35.8%) | 77 (64.2%) |
| Security & Protection | 54 (83.1%) | 11 (16.9%) |
| Firefighting & Prevention | 0 (0.0%) | 0 (0.0%) |
| Law Enforcement | 54 (83.1%) | 11 (16.9%) |
| Food Preparation & Serving | 0 (0.0%) | 20 (100.0%) |
| Cleaning & Maintenance | 49 (100.0%) | 0 (0.0%) |
| Personal Care & Service | 0 (0.0%) | 95 (100.0%) |
| Total (Category) | 146 (41.8%) | 203 (58.2%) |
| Total (Overall) | 746 (51.0%) | 718 (49.0%) |
Sales and Office Occupations
The most common Sales and Office occupations in Westville are Office & Administration (223 | 15.2%), and Sales & Related (153 | 10.4%).

Sales and Office Occupations by Sex
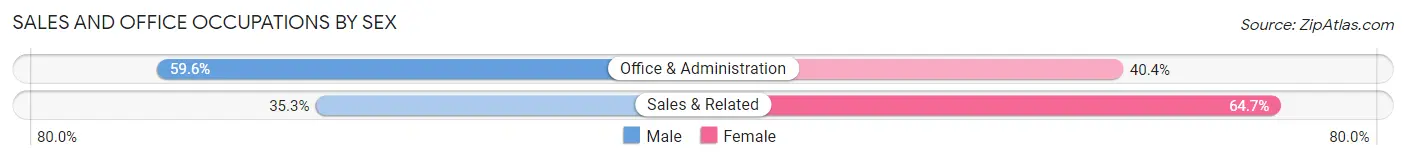
| Occupation | Male | Female |
| Sales & Related | 54 (35.3%) | 99 (64.7%) |
| Office & Administration | 133 (59.6%) | 90 (40.4%) |
| Total (Category) | 187 (49.7%) | 189 (50.3%) |
| Total (Overall) | 746 (51.0%) | 718 (49.0%) |
Natural Resources, Construction and Maintenance Occupations
The most common Natural Resources, Construction and Maintenance occupations in Westville are Installation, Maintenance & Repair (43 | 2.9%), and Construction & Extraction (14 | 1.0%).

Natural Resources, Construction and Maintenance Occupations by Sex

| Occupation | Male | Female |
| Farming, Fishing & Forestry | 0 (0.0%) | 0 (0.0%) |
| Construction & Extraction | 14 (100.0%) | 0 (0.0%) |
| Installation, Maintenance & Repair | 43 (100.0%) | 0 (0.0%) |
| Total (Category) | 57 (100.0%) | 0 (0.0%) |
| Total (Overall) | 746 (51.0%) | 718 (49.0%) |
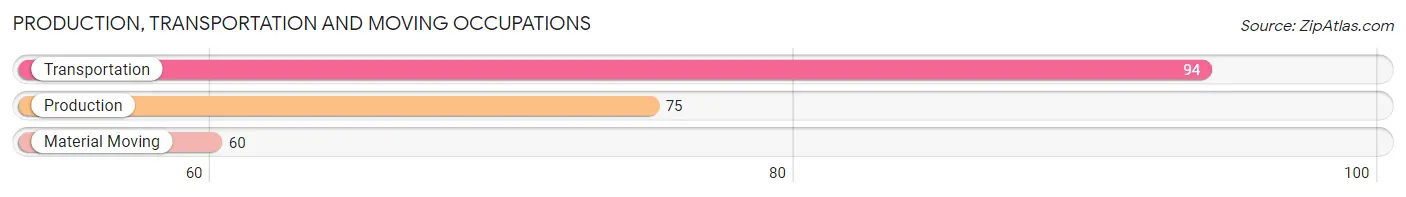
Production, Transportation and Moving Occupations
The most common Production, Transportation and Moving occupations in Westville are Transportation (94 | 6.4%), Production (75 | 5.1%), and Material Moving (60 | 4.1%).
Production, Transportation and Moving Occupations by Sex
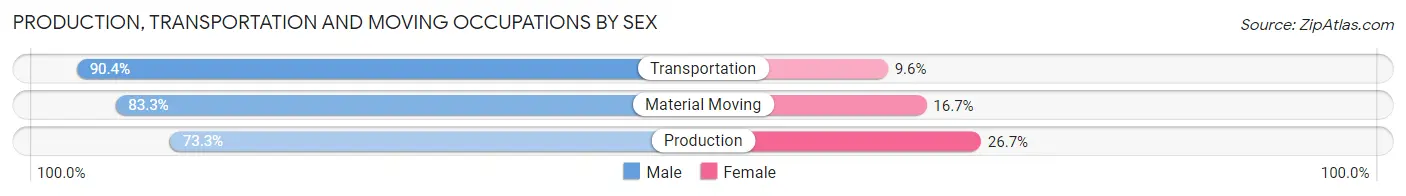
| Occupation | Male | Female |
| Production | 55 (73.3%) | 20 (26.7%) |
| Transportation | 85 (90.4%) | 9 (9.6%) |
| Material Moving | 50 (83.3%) | 10 (16.7%) |
| Total (Category) | 190 (83.0%) | 39 (17.0%) |
| Total (Overall) | 746 (51.0%) | 718 (49.0%) |
Employment Industries by Sex in Westville
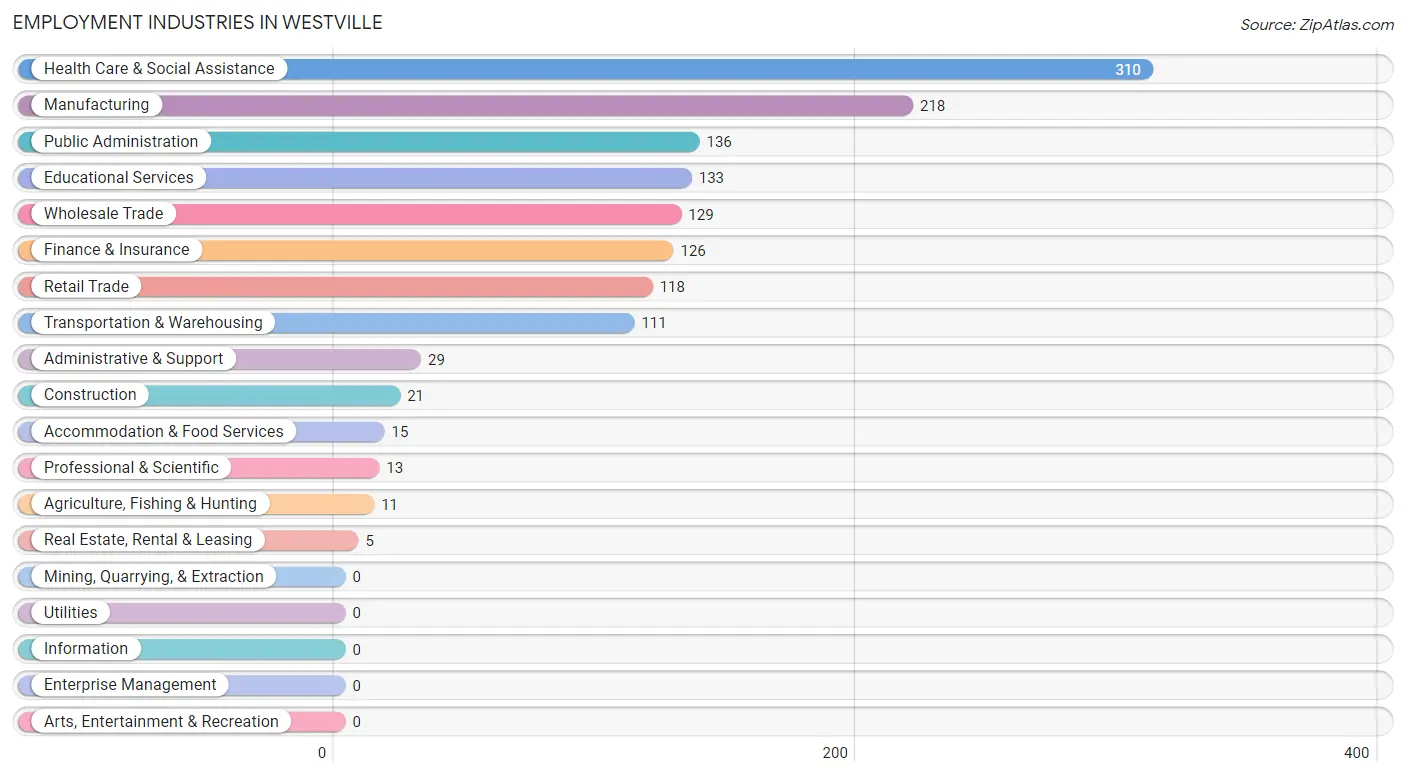
Employment Industries in Westville
The major employment industries in Westville include Health Care & Social Assistance (310 | 21.2%), Manufacturing (218 | 14.9%), Public Administration (136 | 9.3%), Educational Services (133 | 9.1%), and Wholesale Trade (129 | 8.8%).
Employment Industries by Sex in Westville
The Westville industries that see more men than women are Agriculture, Fishing & Hunting (100.0%), Wholesale Trade (100.0%), and Real Estate, Rental & Leasing (100.0%), whereas the industries that tend to have a higher number of women are Finance & Insurance (100.0%), Professional & Scientific (100.0%), and Administrative & Support (100.0%).
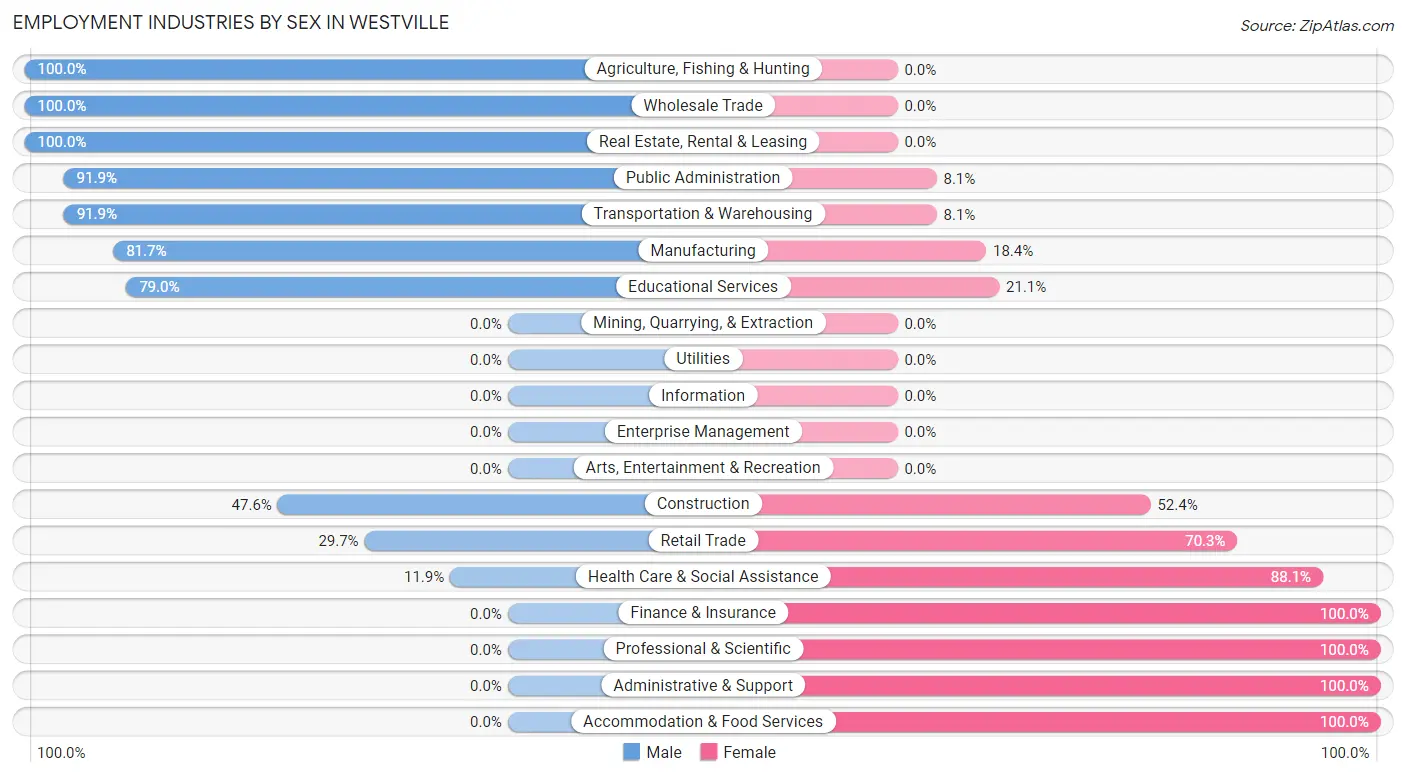
| Industry | Male | Female |
| Agriculture, Fishing & Hunting | 11 (100.0%) | 0 (0.0%) |
| Mining, Quarrying, & Extraction | 0 (0.0%) | 0 (0.0%) |
| Construction | 10 (47.6%) | 11 (52.4%) |
| Manufacturing | 178 (81.7%) | 40 (18.3%) |
| Wholesale Trade | 129 (100.0%) | 0 (0.0%) |
| Retail Trade | 35 (29.7%) | 83 (70.3%) |
| Transportation & Warehousing | 102 (91.9%) | 9 (8.1%) |
| Utilities | 0 (0.0%) | 0 (0.0%) |
| Information | 0 (0.0%) | 0 (0.0%) |
| Finance & Insurance | 0 (0.0%) | 126 (100.0%) |
| Real Estate, Rental & Leasing | 5 (100.0%) | 0 (0.0%) |
| Professional & Scientific | 0 (0.0%) | 13 (100.0%) |
| Enterprise Management | 0 (0.0%) | 0 (0.0%) |
| Administrative & Support | 0 (0.0%) | 29 (100.0%) |
| Educational Services | 105 (78.9%) | 28 (21.0%) |
| Health Care & Social Assistance | 37 (11.9%) | 273 (88.1%) |
| Arts, Entertainment & Recreation | 0 (0.0%) | 0 (0.0%) |
| Accommodation & Food Services | 0 (0.0%) | 15 (100.0%) |
| Public Administration | 125 (91.9%) | 11 (8.1%) |
| Total | 746 (51.0%) | 718 (49.0%) |
Education in Westville
School Enrollment in Westville
The most common levels of schooling among the 808 students in Westville are elementary school (293 | 36.3%), high school (223 | 27.6%), and middle school (168 | 20.8%).
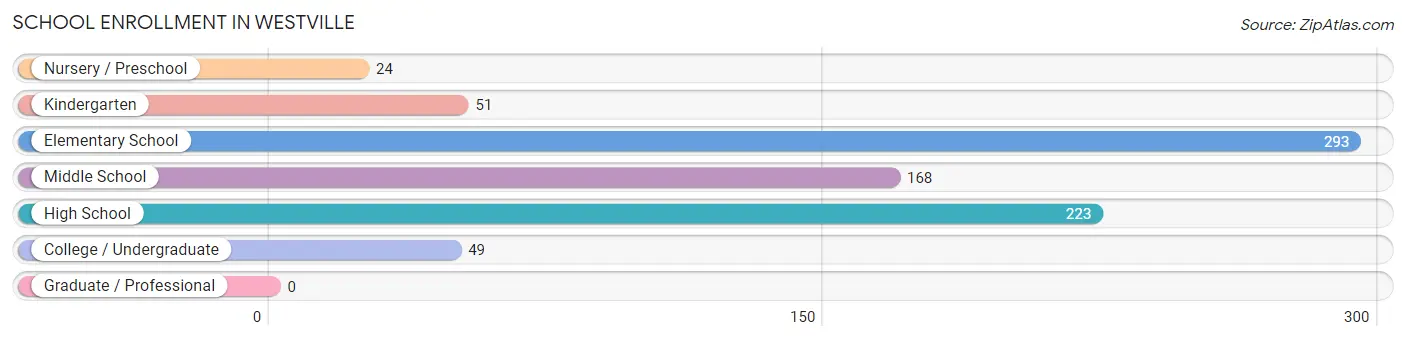
| School Level | # Students | % Students |
| Nursery / Preschool | 24 | 3.0% |
| Kindergarten | 51 | 6.3% |
| Elementary School | 293 | 36.3% |
| Middle School | 168 | 20.8% |
| High School | 223 | 27.6% |
| College / Undergraduate | 49 | 6.1% |
| Graduate / Professional | 0 | 0.0% |
| Total | 808 | 100.0% |
School Enrollment by Age by Funding Source in Westville
Out of a total of 808 students who are enrolled in schools in Westville, 3 (0.4%) attend a private institution, while the remaining 805 (99.6%) are enrolled in public schools. The age group of 20 to 24 year olds has the highest likelihood of being enrolled in private schools, with 3 (100.0% in the age bracket) enrolled. Conversely, the age group of 3 to 4 year olds has the lowest likelihood of being enrolled in a private school, with 24 (100.0% in the age bracket) attending a public institution.
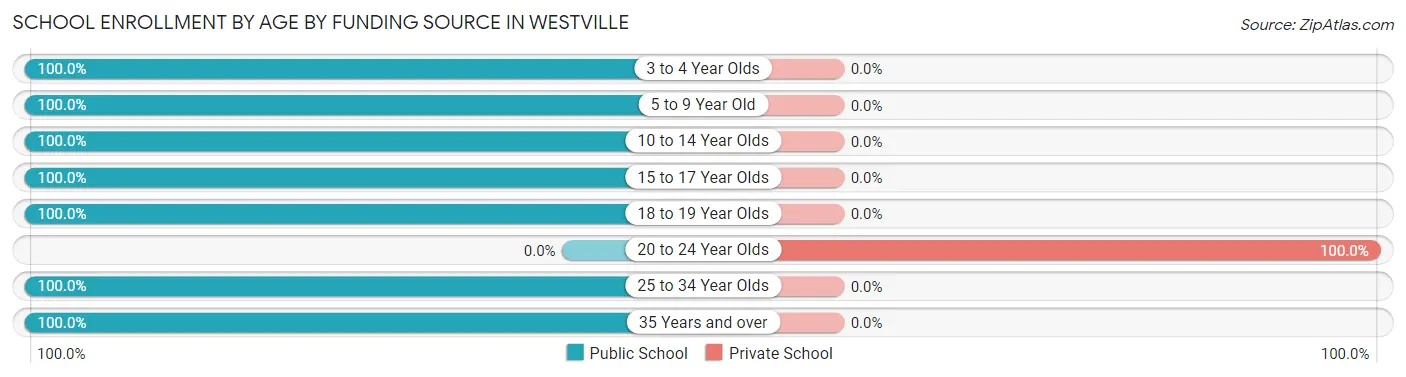
| Age Bracket | Public School | Private School |
| 3 to 4 Year Olds | 24 (100.0%) | 0 (0.0%) |
| 5 to 9 Year Old | 325 (100.0%) | 0 (0.0%) |
| 10 to 14 Year Olds | 235 (100.0%) | 0 (0.0%) |
| 15 to 17 Year Olds | 130 (100.0%) | 0 (0.0%) |
| 18 to 19 Year Olds | 45 (100.0%) | 0 (0.0%) |
| 20 to 24 Year Olds | 0 (0.0%) | 3 (100.0%) |
| 25 to 34 Year Olds | 40 (100.0%) | 0 (0.0%) |
| 35 Years and over | 6 (100.0%) | 0 (0.0%) |
| Total | 805 (99.6%) | 3 (0.4%) |
Educational Attainment by Field of Study in Westville
Education (117 | 30.0%), arts & humanities (55 | 14.1%), science & technology (47 | 12.0%), business (47 | 12.0%), and liberal arts & history (40 | 10.3%) are the most common fields of study among 390 individuals in Westville who have obtained a bachelor's degree or higher.
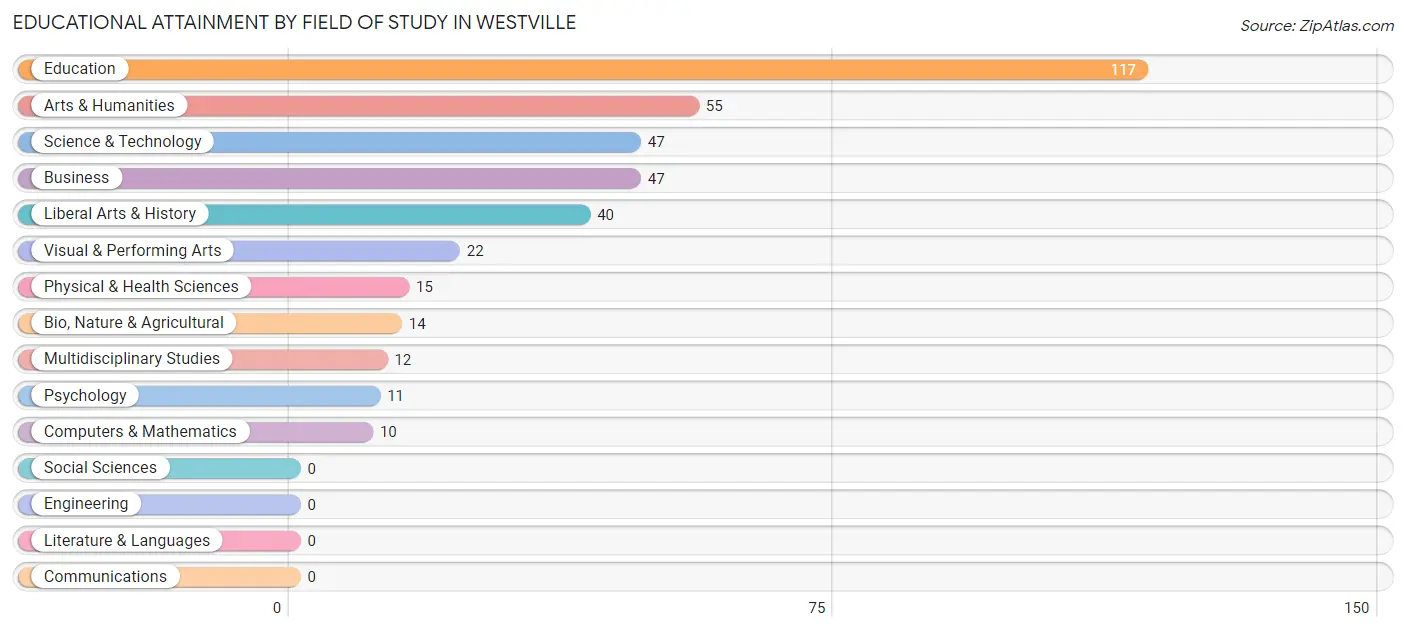
| Field of Study | # Graduates | % Graduates |
| Computers & Mathematics | 10 | 2.6% |
| Bio, Nature & Agricultural | 14 | 3.6% |
| Physical & Health Sciences | 15 | 3.8% |
| Psychology | 11 | 2.8% |
| Social Sciences | 0 | 0.0% |
| Engineering | 0 | 0.0% |
| Multidisciplinary Studies | 12 | 3.1% |
| Science & Technology | 47 | 12.0% |
| Business | 47 | 12.0% |
| Education | 117 | 30.0% |
| Literature & Languages | 0 | 0.0% |
| Liberal Arts & History | 40 | 10.3% |
| Visual & Performing Arts | 22 | 5.6% |
| Communications | 0 | 0.0% |
| Arts & Humanities | 55 | 14.1% |
| Total | 390 | 100.0% |
Transportation & Commute in Westville
Vehicle Availability by Sex in Westville
The most prevalent vehicle ownership categories in Westville are males with 2 vehicles (391, accounting for 53.6%) and females with 2 vehicles (393, making up 56.7%).
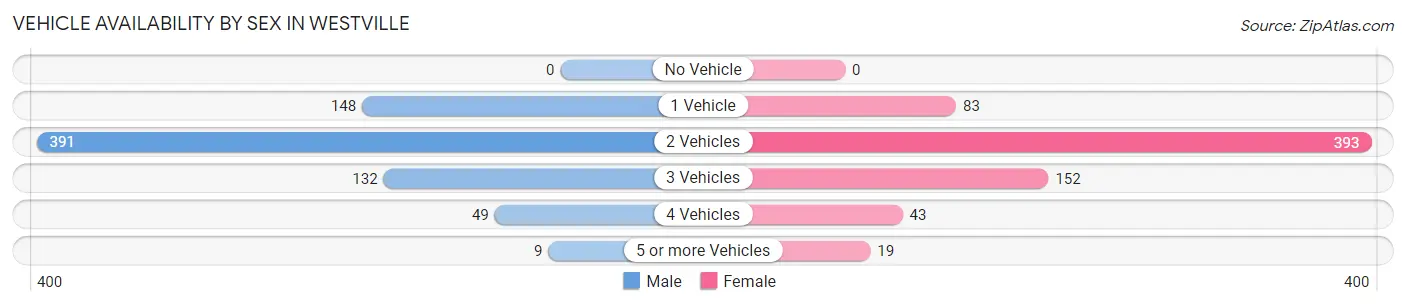
| Vehicles Available | Male | Female |
| No Vehicle | 0 (0.0%) | 0 (0.0%) |
| 1 Vehicle | 148 (20.3%) | 83 (12.0%) |
| 2 Vehicles | 391 (53.6%) | 393 (57.0%) |
| 3 Vehicles | 132 (18.1%) | 152 (22.0%) |
| 4 Vehicles | 49 (6.7%) | 43 (6.2%) |
| 5 or more Vehicles | 9 (1.2%) | 19 (2.8%) |
| Total | 729 (100.0%) | 690 (100.0%) |
Commute Time in Westville
The most frequently occuring commute durations in Westville are 15 to 19 minutes (523 commuters, 39.9%), 10 to 14 minutes (180 commuters, 13.7%), and 20 to 24 minutes (162 commuters, 12.4%).
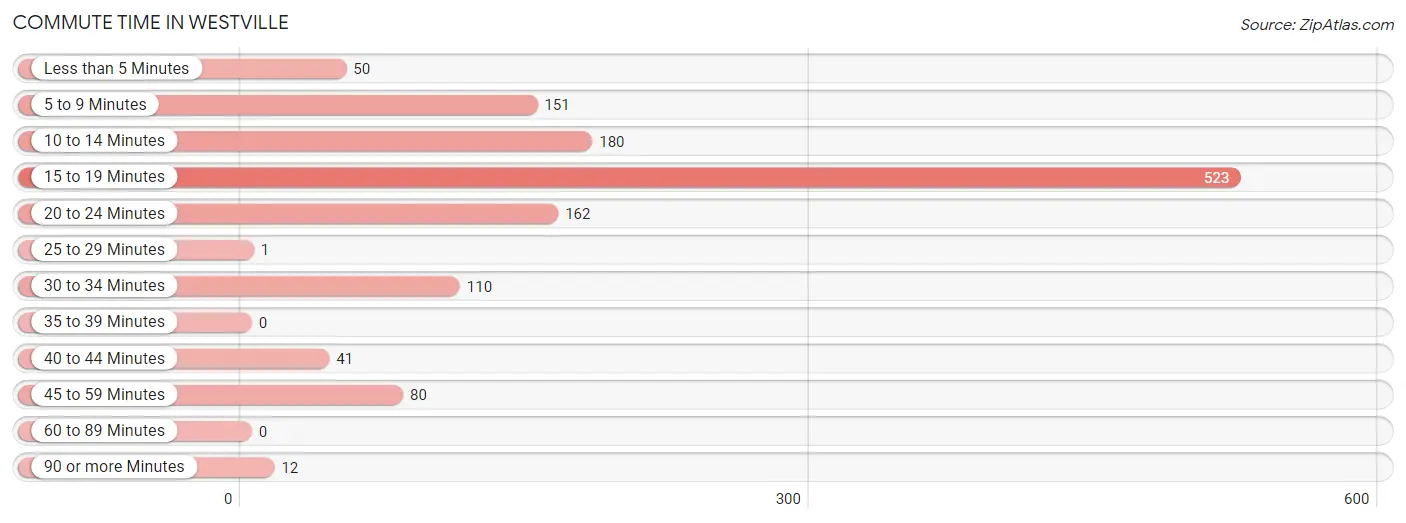
| Commute Time | # Commuters | % Commuters |
| Less than 5 Minutes | 50 | 3.8% |
| 5 to 9 Minutes | 151 | 11.5% |
| 10 to 14 Minutes | 180 | 13.7% |
| 15 to 19 Minutes | 523 | 39.9% |
| 20 to 24 Minutes | 162 | 12.4% |
| 25 to 29 Minutes | 1 | 0.1% |
| 30 to 34 Minutes | 110 | 8.4% |
| 35 to 39 Minutes | 0 | 0.0% |
| 40 to 44 Minutes | 41 | 3.1% |
| 45 to 59 Minutes | 80 | 6.1% |
| 60 to 89 Minutes | 0 | 0.0% |
| 90 or more Minutes | 12 | 0.9% |
Commute Time by Sex in Westville
The most common commute times in Westville are 15 to 19 minutes (240 commuters, 33.2%) for males and 15 to 19 minutes (283 commuters, 48.2%) for females.
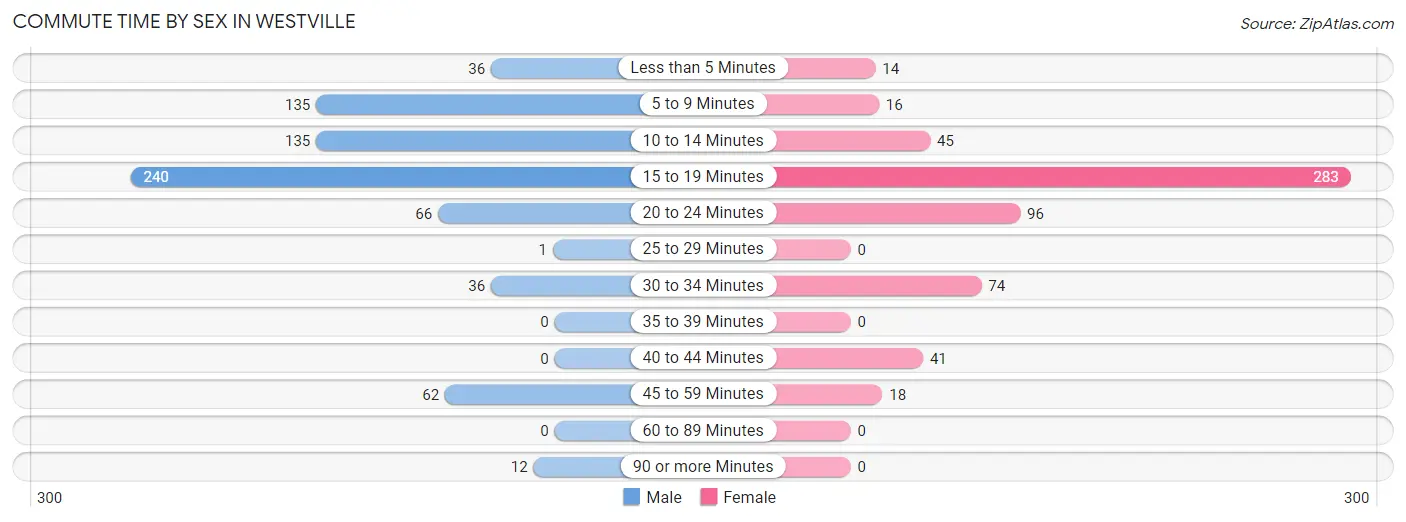
| Commute Time | Male | Female |
| Less than 5 Minutes | 36 (5.0%) | 14 (2.4%) |
| 5 to 9 Minutes | 135 (18.7%) | 16 (2.7%) |
| 10 to 14 Minutes | 135 (18.7%) | 45 (7.7%) |
| 15 to 19 Minutes | 240 (33.2%) | 283 (48.2%) |
| 20 to 24 Minutes | 66 (9.1%) | 96 (16.4%) |
| 25 to 29 Minutes | 1 (0.1%) | 0 (0.0%) |
| 30 to 34 Minutes | 36 (5.0%) | 74 (12.6%) |
| 35 to 39 Minutes | 0 (0.0%) | 0 (0.0%) |
| 40 to 44 Minutes | 0 (0.0%) | 41 (7.0%) |
| 45 to 59 Minutes | 62 (8.6%) | 18 (3.1%) |
| 60 to 89 Minutes | 0 (0.0%) | 0 (0.0%) |
| 90 or more Minutes | 12 (1.7%) | 0 (0.0%) |
Time of Departure to Work by Sex in Westville
The most frequent times of departure to work in Westville are 7:30 AM to 7:59 AM (118, 16.3%) for males and 7:00 AM to 7:29 AM (128, 21.8%) for females.
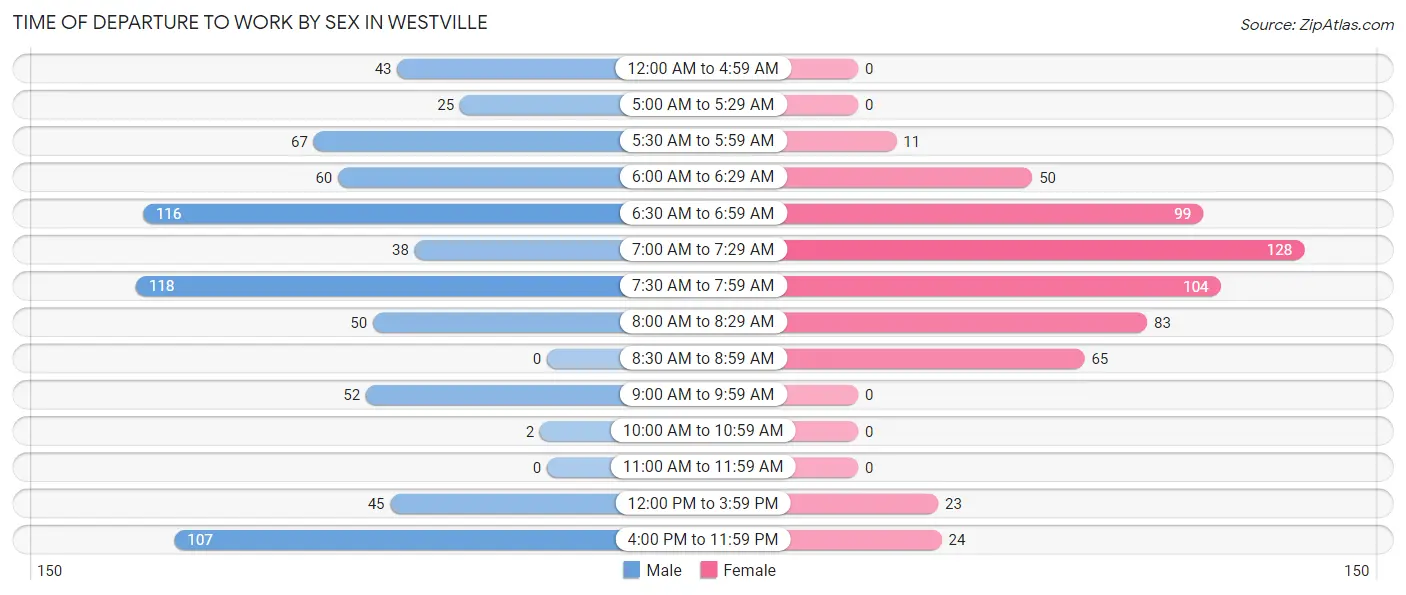
| Time of Departure | Male | Female |
| 12:00 AM to 4:59 AM | 43 (5.9%) | 0 (0.0%) |
| 5:00 AM to 5:29 AM | 25 (3.5%) | 0 (0.0%) |
| 5:30 AM to 5:59 AM | 67 (9.3%) | 11 (1.9%) |
| 6:00 AM to 6:29 AM | 60 (8.3%) | 50 (8.5%) |
| 6:30 AM to 6:59 AM | 116 (16.0%) | 99 (16.9%) |
| 7:00 AM to 7:29 AM | 38 (5.3%) | 128 (21.8%) |
| 7:30 AM to 7:59 AM | 118 (16.3%) | 104 (17.7%) |
| 8:00 AM to 8:29 AM | 50 (6.9%) | 83 (14.1%) |
| 8:30 AM to 8:59 AM | 0 (0.0%) | 65 (11.1%) |
| 9:00 AM to 9:59 AM | 52 (7.2%) | 0 (0.0%) |
| 10:00 AM to 10:59 AM | 2 (0.3%) | 0 (0.0%) |
| 11:00 AM to 11:59 AM | 0 (0.0%) | 0 (0.0%) |
| 12:00 PM to 3:59 PM | 45 (6.2%) | 23 (3.9%) |
| 4:00 PM to 11:59 PM | 107 (14.8%) | 24 (4.1%) |
| Total | 723 (100.0%) | 587 (100.0%) |
Housing Occupancy in Westville
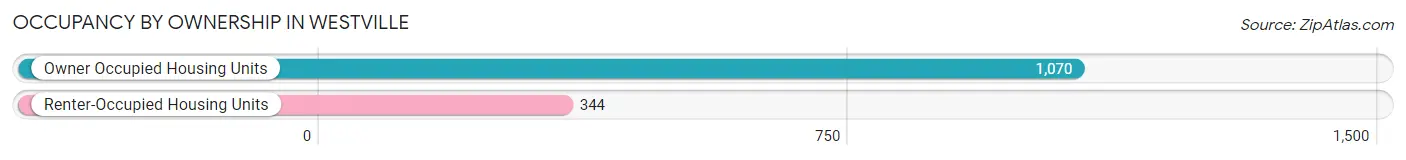
Occupancy by Ownership in Westville
Of the total 1,414 dwellings in Westville, owner-occupied units account for 1,070 (75.7%), while renter-occupied units make up 344 (24.3%).
| Occupancy | # Housing Units | % Housing Units |
| Owner Occupied Housing Units | 1,070 | 75.7% |
| Renter-Occupied Housing Units | 344 | 24.3% |
| Total Occupied Housing Units | 1,414 | 100.0% |
Occupancy by Household Size in Westville
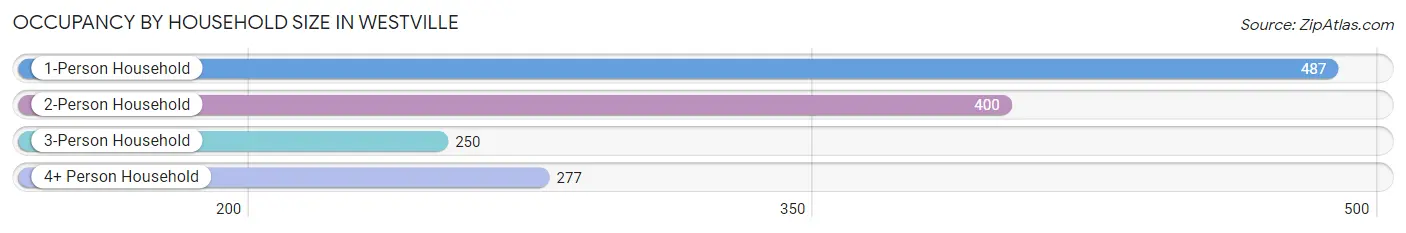
| Household Size | # Housing Units | % Housing Units |
| 1-Person Household | 487 | 34.4% |
| 2-Person Household | 400 | 28.3% |
| 3-Person Household | 250 | 17.7% |
| 4+ Person Household | 277 | 19.6% |
| Total Housing Units | 1,414 | 100.0% |
Occupancy by Ownership by Household Size in Westville
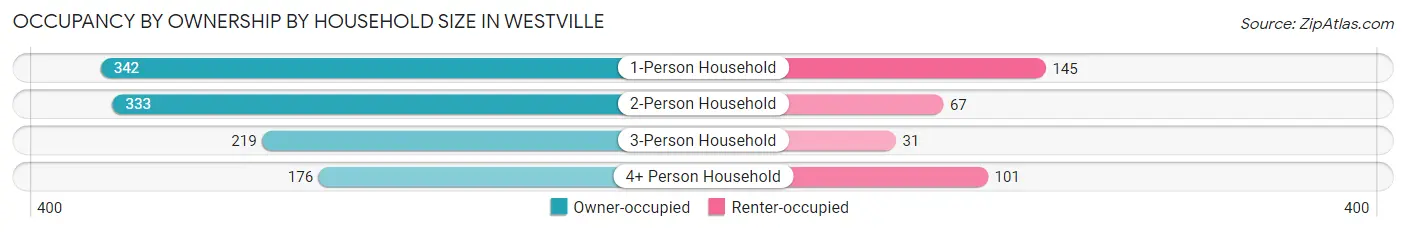
| Household Size | Owner-occupied | Renter-occupied |
| 1-Person Household | 342 (70.2%) | 145 (29.8%) |
| 2-Person Household | 333 (83.3%) | 67 (16.8%) |
| 3-Person Household | 219 (87.6%) | 31 (12.4%) |
| 4+ Person Household | 176 (63.5%) | 101 (36.5%) |
| Total Housing Units | 1,070 (75.7%) | 344 (24.3%) |
Occupancy by Educational Attainment in Westville
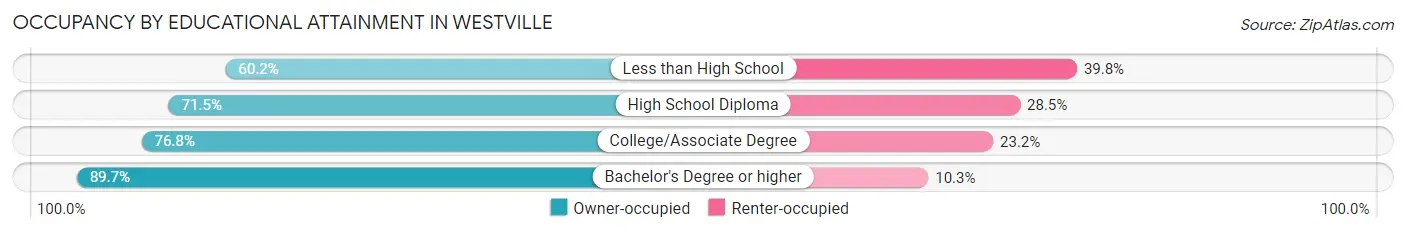
| Household Size | Owner-occupied | Renter-occupied |
| Less than High School | 65 (60.2%) | 43 (39.8%) |
| High School Diploma | 373 (71.5%) | 149 (28.5%) |
| College/Associate Degree | 424 (76.8%) | 128 (23.2%) |
| Bachelor's Degree or higher | 208 (89.7%) | 24 (10.3%) |
Occupancy by Age of Householder in Westville
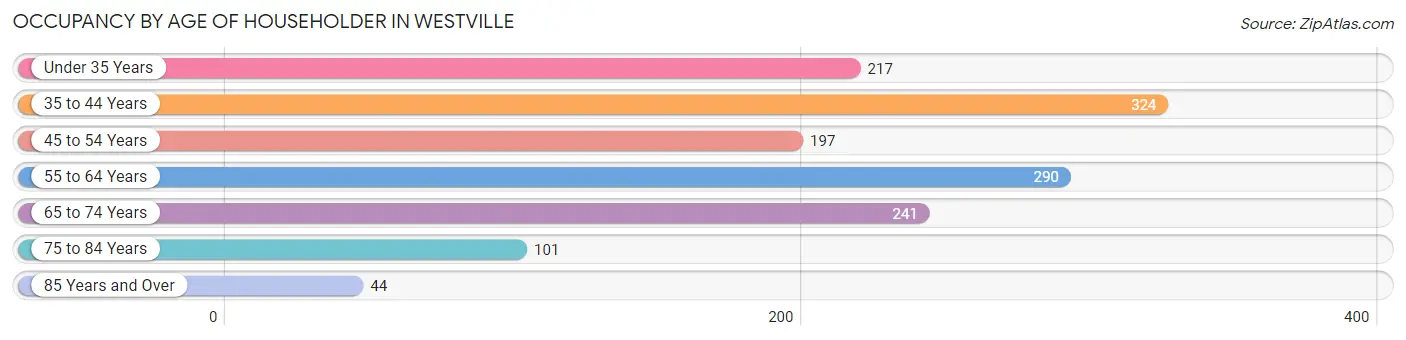
| Age Bracket | # Households | % Households |
| Under 35 Years | 217 | 15.3% |
| 35 to 44 Years | 324 | 22.9% |
| 45 to 54 Years | 197 | 13.9% |
| 55 to 64 Years | 290 | 20.5% |
| 65 to 74 Years | 241 | 17.0% |
| 75 to 84 Years | 101 | 7.1% |
| 85 Years and Over | 44 | 3.1% |
| Total | 1,414 | 100.0% |
Housing Finances in Westville
Median Income by Occupancy in Westville
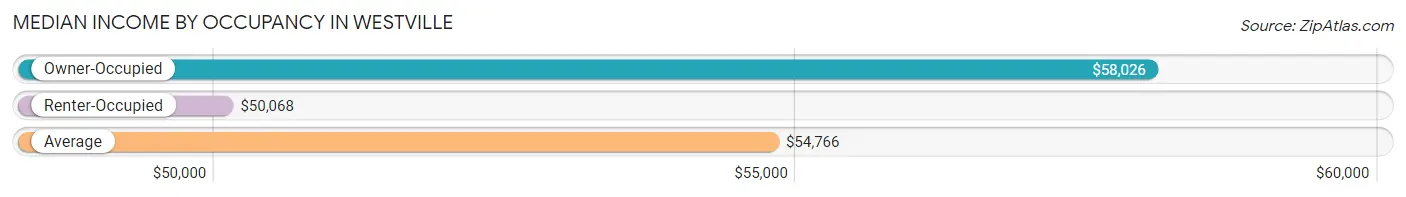
| Occupancy Type | # Households | Median Income |
| Owner-Occupied | 1,070 (75.7%) | $58,026 |
| Renter-Occupied | 344 (24.3%) | $50,068 |
| Average | 1,414 (100.0%) | $54,766 |
Occupancy by Householder Income Bracket in Westville
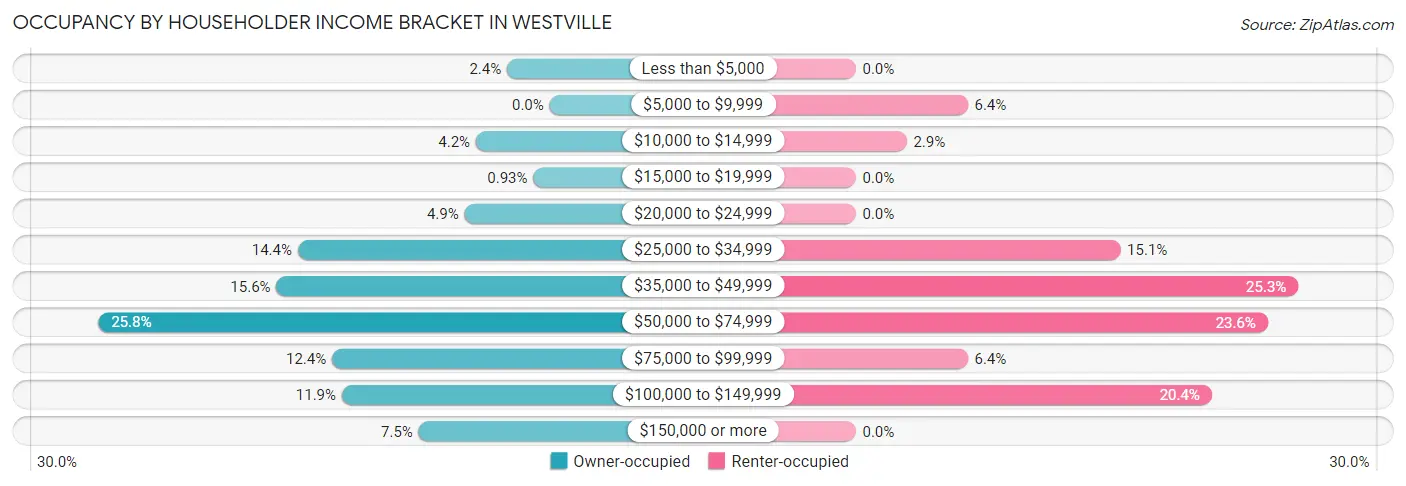
| Income Bracket | Owner-occupied | Renter-occupied |
| Less than $5,000 | 26 (2.4%) | 0 (0.0%) |
| $5,000 to $9,999 | 0 (0.0%) | 22 (6.4%) |
| $10,000 to $14,999 | 45 (4.2%) | 10 (2.9%) |
| $15,000 to $19,999 | 10 (0.9%) | 0 (0.0%) |
| $20,000 to $24,999 | 52 (4.9%) | 0 (0.0%) |
| $25,000 to $34,999 | 154 (14.4%) | 52 (15.1%) |
| $35,000 to $49,999 | 167 (15.6%) | 87 (25.3%) |
| $50,000 to $74,999 | 276 (25.8%) | 81 (23.5%) |
| $75,000 to $99,999 | 133 (12.4%) | 22 (6.4%) |
| $100,000 to $149,999 | 127 (11.9%) | 70 (20.3%) |
| $150,000 or more | 80 (7.5%) | 0 (0.0%) |
| Total | 1,070 (100.0%) | 344 (100.0%) |
Monthly Housing Cost Tiers in Westville
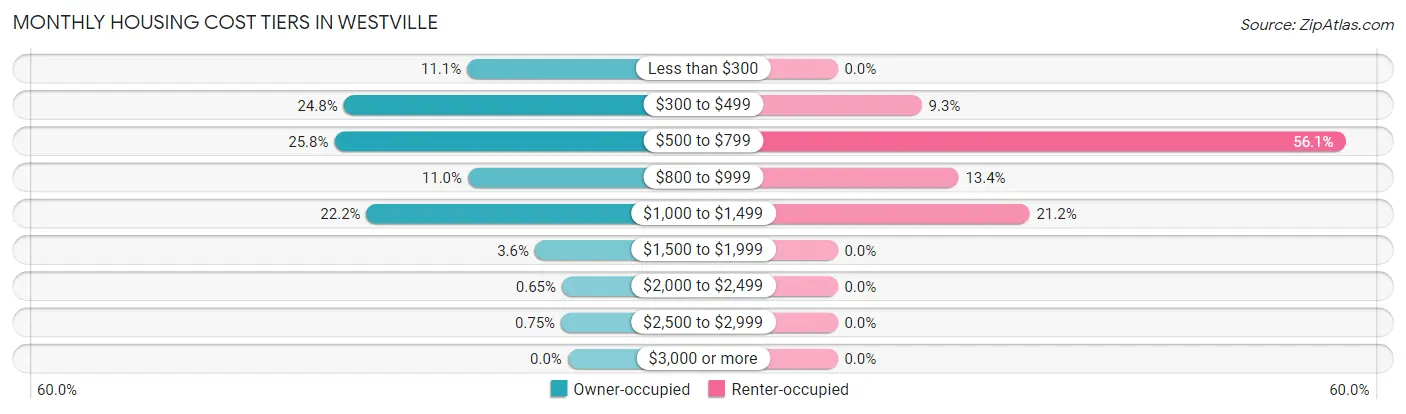
| Monthly Cost | Owner-occupied | Renter-occupied |
| Less than $300 | 119 (11.1%) | 0 (0.0%) |
| $300 to $499 | 265 (24.8%) | 32 (9.3%) |
| $500 to $799 | 276 (25.8%) | 193 (56.1%) |
| $800 to $999 | 118 (11.0%) | 46 (13.4%) |
| $1,000 to $1,499 | 238 (22.2%) | 73 (21.2%) |
| $1,500 to $1,999 | 39 (3.6%) | 0 (0.0%) |
| $2,000 to $2,499 | 7 (0.6%) | 0 (0.0%) |
| $2,500 to $2,999 | 8 (0.7%) | 0 (0.0%) |
| $3,000 or more | 0 (0.0%) | 0 (0.0%) |
| Total | 1,070 (100.0%) | 344 (100.0%) |
Physical Housing Characteristics in Westville
Housing Structures in Westville
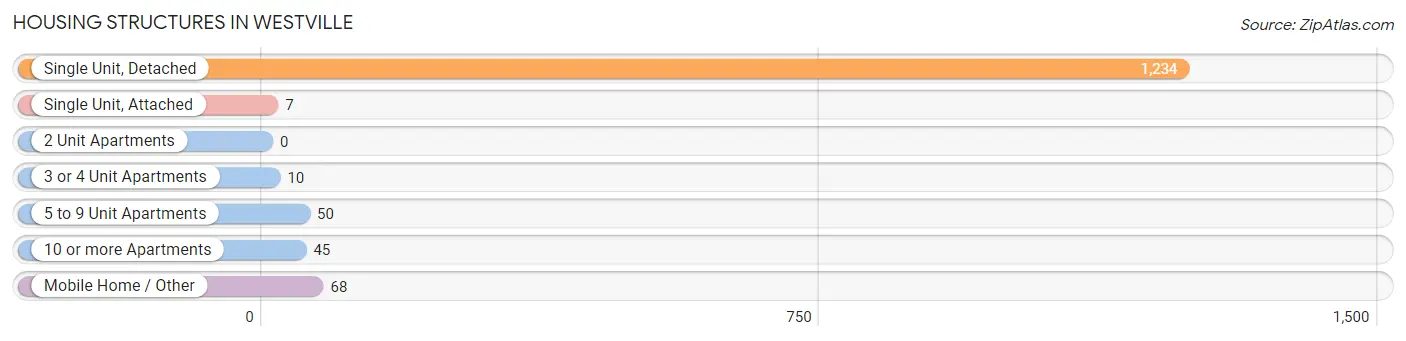
| Structure Type | # Housing Units | % Housing Units |
| Single Unit, Detached | 1,234 | 87.3% |
| Single Unit, Attached | 7 | 0.5% |
| 2 Unit Apartments | 0 | 0.0% |
| 3 or 4 Unit Apartments | 10 | 0.7% |
| 5 to 9 Unit Apartments | 50 | 3.5% |
| 10 or more Apartments | 45 | 3.2% |
| Mobile Home / Other | 68 | 4.8% |
| Total | 1,414 | 100.0% |
Housing Structures by Occupancy in Westville
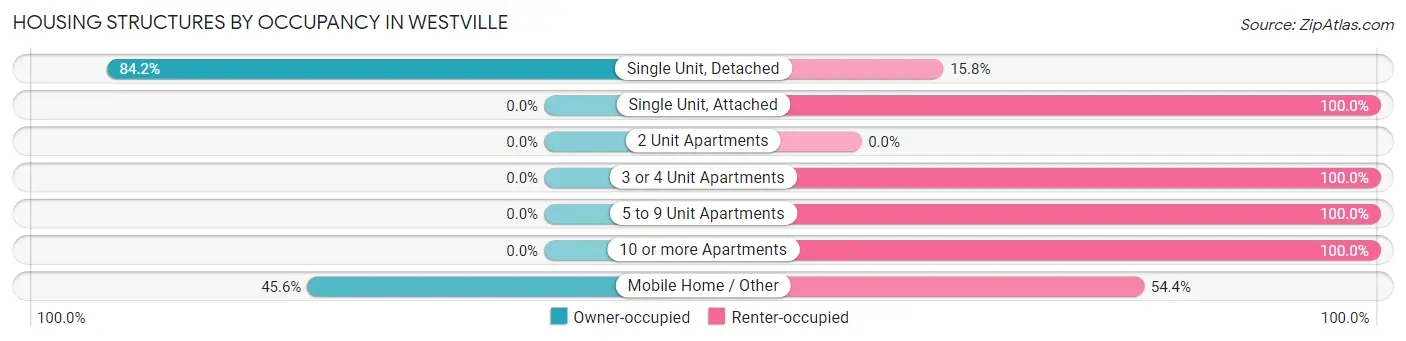
| Structure Type | Owner-occupied | Renter-occupied |
| Single Unit, Detached | 1,039 (84.2%) | 195 (15.8%) |
| Single Unit, Attached | 0 (0.0%) | 7 (100.0%) |
| 2 Unit Apartments | 0 (0.0%) | 0 (0.0%) |
| 3 or 4 Unit Apartments | 0 (0.0%) | 10 (100.0%) |
| 5 to 9 Unit Apartments | 0 (0.0%) | 50 (100.0%) |
| 10 or more Apartments | 0 (0.0%) | 45 (100.0%) |
| Mobile Home / Other | 31 (45.6%) | 37 (54.4%) |
| Total | 1,070 (75.7%) | 344 (24.3%) |
Housing Structures by Number of Rooms in Westville
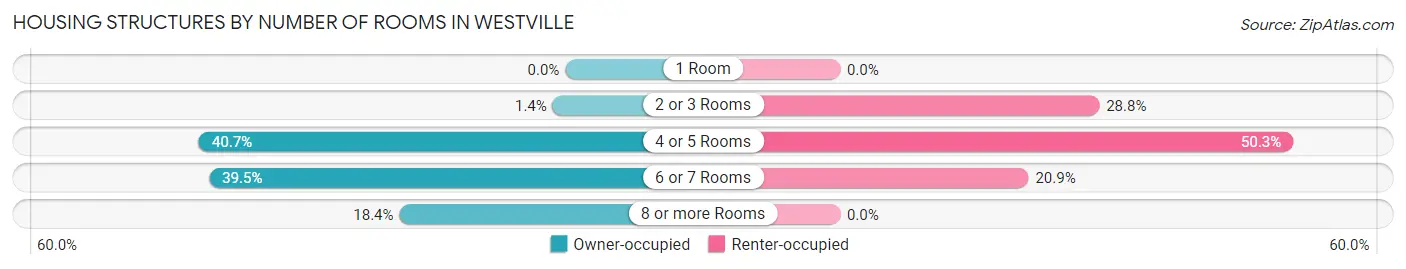
| Number of Rooms | Owner-occupied | Renter-occupied |
| 1 Room | 0 (0.0%) | 0 (0.0%) |
| 2 or 3 Rooms | 15 (1.4%) | 99 (28.8%) |
| 4 or 5 Rooms | 435 (40.6%) | 173 (50.3%) |
| 6 or 7 Rooms | 423 (39.5%) | 72 (20.9%) |
| 8 or more Rooms | 197 (18.4%) | 0 (0.0%) |
| Total | 1,070 (100.0%) | 344 (100.0%) |
Housing Structure by Heating Type in Westville
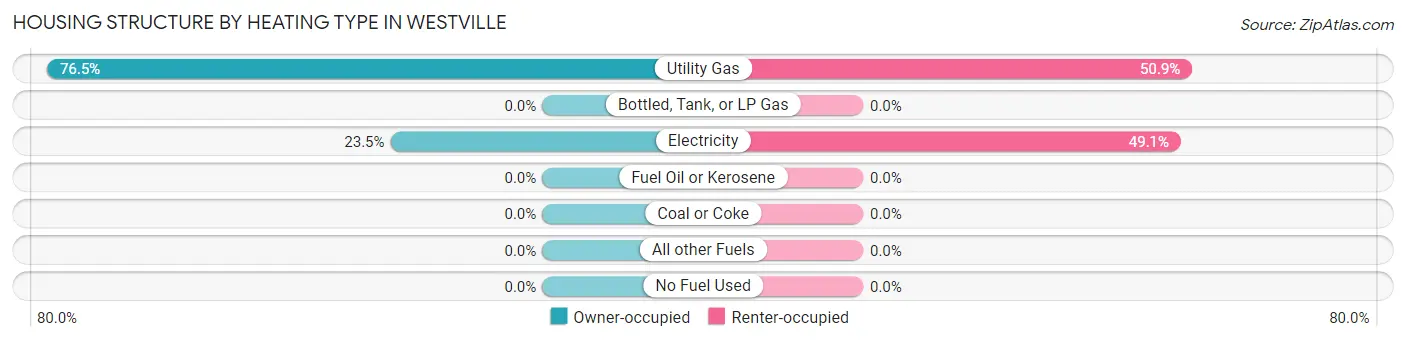
| Heating Type | Owner-occupied | Renter-occupied |
| Utility Gas | 819 (76.5%) | 175 (50.9%) |
| Bottled, Tank, or LP Gas | 0 (0.0%) | 0 (0.0%) |
| Electricity | 251 (23.5%) | 169 (49.1%) |
| Fuel Oil or Kerosene | 0 (0.0%) | 0 (0.0%) |
| Coal or Coke | 0 (0.0%) | 0 (0.0%) |
| All other Fuels | 0 (0.0%) | 0 (0.0%) |
| No Fuel Used | 0 (0.0%) | 0 (0.0%) |
| Total | 1,070 (100.0%) | 344 (100.0%) |
Household Vehicle Usage in Westville
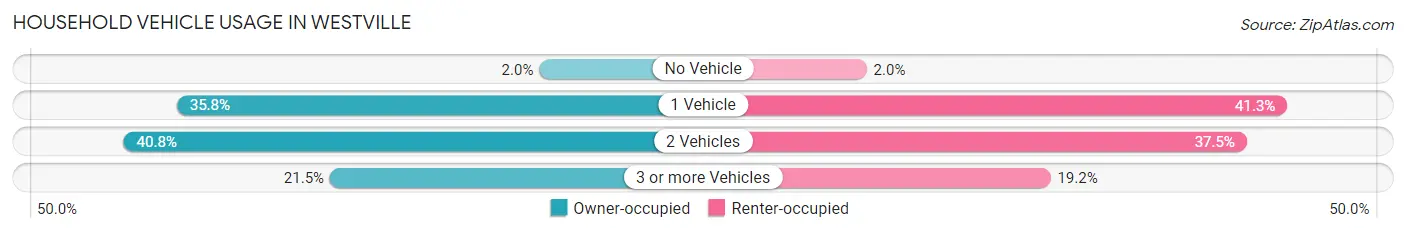
| Vehicles per Household | Owner-occupied | Renter-occupied |
| No Vehicle | 21 (2.0%) | 7 (2.0%) |
| 1 Vehicle | 383 (35.8%) | 142 (41.3%) |
| 2 Vehicles | 436 (40.7%) | 129 (37.5%) |
| 3 or more Vehicles | 230 (21.5%) | 66 (19.2%) |
| Total | 1,070 (100.0%) | 344 (100.0%) |
Real Estate & Mortgages in Westville
Real Estate and Mortgage Overview in Westville
| Characteristic | Without Mortgage | With Mortgage |
| Housing Units | 566 | 504 |
| Median Property Value | $78,900 | $112,100 |
| Median Household Income | $42,250 | $76 |
| Monthly Housing Costs | $399 | $0 |
| Real Estate Taxes | $1,573 | $12 |
Property Value by Mortgage Status in Westville
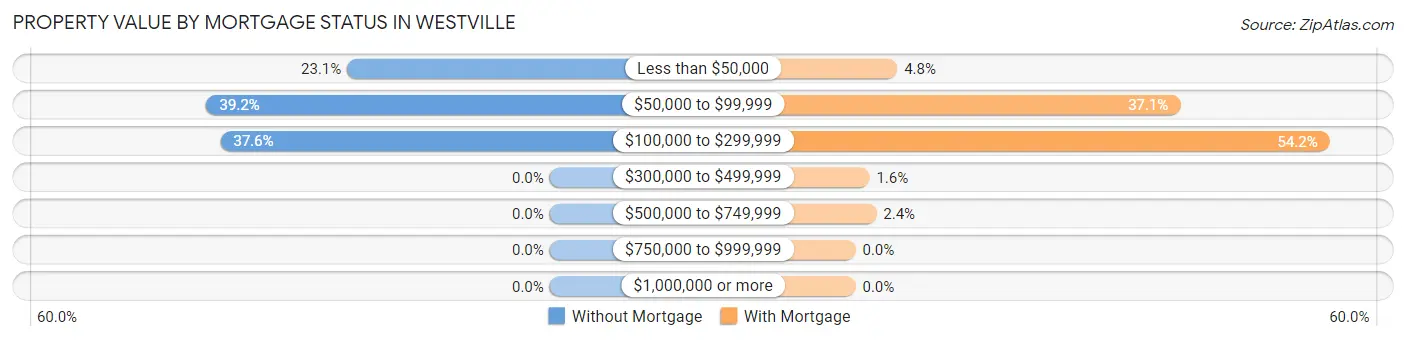
| Property Value | Without Mortgage | With Mortgage |
| Less than $50,000 | 131 (23.1%) | 24 (4.8%) |
| $50,000 to $99,999 | 222 (39.2%) | 187 (37.1%) |
| $100,000 to $299,999 | 213 (37.6%) | 273 (54.2%) |
| $300,000 to $499,999 | 0 (0.0%) | 8 (1.6%) |
| $500,000 to $749,999 | 0 (0.0%) | 12 (2.4%) |
| $750,000 to $999,999 | 0 (0.0%) | 0 (0.0%) |
| $1,000,000 or more | 0 (0.0%) | 0 (0.0%) |
| Total | 566 (100.0%) | 504 (100.0%) |
Household Income by Mortgage Status in Westville
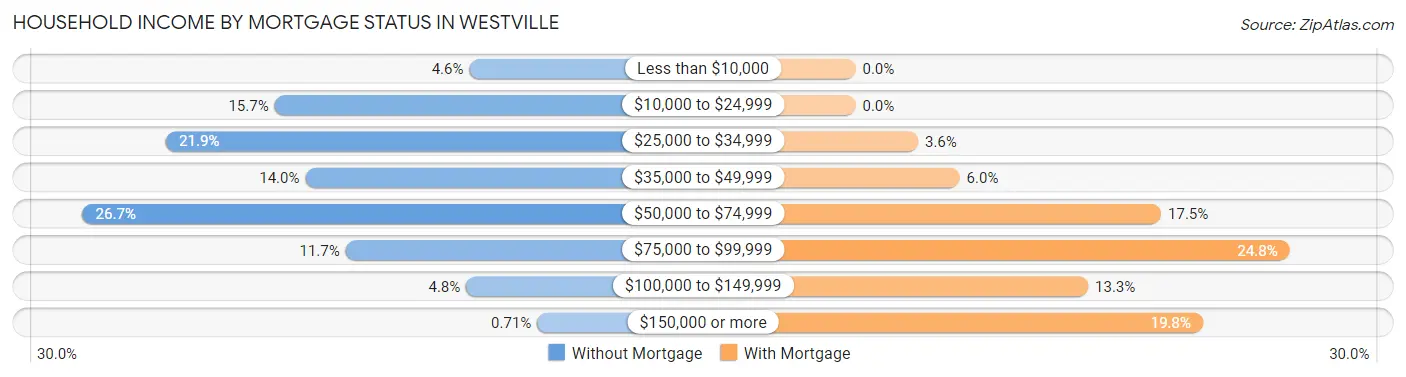
| Household Income | Without Mortgage | With Mortgage |
| Less than $10,000 | 26 (4.6%) | 0 (0.0%) |
| $10,000 to $24,999 | 89 (15.7%) | 0 (0.0%) |
| $25,000 to $34,999 | 124 (21.9%) | 18 (3.6%) |
| $35,000 to $49,999 | 79 (14.0%) | 30 (5.9%) |
| $50,000 to $74,999 | 151 (26.7%) | 88 (17.5%) |
| $75,000 to $99,999 | 66 (11.7%) | 125 (24.8%) |
| $100,000 to $149,999 | 27 (4.8%) | 67 (13.3%) |
| $150,000 or more | 4 (0.7%) | 100 (19.8%) |
| Total | 566 (100.0%) | 504 (100.0%) |
Property Value to Household Income Ratio in Westville
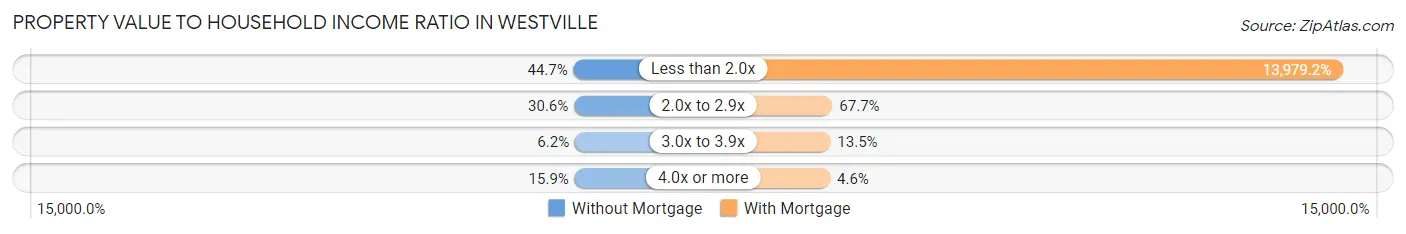
| Value-to-Income Ratio | Without Mortgage | With Mortgage |
| Less than 2.0x | 253 (44.7%) | 70,455 (13,979.2%) |
| 2.0x to 2.9x | 173 (30.6%) | 341 (67.7%) |
| 3.0x to 3.9x | 35 (6.2%) | 68 (13.5%) |
| 4.0x or more | 90 (15.9%) | 23 (4.6%) |
| Total | 566 (100.0%) | 504 (100.0%) |
Real Estate Taxes by Mortgage Status in Westville
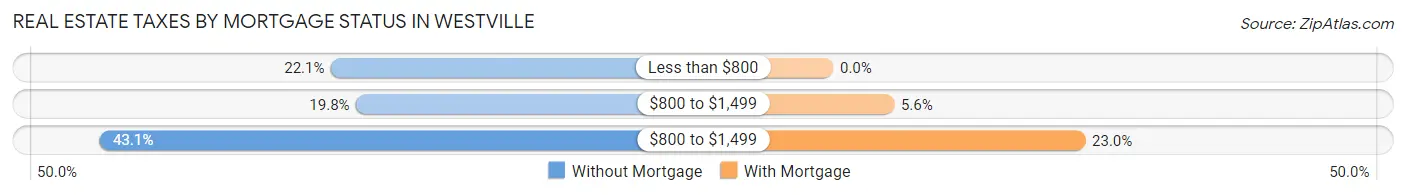
| Property Taxes | Without Mortgage | With Mortgage |
| Less than $800 | 125 (22.1%) | 0 (0.0%) |
| $800 to $1,499 | 112 (19.8%) | 28 (5.6%) |
| $800 to $1,499 | 244 (43.1%) | 116 (23.0%) |
| Total | 566 (100.0%) | 504 (100.0%) |
Health & Disability in Westville
Health Insurance Coverage by Age in Westville
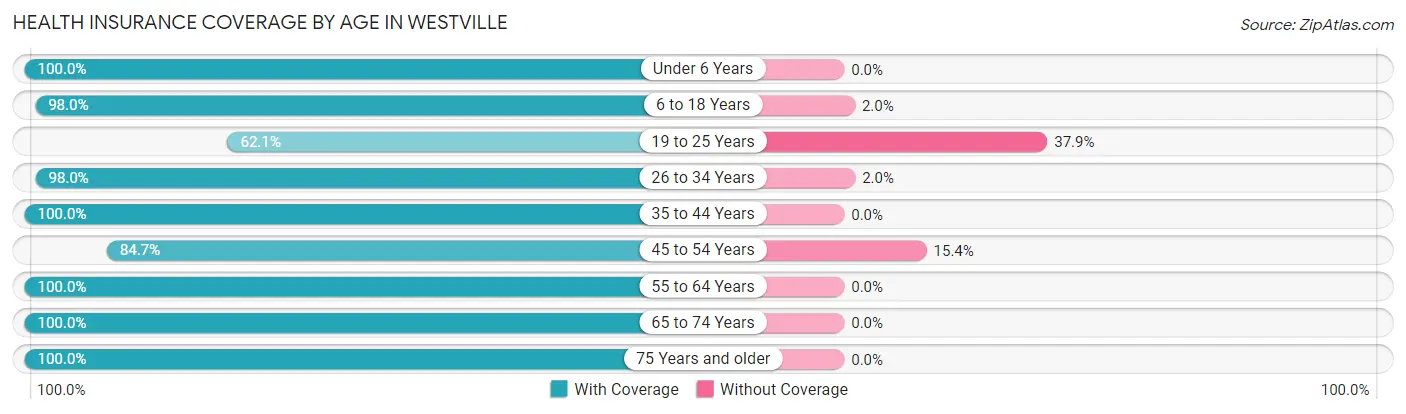
| Age Bracket | With Coverage | Without Coverage |
| Under 6 Years | 303 (100.0%) | 0 (0.0%) |
| 6 to 18 Years | 690 (98.0%) | 14 (2.0%) |
| 19 to 25 Years | 128 (62.1%) | 78 (37.9%) |
| 26 to 34 Years | 387 (98.0%) | 8 (2.0%) |
| 35 to 44 Years | 471 (100.0%) | 0 (0.0%) |
| 45 to 54 Years | 342 (84.7%) | 62 (15.3%) |
| 55 to 64 Years | 439 (100.0%) | 0 (0.0%) |
| 65 to 74 Years | 371 (100.0%) | 0 (0.0%) |
| 75 Years and older | 177 (100.0%) | 0 (0.0%) |
| Total | 3,308 (95.3%) | 162 (4.7%) |
Health Insurance Coverage by Citizenship Status in Westville
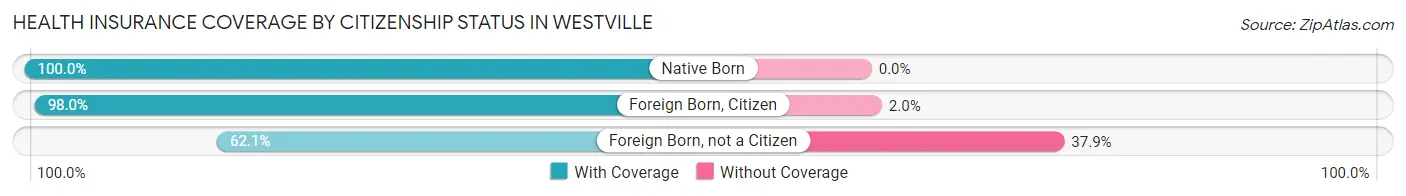
| Citizenship Status | With Coverage | Without Coverage |
| Native Born | 303 (100.0%) | 0 (0.0%) |
| Foreign Born, Citizen | 690 (98.0%) | 14 (2.0%) |
| Foreign Born, not a Citizen | 128 (62.1%) | 78 (37.9%) |
Health Insurance Coverage by Household Income in Westville
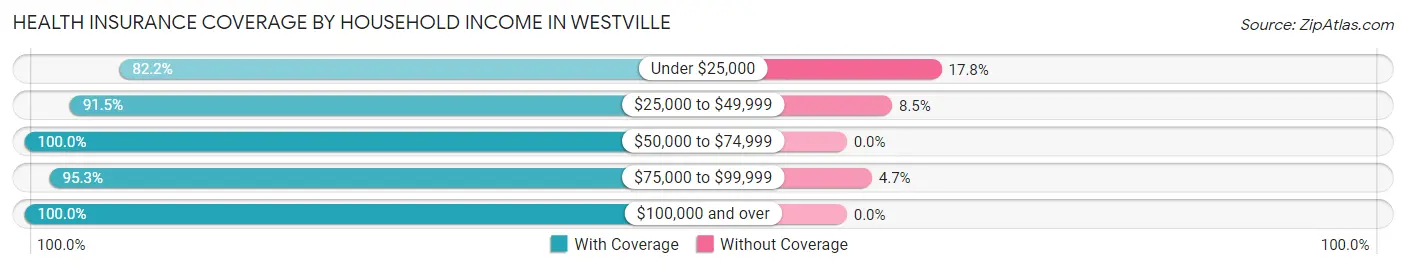
| Household Income | With Coverage | Without Coverage |
| Under $25,000 | 176 (82.2%) | 38 (17.8%) |
| $25,000 to $49,999 | 1,090 (91.5%) | 101 (8.5%) |
| $50,000 to $74,999 | 710 (100.0%) | 0 (0.0%) |
| $75,000 to $99,999 | 467 (95.3%) | 23 (4.7%) |
| $100,000 and over | 865 (100.0%) | 0 (0.0%) |
Public vs Private Health Insurance Coverage by Age in Westville
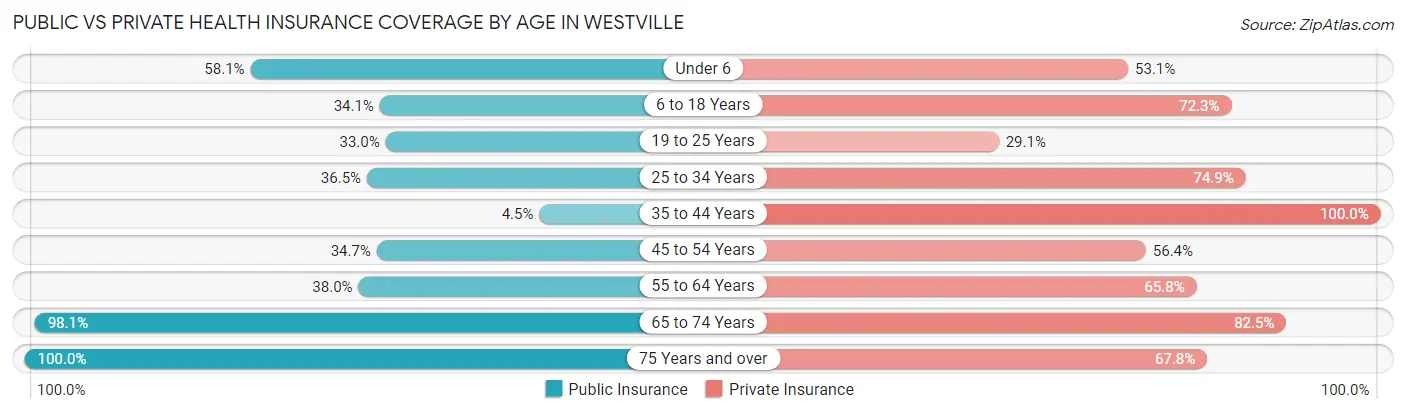
| Age Bracket | Public Insurance | Private Insurance |
| Under 6 | 176 (58.1%) | 161 (53.1%) |
| 6 to 18 Years | 240 (34.1%) | 509 (72.3%) |
| 19 to 25 Years | 68 (33.0%) | 60 (29.1%) |
| 25 to 34 Years | 144 (36.5%) | 296 (74.9%) |
| 35 to 44 Years | 21 (4.5%) | 471 (100.0%) |
| 45 to 54 Years | 140 (34.6%) | 228 (56.4%) |
| 55 to 64 Years | 167 (38.0%) | 289 (65.8%) |
| 65 to 74 Years | 364 (98.1%) | 306 (82.5%) |
| 75 Years and over | 177 (100.0%) | 120 (67.8%) |
| Total | 1,497 (43.1%) | 2,440 (70.3%) |
Disability Status by Sex by Age in Westville
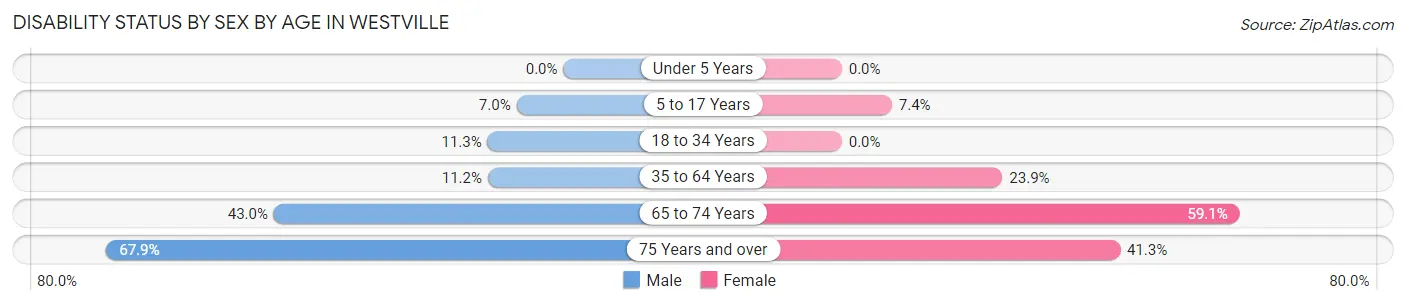
| Age Bracket | Male | Female |
| Under 5 Years | 0 (0.0%) | 0 (0.0%) |
| 5 to 17 Years | 19 (7.0%) | 31 (7.4%) |
| 18 to 34 Years | 36 (11.3%) | 0 (0.0%) |
| 35 to 64 Years | 67 (11.2%) | 171 (23.8%) |
| 65 to 74 Years | 86 (43.0%) | 101 (59.1%) |
| 75 Years and over | 38 (67.9%) | 50 (41.3%) |
Disability Class by Sex by Age in Westville
Disability Class: Hearing Difficulty
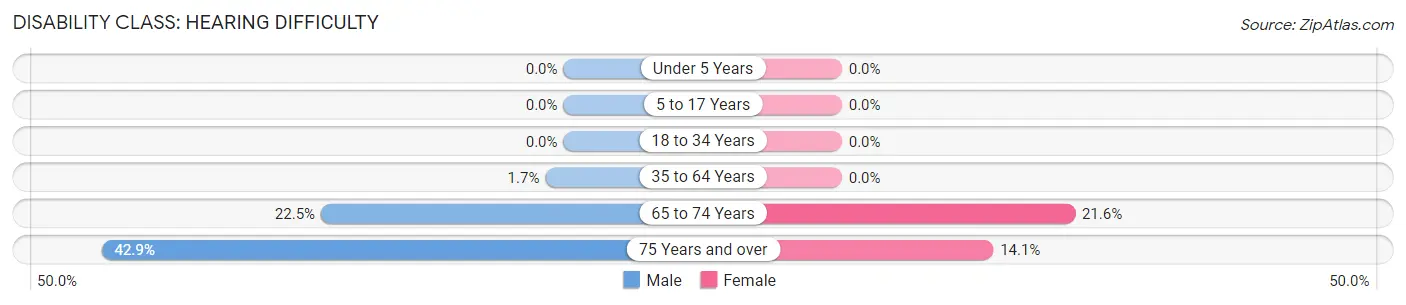
| Age Bracket | Male | Female |
| Under 5 Years | 0 (0.0%) | 0 (0.0%) |
| 5 to 17 Years | 0 (0.0%) | 0 (0.0%) |
| 18 to 34 Years | 0 (0.0%) | 0 (0.0%) |
| 35 to 64 Years | 10 (1.7%) | 0 (0.0%) |
| 65 to 74 Years | 45 (22.5%) | 37 (21.6%) |
| 75 Years and over | 24 (42.9%) | 17 (14.1%) |
Disability Class: Vision Difficulty
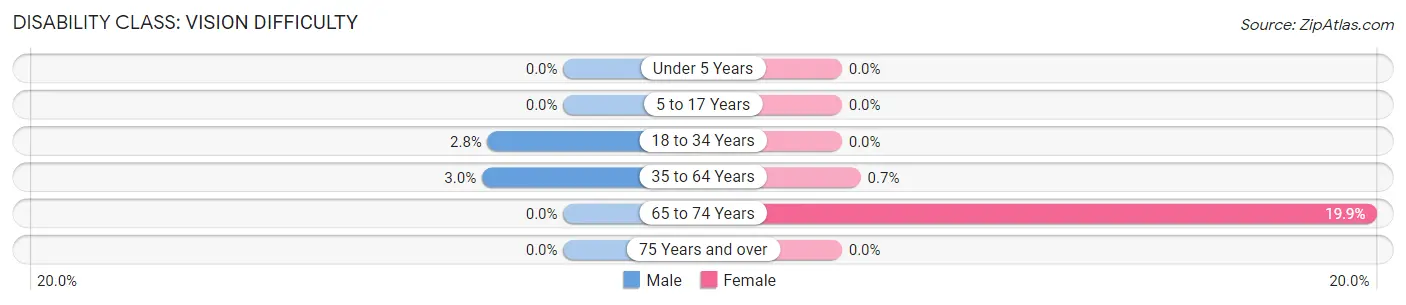
| Age Bracket | Male | Female |
| Under 5 Years | 0 (0.0%) | 0 (0.0%) |
| 5 to 17 Years | 0 (0.0%) | 0 (0.0%) |
| 18 to 34 Years | 9 (2.8%) | 0 (0.0%) |
| 35 to 64 Years | 18 (3.0%) | 5 (0.7%) |
| 65 to 74 Years | 0 (0.0%) | 34 (19.9%) |
| 75 Years and over | 0 (0.0%) | 0 (0.0%) |
Disability Class: Cognitive Difficulty
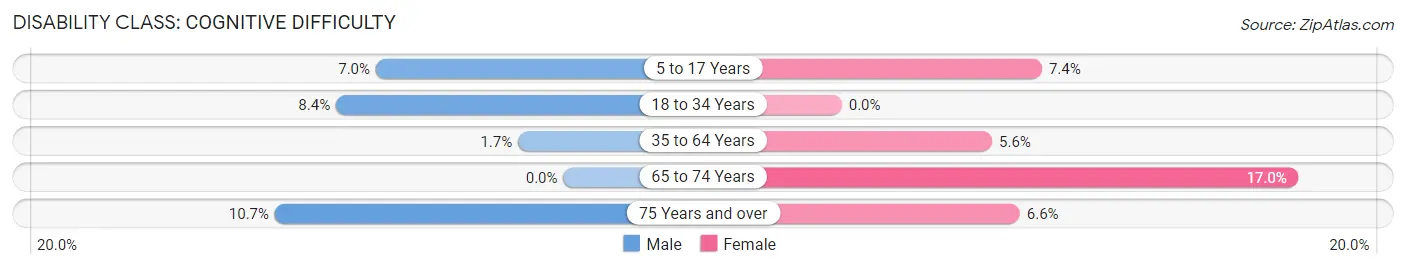
| Age Bracket | Male | Female |
| 5 to 17 Years | 19 (7.0%) | 31 (7.4%) |
| 18 to 34 Years | 27 (8.4%) | 0 (0.0%) |
| 35 to 64 Years | 10 (1.7%) | 40 (5.6%) |
| 65 to 74 Years | 0 (0.0%) | 29 (17.0%) |
| 75 Years and over | 6 (10.7%) | 8 (6.6%) |
Disability Class: Ambulatory Difficulty
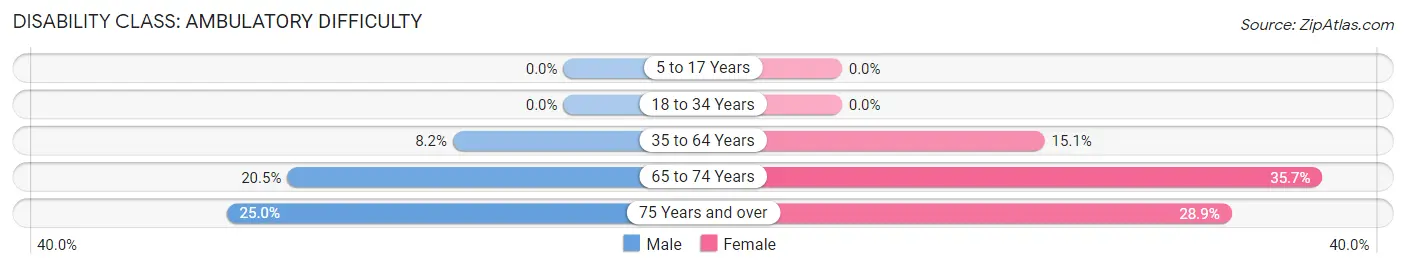
| Age Bracket | Male | Female |
| 5 to 17 Years | 0 (0.0%) | 0 (0.0%) |
| 18 to 34 Years | 0 (0.0%) | 0 (0.0%) |
| 35 to 64 Years | 49 (8.2%) | 108 (15.1%) |
| 65 to 74 Years | 41 (20.5%) | 61 (35.7%) |
| 75 Years and over | 14 (25.0%) | 35 (28.9%) |
Disability Class: Self-Care Difficulty
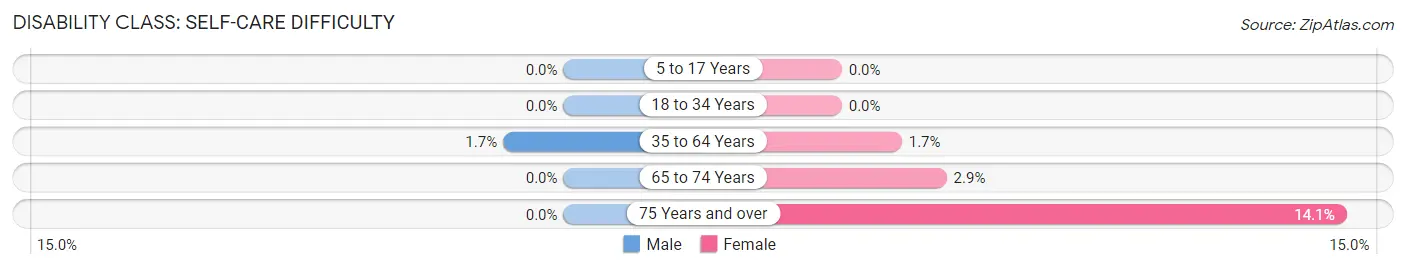
| Age Bracket | Male | Female |
| 5 to 17 Years | 0 (0.0%) | 0 (0.0%) |
| 18 to 34 Years | 0 (0.0%) | 0 (0.0%) |
| 35 to 64 Years | 10 (1.7%) | 12 (1.7%) |
| 65 to 74 Years | 0 (0.0%) | 5 (2.9%) |
| 75 Years and over | 0 (0.0%) | 17 (14.1%) |
Technology Access in Westville
Computing Device Access in Westville
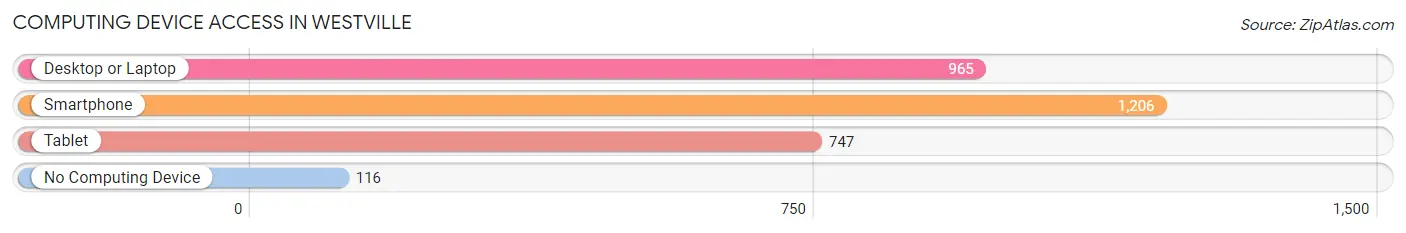
| Device Type | # Households | % Households |
| Desktop or Laptop | 965 | 68.2% |
| Smartphone | 1,206 | 85.3% |
| Tablet | 747 | 52.8% |
| No Computing Device | 116 | 8.2% |
| Total | 1,414 | 100.0% |
Internet Access in Westville
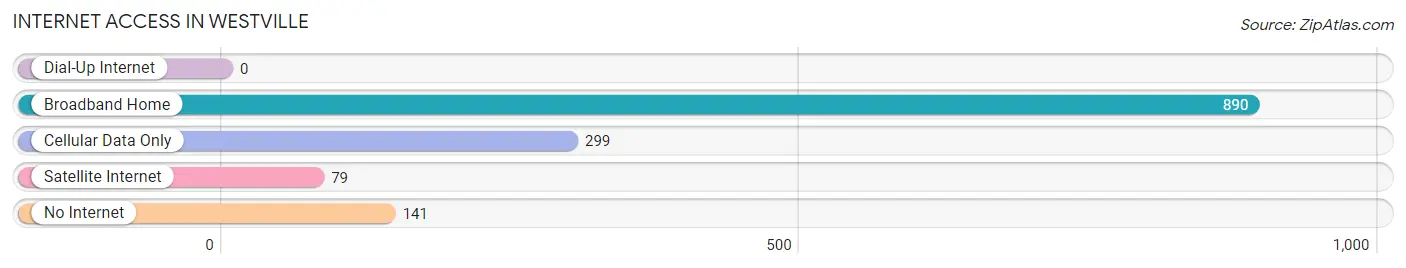
| Internet Type | # Households | % Households |
| Dial-Up Internet | 0 | 0.0% |
| Broadband Home | 890 | 62.9% |
| Cellular Data Only | 299 | 21.1% |
| Satellite Internet | 79 | 5.6% |
| No Internet | 141 | 10.0% |
| Total | 1,414 | 100.0% |
Westville Summary
History
The small town of Westville, Illinois is located in Vermilion County, about 20 miles south of Champaign-Urbana. The town was founded in 1854 by a group of settlers from Ohio, led by William West. The town was originally called West’s Point, but was later changed to Westville. The town was officially incorporated in 1858.
Westville was a small farming community for many years, but in the early 1900s, the town began to grow and develop. The first bank was established in 1906, and the first newspaper, the Westville News, was published in 1908. The town also had a number of small businesses, including a grocery store, a hardware store, and a blacksmith shop.
In the 1920s, Westville experienced a period of growth and prosperity. The town was home to a number of factories, including a canning factory, a brickyard, and a furniture factory. The town also had a number of churches, including the First Baptist Church, the First Methodist Church, and the First Presbyterian Church.
In the 1950s, Westville began to decline. The factories closed, and many of the businesses moved away. The population of the town began to decline, and by the 1970s, the town was in a state of decline.
Geography
Westville is located in Vermilion County, in the east-central part of the state of Illinois. The town is situated on the banks of the Vermilion River, about 20 miles south of Champaign-Urbana. The town is surrounded by farmland, and is located near the cities of Danville and Hoopeston.
The town has a total area of 1.2 square miles, all of which is land. The town has a humid continental climate, with hot, humid summers and cold, snowy winters. The average annual temperature is around 50 degrees Fahrenheit.
Economy
Westville’s economy is largely based on agriculture. The town is home to a number of farms, which produce corn, soybeans, and other crops. The town also has a number of small businesses, including a grocery store, a hardware store, and a few restaurants.
The town is also home to a number of manufacturing companies, including a canning factory, a brickyard, and a furniture factory. The town also has a number of churches, which provide employment for local residents.
Demographics
As of the 2010 census, Westville had a population of 1,845. The racial makeup of the town was 97.3% White, 0.7% African American, 0.2% Native American, 0.2% Asian, 0.1% Pacific Islander, 0.7% from other races, and 0.9% from two or more races. Hispanic or Latino of any race were 1.7% of the population.
The median household income in Westville was $41,250, and the median family income was $50,000. The per capita income for the town was $19,845. About 11.2% of families and 14.2% of the population were below the poverty line, including 18.2% of those under age 18 and 8.3% of those age 65 or over.
Common Questions
What is Per Capita Income in Westville?
Per Capita income in Westville is $27,623.
What is the Median Family Income in Westville?
Median Family Income in Westville is $67,961.
What is the Median Household income in Westville?
Median Household Income in Westville is $54,766.
What is Income or Wage Gap in Westville?
Income or Wage Gap in Westville is 38.9%.
Women in Westville earn 61.1 cents for every dollar earned by a man.
What is Inequality or Gini Index in Westville?
Inequality or Gini Index in Westville is 0.36.
What is the Total Population of Westville?
Total Population of Westville is 3,470.
What is the Total Male Population of Westville?
Total Male Population of Westville is 1,580.
What is the Total Female Population of Westville?
Total Female Population of Westville is 1,890.
What is the Ratio of Males per 100 Females in Westville?
There are 83.60 Males per 100 Females in Westville.
What is the Ratio of Females per 100 Males in Westville?
There are 119.62 Females per 100 Males in Westville.
What is the Median Population Age in Westville?
Median Population Age in Westville is 37.2 Years.
What is the Average Family Size in Westville
Average Family Size in Westville is 3.1 People.
What is the Average Household Size in Westville
Average Household Size in Westville is 2.5 People.
How Large is the Labor Force in Westville?
There are 1,526 People in the Labor Forcein in Westville.
What is the Percentage of People in the Labor Force in Westville?
58.7% of People are in the Labor Force in Westville.
What is the Unemployment Rate in Westville?
Unemployment Rate in Westville is 4.0%.