Zip Codes with the Highest Percentage of Households with Income Below $10,000 in Manchester, CT
RELATED REPORTS & OPTIONS
Household Income | $0-10k
Manchester
Compare Zip Codes
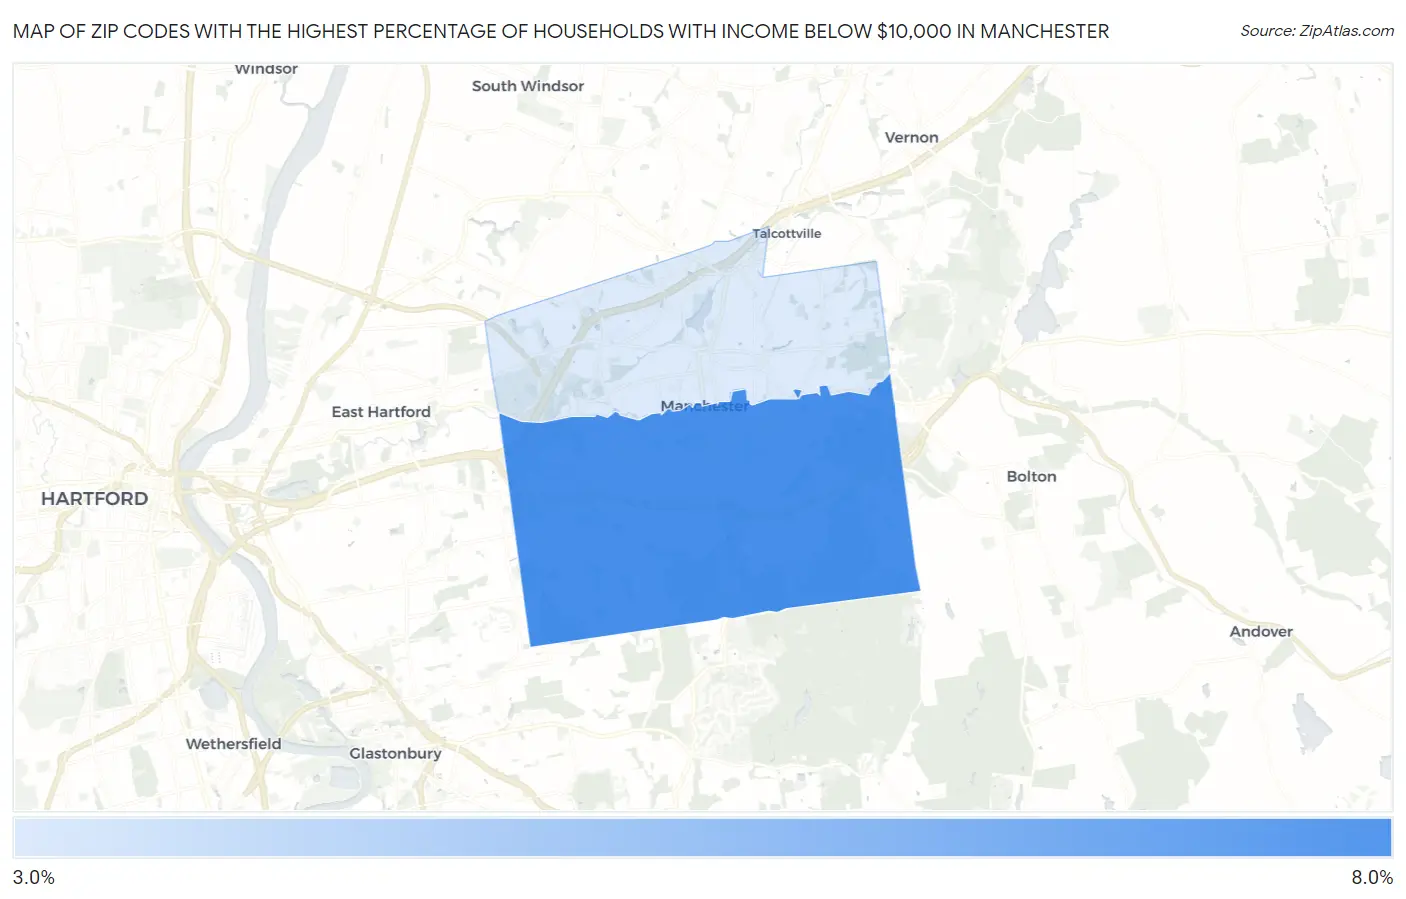
Map of Zip Codes with the Highest Percentage of Households with Income Below $10,000 in Manchester
3.7%
6.9%
Zip Codes with the Highest Percentage of Households with Income Below $10,000 in Manchester, CT
| Zip Code | Households with Income < $10k | vs State | vs National | |
| 1. | 06040 | 6.9% | 4.3%(+2.60)#38 | 4.9%(+2.00)#7,106 |
| 2. | 06042 | 3.7% | 4.3%(-0.600)#96 | 4.9%(-1.20)#16,455 |
1
Common Questions
What are the Top Zip Codes with the Highest Percentage of Households with Income Below $10,000 in Manchester, CT?
Top Zip Codes with the Highest Percentage of Households with Income Below $10,000 in Manchester, CT are:
What zip code has the Highest Percentage of Households with Income Below $10,000 in Manchester, CT?
06040 has the Highest Percentage of Households with Income Below $10,000 in Manchester, CT with 6.9%.
What is the Percentage of Households with Income Below $10,000 in Manchester, CT?
Percentage of Households with Income Below $10,000 in Manchester is 7.4%.
What is the Percentage of Households with Income Below $10,000 in Connecticut?
Percentage of Households with Income Below $10,000 in Connecticut is 4.3%.
What is the Percentage of Households with Income Below $10,000 in the United States?
Percentage of Households with Income Below $10,000 in the United States is 4.9%.